Embed Size (px)
Citation preview
Los Angeles County Economic Development Corporation The Kyser Center for Economic Research
L.A. Stats
Frequently requested statistics for Los Angeles
and surrounding counties on demographics,
employment, income, economic base,
real estate, sales and use taxes, and more.
June 2015
Los Angeles County Economic Development Corporation
©2015 Los Angeles County Economic Development Corporation 444 S. Flower Street, 37
th Floor., Los Angeles 90071
T: (213) 622-4300 | F: (213) 622-7100 | www.laedc.org
The LAEDC, the region's premier business leadership organization, is a private, non-profit 501(c)3
organization established in 1981.
The LAEDC provides economic development leadership to promote a globally competitive, prosperous and growing L.A. County economy to improve the health and well-being of our residents and communities and enable those residents to meet their basic need for a job.
Since 1996, the LAEDC has helped retain or attract more than 200,000 jobs, providing over $12 billion in
direct economic impact from salaries and over $1.1 billion in property and sales tax revenues to the
County of Los Angeles.
Regional Leadership
The members of the LAEDC are civic leaders and ranking executives of the region’s leading public and
private organizations. Through financial support and direct participation in the mission, programs, and
public policy initiatives of the LAEDC, the members are committed to playing a decisive role in shaping
the region’s economic future.
Business Services The LAEDC’s Business Development and Assistance Program provides essential services to L.A.
County businesses at no cost, including coordinating site searches, securing incentives and permits, and
identifying traditional and nontraditional financing. The LAEDC also works with workforce training,
transportation, and utility providers.
Economic Information
Through our public information and for-fee research, the LAEDC provides critical economic analysis to
business decision makers, education, media, and government. We publish a wide variety of industry-
focused and regional analysis, and our Economic Forecast report, produced by the Kyser Center for
Economic Research, has been ranked No. 1 by the Wall Street Journal.
Economic Consulting The LAEDC Institute for Applied Economics offers thoughtful, highly regarded economic and policy
expertise to private- and public-sector clients. The group focuses on economic impact studies, regional
industry analyses and economic issue studies, particularly in water, transportation, infrastructure, and
workforce development policy.
Leveraging our Leadership The LAEDC Center for Economic Development partners with the Southern California Leadership
Council to help enable public sector officials, policy makers, and other civic leaders to address and solve
public policy issues critical to the entire region’s economic vitality and quality of life.
Global Connections Our World Trade Center Los Angeles (WTCLA) works to support the development of international trade
and business opportunities for Southern California companies as the leading international trade
association, trade service organization and trade resource in Los Angeles County. It also promotes the
Los Angeles region as a prime destination for foreign investment. For more information, please visit
www.laedc.org/wtc.
©2015 Los Angeles County Economic Development Corporation 444 S. Flower Street, 37
th Floor., Los Angeles 90071
T: (213) 622-4300 | F: (213) 622-7100 | www.laedc.org
Researched and Prepared by:
The LAEDC Kyser Center for Economic Research:
Robert A. Kleinhenz, Ph.D. Chief Economist Kimberly Ritter-Martinez Economist George Entis Research Analyst
About the Kyser Center for Economic Research The Kyser Center for Economic Research was named in November 2007 in honor of the
LAEDC’s first Chief Economist, Jack Kyser. The Kyser Center’s economic research
encompasses the Southern California region, which includes the counties of Los
Angeles, Orange, Riverside, San Bernardino, San Diego and Ventura. The center also
tracks developments and produces forecasts, studies, and reports on the California,
national and international economies.
The economy of the greater Los Angeles region is driven by more than its famed
entertainment industry. The region’s broad economic base also includes aerospace,
automotive, biotechnology, fashion, manufacturing and international trade. The Kyser
Center conducts research on the individual industries of the region to gain a better
understanding of ongoing changes in the economy.
The Kyser Center is highly regarded for its accurate and unbiased assessment of the
economy. Kyser Center economists are also sought-after public speakers and frequent
contributors to media coverage of the economy. At the heart of the Kyser Center is its
mission to provide information, insights and perspectives to help business leaders,
government officials and the general public understand and take advantage of emerging
trends.
Table of Contents
Introduction to the L.A. Stats, 2015 Edition ................................................................................ 1
Notes on Sources ...................................................................................................................... 2
Section A: County Profiles ............................................................................................................ 3
Los Angeles County Profile ....................................................................................................... 3
Orange County Profile ............................................................................................................... 4
Riverside-San Bernardino Area Profile...................................................................................... 5
San Diego County Profile .......................................................................................................... 6
Ventura County Profile .............................................................................................................. 7
Section B: Demographics ............................................................................................................. 8
Table B-1: Population Trends of Southern California ................................................................ 8
Table B-2: Population Projections for Southern California ........................................................ 9
Table B-3: Legal Immigration to Southern California ................................................................ 9
Table B-4: Population Ranking Among the States .................................................................. 10
Table B-5: Population Change by Component in Southern California .................................... 11
Table B-6: Population by Age & Gender in Southern California, 2014 Estimate .................... 13
Table B-7: Population by Race & Gender in Southern California, 2014 Estimate .................. 14
Table B-8: Population by Race & Age in Southern California, 2014 Estimate ........................ 15
Table B-9: Crime Reports of Major U.S. Cities ....................................................................... 16
Table B-10: Other Demographic Information .......................................................................... 17
Table B-11: Occupations of Employed Persons in Southern California .................................. 17
Table B-12: Fee Paid Vehicle Registrations & Driver Licenses Outstanding .......................... 18
Section C: Output, Employment, Income, and Prices .............................................................. 19
Table C-1: Gross Product of Southern California .................................................................... 19
Table C-2: Unemployment Rates in Southern California ........................................................ 20
Table C-3: Nonfarm Employment in California ........................................................................ 21
Table C-4: Nonfarm Employment in Los Angeles County ....................................................... 22
Table C-5: Nonfarm Employment in Orange County ............................................................... 23
Table C-6: Nonfarm Employment in the Riverside-San Bernardino Area ............................... 24
Table C-7: Nonfarm Employment in San Diego County .......................................................... 25
Table C-8: Nonfarm Employment in Ventura County .............................................................. 26
Table C-9: Number of Business Establishments in Southern California, 2013 ....................... 27
Table C-10: Minority- and Women-Owned Businesses, 2007 ................................................ 28
Table C-11: Employee Compensation by Industry in Southern California, 2013 .................... 29
Table C-12: Total Personal Income in Southern California ..................................................... 30
Table C-13: Average Household Spending in Large Metro Areas, 2012-2013 ....................... 31
Table C-14: Average Annual Earnings by Major Employment Sector, 2013 .......................... 32
Table C-15: Personal Income Tax Statistics, 2012 Taxable Year ........................................... 38
Table C-16: Consumer Price Index for the Los Angeles Area ................................................ 35
Section D: Industry Data ............................................................................................................. 36
Table D-1: Aerospace/Technology Employment in Southern California ................................. 36
Table D-2: Technology Firms in Los Angeles County ............................................................. 38
Table D-3: Value of Two-Way International Trade at Leading Customs Districts ................... 40
Table D-4: Merchandise Trade through the Los Angeles Customs District ............................ 41
Table D-5: Southern California Seaport Traffic ....................................................................... 41
Table D-6: Southern California Airport Traffic ......................................................................... 47
Table D-7: Overnight Visitors to Los Angeles County ............................................................. 48
Table D-8: International Visitors to Los Angeles County ........................................................ 48
Table D-9: Location Filming Days Los Angeles County ...................................................... 4348
Table D-10: Home Sales & Median Sale Prices in Southern California .................................. 44
Table D-11: Housing Unit Permits Issued in Southern California ........................................... 46
Table D-12: Nonresidential Construction Permit Activity in Southern California ................... 48
Table D-13: Industrial Vacancy Rates in Southern California ................................................. 49
Table D-14: Office Vacancy Rates in Southern California ...................................................... 50
Table D-15: Apartment Vacancy Rates & Rents in Southern California ................................. 51
Table D-16: Foreclosures in Southern California .................................................................... 52
Table D-17: Taxable Retail Sales in Southern California ........................................................ 53
Table D-18: Taxable Retail Sales in Southern California Cities .............................................. 55
Table D-19a: Taxable Retail Sales by County and Store Type, 2009-2013 ........................... 61
Table D-19b: Taxable Retail Sales by County and Store Type, 1999-2008 ........................... 64
--------------------------------
LAEDC Kyser Center for Economic Research 1 L.A. Stats 2015
Introduction to the L.A. Stats, 2015 Edition
This is a collection of business and economic indicators for the Los Angeles Five-County Area (Los
Angeles, Orange, Riverside, San Bernardino, and Ventura counties) and in most instances our neighbor
to the south, San Diego County. A variety of private and public sources have been used in its preparation
and all tables have a source citation.
Los Angeles County is one of 58 counties in the state of California, and has a land area of 4,084 square
miles. This area is somewhat smaller than the state of Connecticut. The county contains 88 separate
incorporated cities, as well as many unincorporated communities. The county has a diverse geographical
profile: 70 miles of coast on the Pacific Ocean; the San Gabriel mountains (the highest peak, Mt. Baldy
tops out at 10,064 ft.), and part of the Mojave Desert in the northern portion of the county. Los Angeles
County lies on approximately the same latitude as Atlanta, Georgia, Dallas, Texas, Tokyo, Japan and
Kabul, Afghanistan.
Climate (annual averages) – Downtown Los Angeles
Normal daily mean temperature 69 degrees F
Normal daily maximum temperature 78 degrees F
Normal daily minimum temperature 60 degrees F
Days of sunshine per year 292 days
Normal annual precipitation 14.9 inches
Snow & ice Traces
For other economic information on Southern California and the State of California in general, please visit
our publications page at http://laedc.org/economic-research-analysis/laedc-reports/. All Kyser Center
publications are available for downloading free-of-charge.
You may also be interested in two weekly publications available online. To keep you up to date on
economic information, the e-Edge newsletter is our broadcast commentary about the latest economic
news and is available at http://laedc.org/business-assistance/additional-resources/e-edge-newsletter/.
The L.A. County Business Scan contains in capsule format the latest economic information for Los
Angeles County and can be viewed at http://laedc.org/news-events/newsletters/.
LAEDC Kyser Center for Economic Research 2 L.A. Stats 2015
Notes on Sources The employment tables in L.A. Stats present statistics from three major surveys: the Current Population
Survey (CPS; or household survey), the Current Employment Statistics Survey (CES; or establishment
survey), and the Quarterly Census of Employment and Wages (QCEW).
The CPS or household survey is released monthly and is used to represent the entire civilian non-
institutional population. This survey reports the unemployment rate because it asks if the respondent is
currently working, or if they are not, about their job-seeking intentions. The household survey includes
agricultural workers, self-employed workers whose businesses are unincorporated, unpaid family
workers, and private household workers among the employed. It counts people on unpaid leave among
the unemployed.
The CES or establishment survey (also released monthly), collects data on employment, hours and
earnings from a sample of nonagricultural business establishments. The sample establishments are
drawn from private nonfarm businesses such as factories, offices, and stores, as well as from federal,
state and local government entities. Employees on nonfarm payrolls are those who receive pay for any
part of the reference pay period, including persons on paid leave. Persons are counted in each job they
hold. In contrast, the household survey has no duplication of individuals, because individuals are counted
only once, even if they hold more than one job. Additionally, the establishment survey is not limited by
age, whereas the household survey is limited to workers 16 years of age and older.
The QCEW data series provides a near census (compared to the population samples used for the CPS
and CES series) of quarterly and annual employment and wage information by 6-digit NAICS industry at
the national, state and county levels. As such, it is the most complete universe of monthly employment
and quarterly wage information by detailed industry at the national, state, CMSA, MSA and county levels.
The data are derived from the quarterly tax reports submitted to the Employment Development
Department by California employers subject to state unemployment insurance laws and from federal
agencies subject to unemployment compensation for federal employees (UCFE). The QCEW program
produces a comprehensive tabulation of establishments, and employment and wage information for
workers covered by California Unemployment insurance and UCFE. QCEW data is published six to
seven months after the quarter it covers. Thus, while QCEW data is more comprehensive than the CPS
and CES, it has a much greater time lag to release.
The three series can diverge for a variety of reasons, including multiple jobs per person, living and
working in two different counties, and being self-employed. Therefore, they should not be compared
directly for the purpose of inferring precise information from the divergence of the three series.
How to cite information from L.A. Stats: Nearly all the data in L.A. Stats come from sources other than
the LAEDC. Please cite the data as they are cited in this publication.
Section A: County Profiles
LAEDC Kyser Center for Economic Research 3 L.A. Stats 2015
Section A: County Profiles
Los Angeles County Profile
Los Angeles County (Los Angeles-Long Beach-Glendale Metro Division) covers 4,084 square miles,
and had a 2014 population of 10,069,036 residents; an increase of 525,053 persons since 2000. The
county's population would make it the eighth largest state in the nation, just behind Georgia and
ahead of North Carolina.
A quick demographic profile of Los Angeles County indicates that: 49.0% of the population is
Hispanic, 26.7% white non-Hispanic, 13.8% Asian-Pacific Islander, 8.3% black; and 2.2% other
races. About 76.6% of the population has a high school diploma, while 29.7% holds a bachelor's
degree or higher.
Los Angeles County has a diverse economic base. Measured by 2013 private sector employment,
the leading industry clusters are: 1) local health services with 394,950 workers; 2) local hospitality
establishments with 348,320 employees; 3) commercial services with 279,060 workers; 4) trade with
264,470 workers; and 5) business services with 243,210 workers.
The "new economy" of Los Angeles County is largely technology driven. This sector includes bio-
medical, digital information technology, and environmental technology, all of which is built upon the
advanced technical research capabilities in the county. Another key driver is creativity. There is an
energetic fusion between technology and creativity such as in video game and film production.
Los Angeles County is the largest manufacturing center in the U.S., employing 366,100 workers in
2013. The largest sectors by employment were: transportation equipment with 47,000 workers
(primarily aerospace); apparel with 46,100 workers; fabricated metal products with 43,300 workers;
computer and electronic products with 39,200 workers; and food products with 38,400 workers.
International trade is a major driver of the area's economy. The Los Angeles Customs District, which
includes the ports of Long Beach and Los Angeles, Port Hueneme, and Los Angeles International
Airport, was the nation's largest in 2014. The value of two-way trade passing through the Los Angeles
Customs District totaled $416.6 billion in 2014, compared with $279.1 billion for second-place New
York. Major investments are under way to expand the ports, LAX airport and related transportation
facilities in Los Angeles County.
Higher and specialized education is a core strength of Los Angeles County, with 113 four-year
public and private college and university campuses. These range from UCLA, USC, the California
Institute of Technology, and the Claremont Colleges, to top-rated specialized institutions like the Art
Center College of Design, the California Institute for the Arts, the Fashion Institute of Design and
Merchandising, and the Otis College of Art and Design. Medical education is also a strong point. Los
Angeles has two each of medical schools, dental schools, and eye institutes, plus specialized
research and treatment facilities like the City of Hope. In addition, the county’s 33 community colleges
offer many innovative programs, including culinary arts, fashion design, multimedia, and computer
assisted design and manufacturing.
Los Angeles County’s transportation network is extensive. In addition to the San Pedro Bay sea
ports and LAX airport, there are two other busy commercial airports (Bob Hope in Burbank and Long
Beach). The freeway system is well-known but there are also many mass transit options, including
Section A: County Profiles
LAEDC Kyser Center for Economic Research 4 L.A. Stats 2015
Amtrak, Metrolink (commuter heavy rail), and MetroRail (subway and light rail). With 88 miles (and
expanding) of track, Metro’s light rail system is the second largest in the United States (based on
ridership), providing transportation for more than 356,000 passengers on workdays. The Burlington
Northern Santa Fe (BNSF) and Union Pacific railroads provide excellent cross-country freight service.
Quality of life options are numerous and varied in Los Angeles County. Recreation opportunities
range from professional sports teams to personal recreation at beaches, marinas, and mountain
resorts. The number of fine and performing arts activities is growing, as are special festivals including
the renowned Tournament of Roses. Notable cultural landmarks include the Getty Center, Walt
Disney Concert Hall, the California Science Center, the Staples Center sports arena, and the
Aquarium of the Pacific in Long Beach.
Orange County Profile
Orange County (Santa Ana-Anaheim-Irvine Metro Division) covers 948 square miles, and had a
2014 population of 3,132,681 residents; an increase of 278,788 since 2000. If Orange County were a
state, it would rank 30th in the nation, just behind Connecticut. Within the State of California, Orange
County ranks third in population behind the counties of Los Angeles and San Diego.
A quick demographic profile of Orange County indicates that 42.3% of the population is white non-
Hispanic, 34.6% is Hispanic, 19.1% is Asian-Pacific Islander, and 4.1% is black or other races. About
84.0% of the population has a high school diploma or more, while 37% has a bachelor's degree or
more.
Technology is a vital force in the Orange County economy, with several centers of activity, including
Irvine (around both the Spectrum and UC Irvine) and the mid-county area. Areas of emphasis include
aerospace, computer software (especially gaming software), semiconductors and biomedical
applications.
Orange County is a major manufacturing center with 157,000 workers employed in this sector in
2013. The largest sectors by employment were: computer and electronic products with 32,700
workers; fabricated metal products with 23,300 workers; miscellaneous manufacturing with 22,500
workers (mostly medical device manufacturing), transportation equipment with 13,800 workers
(primarily aerospace); and machinery with 9,600 workers.
The higher education assets of Orange County are extensive, including the University of California-
Irvine (which has a medical school), California State University-Fullerton, Chapman University, and
the Southern California College of Optometry. There are also several well-regarded community
colleges.
Transportation services in Orange County are well developed. In addition to the freeway system, rail
mass transit service is offered by Amtrak and Metrolink, and bus service by the Orange County
Transit Authority. Commercial air service is offered at Orange County John Wayne Airport. Rail freight
service is provided by Burlington Northern Santa Fe (BNSF).
Quality of life is a strong point for Orange County, with nearly 40 miles of coastline and three small
craft marinas. The mountains on the east side of the county offer a variety of outdoor recreational
opportunities. An array of fine and performing arts venues includes the Orange County Performing
Arts Center in Costa Mesa, plus professional baseball and ice hockey. The modern theme park was
Section A: County Profiles
LAEDC Kyser Center for Economic Research 5 L.A. Stats 2015
born at Disneyland in Anaheim and a second park, California Adventure, is located right next door.
Knott's Berry Farm and its sibling, Soak City USA also are located in Orange County.
Riverside-San Bernardino Area Profile
The Riverside-San Bernardino-Ontario Metropolitan Statistical Area is comprised of Riverside and
San Bernardino counties and is often called the "Inland Empire". The area is bordered by Los
Angeles and Orange counties on the west, and on the east by the states of Nevada and Arizona.
Riverside County covers 7,304 square miles, while San Bernardino covers 20,106 square miles. The
2014 population of the two-county area totaled 4,386,916 persons; an increase of 1,110,455
persons since 2000. Riverside and San Bernardino counties are the fourth and fifth largest by
population in California.
A quick demographic profile of the two counties indicates that 49.6% of the population is Hispanic;
33.8% is white non-Hispanic; 10.4% is black or other races; and 6.2% is Asian-Pacific Islander. As to
education, 78.9% of the two counties’ population has a high school diploma or higher, and 19.6% has
a bachelor's degree or higher.
The Inland Empire is also an important manufacturing center with employment reaching 86,500 jobs
in 2013. The largest industry sectors were: fabricated metal products with 13,000 employees; plastic
and rubber products with 8,600 workers; food production with 7,400 workers; miscellaneous
manufacturing (medical instruments, toys, sporting goods) with 7,400 workers; and transportation
equipment with 6,000 employees.
International trade plays an important role in the Inland Empire's economy. The area is a major
transportation hub for both rail and truck service. The Los Angeles Ontario International Airport is a
UPS hub, handling domestic small packages and providing service to Asia. The area also contains
many large distribution centers occupied by firms moving goods between Southern California's ports
and to the rest of the U.S.
The Inland Empire has an impressive array of higher education facilities, including the University of
California-Riverside, California State University San Bernardino, the University of Redlands, and the
Loma Linda School of Medicine. Just to the west of the county line in Los Angeles are the Claremont
Colleges and Cal Poly Pomona. There are also several community colleges located in the area.
As noted above, the Inland Empire is a hub for transportation services in Southern California with
rail freight provided by Union Pacific and Burlington Northern Santa Fe (BNSF). For travelers, there
are the L.A./Ontario International Airport, easy freeway access, as well as rail service offered by
Amtrak and Metrolink (three lines). In addition, three ex-military air fields are being redeveloped for
commercial use: George Air Force Base renamed as the Southern California Logistics Airport; Norton
AFB repurposed as the San Bernardino International Airport (general aviation and cargo); and March
AFB as the March Inland Port.
The two-county Inland Empire has a diverse portfolio of quality of life elements. Resort destinations
in the desert feature championship golf courses and tennis tournaments, while those in the mountains
offer skiing in the winter and mountain hiking and biking the rest of the year. Several Indian casinos
are located in the Coachella Valley. There are several fine and performing arts venues. The Auto
Club (formerly California) Speedway in Fontana is the largest auto racetrack in Southern California.
Section A: County Profiles
LAEDC Kyser Center for Economic Research 7 L.A. Stats 2015
San Diego County Profile
San Diego County (San Diego-Carlsbad-San Marcos Metropolitan Statistical Area ) covers 4,526
square miles, and had a 2014 population of 3,212,298; an increase of 383,924 persons since 2000.
The county's population is the second largest of all California’s counties (behind Los Angeles
County).
A quick demographic profile of San Diego County indicates that: 47.5% of the population is white
non-Hispanic, 33.0% is Hispanic, 11.1% is Asian-Pacific Islander, and 8.4% is black or other races.
Over 85% of the population has a high school diploma or more, while nearly 35% has a bachelor's
degree or more.
A large portion of the economy of San Diego County is technology driven, and includes biomedical
research and development, communications, and computer science. These sectors are closely tied to
the cutting-edge technological research capabilities of the county's businesses and the University of
California-San Diego.
San Diego is a large manufacturing center in the U.S. with 94,400 workers in 2013. The largest
manufacturing sectors in the county were: computer and electronic products with 24,500 workers and
transportation equipment (primarily aerospace) with 13,700 workers. Following were miscellaneous
products with 10,600 workers (including 6,000 workers in medical device manufacturing), machinery
manufacturing (8,300 workers) and chemicals (7,400 workers, over 80% of which were in
pharmaceuticals manufacturing). San Diego also has the only sizable shipbuilding industry on the
West Coast.
International trade is a major component of the area's economy. The San Diego Customs District is
a major channel for U.S.-Mexico trade. In 2014, total two-way trade through the customs district
reached $64.2 billion, with Mexico accounting for $55.0 billion or 86% of the total.
Tourism is a major source of income for San Diego County. Besides its own tourist attractions such
as SeaWorld, the San Diego Zoo, Wild Animal Park, and Legoland, San Diego also benefits
economically from travelers going to and from Mexico. In addition, several cruise ships set sail from
or make port calls at San Diego.
Higher and specialized education is a strong suit for San Diego County, with 59 college and
university campuses, including the University of California-San Diego. San Diego State University and
California State University-San Marcos are also significant education assets.
Transportation service in San Diego County is extensive. The major commercial airport, San Diego
International Airport (a.k.a. Lindbergh Field), offers domestic service and international flights to
Canada, Mexico and London. In addition to the area’s freeway system, there are heavy passenger
rail services including Amtrak, Metrolink (connecting Oceanside with Los Angeles, Orange, Riverside,
and San Bernardino counties), and the "Coaster" (between Oceanside and San Diego). The San
Diego Trolley (light rail) serves much of the City of San Diego. Rail freight service is provided by
Burlington Northern Santa Fe (BNSF).
San Diego County is home to several military bases, including Camp Pendleton (U.S. Marine
Corps), Miramar (Marine Corps aviation), and several naval stations for ships, submarines, and naval
Section A: County Profiles
LAEDC Kyser Center for Economic Research 7 L.A. Stats 2015
aviation. San Diego is also the home port of the U.S. Pacific Fleet, which covers the Pacific and
Indian Oceans.
Quality of life options are numerous in San Diego County. These range from professional sports
teams to personal recreation at the county’s beaches, marinas, and mountain resorts. The 1,200-acre
Balboa Park, a large urban park in the heart of San Diego, is home to several museums and the San
Diego Zoo. SeaWorld and the San Diego Zoo and Wild Animal Park attract visitors from near and far,
and Legoland California is a perennial favorite among children of all ages. There is a growing array of
fine and performing arts activities as well as Indian gaming facilities.
Ventura County Profile
Ventura County (Oxnard-Thousand Oaks-Ventura Metropolitan Statistical Area) covers 2,208 square
miles, and had a 2014 population of 844,259; an increase of 87,357 since 2000.
A quick demographic profile of Ventura County indicates that 47.2% of the population is white non-
Hispanic, 41.8% is Hispanic, 6.8% is Asian-Pacific Islander, and 4.2% is black or other races. About
83% of the population has a high school diploma or more, while over 31% has a bachelor's degree or
more.
Agriculture continues to play an important role in the economy of Ventura County. According to the
Ventura County Farm Bureau, there is one acre of irrigated farm land in the county for every acre of
city. In 2014, there were 25,600 workers employed in the county’s crop production industries, which
consist primarily of fruits and vegetables, nursery stock and cut flowers.
There is a significant cluster of new technology activities in eastern Ventura County, with a
concentration around Camarillo. Bio-med giant Amgen is headquartered in nearby Thousand Oaks.
Port Hueneme provides an international trade component to the county's economy and is the only
deep water harbor between Los Angeles and the San Francisco Bay area. Port Hueneme serves as
the U.S. Port of Entry for California’s central coast region. This is a niche facility that specializes in the
import and export of automobiles, fresh fruit and produce. In 2014, the port handled 5,248 tons of
cargo with total two-way trade valued at over $9.2 billion.
On the higher education front, California Lutheran University, California State University-Channel
Islands and several community colleges are located in the county.
Besides Port Hueneme and the freeways, Ventura County has passenger rail transportation service
by both Amtrak and Metrolink. Commercial air service is available at Santa Barbara Airport to the
north.
Quality of life is a strong suit for Ventura County, which has about 40 miles of coastline including two
small craft harbors and easy access to the Channel Islands. Inland recreation areas include Lake
Casitas, the famed Ojai resort area, vineyards, and the Los Padres National Forest.
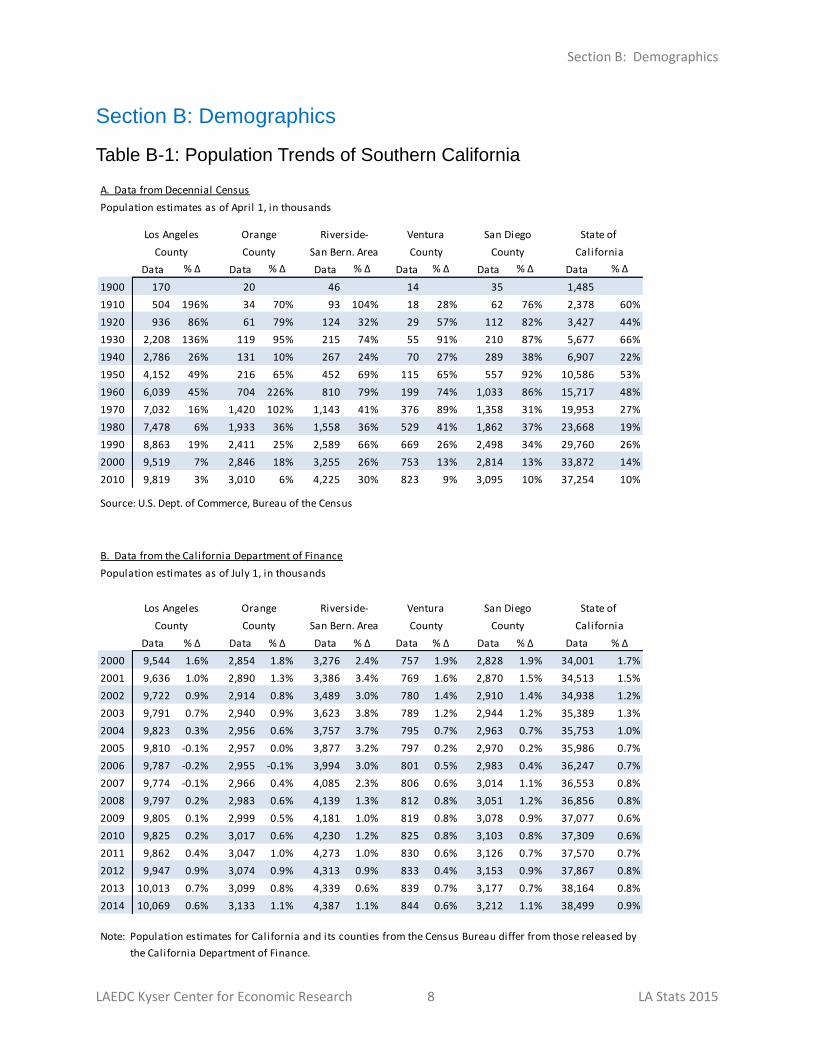
Section B: Demographics
LAEDC Kyser Center for Economic Research 8 LA Stats 2015
A. Data from Decennial Census
Population estimates as of April 1, in thousands
Los Angeles Orange Riverside- Ventura San Diego State of
County County San Bern. Area County County California
Data % ∆ Data % ∆ Data % ∆ Data % ∆ Data % ∆ Data % ∆
1900 170 20 46 14 35 1,485
1910 504 196% 34 70% 93 104% 18 28% 62 76% 2,378 60%
1920 936 86% 61 79% 124 32% 29 57% 112 82% 3,427 44%
1930 2,208 136% 119 95% 215 74% 55 91% 210 87% 5,677 66%
1940 2,786 26% 131 10% 267 24% 70 27% 289 38% 6,907 22%
1950 4,152 49% 216 65% 452 69% 115 65% 557 92% 10,586 53%
1960 6,039 45% 704 226% 810 79% 199 74% 1,033 86% 15,717 48%
1970 7,032 16% 1,420 102% 1,143 41% 376 89% 1,358 31% 19,953 27%
1980 7,478 6% 1,933 36% 1,558 36% 529 41% 1,862 37% 23,668 19%
1990 8,863 19% 2,411 25% 2,589 66% 669 26% 2,498 34% 29,760 26%
2000 9,519 7% 2,846 18% 3,255 26% 753 13% 2,814 13% 33,872 14%
2010 9,819 3% 3,010 6% 4,225 30% 823 9% 3,095 10% 37,254 10%
Source: U.S. Dept. of Commerce, Bureau of the Census
B. Data from the California Department of Finance
Population estimates as of July 1, in thousands
Los Angeles Orange Riverside- Ventura San Diego State of
County County San Bern. Area County County California
Data % ∆ Data % ∆ Data % ∆ Data % ∆ Data % ∆ Data % ∆
2000 9,544 1.6% 2,854 1.8% 3,276 2.4% 757 1.9% 2,828 1.9% 34,001 1.7%
2001 9,636 1.0% 2,890 1.3% 3,386 3.4% 769 1.6% 2,870 1.5% 34,513 1.5%
2002 9,722 0.9% 2,914 0.8% 3,489 3.0% 780 1.4% 2,910 1.4% 34,938 1.2%
2003 9,791 0.7% 2,940 0.9% 3,623 3.8% 789 1.2% 2,944 1.2% 35,389 1.3%
2004 9,823 0.3% 2,956 0.6% 3,757 3.7% 795 0.7% 2,963 0.7% 35,753 1.0%
2005 9,810 -0.1% 2,957 0.0% 3,877 3.2% 797 0.2% 2,970 0.2% 35,986 0.7%
2006 9,787 -0.2% 2,955 -0.1% 3,994 3.0% 801 0.5% 2,983 0.4% 36,247 0.7%
2007 9,774 -0.1% 2,966 0.4% 4,085 2.3% 806 0.6% 3,014 1.1% 36,553 0.8%
2008 9,797 0.2% 2,983 0.6% 4,139 1.3% 812 0.8% 3,051 1.2% 36,856 0.8%
2009 9,805 0.1% 2,999 0.5% 4,181 1.0% 819 0.8% 3,078 0.9% 37,077 0.6%
2010 9,825 0.2% 3,017 0.6% 4,230 1.2% 825 0.8% 3,103 0.8% 37,309 0.6%
2011 9,862 0.4% 3,047 1.0% 4,273 1.0% 830 0.6% 3,126 0.7% 37,570 0.7%
2012 9,947 0.9% 3,074 0.9% 4,313 0.9% 833 0.4% 3,153 0.9% 37,867 0.8%
2013 10,013 0.7% 3,099 0.8% 4,339 0.6% 839 0.7% 3,177 0.7% 38,164 0.8%
2014 10,069 0.6% 3,133 1.1% 4,387 1.1% 844 0.6% 3,212 1.1% 38,499 0.9%
Note: Population estimates for California and its counties from the Census Bureau differ from those released by
Note: the California Department of Finance.
Section B: Demographics
Table B-1: Population Trends of Southern California
Section B: Demographics
LAEDC Kyser Center for Economic Research 9 L.A. Stats 2015
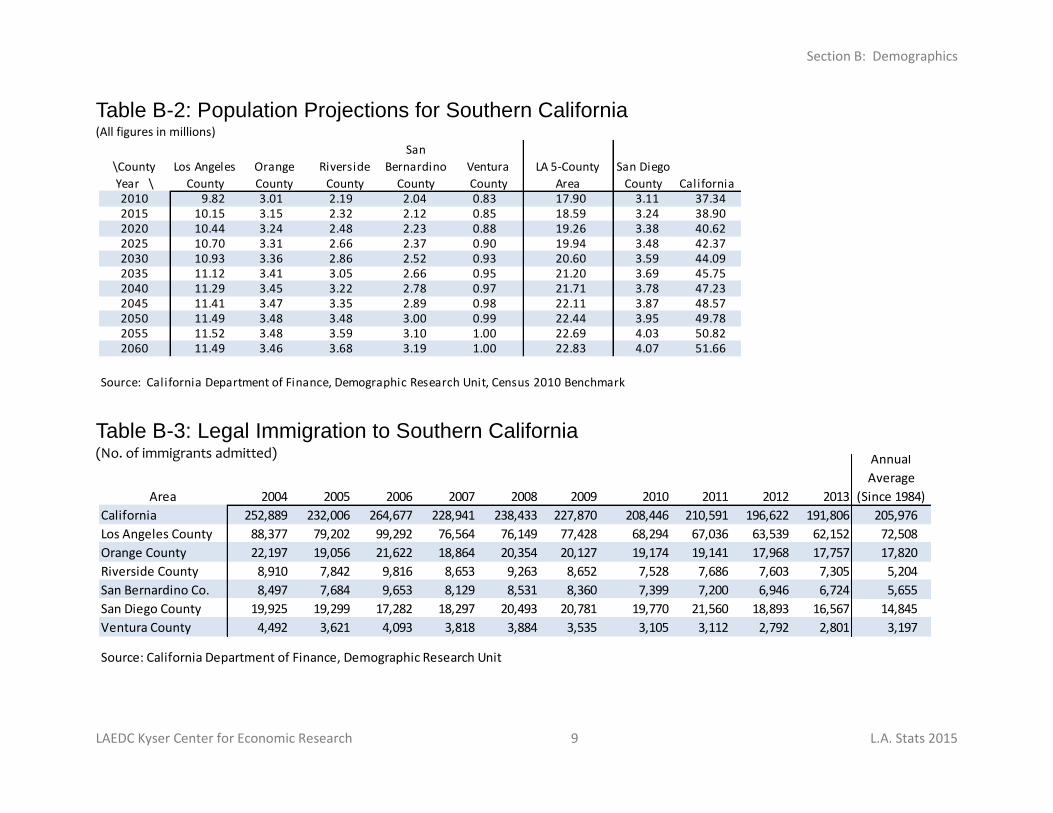
Area 2004 2005 2006 2007 2008 2009 2010 2011 2012 2013
Annual
Average
(Since 1984)
California 252,889 232,006 264,677 228,941 238,433 227,870 208,446 210,591 196,622 191,806 205,976
Los Angeles County 88,377 79,202 99,292 76,564 76,149 77,428 68,294 67,036 63,539 62,152 72,508
Orange County 22,197 19,056 21,622 18,864 20,354 20,127 19,174 19,141 17,968 17,757 17,820
Riverside County 8,910 7,842 9,816 8,653 9,263 8,652 7,528 7,686 7,603 7,305 5,204
San Bernardino Co. 8,497 7,684 9,653 8,129 8,531 8,360 7,399 7,200 6,946 6,724 5,655
San Diego County 19,925 19,299 17,282 18,297 20,493 20,781 19,770 21,560 18,893 16,567 14,845
Ventura County 4,492 3,621 4,093 3,818 3,884 3,535 3,105 3,112 2,792 2,801 3,197
Source: California Department of Finance, Demographic Research Unit
\County
Year \
Los Angeles
County
Orange
County
Riverside
County
San
Bernardino
County
Ventura
County
LA 5-County
Area
San Diego
County California2010 9.82 3.01 2.19 2.04 0.83 17.90 3.11 37.342015 10.15 3.15 2.32 2.12 0.85 18.59 3.24 38.902020 10.44 3.24 2.48 2.23 0.88 19.26 3.38 40.622025 10.70 3.31 2.66 2.37 0.90 19.94 3.48 42.372030 10.93 3.36 2.86 2.52 0.93 20.60 3.59 44.092035 11.12 3.41 3.05 2.66 0.95 21.20 3.69 45.752040 11.29 3.45 3.22 2.78 0.97 21.71 3.78 47.232045 11.41 3.47 3.35 2.89 0.98 22.11 3.87 48.572050 11.49 3.48 3.48 3.00 0.99 22.44 3.95 49.782055 11.52 3.48 3.59 3.10 1.00 22.69 4.03 50.822060 11.49 3.46 3.68 3.19 1.00 22.83 4.07 51.66
Source: California Department of Finance, Demographic Research Unit, Census 2010 Benchmark
Table B-2: Population Projections for Southern California (All figures in millions)
Table B-3: Legal Immigration to Southern California (No. of immigrants admitted)
Section B: Demographics
LAEDC Kyser Center for Economic Research 10 L.A. Stats 2015
2004 2005 2006 2007 2008 2009 2010 2011 2012 2013 2014
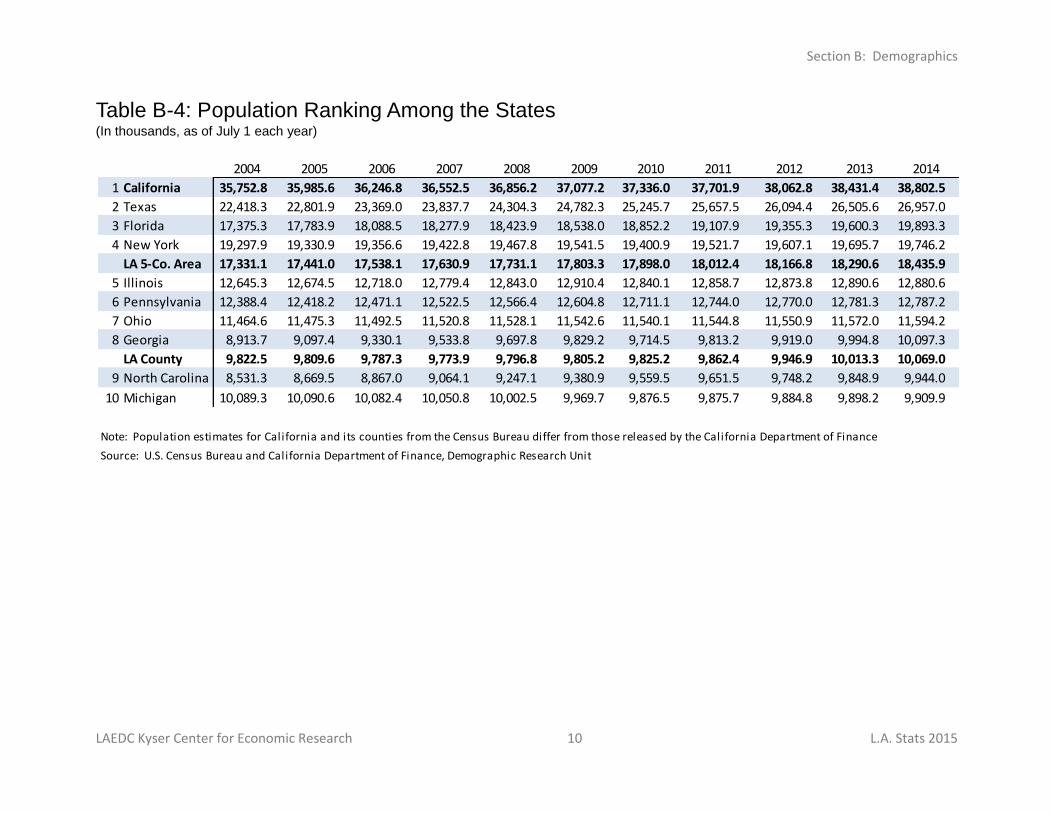
1 California 35,752.8 35,985.6 36,246.8 36,552.5 36,856.2 37,077.2 37,336.0 37,701.9 38,062.8 38,431.4 38,802.5
2 Texas 22,418.3 22,801.9 23,369.0 23,837.7 24,304.3 24,782.3 25,245.7 25,657.5 26,094.4 26,505.6 26,957.0
3 Florida 17,375.3 17,783.9 18,088.5 18,277.9 18,423.9 18,538.0 18,852.2 19,107.9 19,355.3 19,600.3 19,893.3
4 New York 19,297.9 19,330.9 19,356.6 19,422.8 19,467.8 19,541.5 19,400.9 19,521.7 19,607.1 19,695.7 19,746.2
LA 5-Co. Area 17,331.1 17,441.0 17,538.1 17,630.9 17,731.1 17,803.3 17,898.0 18,012.4 18,166.8 18,290.6 18,435.9
5 Illinois 12,645.3 12,674.5 12,718.0 12,779.4 12,843.0 12,910.4 12,840.1 12,858.7 12,873.8 12,890.6 12,880.6
6 Pennsylvania 12,388.4 12,418.2 12,471.1 12,522.5 12,566.4 12,604.8 12,711.1 12,744.0 12,770.0 12,781.3 12,787.2
7 Ohio 11,464.6 11,475.3 11,492.5 11,520.8 11,528.1 11,542.6 11,540.1 11,544.8 11,550.9 11,572.0 11,594.2
8 Georgia 8,913.7 9,097.4 9,330.1 9,533.8 9,697.8 9,829.2 9,714.5 9,813.2 9,919.0 9,994.8 10,097.3
LA County 9,822.5 9,809.6 9,787.3 9,773.9 9,796.8 9,805.2 9,825.2 9,862.4 9,946.9 10,013.3 10,069.0
9 North Carolina 8,531.3 8,669.5 8,867.0 9,064.1 9,247.1 9,380.9 9,559.5 9,651.5 9,748.2 9,848.9 9,944.0
10 Michigan 10,089.3 10,090.6 10,082.4 10,050.8 10,002.5 9,969.7 9,876.5 9,875.7 9,884.8 9,898.2 9,909.9
Note: Population estimates for California and its counties from the Census Bureau differ from those released by the California Department of Finance
Source: U.S. Census Bureau and California Department of Finance, Demographic Research Unit
Table B-4: Population Ranking Among the States (In thousands, as of July 1 each year)
Section B: Demographics
LAEDC Kyser Center for Economic Research 11 L.A. Stats 2015 L.A. Stats 2011
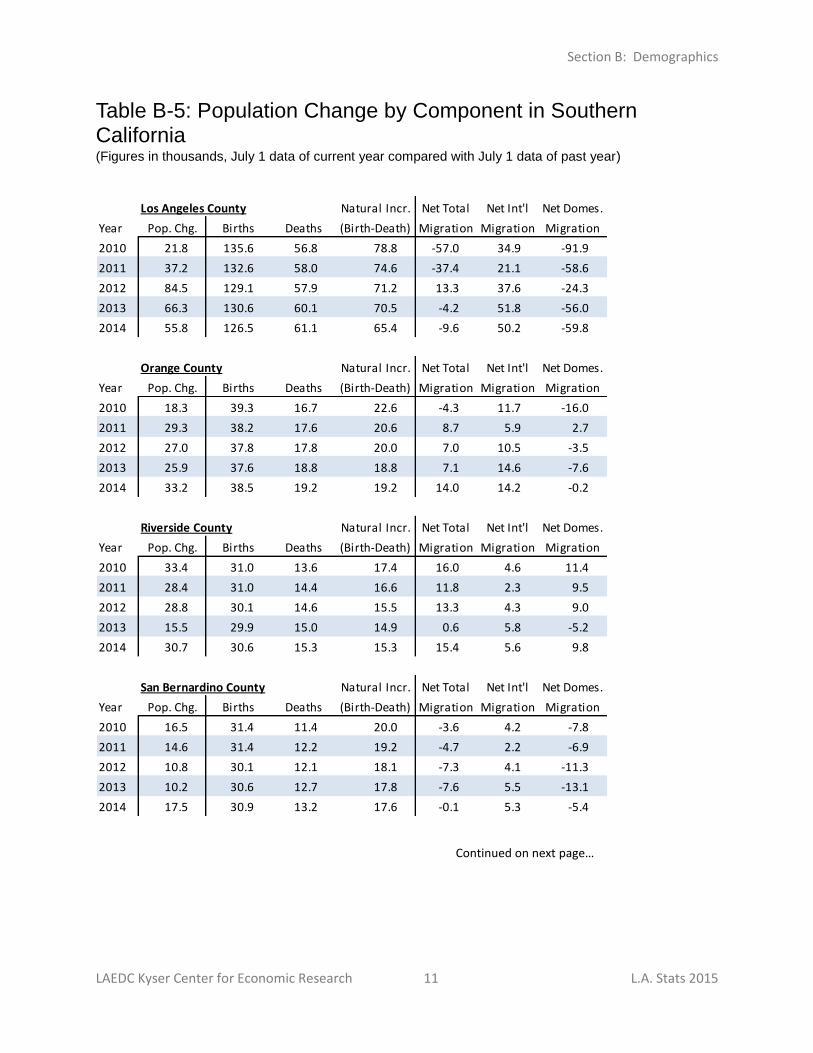
Los Angeles County Natural Incr. Net Total Net Int'l Net Domes.
Year Pop. Chg. Births Deaths (Birth-Death) Migration Migration Migration
2010 21.8 135.6 56.8 78.8 -57.0 34.9 -91.9
2011 37.2 132.6 58.0 74.6 -37.4 21.1 -58.6
2012 84.5 129.1 57.9 71.2 13.3 37.6 -24.3
2013 66.3 130.6 60.1 70.5 -4.2 51.8 -56.0
2014 55.8 126.5 61.1 65.4 -9.6 50.2 -59.8
Orange County Natural Incr. Net Total Net Int'l Net Domes.
Year Pop. Chg. Births Deaths (Birth-Death) Migration Migration Migration
2010 18.3 39.3 16.7 22.6 -4.3 11.7 -16.0
2011 29.3 38.2 17.6 20.6 8.7 5.9 2.7
2012 27.0 37.8 17.8 20.0 7.0 10.5 -3.5
2013 25.9 37.6 18.8 18.8 7.1 14.6 -7.6
2014 33.2 38.5 19.2 19.2 14.0 14.2 -0.2
Riverside County Natural Incr. Net Total Net Int'l Net Domes.
Year Pop. Chg. Births Deaths (Birth-Death) Migration Migration Migration
2010 33.4 31.0 13.6 17.4 16.0 4.6 11.4
2011 28.4 31.0 14.4 16.6 11.8 2.3 9.5
2012 28.8 30.1 14.6 15.5 13.3 4.3 9.0
2013 15.5 29.9 15.0 14.9 0.6 5.8 -5.2
2014 30.7 30.6 15.3 15.3 15.4 5.6 9.8
San Bernardino County Natural Incr. Net Total Net Int'l Net Domes.
Year Pop. Chg. Births Deaths (Birth-Death) Migration Migration Migration
2010 16.5 31.4 11.4 20.0 -3.6 4.2 -7.8
2011 14.6 31.4 12.2 19.2 -4.7 2.2 -6.9
2012 10.8 30.1 12.1 18.1 -7.3 4.1 -11.3
2013 10.2 30.6 12.7 17.8 -7.6 5.5 -13.1
2014 17.5 30.9 13.2 17.6 -0.1 5.3 -5.4
Table B-5: Population Change by Component in Southern California (Figures in thousands, July 1 data of current year compared with July 1 data of past year)
Continued on next page…
Section B: Demographics
LAEDC Kyser Center for Economic Research 12 L.A. Stats 2015 L.A. Stats 2011
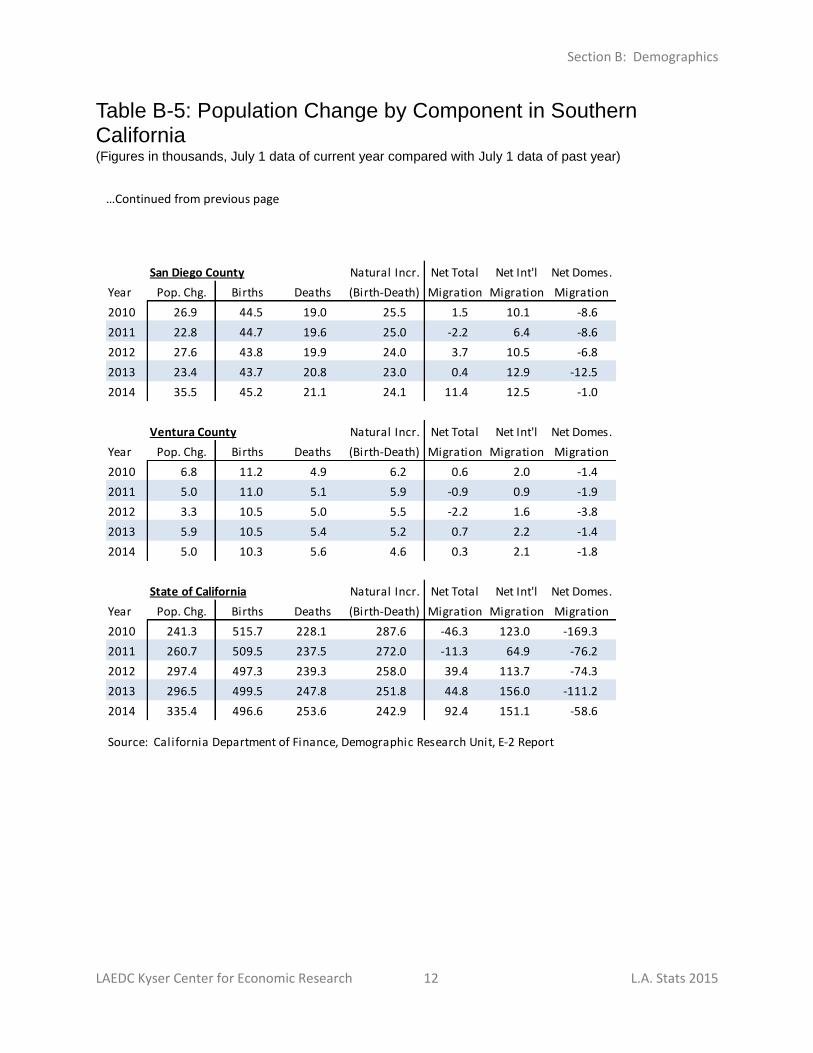
San Diego County Natural Incr. Net Total Net Int'l Net Domes.
Year Pop. Chg. Births Deaths (Birth-Death) Migration Migration Migration
2010 26.9 44.5 19.0 25.5 1.5 10.1 -8.6
2011 22.8 44.7 19.6 25.0 -2.2 6.4 -8.6
2012 27.6 43.8 19.9 24.0 3.7 10.5 -6.8
2013 23.4 43.7 20.8 23.0 0.4 12.9 -12.5
2014 35.5 45.2 21.1 24.1 11.4 12.5 -1.0
Ventura County Natural Incr. Net Total Net Int'l Net Domes.
Year Pop. Chg. Births Deaths (Birth-Death) Migration Migration Migration
2010 6.8 11.2 4.9 6.2 0.6 2.0 -1.4
2011 5.0 11.0 5.1 5.9 -0.9 0.9 -1.9
2012 3.3 10.5 5.0 5.5 -2.2 1.6 -3.8
2013 5.9 10.5 5.4 5.2 0.7 2.2 -1.4
2014 5.0 10.3 5.6 4.6 0.3 2.1 -1.8
State of California Natural Incr. Net Total Net Int'l Net Domes.
Year Pop. Chg. Births Deaths (Birth-Death) Migration Migration Migration
2010 241.3 515.7 228.1 287.6 -46.3 123.0 -169.3
2011 260.7 509.5 237.5 272.0 -11.3 64.9 -76.2
2012 297.4 497.3 239.3 258.0 39.4 113.7 -74.3
2013 296.5 499.5 247.8 251.8 44.8 156.0 -111.2
2014 335.4 496.6 253.6 242.9 92.4 151.1 -58.6
Source: California Department of Finance, Demographic Research Unit, E-2 Report
Table B-5: Population Change by Component in Southern California (Figures in thousands, July 1 data of current year compared with July 1 data of past year)
…Continued from previous page
Section B: Demographics
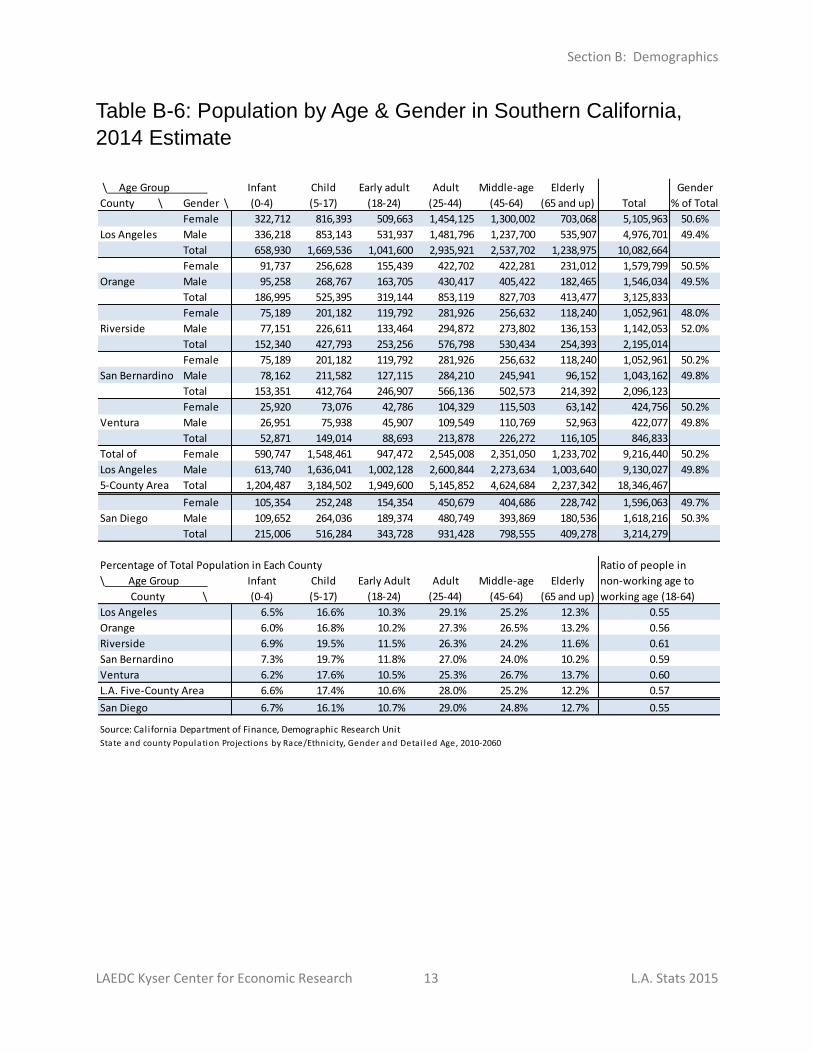
LAEDC Kyser Center for Economic Research 13 L.A. Stats 2015
\ Age Group Infant Child Early adult Adult Middle-age Elderly Gender
County \ Gender \ (0-4) (5-17) (18-24) (25-44) (45-64) (65 and up) Total % of Total
Female 322,712 816,393 509,663 1,454,125 1,300,002 703,068 5,105,963 50.6%
Los Angeles Male 336,218 853,143 531,937 1,481,796 1,237,700 535,907 4,976,701 49.4%
Total 658,930 1,669,536 1,041,600 2,935,921 2,537,702 1,238,975 10,082,664
Female 91,737 256,628 155,439 422,702 422,281 231,012 1,579,799 50.5%
Orange Male 95,258 268,767 163,705 430,417 405,422 182,465 1,546,034 49.5%
Total 186,995 525,395 319,144 853,119 827,703 413,477 3,125,833
Female 75,189 201,182 119,792 281,926 256,632 118,240 1,052,961 48.0%
Riverside Male 77,151 226,611 133,464 294,872 273,802 136,153 1,142,053 52.0%
Total 152,340 427,793 253,256 576,798 530,434 254,393 2,195,014
Female 75,189 201,182 119,792 281,926 256,632 118,240 1,052,961 50.2%
San Bernardino Male 78,162 211,582 127,115 284,210 245,941 96,152 1,043,162 49.8%
Total 153,351 412,764 246,907 566,136 502,573 214,392 2,096,123
Female 25,920 73,076 42,786 104,329 115,503 63,142 424,756 50.2%
Ventura Male 26,951 75,938 45,907 109,549 110,769 52,963 422,077 49.8%
Total 52,871 149,014 88,693 213,878 226,272 116,105 846,833
Total of Female 590,747 1,548,461 947,472 2,545,008 2,351,050 1,233,702 9,216,440 50.2%
Los Angeles Male 613,740 1,636,041 1,002,128 2,600,844 2,273,634 1,003,640 9,130,027 49.8%
5-County Area Total 1,204,487 3,184,502 1,949,600 5,145,852 4,624,684 2,237,342 18,346,467
Female 105,354 252,248 154,354 450,679 404,686 228,742 1,596,063 49.7%
San Diego Male 109,652 264,036 189,374 480,749 393,869 180,536 1,618,216 50.3%
Total 215,006 516,284 343,728 931,428 798,555 409,278 3,214,279
Percentage of Total Population in Each County
\ Age Group Infant Child Early Adult Adult Middle-age Elderly
County \ (0-4) (5-17) (18-24) (25-44) (45-64) (65 and up) working age (18-64)
Los Angeles 6.5% 16.6% 10.3% 29.1% 25.2% 12.3%
Orange 6.0% 16.8% 10.2% 27.3% 26.5% 13.2%
Riverside 6.9% 19.5% 11.5% 26.3% 24.2% 11.6%
San Bernardino 7.3% 19.7% 11.8% 27.0% 24.0% 10.2%
Ventura 6.2% 17.6% 10.5% 25.3% 26.7% 13.7%
L.A. Five-County Area 6.6% 17.4% 10.6% 28.0% 25.2% 12.2%
San Diego 6.7% 16.1% 10.7% 29.0% 24.8% 12.7%
Source: California Department of Finance, Demographic Research Unit
State and county Population Projections by Race/Ethnici ty, Gender and Deta i led Age, 2010-2060
0.59
0.60
0.57
0.55
Ratio of people in
non-working age to
0.55
0.56
0.61
Table B-6: Population by Age & Gender in Southern California,
2014 Estimate

Section B: Demographics
LAEDC Kyser Center for Economic Research 14 L.A. Stats 2015
\ Race Pacific African Native
County \ Gender \ White Hispanic Asian Islander American American Multi-race Total
Female 1,340,448 2,470,796 728,507 11,955 442,176 10,105 101,976 5,105,963
Los Angeles Male 1,353,058 2,469,960 644,668 11,624 391,091 9,553 96,747 4,976,701
Total 2,693,506 4,940,756 1,373,175 23,579 833,267 19,658 198,723 10,082,664
Female 667,884 535,289 308,865 4,226 22,273 3,272 37,990 1,579,799
Orange Male 652,854 545,783 278,065 4,353 23,948 3,208 37,823 1,546,034
Total 1,320,738 1,081,072 586,930 8,579 46,221 6,480 75,813 3,125,833
Female 337,469 529,897 65,492 3,220 88,928 4,655 23,300 1,052,961
Riverside Male 436,143 538,404 63,385 3,389 69,659 5,780 25,293 1,142,053
Total 773,612 1,068,301 128,877 6,609 158,587 10,435 48,593 2,195,014
Female 337,469 529,897 65,492 3,220 88,928 4,655 23,300 1,052,961
San Bernardino Male 337,574 530,578 59,502 3,343 85,041 4,625 22,499 1,043,162
Total 675,043 1,060,475 124,994 6,563 173,969 9,280 45,799 2,096,123
Female 202,480 173,948 30,141 718 6,239 1,252 9,978 424,756
Ventura Male 196,448 179,056 25,774 720 7,104 1,237 9,738 420,077
Total 398,928 353,004 55,915 1,438 13,343 2,489 19,716 844,833
Total of Female 2,885,750 4,239,827 1,198,497 23,339 648,544 23,939 196,544 9,216,440
Los Angeles Male 2,976,077 4,263,781 1,071,394 23,429 576,843 24,403 192,100 9,128,027
5-County Area Total 5,861,827 8,503,608 2,269,891 46,768 1,225,387 48,342 388,644 18,344,467
Female 743,556 534,791 182,543 6,953 70,794 7,143 50,283 1,596,063
San Diego Male 781,964 525,394 161,450 7,359 83,792 7,698 50,559 1,618,216
Total 1,525,520 1,060,185 343,993 14,312 154,586 14,841 100,842 3,214,279
Percentage of Total Population in Each County
\ Race Pacific African Native
County \ White Hispanic Asian Islander American American Multi-race Total
Los Angeles 26.7% 49.0% 13.6% 0.2% 8.3% 0.2% 2.0% 100.00%
Orange 42.3% 34.6% 18.8% 0.3% 1.5% 0.2% 2.4% 100.00%
Riverside 35.2% 48.7% 5.9% 0.3% 7.2% 0.5% 2.2% 100.00%
San Bernardino 32.2% 50.6% 6.0% 0.3% 8.3% 0.4% 2.2% 100.00%
Ventura 47.2% 41.8% 6.6% 0.2% 1.6% 0.3% 2.3% 100.00%
L.A. Five-County Area 32.0% 46.4% 12.4% 0.3% 6.7% 0.3% 2.1% 100.00%
San Diego 47.5% 33.0% 10.7% 0.4% 4.8% 0.5% 3.1% 100.00%
Source: California Department of Finance, Demographic Research Unit
State and county Population Projections by Race/Ethnici ty, Gender and Deta i led Age, 2010-2060
Table B-7: Population by Race & Gender in Southern California,
2014 Estimate
Section B: Demographics
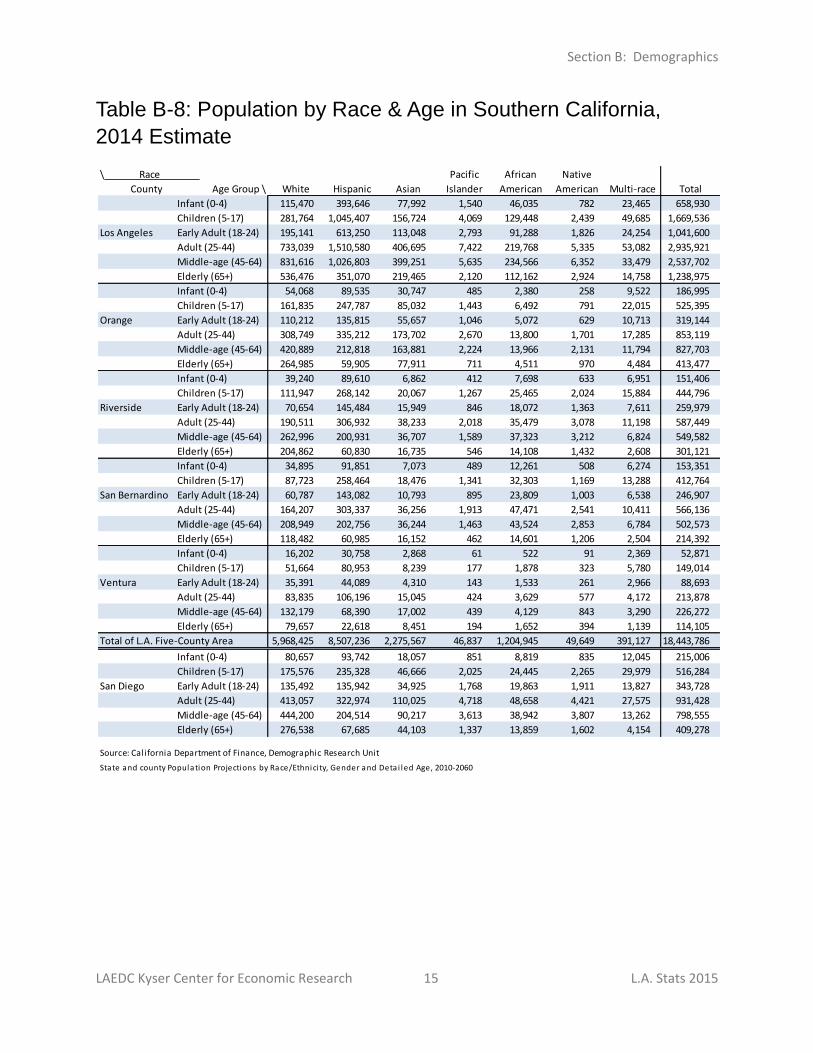
LAEDC Kyser Center for Economic Research 15 L.A. Stats 2015
\ Race _ Pacific African Native
County Age Group \ White Hispanic Asian Islander American American Multi-race Total
Infant (0-4) 115,470 393,646 77,992 1,540 46,035 782 23,465 658,930
Children (5-17) 281,764 1,045,407 156,724 4,069 129,448 2,439 49,685 1,669,536
Los Angeles Early Adult (18-24) 195,141 613,250 113,048 2,793 91,288 1,826 24,254 1,041,600
Adult (25-44) 733,039 1,510,580 406,695 7,422 219,768 5,335 53,082 2,935,921
Middle-age (45-64) 831,616 1,026,803 399,251 5,635 234,566 6,352 33,479 2,537,702
Elderly (65+) 536,476 351,070 219,465 2,120 112,162 2,924 14,758 1,238,975
Infant (0-4) 54,068 89,535 30,747 485 2,380 258 9,522 186,995
Children (5-17) 161,835 247,787 85,032 1,443 6,492 791 22,015 525,395
Orange Early Adult (18-24) 110,212 135,815 55,657 1,046 5,072 629 10,713 319,144
Adult (25-44) 308,749 335,212 173,702 2,670 13,800 1,701 17,285 853,119
Middle-age (45-64) 420,889 212,818 163,881 2,224 13,966 2,131 11,794 827,703
Elderly (65+) 264,985 59,905 77,911 711 4,511 970 4,484 413,477
Infant (0-4) 39,240 89,610 6,862 412 7,698 633 6,951 151,406
Children (5-17) 111,947 268,142 20,067 1,267 25,465 2,024 15,884 444,796
Riverside Early Adult (18-24) 70,654 145,484 15,949 846 18,072 1,363 7,611 259,979
Adult (25-44) 190,511 306,932 38,233 2,018 35,479 3,078 11,198 587,449
Middle-age (45-64) 262,996 200,931 36,707 1,589 37,323 3,212 6,824 549,582
Elderly (65+) 204,862 60,830 16,735 546 14,108 1,432 2,608 301,121
Infant (0-4) 34,895 91,851 7,073 489 12,261 508 6,274 153,351
Children (5-17) 87,723 258,464 18,476 1,341 32,303 1,169 13,288 412,764
San Bernardino Early Adult (18-24) 60,787 143,082 10,793 895 23,809 1,003 6,538 246,907
Adult (25-44) 164,207 303,337 36,256 1,913 47,471 2,541 10,411 566,136
Middle-age (45-64) 208,949 202,756 36,244 1,463 43,524 2,853 6,784 502,573
Elderly (65+) 118,482 60,985 16,152 462 14,601 1,206 2,504 214,392
Infant (0-4) 16,202 30,758 2,868 61 522 91 2,369 52,871
Children (5-17) 51,664 80,953 8,239 177 1,878 323 5,780 149,014
Ventura Early Adult (18-24) 35,391 44,089 4,310 143 1,533 261 2,966 88,693
Adult (25-44) 83,835 106,196 15,045 424 3,629 577 4,172 213,878
Middle-age (45-64) 132,179 68,390 17,002 439 4,129 843 3,290 226,272
Elderly (65+) 79,657 22,618 8,451 194 1,652 394 1,139 114,105
Total of L.A. Five-County Area 5,968,425 8,507,236 2,275,567 46,837 1,204,945 49,649 391,127 18,443,786
Infant (0-4) 80,657 93,742 18,057 851 8,819 835 12,045 215,006
Children (5-17) 175,576 235,328 46,666 2,025 24,445 2,265 29,979 516,284
San Diego Early Adult (18-24) 135,492 135,942 34,925 1,768 19,863 1,911 13,827 343,728
Adult (25-44) 413,057 322,974 110,025 4,718 48,658 4,421 27,575 931,428
Middle-age (45-64) 444,200 204,514 90,217 3,613 38,942 3,807 13,262 798,555
Elderly (65+) 276,538 67,685 44,103 1,337 13,859 1,602 4,154 409,278
Source: California Department of Finance, Demographic Research Unit
State and county Population Projections by Race/Ethnici ty, Gender and Deta i led Age, 2010-2060
Table B-8: Population by Race & Age in Southern California,
2014 Estimate
Section B: Demographics
LAEDC Kyser Center for Economic Research 16 L.A. Stats 2015
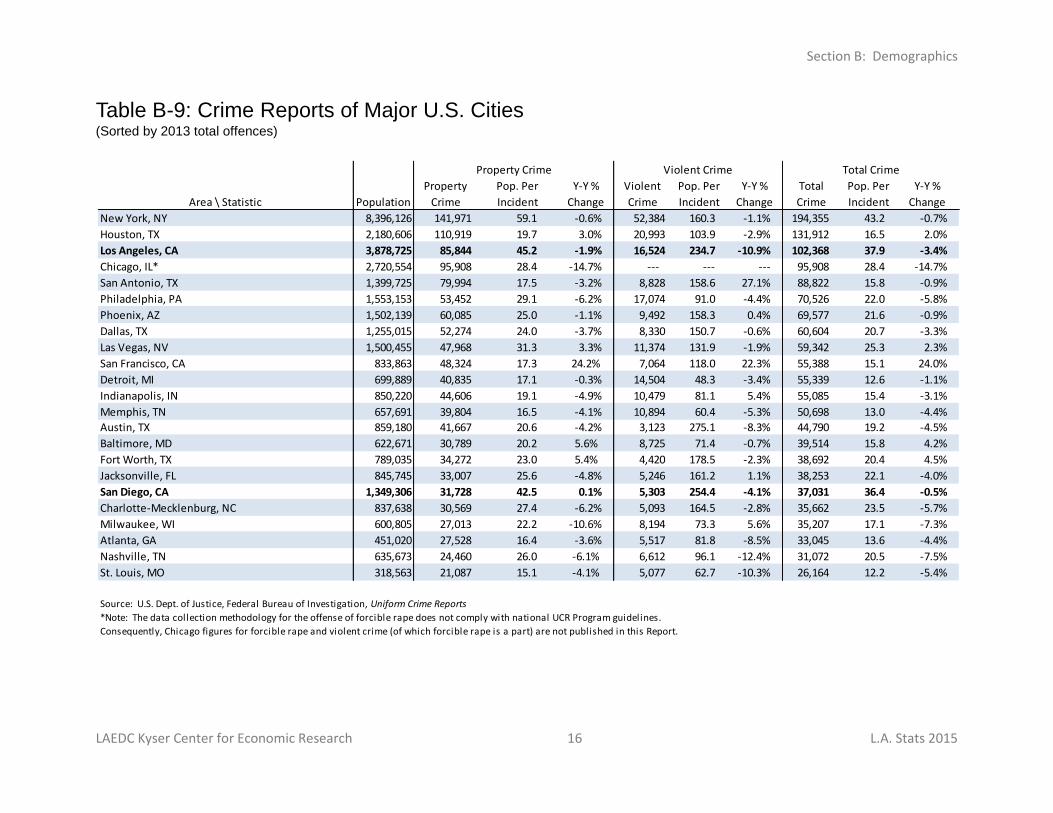
Table B-9: Crime Reports of Major U.S. Cities (Sorted by 2013 total offences)
Area \ Statistic Population
Property
Crime
Pop. Per
Incident
Y-Y %
Change
Violent
Crime
Pop. Per
Incident
Y-Y %
Change
Total
Crime
Pop. Per
Incident
Y-Y %
Change
New York, NY 8,396,126 141,971 59.1 -0.6% 52,384 160.3 -1.1% 194,355 43.2 -0.7%
Houston, TX 2,180,606 110,919 19.7 3.0% 20,993 103.9 -2.9% 131,912 16.5 2.0%
Los Angeles, CA 3,878,725 85,844 45.2 -1.9% 16,524 234.7 -10.9% 102,368 37.9 -3.4%
Chicago, IL* 2,720,554 95,908 28.4 -14.7% --- --- --- 95,908 28.4 -14.7%
San Antonio, TX 1,399,725 79,994 17.5 -3.2% 8,828 158.6 27.1% 88,822 15.8 -0.9%
Philadelphia, PA 1,553,153 53,452 29.1 -6.2% 17,074 91.0 -4.4% 70,526 22.0 -5.8%
Phoenix, AZ 1,502,139 60,085 25.0 -1.1% 9,492 158.3 0.4% 69,577 21.6 -0.9%
Dallas, TX 1,255,015 52,274 24.0 -3.7% 8,330 150.7 -0.6% 60,604 20.7 -3.3%
Las Vegas, NV 1,500,455 47,968 31.3 3.3% 11,374 131.9 -1.9% 59,342 25.3 2.3%
San Francisco, CA 833,863 48,324 17.3 24.2% 7,064 118.0 22.3% 55,388 15.1 24.0%
Detroit, MI 699,889 40,835 17.1 -0.3% 14,504 48.3 -3.4% 55,339 12.6 -1.1%
Indianapolis, IN 850,220 44,606 19.1 -4.9% 10,479 81.1 5.4% 55,085 15.4 -3.1%
Memphis, TN 657,691 39,804 16.5 -4.1% 10,894 60.4 -5.3% 50,698 13.0 -4.4%
Austin, TX 859,180 41,667 20.6 -4.2% 3,123 275.1 -8.3% 44,790 19.2 -4.5%
Baltimore, MD 622,671 30,789 20.2 5.6% 8,725 71.4 -0.7% 39,514 15.8 4.2%
Fort Worth, TX 789,035 34,272 23.0 5.4% 4,420 178.5 -2.3% 38,692 20.4 4.5%
Jacksonville, FL 845,745 33,007 25.6 -4.8% 5,246 161.2 1.1% 38,253 22.1 -4.0%
San Diego, CA 1,349,306 31,728 42.5 0.1% 5,303 254.4 -4.1% 37,031 36.4 -0.5%
Charlotte-Mecklenburg, NC 837,638 30,569 27.4 -6.2% 5,093 164.5 -2.8% 35,662 23.5 -5.7%
Milwaukee, WI 600,805 27,013 22.2 -10.6% 8,194 73.3 5.6% 35,207 17.1 -7.3%
Atlanta, GA 451,020 27,528 16.4 -3.6% 5,517 81.8 -8.5% 33,045 13.6 -4.4%
Nashville, TN 635,673 24,460 26.0 -6.1% 6,612 96.1 -12.4% 31,072 20.5 -7.5%
St. Louis, MO 318,563 21,087 15.1 -4.1% 5,077 62.7 -10.3% 26,164 12.2 -5.4%
Source: U.S. Dept. of Justice, Federal Bureau of Investigation, Uniform Crime Reports
*Note: The data collection methodology for the offense of forcible rape does not comply with national UCR Program guidelines.
Consequently, Chicago figures for forcible rape and violent crime (of which forcible rape is a part) are not published in this Report.
Property Crime Violent Crime Total Crime
Section B: Demographics
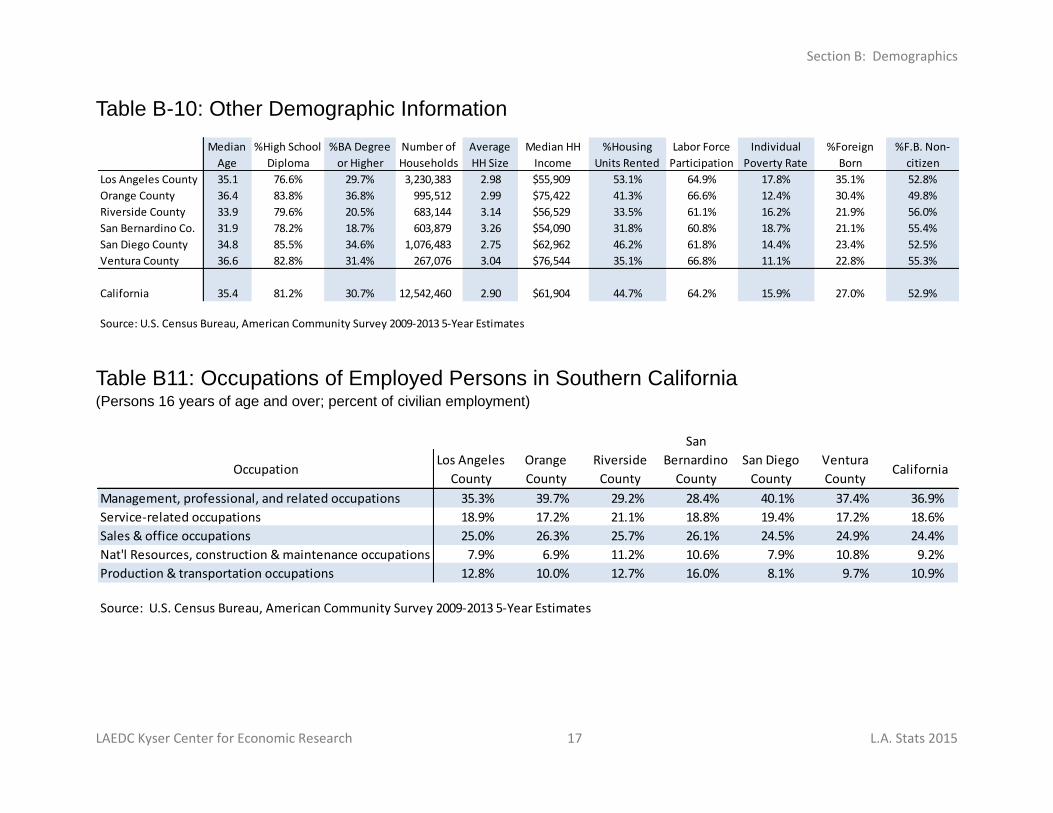
LAEDC Kyser Center for Economic Research 17 L.A. Stats 2015
Management, professional, and related occupations 35.3% 39.7% 29.2% 28.4% 40.1% 37.4% 36.9%
Service-related occupations 18.9% 17.2% 21.1% 18.8% 19.4% 17.2% 18.6%
Sales & office occupations 25.0% 26.3% 25.7% 26.1% 24.5% 24.9% 24.4%
Nat'l Resources, construction & maintenance occupations 7.9% 6.9% 11.2% 10.6% 7.9% 10.8% 9.2%
Production & transportation occupations 12.8% 10.0% 12.7% 16.0% 8.1% 9.7% 10.9%
Source: U.S. Census Bureau, American Community Survey 2009-2013 5-Year Estimates
Ventura
CountyCalifornia
San
Bernardino
CountyOccupation
Los Angeles
County
Orange
County
Riverside
County
San Diego
County
Los Angeles County 35.1 76.6% 29.7% 3,230,383 2.98 $55,909 53.1% 64.9% 17.8% 35.1% 52.8%
Orange County 36.4 83.8% 36.8% 995,512 2.99 $75,422 41.3% 66.6% 12.4% 30.4% 49.8%
Riverside County 33.9 79.6% 20.5% 683,144 3.14 $56,529 33.5% 61.1% 16.2% 21.9% 56.0%
San Bernardino Co. 31.9 78.2% 18.7% 603,879 3.26 $54,090 31.8% 60.8% 18.7% 21.1% 55.4%
San Diego County 34.8 85.5% 34.6% 1,076,483 2.75 $62,962 46.2% 61.8% 14.4% 23.4% 52.5%
Ventura County 36.6 82.8% 31.4% 267,076 3.04 $76,544 35.1% 66.8% 11.1% 22.8% 55.3%
California 35.4 81.2% 30.7% 12,542,460 2.90 $61,904 44.7% 64.2% 15.9% 27.0% 52.9%
Source: U.S. Census Bureau, American Community Survey 2009-2013 5-Year Estimates
Median HH
Income
Median
Age
%High School
Diploma
%BA Degree
or Higher
Number of
Households
Average
HH Size
%Housing
Units Rented
Labor Force
Participation
Individual
Poverty Rate
%Foreign
Born
%F.B. Non-
citizen
Table B-10: Other Demographic Information
Table B11: Occupations of Employed Persons in Southern California (Persons 16 years of age and over; percent of civilian employment)
Section B: Demographics
LAEDC Kyser Center for Economic Research 18 L.A. Stats 2015
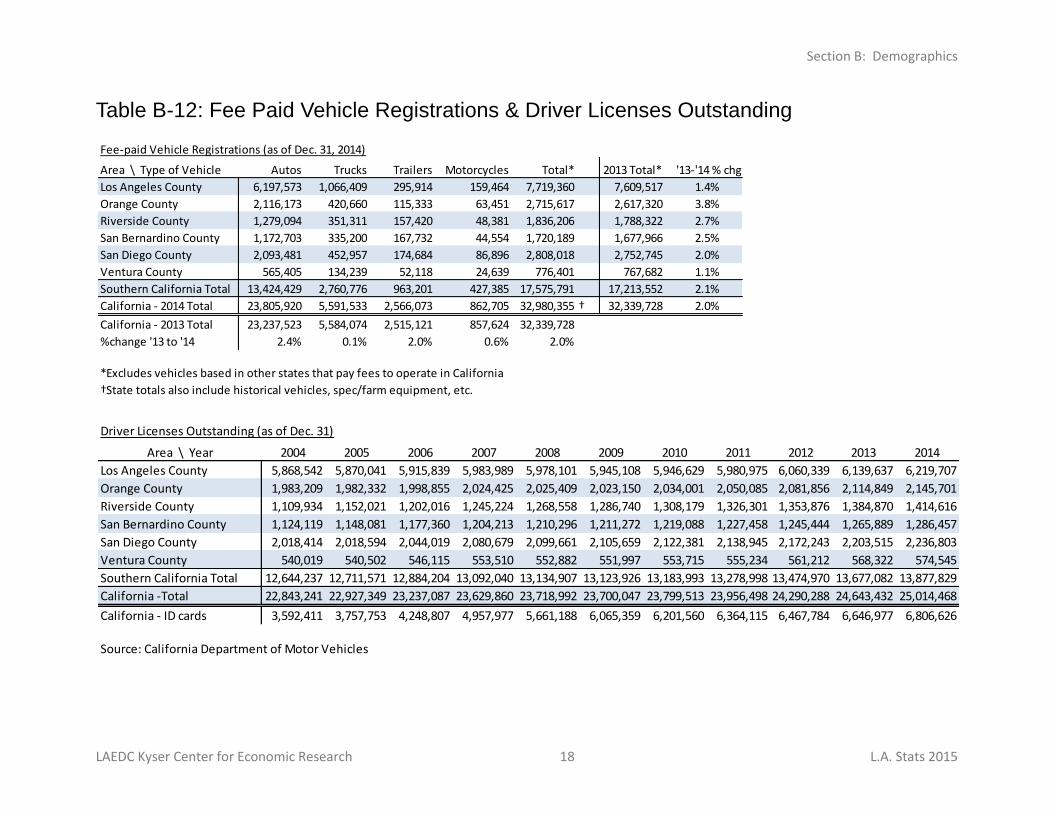
Fee-paid Vehicle Registrations (as of Dec. 31, 2014)
Area \ Type of Vehicle Autos Trucks Trailers Motorcycles Total* 2013 Total* '13-'14 % chg.
Los Angeles County 6,197,573 1,066,409 295,914 159,464 7,719,360 7,609,517 1.4%
Orange County 2,116,173 420,660 115,333 63,451 2,715,617 2,617,320 3.8%
Riverside County 1,279,094 351,311 157,420 48,381 1,836,206 1,788,322 2.7%
San Bernardino County 1,172,703 335,200 167,732 44,554 1,720,189 1,677,966 2.5%
San Diego County 2,093,481 452,957 174,684 86,896 2,808,018 2,752,745 2.0%
Ventura County 565,405 134,239 52,118 24,639 776,401 767,682 1.1%
Southern California Total 13,424,429 2,760,776 963,201 427,385 17,575,791 17,213,552 2.1%
California - 2014 Total 23,805,920 5,591,533 2,566,073 862,705 32,980,355 † 32,339,728 2.0%
California - 2013 Total 23,237,523 5,584,074 2,515,121 857,624 32,339,728
%change '13 to '14 2.4% 0.1% 2.0% 0.6% 2.0%
*Excludes vehicles based in other states that pay fees to operate in California
†State totals also include historical vehicles, spec/farm equipment, etc.
Driver Licenses Outstanding (as of Dec. 31)
Area \ Year 2004 2005 2006 2007 2008 2009 2010 2011 2012 2013 2014
Los Angeles County 5,868,542 5,870,041 5,915,839 5,983,989 5,978,101 5,945,108 5,946,629 5,980,975 6,060,339 6,139,637 6,219,707
Orange County 1,983,209 1,982,332 1,998,855 2,024,425 2,025,409 2,023,150 2,034,001 2,050,085 2,081,856 2,114,849 2,145,701
Riverside County 1,109,934 1,152,021 1,202,016 1,245,224 1,268,558 1,286,740 1,308,179 1,326,301 1,353,876 1,384,870 1,414,616
San Bernardino County 1,124,119 1,148,081 1,177,360 1,204,213 1,210,296 1,211,272 1,219,088 1,227,458 1,245,444 1,265,889 1,286,457
San Diego County 2,018,414 2,018,594 2,044,019 2,080,679 2,099,661 2,105,659 2,122,381 2,138,945 2,172,243 2,203,515 2,236,803
Ventura County 540,019 540,502 546,115 553,510 552,882 551,997 553,715 555,234 561,212 568,322 574,545
Southern California Total 12,644,237 12,711,571 12,884,204 13,092,040 13,134,907 13,123,926 13,183,993 13,278,998 13,474,970 13,677,082 13,877,829
California -Total 22,843,241 22,927,349 23,237,087 23,629,860 23,718,992 23,700,047 23,799,513 23,956,498 24,290,288 24,643,432 25,014,468
California - ID cards 3,592,411 3,757,753 4,248,807 4,957,977 5,661,188 6,065,359 6,201,560 6,364,115 6,467,784 6,646,977 6,806,626
Source: California Department of Motor Vehicles
Table B-12: Fee Paid Vehicle Registrations & Driver Licenses Outstanding
Section C: Output, Employment, Income and Prices
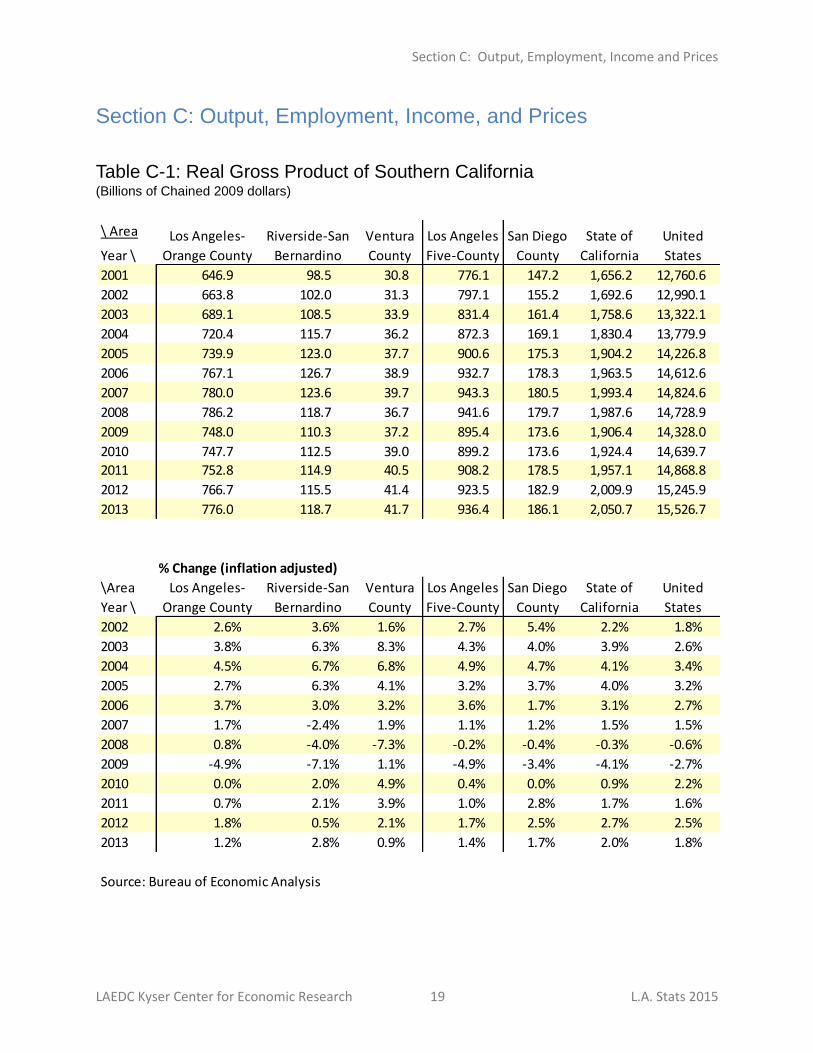
LAEDC Kyser Center for Economic Research 19 L.A. Stats 2015
\ Area
Year \
2001 646.9 98.5 30.8 776.1 147.2 1,656.2 12,760.6
2002 663.8 102.0 31.3 797.1 155.2 1,692.6 12,990.1
2003 689.1 108.5 33.9 831.4 161.4 1,758.6 13,322.1
2004 720.4 115.7 36.2 872.3 169.1 1,830.4 13,779.9
2005 739.9 123.0 37.7 900.6 175.3 1,904.2 14,226.8
2006 767.1 126.7 38.9 932.7 178.3 1,963.5 14,612.6
2007 780.0 123.6 39.7 943.3 180.5 1,993.4 14,824.6
2008 786.2 118.7 36.7 941.6 179.7 1,987.6 14,728.9
2009 748.0 110.3 37.2 895.4 173.6 1,906.4 14,328.0
2010 747.7 112.5 39.0 899.2 173.6 1,924.4 14,639.7
2011 752.8 114.9 40.5 908.2 178.5 1,957.1 14,868.8
2012 766.7 115.5 41.4 923.5 182.9 2,009.9 15,245.9
2013 776.0 118.7 41.7 936.4 186.1 2,050.7 15,526.7
% Change (inflation adjusted)
\Area
Year \
2002 2.6% 3.6% 1.6% 2.7% 5.4% 2.2% 1.8%
2003 3.8% 6.3% 8.3% 4.3% 4.0% 3.9% 2.6%
2004 4.5% 6.7% 6.8% 4.9% 4.7% 4.1% 3.4%
2005 2.7% 6.3% 4.1% 3.2% 3.7% 4.0% 3.2%
2006 3.7% 3.0% 3.2% 3.6% 1.7% 3.1% 2.7%
2007 1.7% -2.4% 1.9% 1.1% 1.2% 1.5% 1.5%
2008 0.8% -4.0% -7.3% -0.2% -0.4% -0.3% -0.6%
2009 -4.9% -7.1% 1.1% -4.9% -3.4% -4.1% -2.7%
2010 0.0% 2.0% 4.9% 0.4% 0.0% 0.9% 2.2%
2011 0.7% 2.1% 3.9% 1.0% 2.8% 1.7% 1.6%
2012 1.8% 0.5% 2.1% 1.7% 2.5% 2.7% 2.5%
2013 1.2% 2.8% 0.9% 1.4% 1.7% 2.0% 1.8%
Source: Bureau of Economic Analysis
State of
California
United
States
Los Angeles-
Orange County
Riverside-San
Bernardino
Ventura
County
Los Angeles
Five-County
San Diego
County
Los Angeles-
Orange County
United
States
State of
California
San Diego
County
Los Angeles
Five-County
Ventura
County
Riverside-San
Bernardino
Section C: Output, Employment, Income, and Prices
Table C-1: Real Gross Product of Southern California (Billions of Chained 2009 dollars)
Section C: Output, Employment, Income and Prices
LAEDC Kyser Center for Economic Research 20 L.A. Stats 2015
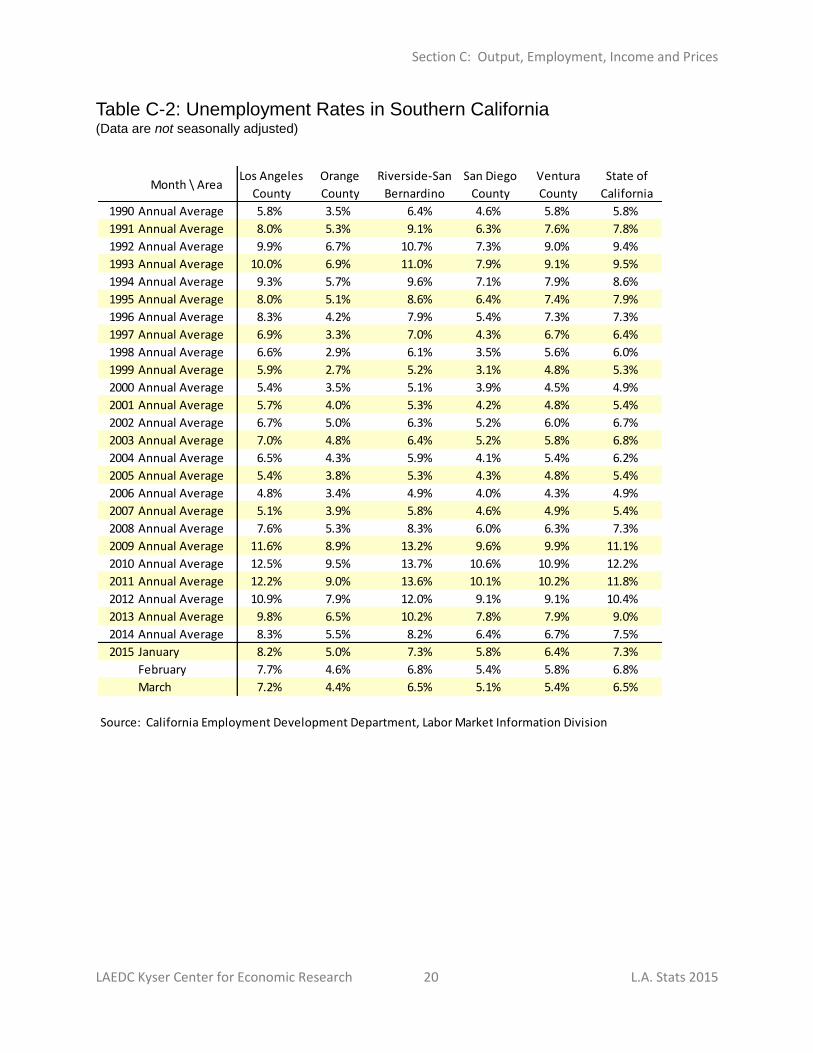
Table C-2: Unemployment Rates in Southern California (Data are not seasonally adjusted)
Month \ AreaLos Angeles
County
Orange
County
Riverside-San
Bernardino
San Diego
County
Ventura
County
State of
California
1990 Annual Average 5.8% 3.5% 6.4% 4.6% 5.8% 5.8%
1991 Annual Average 8.0% 5.3% 9.1% 6.3% 7.6% 7.8%
1992 Annual Average 9.9% 6.7% 10.7% 7.3% 9.0% 9.4%
1993 Annual Average 10.0% 6.9% 11.0% 7.9% 9.1% 9.5%
1994 Annual Average 9.3% 5.7% 9.6% 7.1% 7.9% 8.6%
1995 Annual Average 8.0% 5.1% 8.6% 6.4% 7.4% 7.9%
1996 Annual Average 8.3% 4.2% 7.9% 5.4% 7.3% 7.3%
1997 Annual Average 6.9% 3.3% 7.0% 4.3% 6.7% 6.4%
1998 Annual Average 6.6% 2.9% 6.1% 3.5% 5.6% 6.0%
1999 Annual Average 5.9% 2.7% 5.2% 3.1% 4.8% 5.3%
2000 Annual Average 5.4% 3.5% 5.1% 3.9% 4.5% 4.9%
2001 Annual Average 5.7% 4.0% 5.3% 4.2% 4.8% 5.4%
2002 Annual Average 6.7% 5.0% 6.3% 5.2% 6.0% 6.7%
2003 Annual Average 7.0% 4.8% 6.4% 5.2% 5.8% 6.8%
2004 Annual Average 6.5% 4.3% 5.9% 4.1% 5.4% 6.2%
2005 Annual Average 5.4% 3.8% 5.3% 4.3% 4.8% 5.4%
2006 Annual Average 4.8% 3.4% 4.9% 4.0% 4.3% 4.9%
2007 Annual Average 5.1% 3.9% 5.8% 4.6% 4.9% 5.4%
2008 Annual Average 7.6% 5.3% 8.3% 6.0% 6.3% 7.3%
2009 Annual Average 11.6% 8.9% 13.2% 9.6% 9.9% 11.1%
2010 Annual Average 12.5% 9.5% 13.7% 10.6% 10.9% 12.2%
2011 Annual Average 12.2% 9.0% 13.6% 10.1% 10.2% 11.8%
2012 Annual Average 10.9% 7.9% 12.0% 9.1% 9.1% 10.4%
2013 Annual Average 9.8% 6.5% 10.2% 7.8% 7.9% 9.0%
2014 Annual Average 8.3% 5.5% 8.2% 6.4% 6.7% 7.5%
2015 January 8.2% 5.0% 7.3% 5.8% 6.4% 7.3%
February 7.7% 4.6% 6.8% 5.4% 5.8% 6.8%
March 7.2% 4.4% 6.5% 5.1% 5.4% 6.5%
Source: California Employment Development Department, Labor Market Information Division
Section C: Output, Employment, Income and Prices
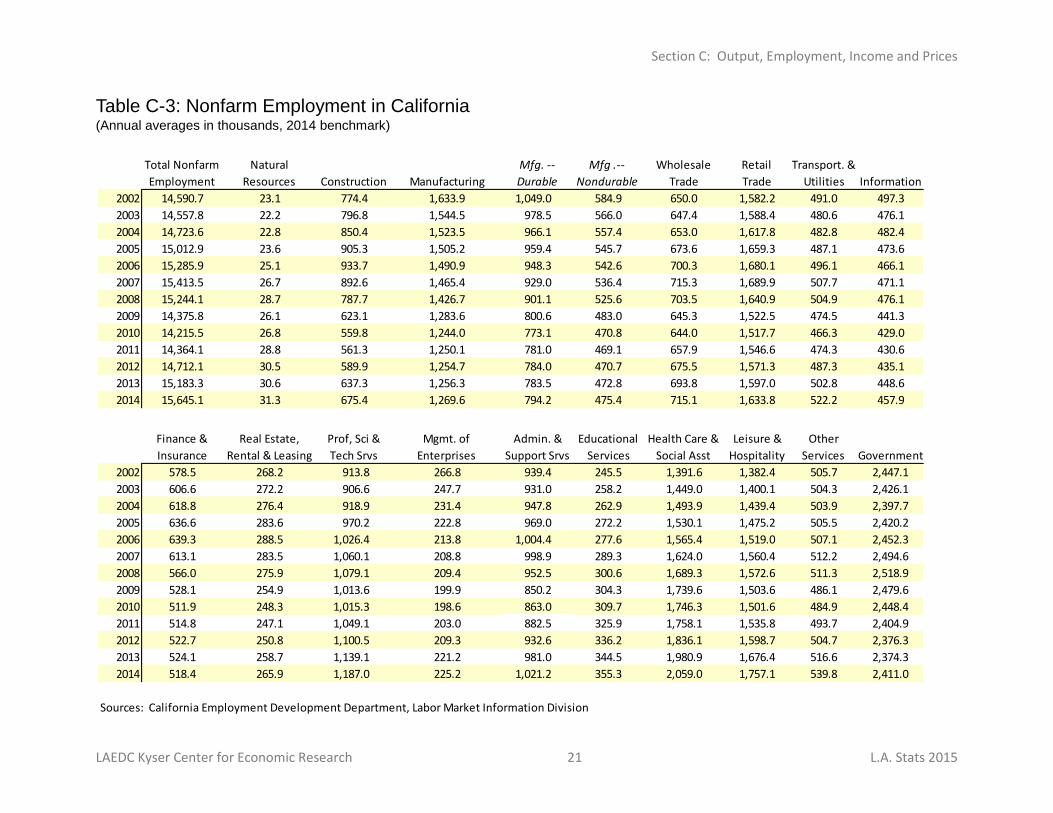
LAEDC Kyser Center for Economic Research 21 L.A. Stats 2015
Construction Manufacturing Information
2002 14,590.7 23.1 774.4 1,633.9 1,049.0 584.9 650.0 1,582.2 491.0 497.3
2003 14,557.8 22.2 796.8 1,544.5 978.5 566.0 647.4 1,588.4 480.6 476.1
2004 14,723.6 22.8 850.4 1,523.5 966.1 557.4 653.0 1,617.8 482.8 482.4
2005 15,012.9 23.6 905.3 1,505.2 959.4 545.7 673.6 1,659.3 487.1 473.6
2006 15,285.9 25.1 933.7 1,490.9 948.3 542.6 700.3 1,680.1 496.1 466.1
2007 15,413.5 26.7 892.6 1,465.4 929.0 536.4 715.3 1,689.9 507.7 471.1
2008 15,244.1 28.7 787.7 1,426.7 901.1 525.6 703.5 1,640.9 504.9 476.1
2009 14,375.8 26.1 623.1 1,283.6 800.6 483.0 645.3 1,522.5 474.5 441.3
2010 14,215.5 26.8 559.8 1,244.0 773.1 470.8 644.0 1,517.7 466.3 429.0
2011 14,364.1 28.8 561.3 1,250.1 781.0 469.1 657.9 1,546.6 474.3 430.6
2012 14,712.1 30.5 589.9 1,254.7 784.0 470.7 675.5 1,571.3 487.3 435.1
2013 15,183.3 30.6 637.3 1,256.3 783.5 472.8 693.8 1,597.0 502.8 448.6
2014 15,645.1 31.3 675.4 1,269.6 794.2 475.4 715.1 1,633.8 522.2 457.9
Government
2002 578.5 268.2 913.8 266.8 939.4 245.5 1,391.6 1,382.4 505.7 2,447.1
2003 606.6 272.2 906.6 247.7 931.0 258.2 1,449.0 1,400.1 504.3 2,426.1
2004 618.8 276.4 918.9 231.4 947.8 262.9 1,493.9 1,439.4 503.9 2,397.7
2005 636.6 283.6 970.2 222.8 969.0 272.2 1,530.1 1,475.2 505.5 2,420.2
2006 639.3 288.5 1,026.4 213.8 1,004.4 277.6 1,565.4 1,519.0 507.1 2,452.3
2007 613.1 283.5 1,060.1 208.8 998.9 289.3 1,624.0 1,560.4 512.2 2,494.6
2008 566.0 275.9 1,079.1 209.4 952.5 300.6 1,689.3 1,572.6 511.3 2,518.9
2009 528.1 254.9 1,013.6 199.9 850.2 304.3 1,739.6 1,503.6 486.1 2,479.6
2010 511.9 248.3 1,015.3 198.6 863.0 309.7 1,746.3 1,501.6 484.9 2,448.4
2011 514.8 247.1 1,049.1 203.0 882.5 325.9 1,758.1 1,535.8 493.7 2,404.9
2012 522.7 250.8 1,100.5 209.3 932.6 336.2 1,836.1 1,598.7 504.7 2,376.3
2013 524.1 258.7 1,139.1 221.2 981.0 344.5 1,980.9 1,676.4 516.6 2,374.3
2014 518.4 265.9 1,187.0 225.2 1,021.2 355.3 2,059.0 1,757.1 539.8 2,411.0
Sources: California Employment Development Department, Labor Market Information Division
Educational
Services
Health Care &
Social Asst
Leisure &
Hospitality
Other
Services
Finance &
Insurance
Real Estate,
Rental & Leasing
Prof, Sci &
Tech Srvs
Mgmt. of
Enterprises
Admin. &
Support Srvs
Wholesale
Trade
Retail
Trade
Transport. &
Utilities
Total Nonfarm
Employment
Natural
Resources
Mfg. --
Durable
Mfg .--
Nondurable
Table C-3: Nonfarm Employment in California (Annual averages in thousands, 2014 benchmark)
Section C: Output, Employment, Income and Prices
LAEDC Kyser Center for Economic Research 22 L.A. Stats 2015
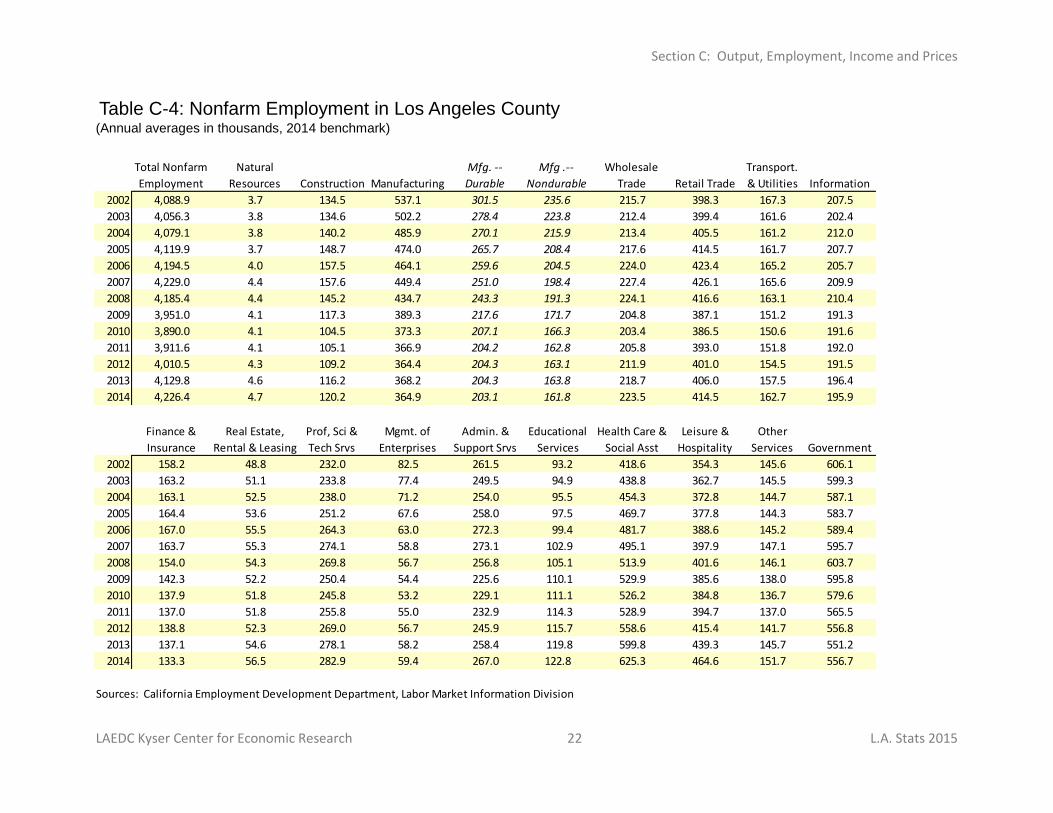
Construction Manufacturing Information
2002 4,088.9 3.7 134.5 537.1 301.5 235.6 215.7 398.3 167.3 207.5
2003 4,056.3 3.8 134.6 502.2 278.4 223.8 212.4 399.4 161.6 202.4
2004 4,079.1 3.8 140.2 485.9 270.1 215.9 213.4 405.5 161.2 212.0
2005 4,119.9 3.7 148.7 474.0 265.7 208.4 217.6 414.5 161.7 207.7
2006 4,194.5 4.0 157.5 464.1 259.6 204.5 224.0 423.4 165.2 205.7
2007 4,229.0 4.4 157.6 449.4 251.0 198.4 227.4 426.1 165.6 209.9
2008 4,185.4 4.4 145.2 434.7 243.3 191.3 224.1 416.6 163.1 210.4
2009 3,951.0 4.1 117.3 389.3 217.6 171.7 204.8 387.1 151.2 191.3
2010 3,890.0 4.1 104.5 373.3 207.1 166.3 203.4 386.5 150.6 191.6
2011 3,911.6 4.1 105.1 366.9 204.2 162.8 205.8 393.0 151.8 192.0
2012 4,010.5 4.3 109.2 364.4 204.3 163.1 211.9 401.0 154.5 191.5
2013 4,129.8 4.6 116.2 368.2 204.3 163.8 218.7 406.0 157.5 196.4
2014 4,226.4 4.7 120.2 364.9 203.1 161.8 223.5 414.5 162.7 195.9
Government
2002 158.2 48.8 232.0 82.5 261.5 93.2 418.6 354.3 145.6 606.1
2003 163.2 51.1 233.8 77.4 249.5 94.9 438.8 362.7 145.5 599.3
2004 163.1 52.5 238.0 71.2 254.0 95.5 454.3 372.8 144.7 587.1
2005 164.4 53.6 251.2 67.6 258.0 97.5 469.7 377.8 144.3 583.7
2006 167.0 55.5 264.3 63.0 272.3 99.4 481.7 388.6 145.2 589.4
2007 163.7 55.3 274.1 58.8 273.1 102.9 495.1 397.9 147.1 595.7
2008 154.0 54.3 269.8 56.7 256.8 105.1 513.9 401.6 146.1 603.7
2009 142.3 52.2 250.4 54.4 225.6 110.1 529.9 385.6 138.0 595.8
2010 137.9 51.8 245.8 53.2 229.1 111.1 526.2 384.8 136.7 579.6
2011 137.0 51.8 255.8 55.0 232.9 114.3 528.9 394.7 137.0 565.5
2012 138.8 52.3 269.0 56.7 245.9 115.7 558.6 415.4 141.7 556.8
2013 137.1 54.6 278.1 58.2 258.4 119.8 599.8 439.3 145.7 551.2
2014 133.3 56.5 282.9 59.4 267.0 122.8 625.3 464.6 151.7 556.7
Sources: California Employment Development Department, Labor Market Information Division
Educational
Services
Health Care &
Social Asst
Leisure &
Hospitality
Other
Services
Total Nonfarm
Employment
Natural
Resources
Mfg. --
Durable
Finance &
Insurance
Real Estate,
Rental & Leasing
Prof, Sci &
Tech Srvs
Mgmt. of
Enterprises
Admin. &
Support Srvs
Mfg .--
Nondurable
Wholesale
Trade Retail Trade
Transport.
& Utilities
Table C-4: Nonfarm Employment in Los Angeles County
(Annual averages in thousands, 2014 benchmark)
Section C: Output, Employment, Income and Prices
LAEDC Kyser Center for Economic Research 23 L.A. Stats 2015
Construction Manufacturing Information
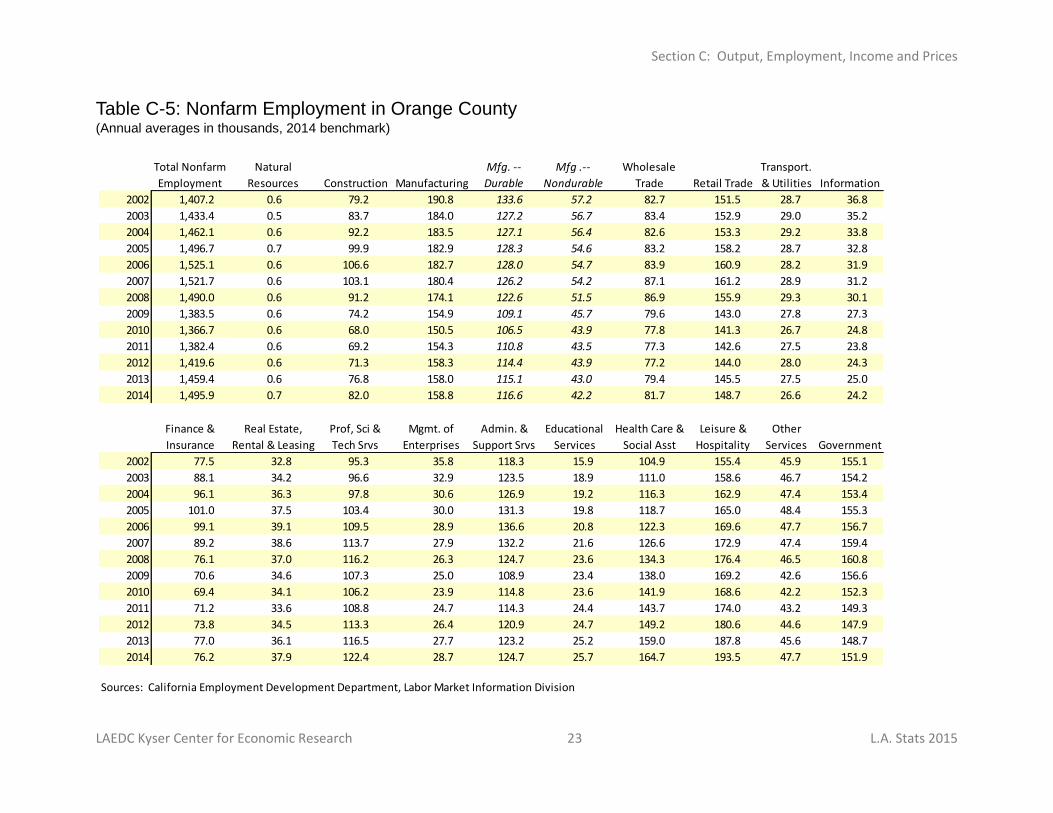
2002 1,407.2 0.6 79.2 190.8 133.6 57.2 82.7 151.5 28.7 36.8
2003 1,433.4 0.5 83.7 184.0 127.2 56.7 83.4 152.9 29.0 35.2
2004 1,462.1 0.6 92.2 183.5 127.1 56.4 82.6 153.3 29.2 33.8
2005 1,496.7 0.7 99.9 182.9 128.3 54.6 83.2 158.2 28.7 32.8
2006 1,525.1 0.6 106.6 182.7 128.0 54.7 83.9 160.9 28.2 31.9
2007 1,521.7 0.6 103.1 180.4 126.2 54.2 87.1 161.2 28.9 31.2
2008 1,490.0 0.6 91.2 174.1 122.6 51.5 86.9 155.9 29.3 30.1
2009 1,383.5 0.6 74.2 154.9 109.1 45.7 79.6 143.0 27.8 27.3
2010 1,366.7 0.6 68.0 150.5 106.5 43.9 77.8 141.3 26.7 24.8
2011 1,382.4 0.6 69.2 154.3 110.8 43.5 77.3 142.6 27.5 23.8
2012 1,419.6 0.6 71.3 158.3 114.4 43.9 77.2 144.0 28.0 24.3
2013 1,459.4 0.6 76.8 158.0 115.1 43.0 79.4 145.5 27.5 25.0
2014 1,495.9 0.7 82.0 158.8 116.6 42.2 81.7 148.7 26.6 24.2
Government
2002 77.5 32.8 95.3 35.8 118.3 15.9 104.9 155.4 45.9 155.1
2003 88.1 34.2 96.6 32.9 123.5 18.9 111.0 158.6 46.7 154.2
2004 96.1 36.3 97.8 30.6 126.9 19.2 116.3 162.9 47.4 153.4
2005 101.0 37.5 103.4 30.0 131.3 19.8 118.7 165.0 48.4 155.3
2006 99.1 39.1 109.5 28.9 136.6 20.8 122.3 169.6 47.7 156.7
2007 89.2 38.6 113.7 27.9 132.2 21.6 126.6 172.9 47.4 159.4
2008 76.1 37.0 116.2 26.3 124.7 23.6 134.3 176.4 46.5 160.8
2009 70.6 34.6 107.3 25.0 108.9 23.4 138.0 169.2 42.6 156.6
2010 69.4 34.1 106.2 23.9 114.8 23.6 141.9 168.6 42.2 152.3
2011 71.2 33.6 108.8 24.7 114.3 24.4 143.7 174.0 43.2 149.3
2012 73.8 34.5 113.3 26.4 120.9 24.7 149.2 180.6 44.6 147.9
2013 77.0 36.1 116.5 27.7 123.2 25.2 159.0 187.8 45.6 148.7
2014 76.2 37.9 122.4 28.7 124.7 25.7 164.7 193.5 47.7 151.9
Sources: California Employment Development Department, Labor Market Information Division
Educational
Services
Health Care &
Social Asst
Total Nonfarm
Employment
Natural
Resources
Mfg. --
Durable
Mfg .--
Nondurable
Finance &
Insurance
Real Estate,
Rental & Leasing
Prof, Sci &
Tech Srvs
Mgmt. of
Enterprises
Admin. &
Support Srvs
Leisure &
Hospitality
Other
Services
Wholesale
Trade Retail Trade
Transport.
& Utilities
Table C-5: Nonfarm Employment in Orange County (Annual averages in thousands, 2014 benchmark)
Section C: Output, Employment, Income and Prices
LAEDC Kyser Center for Economic Research 24 L.A. Stats 2015
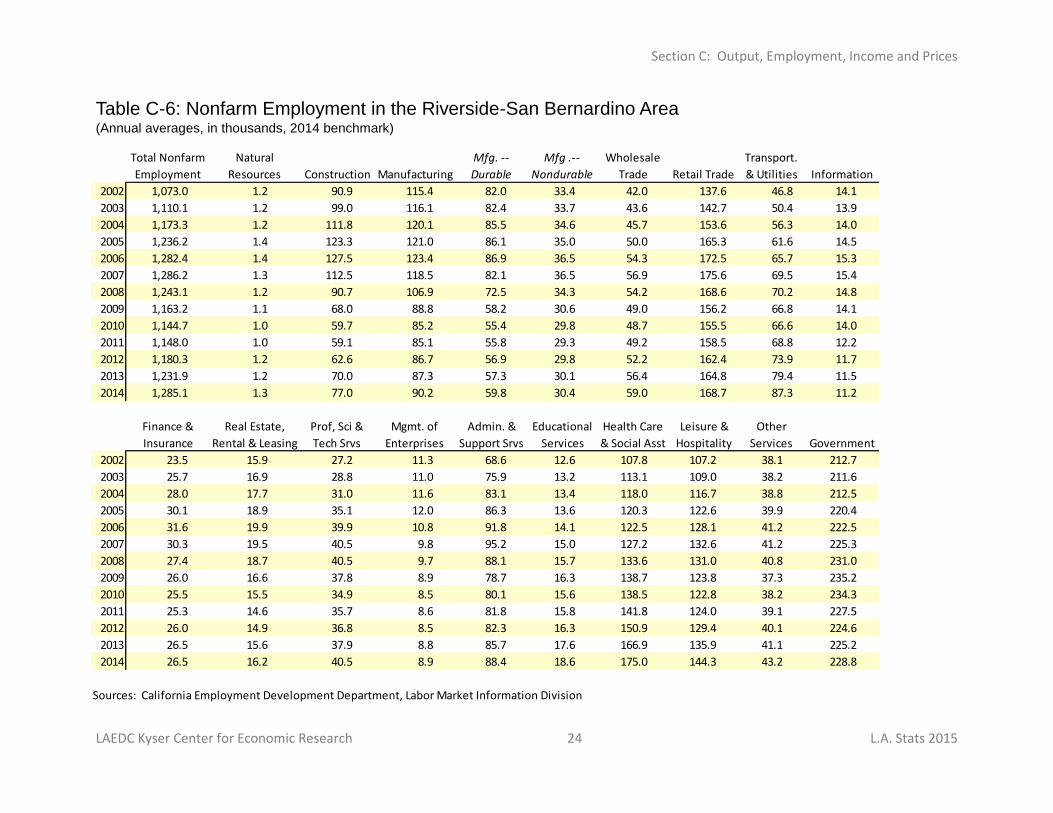
Construction Manufacturing Information
2002 1,073.0 1.2 90.9 115.4 82.0 33.4 42.0 137.6 46.8 14.1
2003 1,110.1 1.2 99.0 116.1 82.4 33.7 43.6 142.7 50.4 13.9
2004 1,173.3 1.2 111.8 120.1 85.5 34.6 45.7 153.6 56.3 14.0
2005 1,236.2 1.4 123.3 121.0 86.1 35.0 50.0 165.3 61.6 14.5
2006 1,282.4 1.4 127.5 123.4 86.9 36.5 54.3 172.5 65.7 15.3
2007 1,286.2 1.3 112.5 118.5 82.1 36.5 56.9 175.6 69.5 15.4
2008 1,243.1 1.2 90.7 106.9 72.5 34.3 54.2 168.6 70.2 14.8
2009 1,163.2 1.1 68.0 88.8 58.2 30.6 49.0 156.2 66.8 14.1
2010 1,144.7 1.0 59.7 85.2 55.4 29.8 48.7 155.5 66.6 14.0
2011 1,148.0 1.0 59.1 85.1 55.8 29.3 49.2 158.5 68.8 12.2
2012 1,180.3 1.2 62.6 86.7 56.9 29.8 52.2 162.4 73.9 11.7
2013 1,231.9 1.2 70.0 87.3 57.3 30.1 56.4 164.8 79.4 11.5
2014 1,285.1 1.3 77.0 90.2 59.8 30.4 59.0 168.7 87.3 11.2
Government
2002 23.5 15.9 27.2 11.3 68.6 12.6 107.8 107.2 38.1 212.7
2003 25.7 16.9 28.8 11.0 75.9 13.2 113.1 109.0 38.2 211.6
2004 28.0 17.7 31.0 11.6 83.1 13.4 118.0 116.7 38.8 212.5
2005 30.1 18.9 35.1 12.0 86.3 13.6 120.3 122.6 39.9 220.4
2006 31.6 19.9 39.9 10.8 91.8 14.1 122.5 128.1 41.2 222.5
2007 30.3 19.5 40.5 9.8 95.2 15.0 127.2 132.6 41.2 225.3
2008 27.4 18.7 40.5 9.7 88.1 15.7 133.6 131.0 40.8 231.0
2009 26.0 16.6 37.8 8.9 78.7 16.3 138.7 123.8 37.3 235.2
2010 25.5 15.5 34.9 8.5 80.1 15.6 138.5 122.8 38.2 234.3
2011 25.3 14.6 35.7 8.6 81.8 15.8 141.8 124.0 39.1 227.5
2012 26.0 14.9 36.8 8.5 82.3 16.3 150.9 129.4 40.1 224.6
2013 26.5 15.6 37.9 8.8 85.7 17.6 166.9 135.9 41.1 225.2
2014 26.5 16.2 40.5 8.9 88.4 18.6 175.0 144.3 43.2 228.8
Sources: California Employment Development Department, Labor Market Information Division
Educational
Services
Health Care
& Social Asst
Leisure &
Hospitality
Other
Services
Total Nonfarm
Employment
Natural
Resources
Mfg. --
Durable
Finance &
Insurance
Real Estate,
Rental & Leasing
Prof, Sci &
Tech Srvs
Mgmt. of
Enterprises
Admin. &
Support Srvs
Mfg .--
Nondurable
Wholesale
Trade Retail Trade
Transport.
& Utilities
Table C-6: Nonfarm Employment in the Riverside-San Bernardino Area (Annual averages, in thousands, 2014 benchmark)
Section C: Output, Employment, Income and Prices
LAEDC Kyser Center for Economic Research 25 L.A. Stats 2015
Construction Manufacturing Information
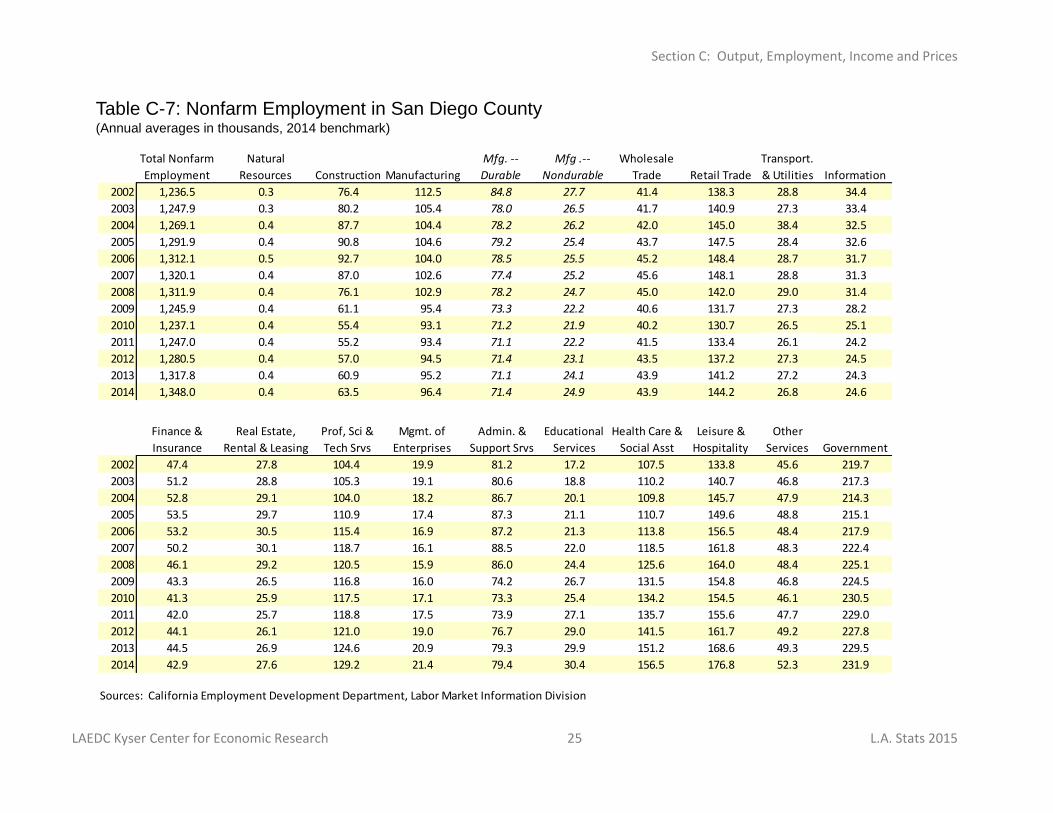
2002 1,236.5 0.3 76.4 112.5 84.8 27.7 41.4 138.3 28.8 34.4
2003 1,247.9 0.3 80.2 105.4 78.0 26.5 41.7 140.9 27.3 33.4
2004 1,269.1 0.4 87.7 104.4 78.2 26.2 42.0 145.0 38.4 32.5
2005 1,291.9 0.4 90.8 104.6 79.2 25.4 43.7 147.5 28.4 32.6
2006 1,312.1 0.5 92.7 104.0 78.5 25.5 45.2 148.4 28.7 31.7
2007 1,320.1 0.4 87.0 102.6 77.4 25.2 45.6 148.1 28.8 31.3
2008 1,311.9 0.4 76.1 102.9 78.2 24.7 45.0 142.0 29.0 31.4
2009 1,245.9 0.4 61.1 95.4 73.3 22.2 40.6 131.7 27.3 28.2
2010 1,237.1 0.4 55.4 93.1 71.2 21.9 40.2 130.7 26.5 25.1
2011 1,247.0 0.4 55.2 93.4 71.1 22.2 41.5 133.4 26.1 24.2
2012 1,280.5 0.4 57.0 94.5 71.4 23.1 43.5 137.2 27.3 24.5
2013 1,317.8 0.4 60.9 95.2 71.1 24.1 43.9 141.2 27.2 24.3
2014 1,348.0 0.4 63.5 96.4 71.4 24.9 43.9 144.2 26.8 24.6
Government
2002 47.4 27.8 104.4 19.9 81.2 17.2 107.5 133.8 45.6 219.7
2003 51.2 28.8 105.3 19.1 80.6 18.8 110.2 140.7 46.8 217.3
2004 52.8 29.1 104.0 18.2 86.7 20.1 109.8 145.7 47.9 214.3
2005 53.5 29.7 110.9 17.4 87.3 21.1 110.7 149.6 48.8 215.1
2006 53.2 30.5 115.4 16.9 87.2 21.3 113.8 156.5 48.4 217.9
2007 50.2 30.1 118.7 16.1 88.5 22.0 118.5 161.8 48.3 222.4
2008 46.1 29.2 120.5 15.9 86.0 24.4 125.6 164.0 48.4 225.1
2009 43.3 26.5 116.8 16.0 74.2 26.7 131.5 154.8 46.8 224.5
2010 41.3 25.9 117.5 17.1 73.3 25.4 134.2 154.5 46.1 230.5
2011 42.0 25.7 118.8 17.5 73.9 27.1 135.7 155.6 47.7 229.0
2012 44.1 26.1 121.0 19.0 76.7 29.0 141.5 161.7 49.2 227.8
2013 44.5 26.9 124.6 20.9 79.3 29.9 151.2 168.6 49.3 229.5
2014 42.9 27.6 129.2 21.4 79.4 30.4 156.5 176.8 52.3 231.9
Sources: California Employment Development Department, Labor Market Information Division
Retail Trade
Transport.
& Utilities
Finance &
Insurance
Real Estate,
Rental & Leasing
Prof, Sci &
Tech Srvs
Mgmt. of
Enterprises
Admin. &
Support Srvs
Educational
Services
Health Care &
Social Asst
Leisure &
Hospitality
Wholesale
Trade
Other
Services
Total Nonfarm
Employment
Natural
Resources
Mfg. --
Durable
Mfg .--
Nondurable
Table C-7: Nonfarm Employment in San Diego County (Annual averages in thousands, 2014 benchmark)
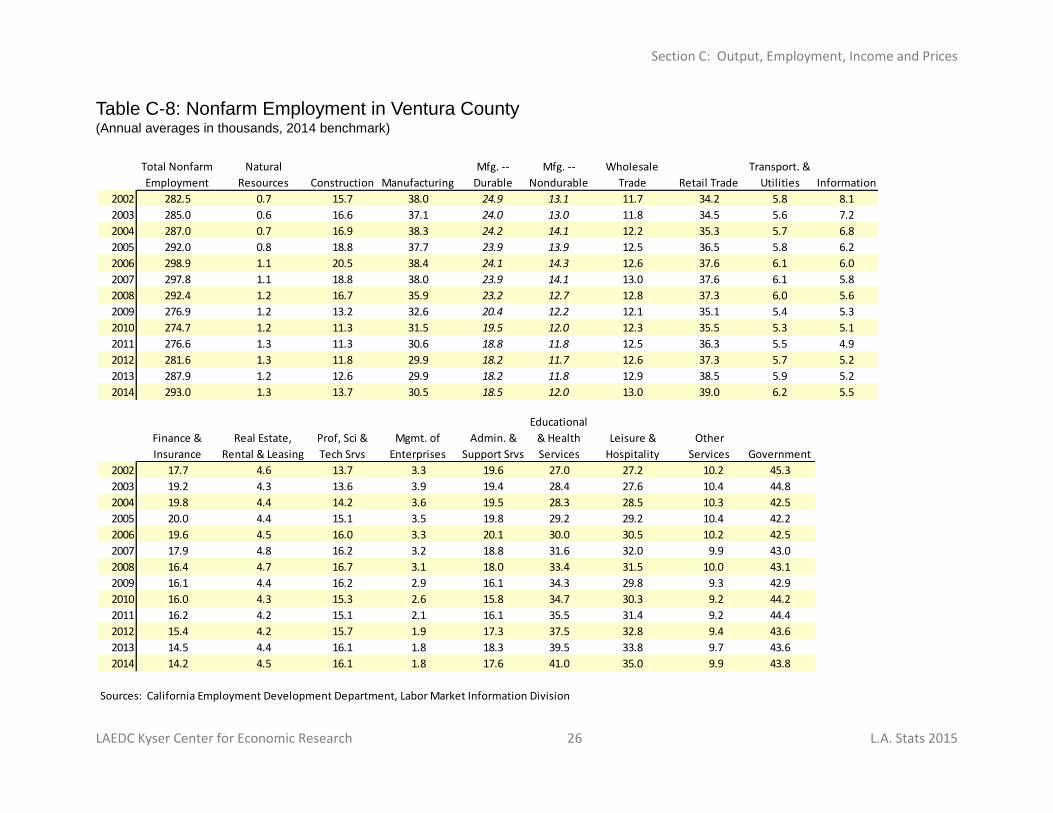
Section C: Output, Employment, Income and Prices
LAEDC Kyser Center for Economic Research 26 L.A. Stats 2015
Information
2002 282.5 0.7 15.7 38.0 24.9 13.1 11.7 34.2 5.8 8.1
2003 285.0 0.6 16.6 37.1 24.0 13.0 11.8 34.5 5.6 7.2
2004 287.0 0.7 16.9 38.3 24.2 14.1 12.2 35.3 5.7 6.8
2005 292.0 0.8 18.8 37.7 23.9 13.9 12.5 36.5 5.8 6.2
2006 298.9 1.1 20.5 38.4 24.1 14.3 12.6 37.6 6.1 6.0
2007 297.8 1.1 18.8 38.0 23.9 14.1 13.0 37.6 6.1 5.8
2008 292.4 1.2 16.7 35.9 23.2 12.7 12.8 37.3 6.0 5.6
2009 276.9 1.2 13.2 32.6 20.4 12.2 12.1 35.1 5.4 5.3
2010 274.7 1.2 11.3 31.5 19.5 12.0 12.3 35.5 5.3 5.1
2011 276.6 1.3 11.3 30.6 18.8 11.8 12.5 36.3 5.5 4.9
2012 281.6 1.3 11.8 29.9 18.2 11.7 12.6 37.3 5.7 5.2
2013 287.9 1.2 12.6 29.9 18.2 11.8 12.9 38.5 5.9 5.2
2014 293.0 1.3 13.7 30.5 18.5 12.0 13.0 39.0 6.2 5.5
Government
2002 17.7 4.6 13.7 3.3 19.6 27.0 27.2 10.2 45.3
2003 19.2 4.3 13.6 3.9 19.4 28.4 27.6 10.4 44.8
2004 19.8 4.4 14.2 3.6 19.5 28.3 28.5 10.3 42.5
2005 20.0 4.4 15.1 3.5 19.8 29.2 29.2 10.4 42.2
2006 19.6 4.5 16.0 3.3 20.1 30.0 30.5 10.2 42.5
2007 17.9 4.8 16.2 3.2 18.8 31.6 32.0 9.9 43.0
2008 16.4 4.7 16.7 3.1 18.0 33.4 31.5 10.0 43.1
2009 16.1 4.4 16.2 2.9 16.1 34.3 29.8 9.3 42.9
2010 16.0 4.3 15.3 2.6 15.8 34.7 30.3 9.2 44.2
2011 16.2 4.2 15.1 2.1 16.1 35.5 31.4 9.2 44.4
2012 15.4 4.2 15.7 1.9 17.3 37.5 32.8 9.4 43.6
2013 14.5 4.4 16.1 1.8 18.3 39.5 33.8 9.7 43.6
2014 14.2 4.5 16.1 1.8 17.6 41.0 35.0 9.9 43.8
Sources: California Employment Development Department, Labor Market Information Division
Mfg. --
Nondurable
Wholesale
Trade Retail Trade
Transport. &
Utilities
Total Nonfarm
Employment
Natural
Resources Construction Manufacturing
Mfg. --
Durable
Leisure &
Hospitality
Other
Services
Educational
& Health
Services
Finance &
Insurance
Real Estate,
Rental & Leasing
Prof, Sci &
Tech Srvs
Mgmt. of
Enterprises
Admin. &
Support Srvs
Table C-8: Nonfarm Employment in Ventura County (Annual averages in thousands, 2014 benchmark)
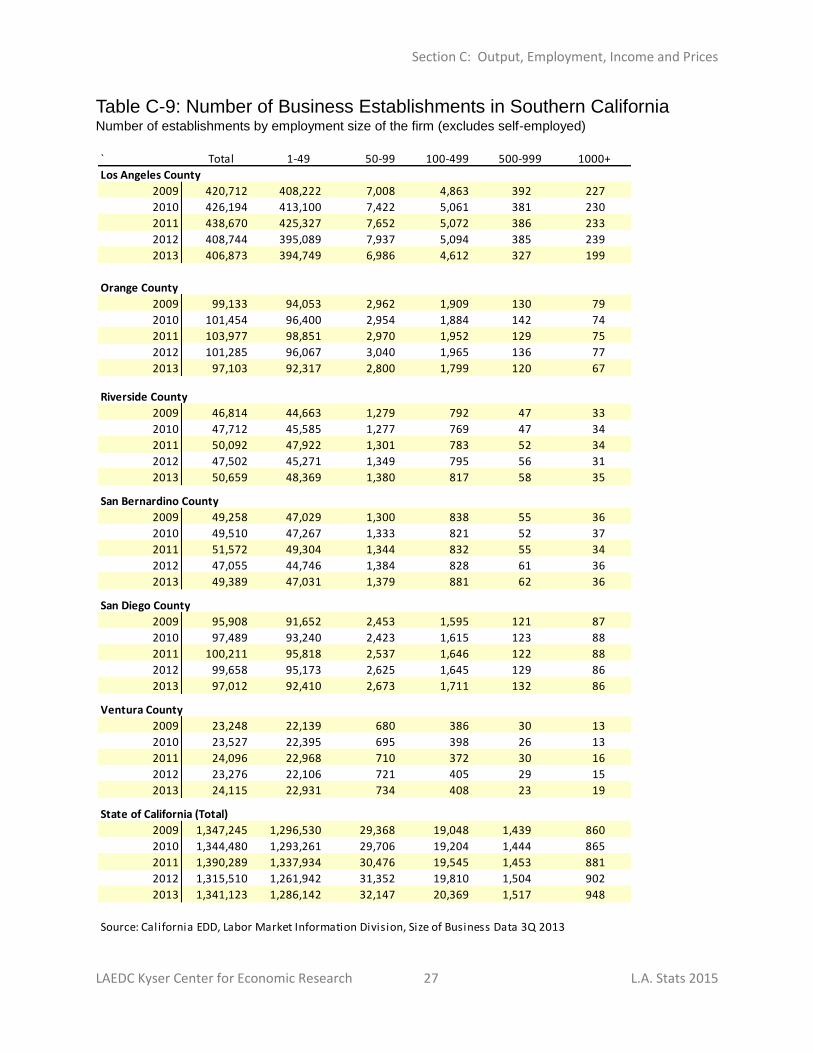
Section C: Output, Employment, Income and Prices
LAEDC Kyser Center for Economic Research 27 L.A. Stats 2015
` Total 1-49 50-99 100-499 500-999 1000+
Los Angeles County
2009 420,712 408,222 7,008 4,863 392 227
2010 426,194 413,100 7,422 5,061 381 230
2011 438,670 425,327 7,652 5,072 386 233
2012 408,744 395,089 7,937 5,094 385 239
2013 406,873 394,749 6,986 4,612 327 199
Orange County
2009 99,133 94,053 2,962 1,909 130 79
2010 101,454 96,400 2,954 1,884 142 74
2011 103,977 98,851 2,970 1,952 129 75
2012 101,285 96,067 3,040 1,965 136 77
2013 97,103 92,317 2,800 1,799 120 67
Riverside County
2009 46,814 44,663 1,279 792 47 33
2010 47,712 45,585 1,277 769 47 34
2011 50,092 47,922 1,301 783 52 34
2012 47,502 45,271 1,349 795 56 31
2013 50,659 48,369 1,380 817 58 35
San Bernardino County
2009 49,258 47,029 1,300 838 55 36
2010 49,510 47,267 1,333 821 52 37
2011 51,572 49,304 1,344 832 55 34
2012 47,055 44,746 1,384 828 61 36
2013 49,389 47,031 1,379 881 62 36
San Diego County
2009 95,908 91,652 2,453 1,595 121 87
2010 97,489 93,240 2,423 1,615 123 88
2011 100,211 95,818 2,537 1,646 122 88
2012 99,658 95,173 2,625 1,645 129 86
2013 97,012 92,410 2,673 1,711 132 86
Ventura County
2009 23,248 22,139 680 386 30 13
2010 23,527 22,395 695 398 26 13
2011 24,096 22,968 710 372 30 16
2012 23,276 22,106 721 405 29 15
2013 24,115 22,931 734 408 23 19
State of California (Total)
2009 1,347,245 1,296,530 29,368 19,048 1,439 860
2010 1,344,480 1,293,261 29,706 19,204 1,444 865
2011 1,390,289 1,337,934 30,476 19,545 1,453 881
2012 1,315,510 1,261,942 31,352 19,810 1,504 902
2013 1,341,123 1,286,142 32,147 20,369 1,517 948
Source: California EDD, Labor Market Information Division, Size of Business Data 3Q 2013
Table C-9: Number of Business Establishments in Southern California Number of establishments by employment size of the firm (excludes self-employed)
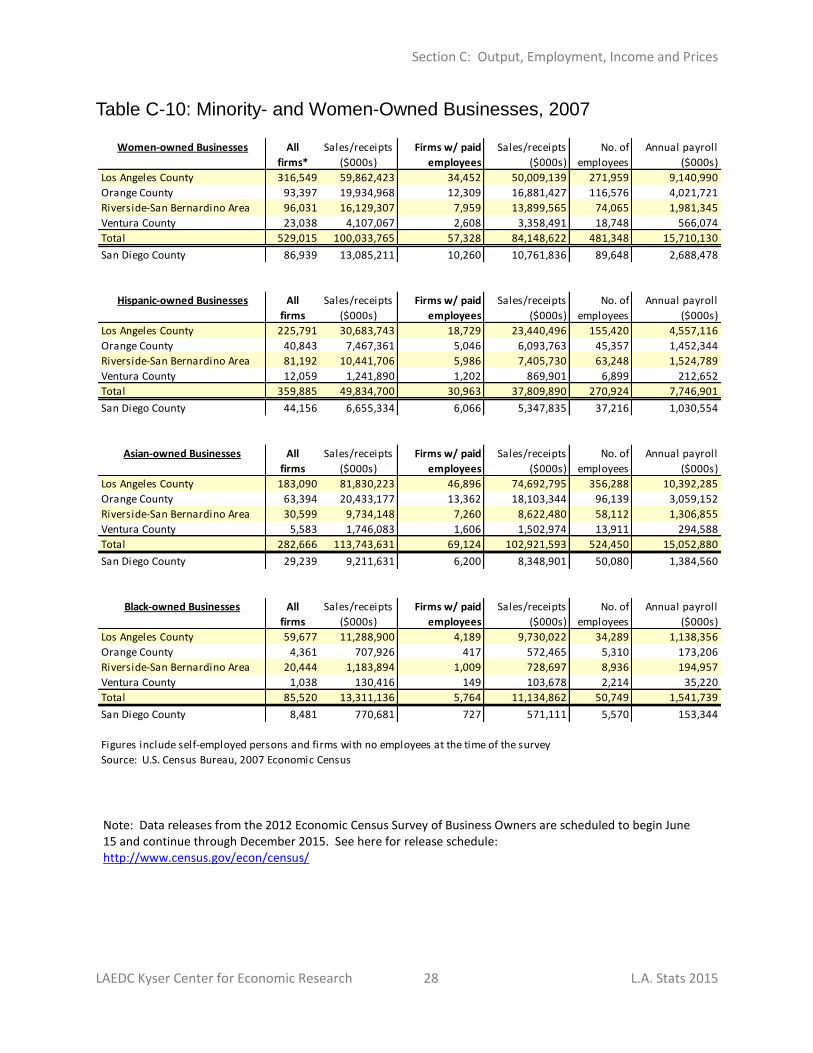
Section C: Output, Employment, Income and Prices
LAEDC Kyser Center for Economic Research 28 L.A. Stats 2015
Note: Data releases from the 2012 Economic Census Survey of Business Owners are scheduled to begin June 15 and continue through December 2015. See here for release schedule: http://www.census.gov/econ/census/
Table C-10: Minority- and Women-Owned Businesses, 2007
Women-owned Businesses All Sales/receipts Firms w/ paid Sales/receipts No. of Annual payroll
firms* ($000s) employees ($000s) employees ($000s)
Los Angeles County 316,549 59,862,423 34,452 50,009,139 271,959 9,140,990
Orange County 93,397 19,934,968 12,309 16,881,427 116,576 4,021,721
Riverside-San Bernardino Area 96,031 16,129,307 7,959 13,899,565 74,065 1,981,345
Ventura County 23,038 4,107,067 2,608 3,358,491 18,748 566,074
Total 529,015 100,033,765 57,328 84,148,622 481,348 15,710,130
San Diego County 86,939 13,085,211 10,260 10,761,836 89,648 2,688,478
Hispanic-owned Businesses All Sales/receipts Firms w/ paid Sales/receipts No. of Annual payroll
firms ($000s) employees ($000s) employees ($000s)
Los Angeles County 225,791 30,683,743 18,729 23,440,496 155,420 4,557,116
Orange County 40,843 7,467,361 5,046 6,093,763 45,357 1,452,344
Riverside-San Bernardino Area 81,192 10,441,706 5,986 7,405,730 63,248 1,524,789
Ventura County 12,059 1,241,890 1,202 869,901 6,899 212,652
Total 359,885 49,834,700 30,963 37,809,890 270,924 7,746,901
San Diego County 44,156 6,655,334 6,066 5,347,835 37,216 1,030,554
Asian-owned Businesses All Sales/receipts Firms w/ paid Sales/receipts No. of Annual payroll
firms ($000s) employees ($000s) employees ($000s)
Los Angeles County 183,090 81,830,223 46,896 74,692,795 356,288 10,392,285
Orange County 63,394 20,433,177 13,362 18,103,344 96,139 3,059,152
Riverside-San Bernardino Area 30,599 9,734,148 7,260 8,622,480 58,112 1,306,855
Ventura County 5,583 1,746,083 1,606 1,502,974 13,911 294,588
Total 282,666 113,743,631 69,124 102,921,593 524,450 15,052,880
San Diego County 29,239 9,211,631 6,200 8,348,901 50,080 1,384,560
Black-owned Businesses All Sales/receipts Firms w/ paid Sales/receipts No. of Annual payroll
firms ($000s) employees ($000s) employees ($000s)
Los Angeles County 59,677 11,288,900 4,189 9,730,022 34,289 1,138,356
Orange County 4,361 707,926 417 572,465 5,310 173,206
Riverside-San Bernardino Area 20,444 1,183,894 1,009 728,697 8,936 194,957
Ventura County 1,038 130,416 149 103,678 2,214 35,220
Total 85,520 13,311,136 5,764 11,134,862 50,749 1,541,739
San Diego County 8,481 770,681 727 571,111 5,570 153,344
Figures include self-employed persons and firms with no employees at the time of the survey
Source: U.S. Census Bureau, 2007 Economic Census
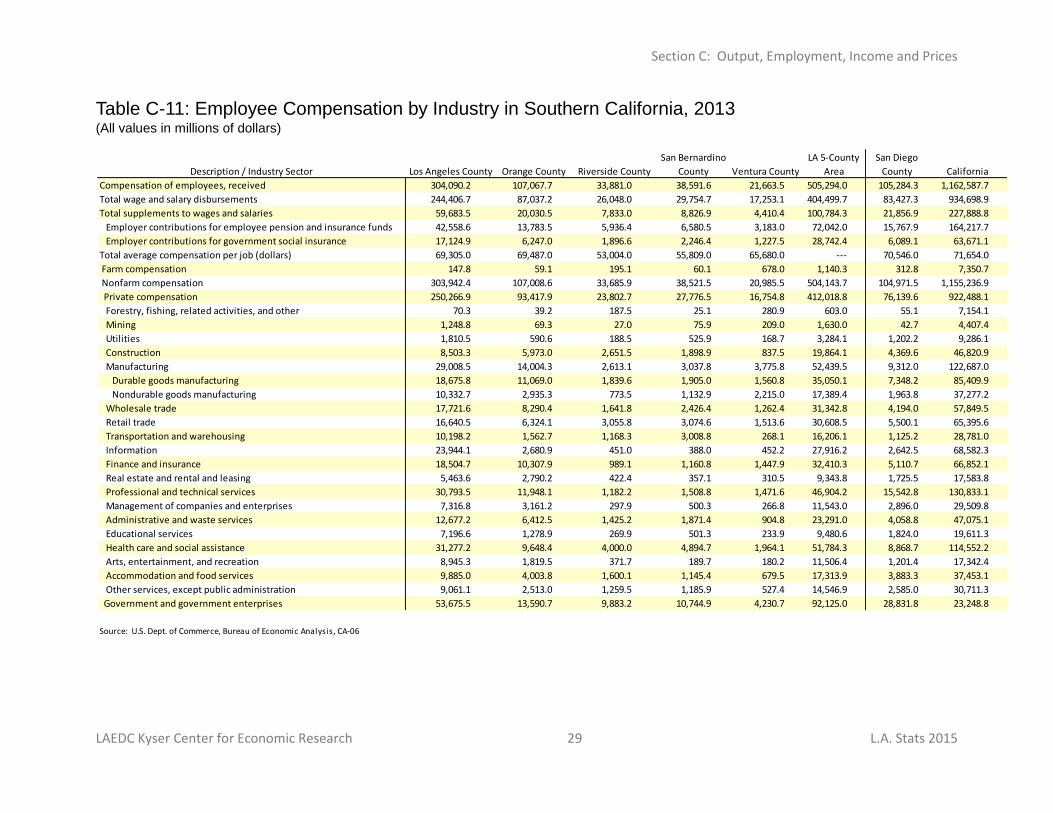
Section C: Output, Employment, Income and Prices
LAEDC Kyser Center for Economic Research 29 L.A. Stats 2015
Description / Industry Sector Los Angeles County Orange County Riverside County
San Bernardino
County Ventura County
LA 5-County
Area
San Diego
County California
Compensation of employees, received 304,090.2 107,067.7 33,881.0 38,591.6 21,663.5 505,294.0 105,284.3 1,162,587.7
Total wage and salary disbursements 244,406.7 87,037.2 26,048.0 29,754.7 17,253.1 404,499.7 83,427.3 934,698.9
Total supplements to wages and salaries 59,683.5 20,030.5 7,833.0 8,826.9 4,410.4 100,784.3 21,856.9 227,888.8
Employer contributions for employee pension and insurance funds 42,558.6 13,783.5 5,936.4 6,580.5 3,183.0 72,042.0 15,767.9 164,217.7
Employer contributions for government social insurance 17,124.9 6,247.0 1,896.6 2,246.4 1,227.5 28,742.4 6,089.1 63,671.1
Total average compensation per job (dollars) 69,305.0 69,487.0 53,004.0 55,809.0 65,680.0 --- 70,546.0 71,654.0
Farm compensation 147.8 59.1 195.1 60.1 678.0 1,140.3 312.8 7,350.7
Nonfarm compensation 303,942.4 107,008.6 33,685.9 38,521.5 20,985.5 504,143.7 104,971.5 1,155,236.9
Private compensation 250,266.9 93,417.9 23,802.7 27,776.5 16,754.8 412,018.8 76,139.6 922,488.1
Forestry, fishing, related activities, and other 70.3 39.2 187.5 25.1 280.9 603.0 55.1 7,154.1
Mining 1,248.8 69.3 27.0 75.9 209.0 1,630.0 42.7 4,407.4
Utilities 1,810.5 590.6 188.5 525.9 168.7 3,284.1 1,202.2 9,286.1
Construction 8,503.3 5,973.0 2,651.5 1,898.9 837.5 19,864.1 4,369.6 46,820.9
Manufacturing 29,008.5 14,004.3 2,613.1 3,037.8 3,775.8 52,439.5 9,312.0 122,687.0
Durable goods manufacturing 18,675.8 11,069.0 1,839.6 1,905.0 1,560.8 35,050.1 7,348.2 85,409.9
Nondurable goods manufacturing 10,332.7 2,935.3 773.5 1,132.9 2,215.0 17,389.4 1,963.8 37,277.2
Wholesale trade 17,721.6 8,290.4 1,641.8 2,426.4 1,262.4 31,342.8 4,194.0 57,849.5
Retail trade 16,640.5 6,324.1 3,055.8 3,074.6 1,513.6 30,608.5 5,500.1 65,395.6
Transportation and warehousing 10,198.2 1,562.7 1,168.3 3,008.8 268.1 16,206.1 1,125.2 28,781.0
Information 23,944.1 2,680.9 451.0 388.0 452.2 27,916.2 2,642.5 68,582.3
Finance and insurance 18,504.7 10,307.9 989.1 1,160.8 1,447.9 32,410.3 5,110.7 66,852.1
Real estate and rental and leasing 5,463.6 2,790.2 422.4 357.1 310.5 9,343.8 1,725.5 17,583.8
Professional and technical services 30,793.5 11,948.1 1,182.2 1,508.8 1,471.6 46,904.2 15,542.8 130,833.1
Management of companies and enterprises 7,316.8 3,161.2 297.9 500.3 266.8 11,543.0 2,896.0 29,509.8
Administrative and waste services 12,677.2 6,412.5 1,425.2 1,871.4 904.8 23,291.0 4,058.8 47,075.1
Educational services 7,196.6 1,278.9 269.9 501.3 233.9 9,480.6 1,824.0 19,611.3
Health care and social assistance 31,277.2 9,648.4 4,000.0 4,894.7 1,964.1 51,784.3 8,868.7 114,552.2
Arts, entertainment, and recreation 8,945.3 1,819.5 371.7 189.7 180.2 11,506.4 1,201.4 17,342.4
Accommodation and food services 9,885.0 4,003.8 1,600.1 1,145.4 679.5 17,313.9 3,883.3 37,453.1
Other services, except public administration 9,061.1 2,513.0 1,259.5 1,185.9 527.4 14,546.9 2,585.0 30,711.3
Government and government enterprises 53,675.5 13,590.7 9,883.2 10,744.9 4,230.7 92,125.0 28,831.8 23,248.8
Source: U.S. Dept. of Commerce, Bureau of Economic Analysis, CA-06
Table C-11: Employee Compensation by Industry in Southern California, 2013 (All values in millions of dollars)
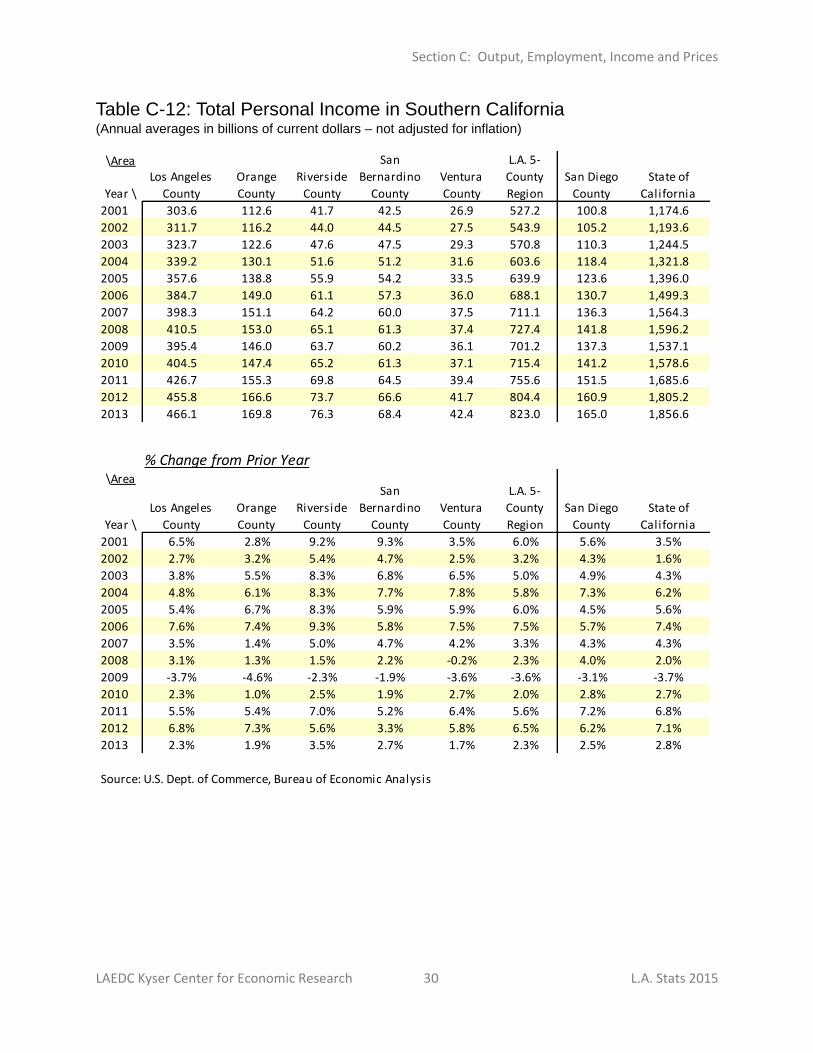
Section C: Output, Employment, Income and Prices
LAEDC Kyser Center for Economic Research 30 L.A. Stats 2015
\Area
Year \
2001 303.6 112.6 41.7 42.5 26.9 527.2 100.8 1,174.6
2002 311.7 116.2 44.0 44.5 27.5 543.9 105.2 1,193.6
2003 323.7 122.6 47.6 47.5 29.3 570.8 110.3 1,244.5
2004 339.2 130.1 51.6 51.2 31.6 603.6 118.4 1,321.8
2005 357.6 138.8 55.9 54.2 33.5 639.9 123.6 1,396.0
2006 384.7 149.0 61.1 57.3 36.0 688.1 130.7 1,499.3
2007 398.3 151.1 64.2 60.0 37.5 711.1 136.3 1,564.3
2008 410.5 153.0 65.1 61.3 37.4 727.4 141.8 1,596.2
2009 395.4 146.0 63.7 60.2 36.1 701.2 137.3 1,537.1
2010 404.5 147.4 65.2 61.3 37.1 715.4 141.2 1,578.6
2011 426.7 155.3 69.8 64.5 39.4 755.6 151.5 1,685.6
2012 455.8 166.6 73.7 66.6 41.7 804.4 160.9 1,805.2
2013 466.1 169.8 76.3 68.4 42.4 823.0 165.0 1,856.6
% Change from Prior Year\Area
Year \
Los Angeles
County
Orange
County
Riverside
County
San
Bernardino
County
Ventura
County
L.A. 5-
County
Region
San Diego
County
State of
California
2001 6.5% 2.8% 9.2% 9.3% 3.5% 6.0% 5.6% 3.5%
2002 2.7% 3.2% 5.4% 4.7% 2.5% 3.2% 4.3% 1.6%
2003 3.8% 5.5% 8.3% 6.8% 6.5% 5.0% 4.9% 4.3%
2004 4.8% 6.1% 8.3% 7.7% 7.8% 5.8% 7.3% 6.2%
2005 5.4% 6.7% 8.3% 5.9% 5.9% 6.0% 4.5% 5.6%
2006 7.6% 7.4% 9.3% 5.8% 7.5% 7.5% 5.7% 7.4%
2007 3.5% 1.4% 5.0% 4.7% 4.2% 3.3% 4.3% 4.3%
2008 3.1% 1.3% 1.5% 2.2% -0.2% 2.3% 4.0% 2.0%
2009 -3.7% -4.6% -2.3% -1.9% -3.6% -3.6% -3.1% -3.7%
2010 2.3% 1.0% 2.5% 1.9% 2.7% 2.0% 2.8% 2.7%
2011 5.5% 5.4% 7.0% 5.2% 6.4% 5.6% 7.2% 6.8%
2012 6.8% 7.3% 5.6% 3.3% 5.8% 6.5% 6.2% 7.1%
2013 2.3% 1.9% 3.5% 2.7% 1.7% 2.3% 2.5% 2.8%
Source: U.S. Dept. of Commerce, Bureau of Economic Analysis
San Diego
County
State of
California
Los Angeles
County
Orange
County
Riverside
County
San
Bernardino
County
Ventura
County
L.A. 5-
County
Region
Table C-12: Total Personal Income in Southern California (Annual averages in billions of current dollars – not adjusted for inflation)
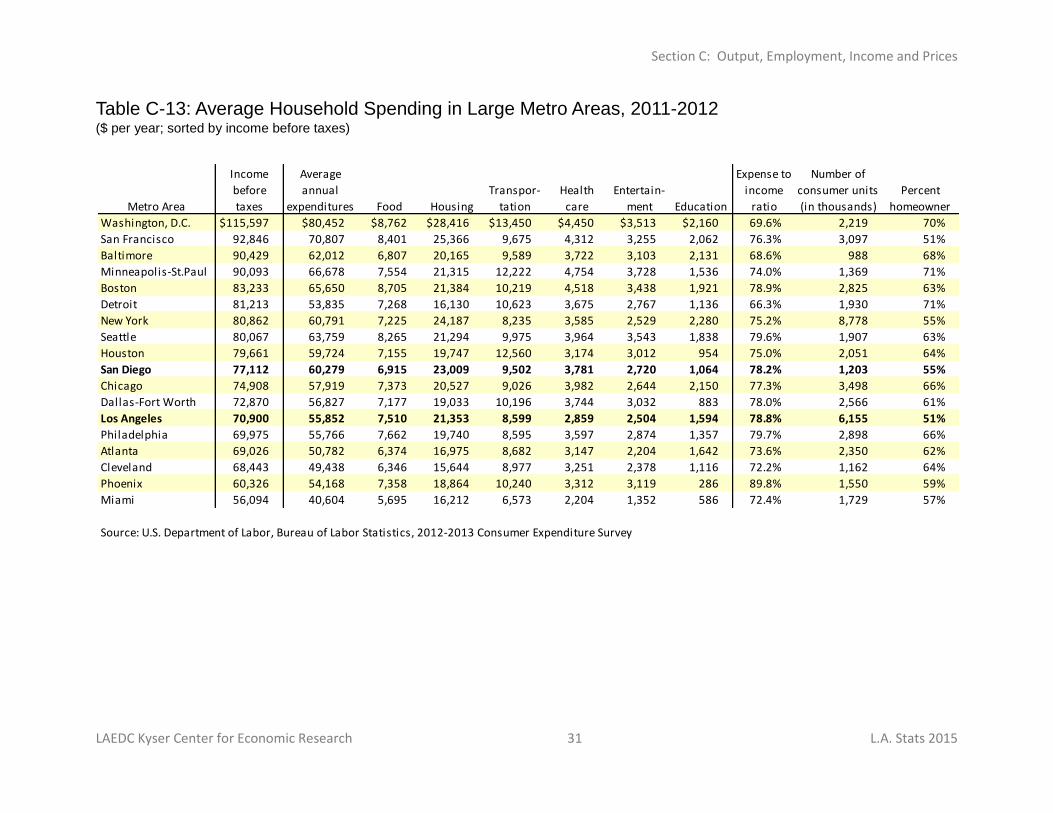
Section C: Output, Employment, Income and Prices
LAEDC Kyser Center for Economic Research 31 L.A. Stats 2015
Metro Area
Income
before
taxes
Average
annual
expenditures Food Housing
Transpor-
tation
Health
care
Entertain-
ment Education
Expense to
income
ratio
Number of
consumer units
(in thousands)
Percent
homeowner
Washington, D.C. $115,597 $80,452 $8,762 $28,416 $13,450 $4,450 $3,513 $2,160 69.6% 2,219 70%
San Francisco 92,846 70,807 8,401 25,366 9,675 4,312 3,255 2,062 76.3% 3,097 51%
Baltimore 90,429 62,012 6,807 20,165 9,589 3,722 3,103 2,131 68.6% 988 68%
Minneapolis-St.Paul 90,093 66,678 7,554 21,315 12,222 4,754 3,728 1,536 74.0% 1,369 71%
Boston 83,233 65,650 8,705 21,384 10,219 4,518 3,438 1,921 78.9% 2,825 63%
Detroit 81,213 53,835 7,268 16,130 10,623 3,675 2,767 1,136 66.3% 1,930 71%
New York 80,862 60,791 7,225 24,187 8,235 3,585 2,529 2,280 75.2% 8,778 55%
Seattle 80,067 63,759 8,265 21,294 9,975 3,964 3,543 1,838 79.6% 1,907 63%
Houston 79,661 59,724 7,155 19,747 12,560 3,174 3,012 954 75.0% 2,051 64%
San Diego 77,112 60,279 6,915 23,009 9,502 3,781 2,720 1,064 78.2% 1,203 55%
Chicago 74,908 57,919 7,373 20,527 9,026 3,982 2,644 2,150 77.3% 3,498 66%
Dallas-Fort Worth 72,870 56,827 7,177 19,033 10,196 3,744 3,032 883 78.0% 2,566 61%
Los Angeles 70,900 55,852 7,510 21,353 8,599 2,859 2,504 1,594 78.8% 6,155 51%
Philadelphia 69,975 55,766 7,662 19,740 8,595 3,597 2,874 1,357 79.7% 2,898 66%
Atlanta 69,026 50,782 6,374 16,975 8,682 3,147 2,204 1,642 73.6% 2,350 62%
Cleveland 68,443 49,438 6,346 15,644 8,977 3,251 2,378 1,116 72.2% 1,162 64%
Phoenix 60,326 54,168 7,358 18,864 10,240 3,312 3,119 286 89.8% 1,550 59%
Miami 56,094 40,604 5,695 16,212 6,573 2,204 1,352 586 72.4% 1,729 57%
Source: U.S. Department of Labor, Bureau of Labor Statistics, 2012-2013 Consumer Expenditure Survey
Table C-13: Average Household Spending in Large Metro Areas, 2011-2012 ($ per year; sorted by income before taxes)
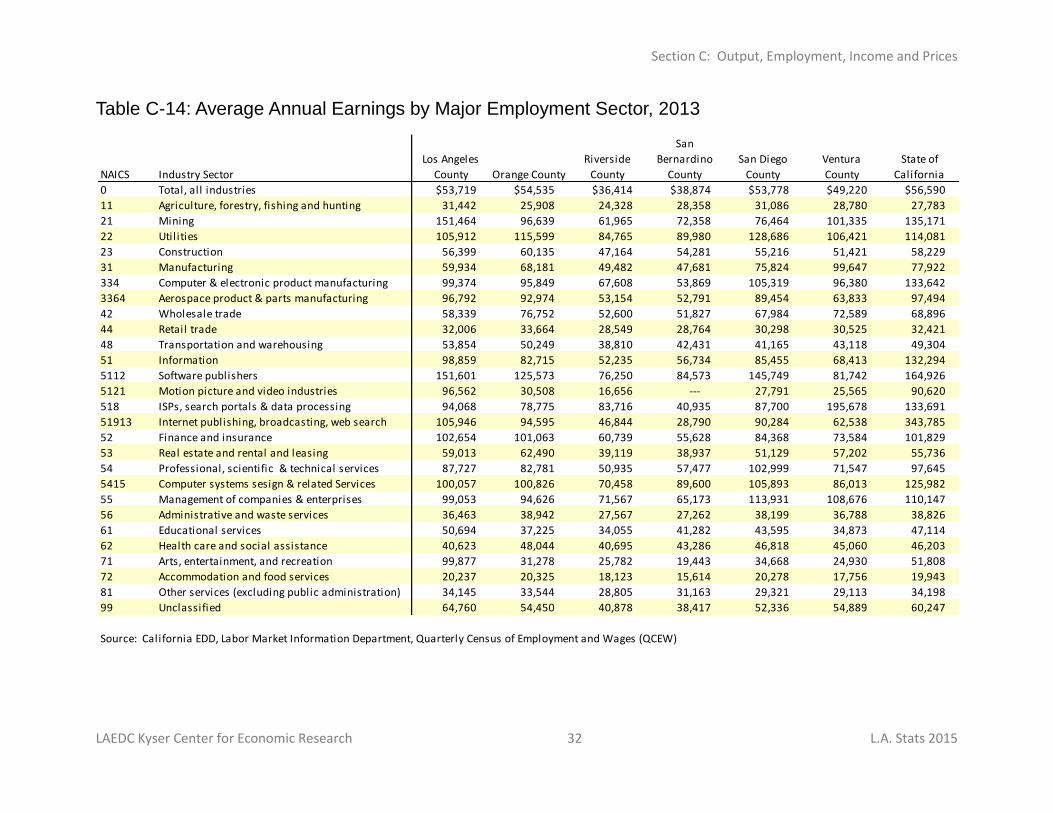
Section C: Output, Employment, Income and Prices
LAEDC Kyser Center for Economic Research 32 L.A. Stats 2015
NAICS Industry Sector
Los Angeles
County Orange County
Riverside
County
San
Bernardino
County
San Diego
County
Ventura
County
State of
California
0 Total, all industries $53,719 $54,535 $36,414 $38,874 $53,778 $49,220 $56,590
11 Agriculture, forestry, fishing and hunting 31,442 25,908 24,328 28,358 31,086 28,780 27,783
21 Mining 151,464 96,639 61,965 72,358 76,464 101,335 135,171
22 Utilities 105,912 115,599 84,765 89,980 128,686 106,421 114,081
23 Construction 56,399 60,135 47,164 54,281 55,216 51,421 58,229
31 Manufacturing 59,934 68,181 49,482 47,681 75,824 99,647 77,922
334 Computer & electronic product manufacturing 99,374 95,849 67,608 53,869 105,319 96,380 133,642
3364 Aerospace product & parts manufacturing 96,792 92,974 53,154 52,791 89,454 63,833 97,494
42 Wholesale trade 58,339 76,752 52,600 51,827 67,984 72,589 68,896
44 Retail trade 32,006 33,664 28,549 28,764 30,298 30,525 32,421
48 Transportation and warehousing 53,854 50,249 38,810 42,431 41,165 43,118 49,304
51 Information 98,859 82,715 52,235 56,734 85,455 68,413 132,294
5112 Software publishers 151,601 125,573 76,250 84,573 145,749 81,742 164,926
5121 Motion picture and video industries 96,562 30,508 16,656 --- 27,791 25,565 90,620
518 ISPs, search portals & data processing 94,068 78,775 83,716 40,935 87,700 195,678 133,691
51913 Internet publishing, broadcasting, web search 105,946 94,595 46,844 28,790 90,284 62,538 343,785
52 Finance and insurance 102,654 101,063 60,739 55,628 84,368 73,584 101,829
53 Real estate and rental and leasing 59,013 62,490 39,119 38,937 51,129 57,202 55,736
54 Professional, scientific & technical services 87,727 82,781 50,935 57,477 102,999 71,547 97,645
5415 Computer systems sesign & related Services 100,057 100,826 70,458 89,600 105,893 86,013 125,982
55 Management of companies & enterprises 99,053 94,626 71,567 65,173 113,931 108,676 110,147
56 Administrative and waste services 36,463 38,942 27,567 27,262 38,199 36,788 38,826
61 Educational services 50,694 37,225 34,055 41,282 43,595 34,873 47,114
62 Health care and social assistance 40,623 48,044 40,695 43,286 46,818 45,060 46,203
71 Arts, entertainment, and recreation 99,877 31,278 25,782 19,443 34,668 24,930 51,808
72 Accommodation and food services 20,237 20,325 18,123 15,614 20,278 17,756 19,943
81 Other services (excluding public administration) 34,145 33,544 28,805 31,163 29,321 29,113 34,198
99 Unclassified 64,760 54,450 40,878 38,417 52,336 54,889 60,247
Source: California EDD, Labor Market Information Department, Quarterly Census of Employment and Wages (QCEW)
Table C-14: Average Annual Earnings by Major Employment Sector, 2013
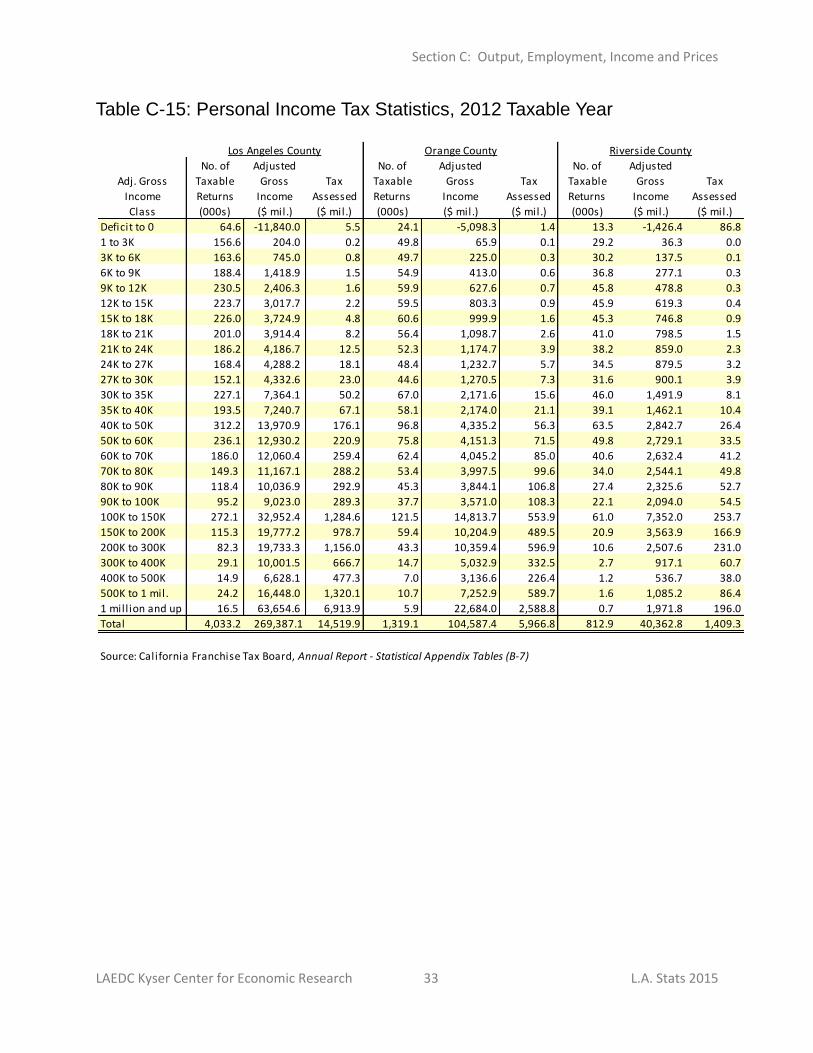
Section C: Output, Employment, Income and Prices
LAEDC Kyser Center for Economic Research 33 L.A. Stats 2015
No. of Adjusted No. of Adjusted No. of Adjusted
Adj. Gross Taxable Gross Tax Taxable Gross Tax Taxable Gross Tax
Income Returns Income Assessed Returns Income Assessed Returns Income Assessed
Class (000s) ($ mil.) ($ mil.) (000s) ($ mil.) ($ mil.) (000s) ($ mil.) ($ mil.)
Deficit to 0 64.6 -11,840.0 5.5 24.1 -5,098.3 1.4 13.3 -1,426.4 86.8
1 to 3K 156.6 204.0 0.2 49.8 65.9 0.1 29.2 36.3 0.0
3K to 6K 163.6 745.0 0.8 49.7 225.0 0.3 30.2 137.5 0.1
6K to 9K 188.4 1,418.9 1.5 54.9 413.0 0.6 36.8 277.1 0.3
9K to 12K 230.5 2,406.3 1.6 59.9 627.6 0.7 45.8 478.8 0.3
12K to 15K 223.7 3,017.7 2.2 59.5 803.3 0.9 45.9 619.3 0.4
15K to 18K 226.0 3,724.9 4.8 60.6 999.9 1.6 45.3 746.8 0.9
18K to 21K 201.0 3,914.4 8.2 56.4 1,098.7 2.6 41.0 798.5 1.5
21K to 24K 186.2 4,186.7 12.5 52.3 1,174.7 3.9 38.2 859.0 2.3
24K to 27K 168.4 4,288.2 18.1 48.4 1,232.7 5.7 34.5 879.5 3.2
27K to 30K 152.1 4,332.6 23.0 44.6 1,270.5 7.3 31.6 900.1 3.9
30K to 35K 227.1 7,364.1 50.2 67.0 2,171.6 15.6 46.0 1,491.9 8.1
35K to 40K 193.5 7,240.7 67.1 58.1 2,174.0 21.1 39.1 1,462.1 10.4
40K to 50K 312.2 13,970.9 176.1 96.8 4,335.2 56.3 63.5 2,842.7 26.4
50K to 60K 236.1 12,930.2 220.9 75.8 4,151.3 71.5 49.8 2,729.1 33.5
60K to 70K 186.0 12,060.4 259.4 62.4 4,045.2 85.0 40.6 2,632.4 41.2
70K to 80K 149.3 11,167.1 288.2 53.4 3,997.5 99.6 34.0 2,544.1 49.8
80K to 90K 118.4 10,036.9 292.9 45.3 3,844.1 106.8 27.4 2,325.6 52.7
90K to 100K 95.2 9,023.0 289.3 37.7 3,571.0 108.3 22.1 2,094.0 54.5
100K to 150K 272.1 32,952.4 1,284.6 121.5 14,813.7 553.9 61.0 7,352.0 253.7
150K to 200K 115.3 19,777.2 978.7 59.4 10,204.9 489.5 20.9 3,563.9 166.9
200K to 300K 82.3 19,733.3 1,156.0 43.3 10,359.4 596.9 10.6 2,507.6 231.0
300K to 400K 29.1 10,001.5 666.7 14.7 5,032.9 332.5 2.7 917.1 60.7
400K to 500K 14.9 6,628.1 477.3 7.0 3,136.6 226.4 1.2 536.7 38.0
500K to 1 mil. 24.2 16,448.0 1,320.1 10.7 7,252.9 589.7 1.6 1,085.2 86.4
1 mill ion and up 16.5 63,654.6 6,913.9 5.9 22,684.0 2,588.8 0.7 1,971.8 196.0
Total 4,033.2 269,387.1 14,519.9 1,319.1 104,587.4 5,966.8 812.9 40,362.8 1,409.3
Source: California Franchise Tax Board, Annual Report - Statistical Appendix Tables (B-7)
Los Angeles County Orange County Riverside County
Table C-15: Personal Income Tax Statistics, 2012 Taxable Year
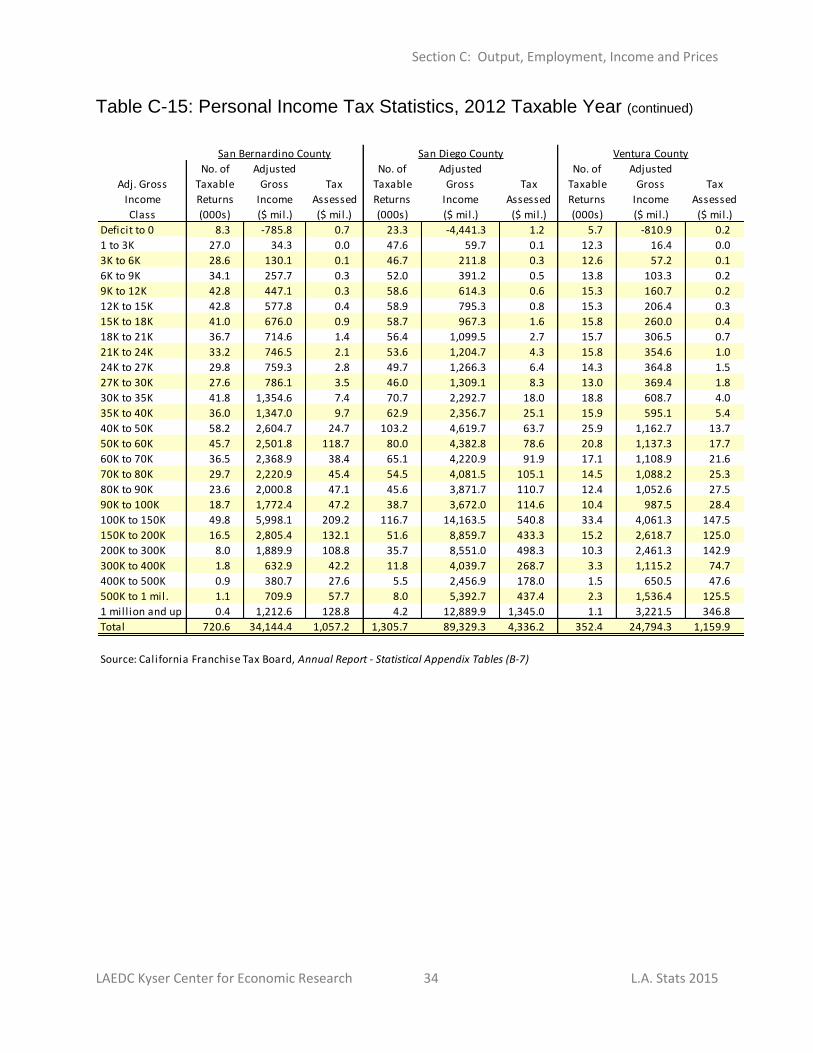
Section C: Output, Employment, Income and Prices
LAEDC Kyser Center for Economic Research 34 L.A. Stats 2015
No. of Adjusted No. of Adjusted No. of Adjusted
Adj. Gross Taxable Gross Tax Taxable Gross Tax Taxable Gross Tax
Income Returns Income Assessed Returns Income Assessed Returns Income Assessed
Class (000s) ($ mil.) ($ mil.) (000s) ($ mil.) ($ mil.) (000s) ($ mil.) ($ mil.)
Deficit to 0 8.3 -785.8 0.7 23.3 -4,441.3 1.2 5.7 -810.9 0.2
1 to 3K 27.0 34.3 0.0 47.6 59.7 0.1 12.3 16.4 0.0
3K to 6K 28.6 130.1 0.1 46.7 211.8 0.3 12.6 57.2 0.1
6K to 9K 34.1 257.7 0.3 52.0 391.2 0.5 13.8 103.3 0.2
9K to 12K 42.8 447.1 0.3 58.6 614.3 0.6 15.3 160.7 0.2
12K to 15K 42.8 577.8 0.4 58.9 795.3 0.8 15.3 206.4 0.3
15K to 18K 41.0 676.0 0.9 58.7 967.3 1.6 15.8 260.0 0.4
18K to 21K 36.7 714.6 1.4 56.4 1,099.5 2.7 15.7 306.5 0.7
21K to 24K 33.2 746.5 2.1 53.6 1,204.7 4.3 15.8 354.6 1.0
24K to 27K 29.8 759.3 2.8 49.7 1,266.3 6.4 14.3 364.8 1.5
27K to 30K 27.6 786.1 3.5 46.0 1,309.1 8.3 13.0 369.4 1.8
30K to 35K 41.8 1,354.6 7.4 70.7 2,292.7 18.0 18.8 608.7 4.0
35K to 40K 36.0 1,347.0 9.7 62.9 2,356.7 25.1 15.9 595.1 5.4
40K to 50K 58.2 2,604.7 24.7 103.2 4,619.7 63.7 25.9 1,162.7 13.7
50K to 60K 45.7 2,501.8 118.7 80.0 4,382.8 78.6 20.8 1,137.3 17.7
60K to 70K 36.5 2,368.9 38.4 65.1 4,220.9 91.9 17.1 1,108.9 21.6
70K to 80K 29.7 2,220.9 45.4 54.5 4,081.5 105.1 14.5 1,088.2 25.3
80K to 90K 23.6 2,000.8 47.1 45.6 3,871.7 110.7 12.4 1,052.6 27.5
90K to 100K 18.7 1,772.4 47.2 38.7 3,672.0 114.6 10.4 987.5 28.4
100K to 150K 49.8 5,998.1 209.2 116.7 14,163.5 540.8 33.4 4,061.3 147.5
150K to 200K 16.5 2,805.4 132.1 51.6 8,859.7 433.3 15.2 2,618.7 125.0
200K to 300K 8.0 1,889.9 108.8 35.7 8,551.0 498.3 10.3 2,461.3 142.9
300K to 400K 1.8 632.9 42.2 11.8 4,039.7 268.7 3.3 1,115.2 74.7
400K to 500K 0.9 380.7 27.6 5.5 2,456.9 178.0 1.5 650.5 47.6
500K to 1 mil. 1.1 709.9 57.7 8.0 5,392.7 437.4 2.3 1,536.4 125.5
1 mill ion and up 0.4 1,212.6 128.8 4.2 12,889.9 1,345.0 1.1 3,221.5 346.8
Total 720.6 34,144.4 1,057.2 1,305.7 89,329.3 4,336.2 352.4 24,794.3 1,159.9
Source: California Franchise Tax Board, Annual Report - Statistical Appendix Tables (B-7)
San Bernardino County San Diego County Ventura County
Table C-15: Personal Income Tax Statistics, 2012 Taxable Year (continued)
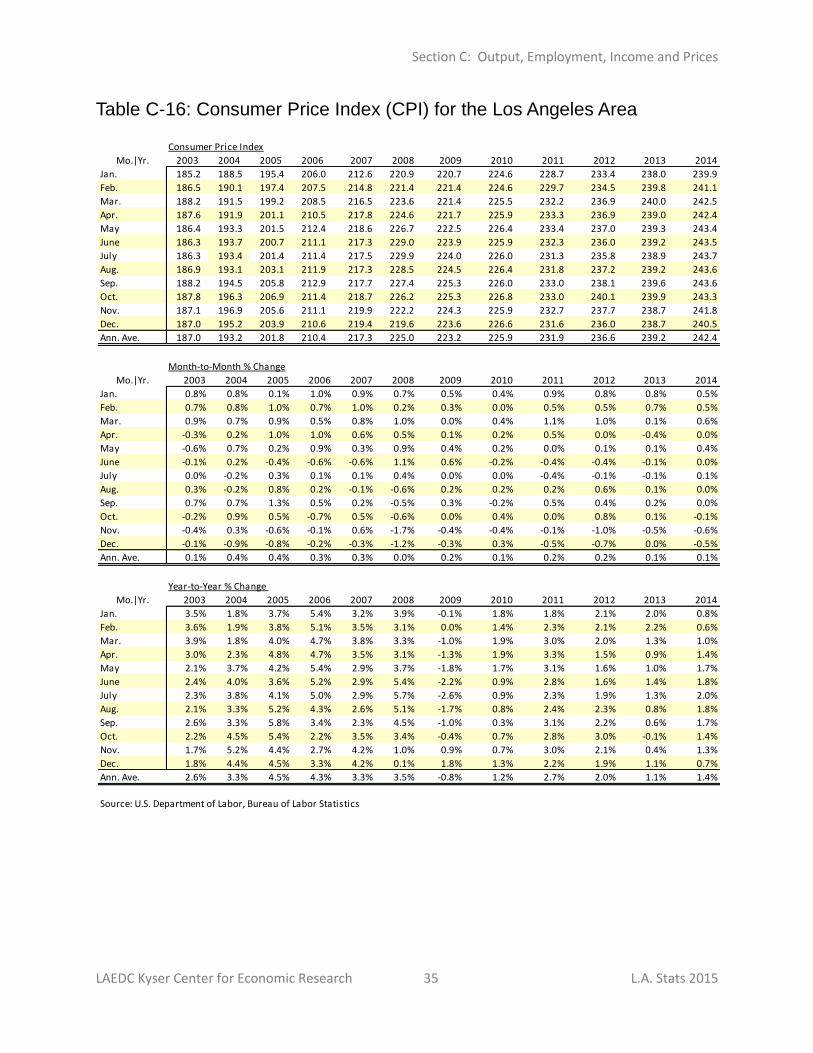
Section C: Output, Employment, Income and Prices
LAEDC Kyser Center for Economic Research 35 L.A. Stats 2015
Consumer Price Index
Mo.|Yr. 2003 2004 2005 2006 2007 2008 2009 2010 2011 2012 2013 2014
Jan. 185.2 188.5 195.4 206.0 212.6 220.9 220.7 224.6 228.7 233.4 238.0 239.9
Feb. 186.5 190.1 197.4 207.5 214.8 221.4 221.4 224.6 229.7 234.5 239.8 241.1
Mar. 188.2 191.5 199.2 208.5 216.5 223.6 221.4 225.5 232.2 236.9 240.0 242.5
Apr. 187.6 191.9 201.1 210.5 217.8 224.6 221.7 225.9 233.3 236.9 239.0 242.4
May 186.4 193.3 201.5 212.4 218.6 226.7 222.5 226.4 233.4 237.0 239.3 243.4
June 186.3 193.7 200.7 211.1 217.3 229.0 223.9 225.9 232.3 236.0 239.2 243.5
July 186.3 193.4 201.4 211.4 217.5 229.9 224.0 226.0 231.3 235.8 238.9 243.7
Aug. 186.9 193.1 203.1 211.9 217.3 228.5 224.5 226.4 231.8 237.2 239.2 243.6
Sep. 188.2 194.5 205.8 212.9 217.7 227.4 225.3 226.0 233.0 238.1 239.6 243.6
Oct. 187.8 196.3 206.9 211.4 218.7 226.2 225.3 226.8 233.0 240.1 239.9 243.3
Nov. 187.1 196.9 205.6 211.1 219.9 222.2 224.3 225.9 232.7 237.7 238.7 241.8
Dec. 187.0 195.2 203.9 210.6 219.4 219.6 223.6 226.6 231.6 236.0 238.7 240.5
Ann. Ave. 187.0 193.2 201.8 210.4 217.3 225.0 223.2 225.9 231.9 236.6 239.2 242.4
Month-to-Month % Change
Mo.|Yr. 2003 2004 2005 2006 2007 2008 2009 2010 2011 2012 2013 2014
Jan. 0.8% 0.8% 0.1% 1.0% 0.9% 0.7% 0.5% 0.4% 0.9% 0.8% 0.8% 0.5%
Feb. 0.7% 0.8% 1.0% 0.7% 1.0% 0.2% 0.3% 0.0% 0.5% 0.5% 0.7% 0.5%
Mar. 0.9% 0.7% 0.9% 0.5% 0.8% 1.0% 0.0% 0.4% 1.1% 1.0% 0.1% 0.6%
Apr. -0.3% 0.2% 1.0% 1.0% 0.6% 0.5% 0.1% 0.2% 0.5% 0.0% -0.4% 0.0%
May -0.6% 0.7% 0.2% 0.9% 0.3% 0.9% 0.4% 0.2% 0.0% 0.1% 0.1% 0.4%
June -0.1% 0.2% -0.4% -0.6% -0.6% 1.1% 0.6% -0.2% -0.4% -0.4% -0.1% 0.0%
July 0.0% -0.2% 0.3% 0.1% 0.1% 0.4% 0.0% 0.0% -0.4% -0.1% -0.1% 0.1%
Aug. 0.3% -0.2% 0.8% 0.2% -0.1% -0.6% 0.2% 0.2% 0.2% 0.6% 0.1% 0.0%
Sep. 0.7% 0.7% 1.3% 0.5% 0.2% -0.5% 0.3% -0.2% 0.5% 0.4% 0.2% 0.0%
Oct. -0.2% 0.9% 0.5% -0.7% 0.5% -0.6% 0.0% 0.4% 0.0% 0.8% 0.1% -0.1%
Nov. -0.4% 0.3% -0.6% -0.1% 0.6% -1.7% -0.4% -0.4% -0.1% -1.0% -0.5% -0.6%
Dec. -0.1% -0.9% -0.8% -0.2% -0.3% -1.2% -0.3% 0.3% -0.5% -0.7% 0.0% -0.5%
Ann. Ave. 0.1% 0.4% 0.4% 0.3% 0.3% 0.0% 0.2% 0.1% 0.2% 0.2% 0.1% 0.1%
Year-to-Year % Change
Mo.|Yr. 2003 2004 2005 2006 2007 2008 2009 2010 2011 2012 2013 2014
Jan. 3.5% 1.8% 3.7% 5.4% 3.2% 3.9% -0.1% 1.8% 1.8% 2.1% 2.0% 0.8%
Feb. 3.6% 1.9% 3.8% 5.1% 3.5% 3.1% 0.0% 1.4% 2.3% 2.1% 2.2% 0.6%
Mar. 3.9% 1.8% 4.0% 4.7% 3.8% 3.3% -1.0% 1.9% 3.0% 2.0% 1.3% 1.0%
Apr. 3.0% 2.3% 4.8% 4.7% 3.5% 3.1% -1.3% 1.9% 3.3% 1.5% 0.9% 1.4%
May 2.1% 3.7% 4.2% 5.4% 2.9% 3.7% -1.8% 1.7% 3.1% 1.6% 1.0% 1.7%
June 2.4% 4.0% 3.6% 5.2% 2.9% 5.4% -2.2% 0.9% 2.8% 1.6% 1.4% 1.8%
July 2.3% 3.8% 4.1% 5.0% 2.9% 5.7% -2.6% 0.9% 2.3% 1.9% 1.3% 2.0%
Aug. 2.1% 3.3% 5.2% 4.3% 2.6% 5.1% -1.7% 0.8% 2.4% 2.3% 0.8% 1.8%
Sep. 2.6% 3.3% 5.8% 3.4% 2.3% 4.5% -1.0% 0.3% 3.1% 2.2% 0.6% 1.7%
Oct. 2.2% 4.5% 5.4% 2.2% 3.5% 3.4% -0.4% 0.7% 2.8% 3.0% -0.1% 1.4%
Nov. 1.7% 5.2% 4.4% 2.7% 4.2% 1.0% 0.9% 0.7% 3.0% 2.1% 0.4% 1.3%
Dec. 1.8% 4.4% 4.5% 3.3% 4.2% 0.1% 1.8% 1.3% 2.2% 1.9% 1.1% 0.7%
Ann. Ave. 2.6% 3.3% 4.5% 4.3% 3.3% 3.5% -0.8% 1.2% 2.7% 2.0% 1.1% 1.4%
Source: U.S. Department of Labor, Bureau of Labor Statistics
Table C-16: Consumer Price Index (CPI) for the Los Angeles Area
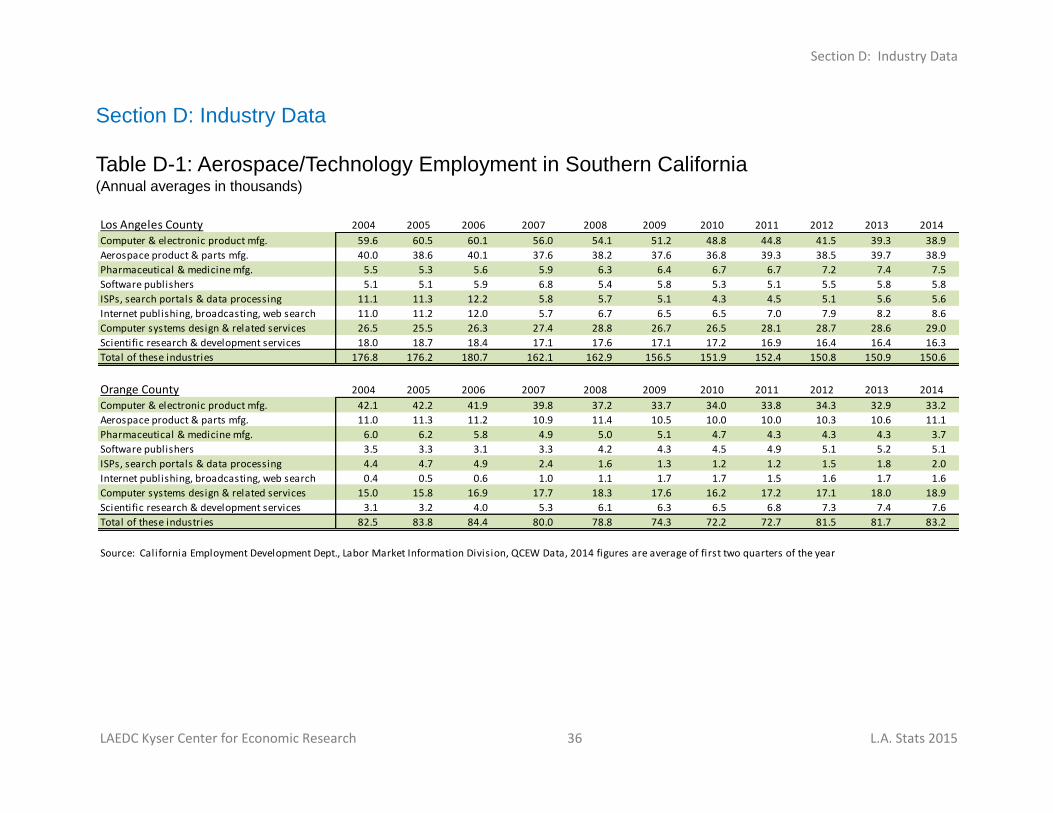
Section D: Industry Data
LAEDC Kyser Center for Economic Research 36 L.A. Stats 2015
Los Angeles County 2004 2005 2006 2007 2008 2009 2010 2011 2012 2013 2014
Computer & electronic product mfg. 59.6 60.5 60.1 56.0 54.1 51.2 48.8 44.8 41.5 39.3 38.9
Aerospace product & parts mfg. 40.0 38.6 40.1 37.6 38.2 37.6 36.8 39.3 38.5 39.7 38.9
Pharmaceutical & medicine mfg. 5.5 5.3 5.6 5.9 6.3 6.4 6.7 6.7 7.2 7.4 7.5
Software publishers 5.1 5.1 5.9 6.8 5.4 5.8 5.3 5.1 5.5 5.8 5.8
ISPs, search portals & data processing 11.1 11.3 12.2 5.8 5.7 5.1 4.3 4.5 5.1 5.6 5.6
Internet publishing, broadcasting, web search 11.0 11.2 12.0 5.7 6.7 6.5 6.5 7.0 7.9 8.2 8.6
Computer systems design & related services 26.5 25.5 26.3 27.4 28.8 26.7 26.5 28.1 28.7 28.6 29.0
Scientific research & development services 18.0 18.7 18.4 17.1 17.6 17.1 17.2 16.9 16.4 16.4 16.3
Total of these industries 176.8 176.2 180.7 162.1 162.9 156.5 151.9 152.4 150.8 150.9 150.6
Orange County 2004 2005 2006 2007 2008 2009 2010 2011 2012 2013 2014
Computer & electronic product mfg. 42.1 42.2 41.9 39.8 37.2 33.7 34.0 33.8 34.3 32.9 33.2
Aerospace product & parts mfg. 11.0 11.3 11.2 10.9 11.4 10.5 10.0 10.0 10.3 10.6 11.1
Pharmaceutical & medicine mfg. 6.0 6.2 5.8 4.9 5.0 5.1 4.7 4.3 4.3 4.3 3.7
Software publishers 3.5 3.3 3.1 3.3 4.2 4.3 4.5 4.9 5.1 5.2 5.1
ISPs, search portals & data processing 4.4 4.7 4.9 2.4 1.6 1.3 1.2 1.2 1.5 1.8 2.0
Internet publishing, broadcasting, web search 0.4 0.5 0.6 1.0 1.1 1.7 1.7 1.5 1.6 1.7 1.6
Computer systems design & related services 15.0 15.8 16.9 17.7 18.3 17.6 16.2 17.2 17.1 18.0 18.9
Scientific research & development services 3.1 3.2 4.0 5.3 6.1 6.3 6.5 6.8 7.3 7.4 7.6
Total of these industries 82.5 83.8 84.4 80.0 78.8 74.3 72.2 72.7 81.5 81.7 83.2
Source: California Employment Development Dept., Labor Market Information Division, QCEW Data, 2014 figures are average of first two quarters of the year
Section D: Industry Data
Table D-1: Aerospace/Technology Employment in Southern California (Annual averages in thousands)
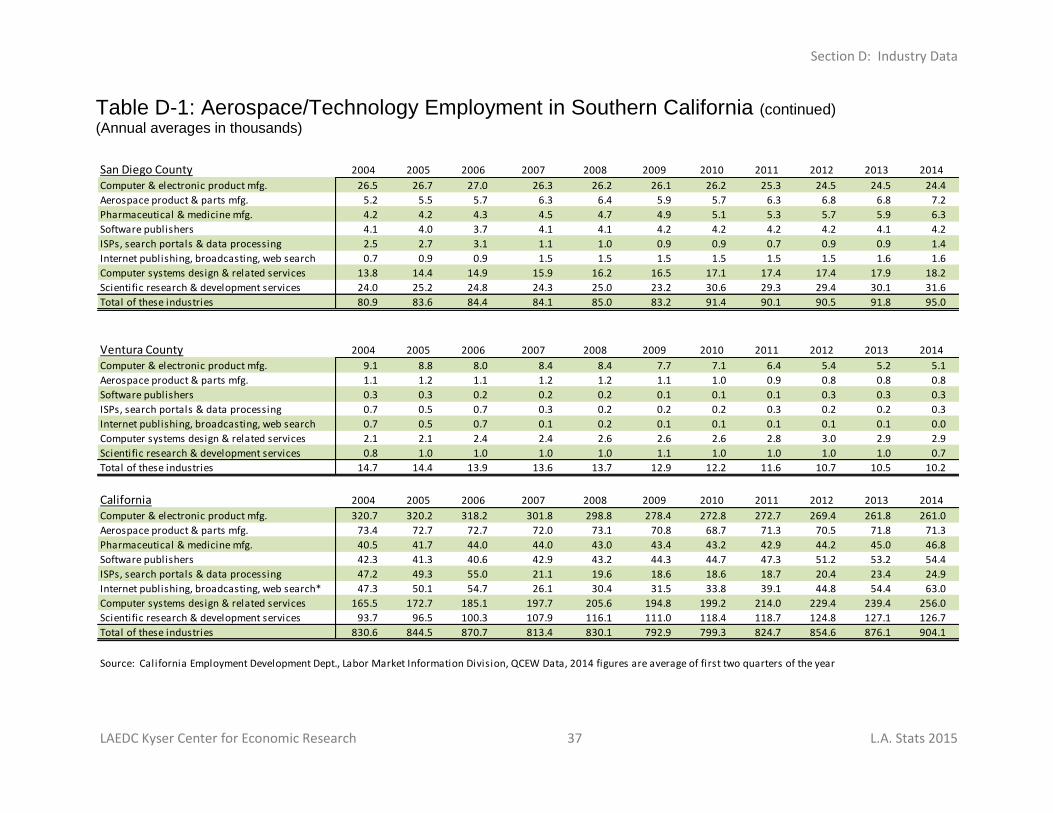
Section D: Industry Data
LAEDC Kyser Center for Economic Research 37 L.A. Stats 2015
San Diego County 2004 2005 2006 2007 2008 2009 2010 2011 2012 2013 2014
Computer & electronic product mfg. 26.5 26.7 27.0 26.3 26.2 26.1 26.2 25.3 24.5 24.5 24.4
Aerospace product & parts mfg. 5.2 5.5 5.7 6.3 6.4 5.9 5.7 6.3 6.8 6.8 7.2
Pharmaceutical & medicine mfg. 4.2 4.2 4.3 4.5 4.7 4.9 5.1 5.3 5.7 5.9 6.3
Software publishers 4.1 4.0 3.7 4.1 4.1 4.2 4.2 4.2 4.2 4.1 4.2
ISPs, search portals & data processing 2.5 2.7 3.1 1.1 1.0 0.9 0.9 0.7 0.9 0.9 1.4
Internet publishing, broadcasting, web search 0.7 0.9 0.9 1.5 1.5 1.5 1.5 1.5 1.5 1.6 1.6
Computer systems design & related services 13.8 14.4 14.9 15.9 16.2 16.5 17.1 17.4 17.4 17.9 18.2
Scientific research & development services 24.0 25.2 24.8 24.3 25.0 23.2 30.6 29.3 29.4 30.1 31.6
Total of these industries 80.9 83.6 84.4 84.1 85.0 83.2 91.4 90.1 90.5 91.8 95.0
Ventura County 2004 2005 2006 2007 2008 2009 2010 2011 2012 2013 2014
Computer & electronic product mfg. 9.1 8.8 8.0 8.4 8.4 7.7 7.1 6.4 5.4 5.2 5.1
Aerospace product & parts mfg. 1.1 1.2 1.1 1.2 1.2 1.1 1.0 0.9 0.8 0.8 0.8
Software publishers 0.3 0.3 0.2 0.2 0.2 0.1 0.1 0.1 0.3 0.3 0.3
ISPs, search portals & data processing 0.7 0.5 0.7 0.3 0.2 0.2 0.2 0.3 0.2 0.2 0.3
Internet publishing, broadcasting, web search 0.7 0.5 0.7 0.1 0.2 0.1 0.1 0.1 0.1 0.1 0.0
Computer systems design & related services 2.1 2.1 2.4 2.4 2.6 2.6 2.6 2.8 3.0 2.9 2.9
Scientific research & development services 0.8 1.0 1.0 1.0 1.0 1.1 1.0 1.0 1.0 1.0 0.7
Total of these industries 14.7 14.4 13.9 13.6 13.7 12.9 12.2 11.6 10.7 10.5 10.2
California 2004 2005 2006 2007 2008 2009 2010 2011 2012 2013 2014
Computer & electronic product mfg. 320.7 320.2 318.2 301.8 298.8 278.4 272.8 272.7 269.4 261.8 261.0
Aerospace product & parts mfg. 73.4 72.7 72.7 72.0 73.1 70.8 68.7 71.3 70.5 71.8 71.3
Pharmaceutical & medicine mfg. 40.5 41.7 44.0 44.0 43.0 43.4 43.2 42.9 44.2 45.0 46.8
Software publishers 42.3 41.3 40.6 42.9 43.2 44.3 44.7 47.3 51.2 53.2 54.4
ISPs, search portals & data processing 47.2 49.3 55.0 21.1 19.6 18.6 18.6 18.7 20.4 23.4 24.9
Internet publishing, broadcasting, web search* 47.3 50.1 54.7 26.1 30.4 31.5 33.8 39.1 44.8 54.4 63.0
Computer systems design & related services 165.5 172.7 185.1 197.7 205.6 194.8 199.2 214.0 229.4 239.4 256.0
Scientific research & development services 93.7 96.5 100.3 107.9 116.1 111.0 118.4 118.7 124.8 127.1 126.7
Total of these industries 830.6 844.5 870.7 813.4 830.1 792.9 799.3 824.7 854.6 876.1 904.1
Source: California Employment Development Dept., Labor Market Information Division, QCEW Data, 2014 figures are average of first two quarters of the year
Table D-1: Aerospace/Technology Employment in Southern California (continued)
(Annual averages in thousands)
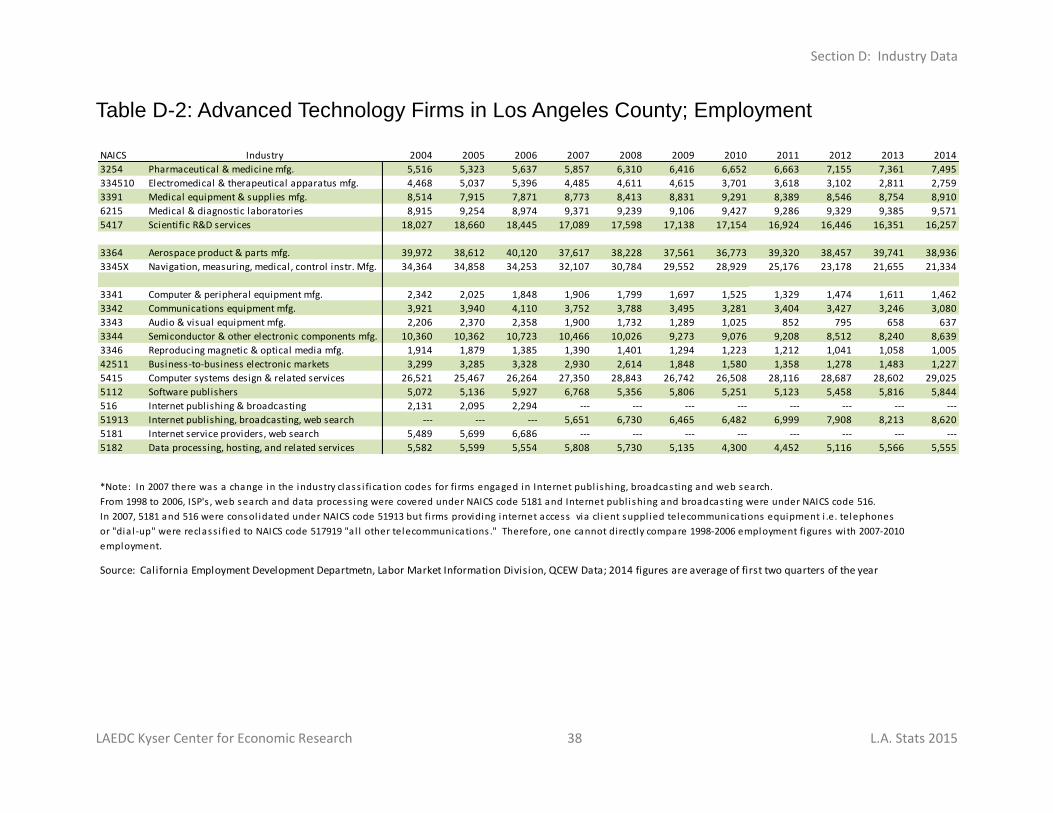
Section D: Industry Data
LAEDC Kyser Center for Economic Research 38 L.A. Stats 2015
NAICS Industry 2004 2005 2006 2007 2008 2009 2010 2011 2012 2013 2014
3254 Pharmaceutical & medicine mfg. 5,516 5,323 5,637 5,857 6,310 6,416 6,652 6,663 7,155 7,361 7,495
334510 Electromedical & therapeutical apparatus mfg. 4,468 5,037 5,396 4,485 4,611 4,615 3,701 3,618 3,102 2,811 2,759
3391 Medical equipment & supplies mfg. 8,514 7,915 7,871 8,773 8,413 8,831 9,291 8,389 8,546 8,754 8,910
6215 Medical & diagnostic laboratories 8,915 9,254 8,974 9,371 9,239 9,106 9,427 9,286 9,329 9,385 9,571
5417 Scientific R&D services 18,027 18,660 18,445 17,089 17,598 17,138 17,154 16,924 16,446 16,351 16,257
3364 Aerospace product & parts mfg. 39,972 38,612 40,120 37,617 38,228 37,561 36,773 39,320 38,457 39,741 38,936
3345X Navigation, measuring, medical, control instr. Mfg. 34,364 34,858 34,253 32,107 30,784 29,552 28,929 25,176 23,178 21,655 21,334
3341 Computer & peripheral equipment mfg. 2,342 2,025 1,848 1,906 1,799 1,697 1,525 1,329 1,474 1,611 1,462
3342 Communications equipment mfg. 3,921 3,940 4,110 3,752 3,788 3,495 3,281 3,404 3,427 3,246 3,080
3343 Audio & visual equipment mfg. 2,206 2,370 2,358 1,900 1,732 1,289 1,025 852 795 658 637
3344 Semiconductor & other electronic components mfg. 10,360 10,362 10,723 10,466 10,026 9,273 9,076 9,208 8,512 8,240 8,639
3346 Reproducing magnetic & optical media mfg. 1,914 1,879 1,385 1,390 1,401 1,294 1,223 1,212 1,041 1,058 1,005
42511 Business-to-business electronic markets 3,299 3,285 3,328 2,930 2,614 1,848 1,580 1,358 1,278 1,483 1,227
5415 Computer systems design & related services 26,521 25,467 26,264 27,350 28,843 26,742 26,508 28,116 28,687 28,602 29,025
5112 Software publishers 5,072 5,136 5,927 6,768 5,356 5,806 5,251 5,123 5,458 5,816 5,844
516 Internet publishing & broadcasting 2,131 2,095 2,294 --- --- --- --- --- --- --- ---
51913 Internet publishing, broadcasting, web search --- --- --- 5,651 6,730 6,465 6,482 6,999 7,908 8,213 8,620
5181 Internet service providers, web search 5,489 5,699 6,686 --- --- --- --- --- --- --- ---
5182 Data processing, hosting, and related services 5,582 5,599 5,554 5,808 5,730 5,135 4,300 4,452 5,116 5,566 5,555
*Note: In 2007 there was a change in the industry class i fication codes for fi rms engaged in Internet publ ishing, broadcasting and web search.
From 1998 to 2006, ISP's , web search and data process ing were covered under NAICS code 5181 and Internet publ ishing and broadcasting were under NAICS code 516.
In 2007, 5181 and 516 were consol idated under NAICS code 51913 but fi rms providing internet access via cl ient suppl ied telecommunications equipment i .e. telephones
or "dia l -up" were reclass i fied to NAICS code 517919 "al l other telecommunications ." Therefore, one cannot directly compare 1998-2006 employment figures with 2007-2010
employment.
Source: California Employment Development Departmetn, Labor Market Information Division, QCEW Data; 2014 figures are average of first two quarters of the year
Table D-2: Advanced Technology Firms in Los Angeles County; Employment
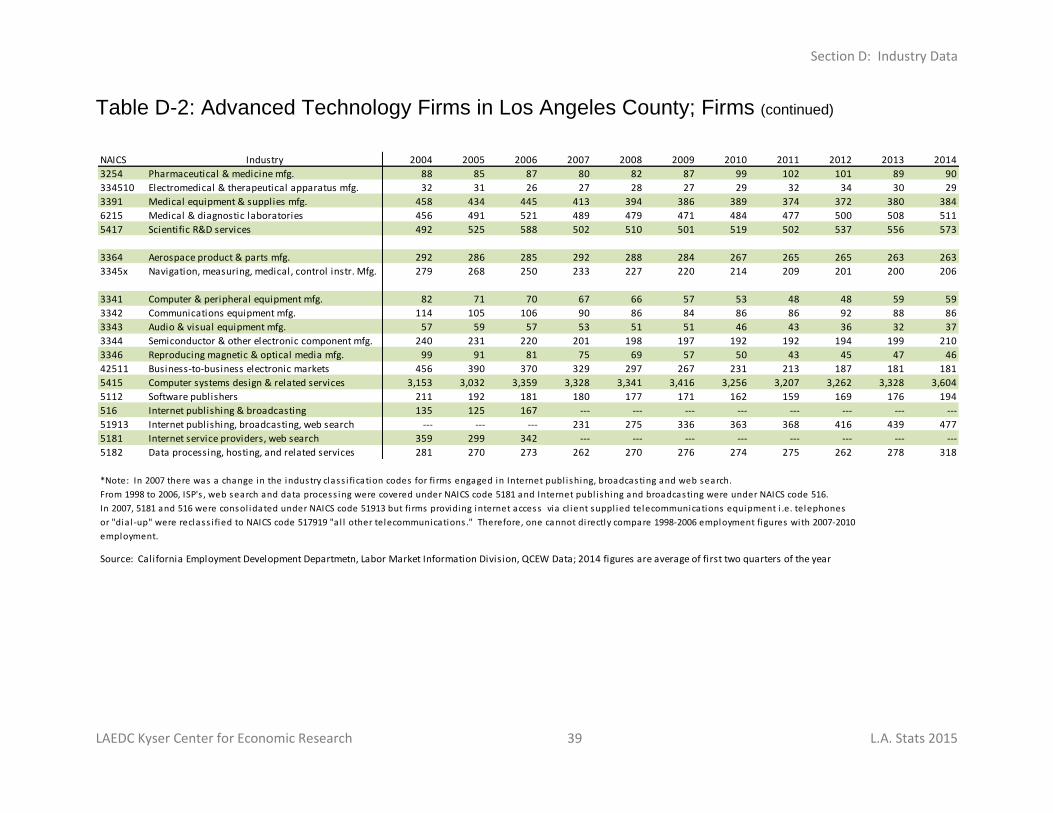
Section D: Industry Data
LAEDC Kyser Center for Economic Research 39 L.A. Stats 2015
NAICS Industry 2004 2005 2006 2007 2008 2009 2010 2011 2012 2013 2014
3254 Pharmaceutical & medicine mfg. 88 85 87 80 82 87 99 102 101 89 90
334510 Electromedical & therapeutical apparatus mfg. 32 31 26 27 28 27 29 32 34 30 29
3391 Medical equipment & supplies mfg. 458 434 445 413 394 386 389 374 372 380 384
6215 Medical & diagnostic laboratories 456 491 521 489 479 471 484 477 500 508 511
5417 Scientific R&D services 492 525 588 502 510 501 519 502 537 556 573
3364 Aerospace product & parts mfg. 292 286 285 292 288 284 267 265 265 263 263
3345x Navigation, measuring, medical, control instr. Mfg. 279 268 250 233 227 220 214 209 201 200 206
3341 Computer & peripheral equipment mfg. 82 71 70 67 66 57 53 48 48 59 59
3342 Communications equipment mfg. 114 105 106 90 86 84 86 86 92 88 86
3343 Audio & visual equipment mfg. 57 59 57 53 51 51 46 43 36 32 37
3344 Semiconductor & other electronic component mfg. 240 231 220 201 198 197 192 192 194 199 210
3346 Reproducing magnetic & optical media mfg. 99 91 81 75 69 57 50 43 45 47 46
42511 Business-to-business electronic markets 456 390 370 329 297 267 231 213 187 181 181
5415 Computer systems design & related services 3,153 3,032 3,359 3,328 3,341 3,416 3,256 3,207 3,262 3,328 3,604
5112 Software publishers 211 192 181 180 177 171 162 159 169 176 194
516 Internet publishing & broadcasting 135 125 167 --- --- --- --- --- --- --- ---
51913 Internet publishing, broadcasting, web search --- --- --- 231 275 336 363 368 416 439 477
5181 Internet service providers, web search 359 299 342 --- --- --- --- --- --- --- ---
5182 Data processing, hosting, and related services 281 270 273 262 270 276 274 275 262 278 318
*Note: In 2007 there was a change in the industry class i fication codes for fi rms engaged in Internet publ ishing, broadcasting and web search.
From 1998 to 2006, ISP's , web search and data process ing were covered under NAICS code 5181 and Internet publ ishing and broadcasting were under NAICS code 516.
In 2007, 5181 and 516 were consol idated under NAICS code 51913 but fi rms providing internet access via cl ient suppl ied telecommunications equipment i .e. telephones
or "dia l -up" were reclass i fied to NAICS code 517919 "a l l other telecommunications ." Therefore, one cannot directly compare 1998-2006 employment figures with 2007-2010
employment.
Source: California Employment Development Departmetn, Labor Market Information Division, QCEW Data; 2014 figures are average of first two quarters of the year
Table D-2: Advanced Technology Firms in Los Angeles County; Firms (continued)
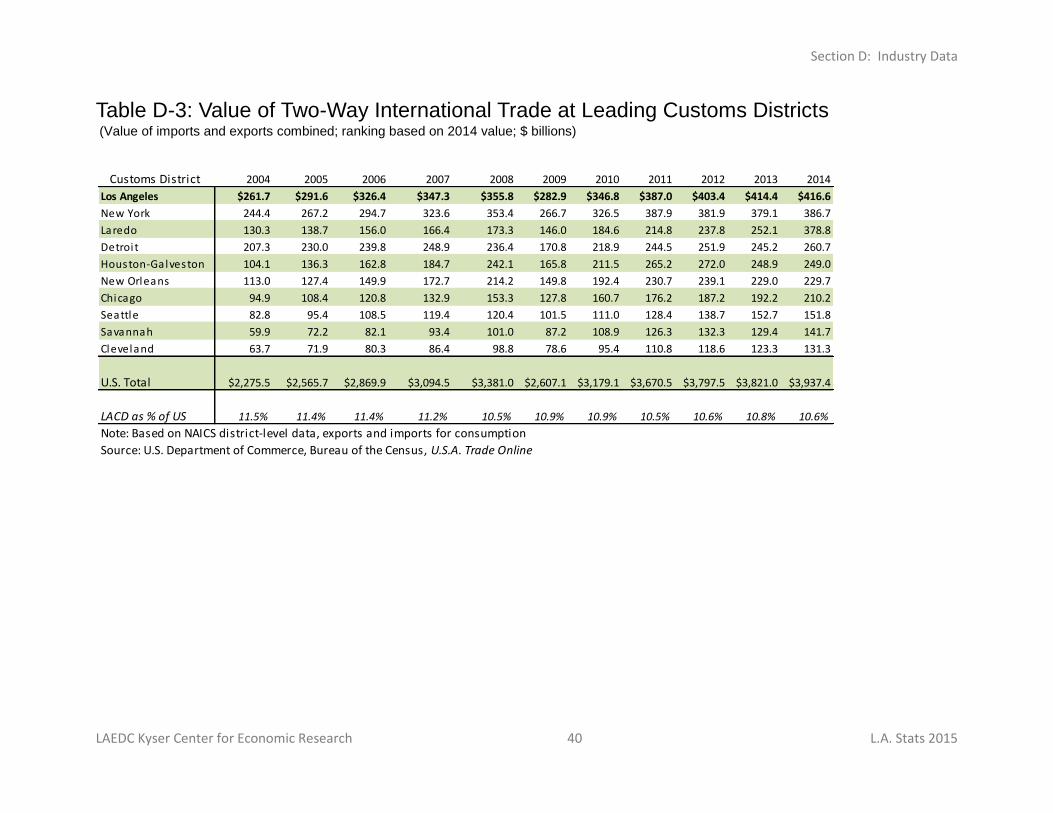
Section D: Industry Data
LAEDC Kyser Center for Economic Research 40 L.A. Stats 2015
Customs District 2004 2005 2006 2007 2008 2009 2010 2011 2012 2013 2014
Los Angeles $261.7 $291.6 $326.4 $347.3 $355.8 $282.9 $346.8 $387.0 $403.4 $414.4 $416.6
New York 244.4 267.2 294.7 323.6 353.4 266.7 326.5 387.9 381.9 379.1 386.7
Laredo 130.3 138.7 156.0 166.4 173.3 146.0 184.6 214.8 237.8 252.1 378.8
Detroit 207.3 230.0 239.8 248.9 236.4 170.8 218.9 244.5 251.9 245.2 260.7
Houston-Galveston 104.1 136.3 162.8 184.7 242.1 165.8 211.5 265.2 272.0 248.9 249.0
New Orleans 113.0 127.4 149.9 172.7 214.2 149.8 192.4 230.7 239.1 229.0 229.7
Chicago 94.9 108.4 120.8 132.9 153.3 127.8 160.7 176.2 187.2 192.2 210.2
Seattle 82.8 95.4 108.5 119.4 120.4 101.5 111.0 128.4 138.7 152.7 151.8
Savannah 59.9 72.2 82.1 93.4 101.0 87.2 108.9 126.3 132.3 129.4 141.7
Cleveland 63.7 71.9 80.3 86.4 98.8 78.6 95.4 110.8 118.6 123.3 131.3
U.S. Total $2,275.5 $2,565.7 $2,869.9 $3,094.5 $3,381.0 $2,607.1 $3,179.1 $3,670.5 $3,797.5 $3,821.0 $3,937.4
LACD as % of US 11.5% 11.4% 11.4% 11.2% 10.5% 10.9% 10.9% 10.5% 10.6% 10.8% 10.6%
Note: Based on NAICS district-level data, exports and imports for consumption
Source: U.S. Department of Commerce, Bureau of the Census, U.S.A. Trade Online
Table D-3: Value of Two-Way International Trade at Leading Customs Districts (Value of imports and exports combined; ranking based on 2014 value; $ billions)
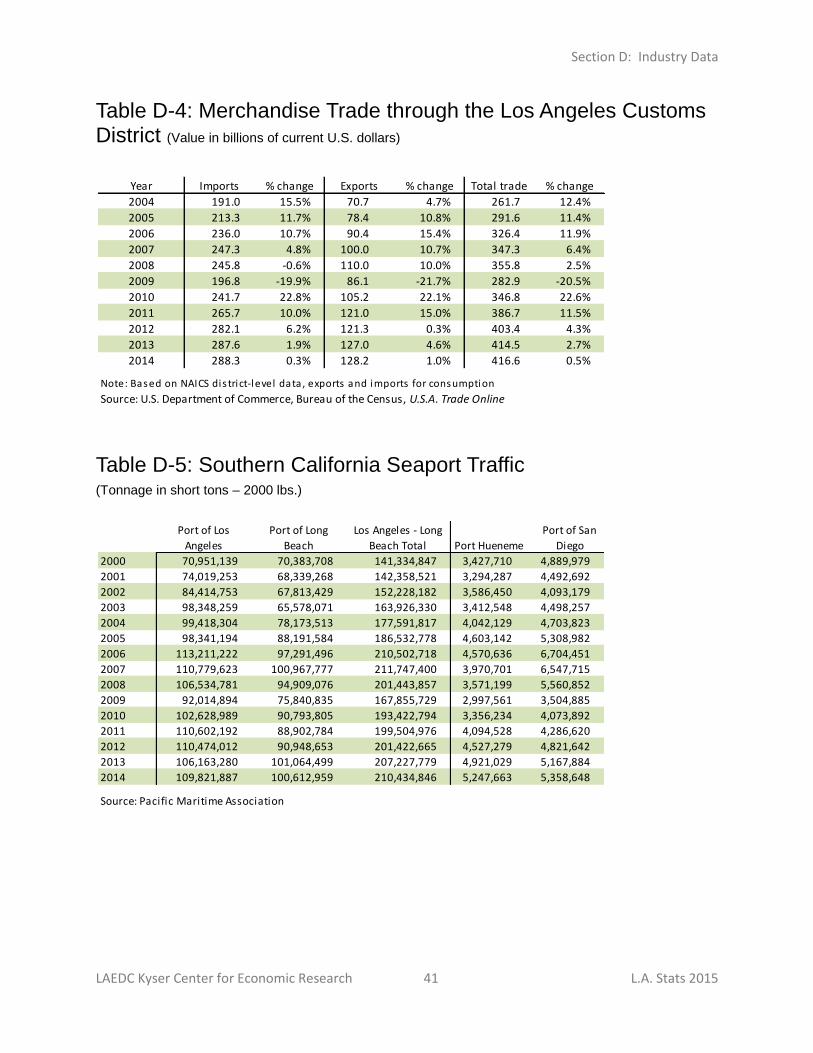
Section D: Industry Data
LAEDC Kyser Center for Economic Research 41 L.A. Stats 2015
Year Imports % change Exports % change Total trade % change
2004 191.0 15.5% 70.7 4.7% 261.7 12.4%
2005 213.3 11.7% 78.4 10.8% 291.6 11.4%
2006 236.0 10.7% 90.4 15.4% 326.4 11.9%
2007 247.3 4.8% 100.0 10.7% 347.3 6.4%
2008 245.8 -0.6% 110.0 10.0% 355.8 2.5%
2009 196.8 -19.9% 86.1 -21.7% 282.9 -20.5%
2010 241.7 22.8% 105.2 22.1% 346.8 22.6%
2011 265.7 10.0% 121.0 15.0% 386.7 11.5%
2012 282.1 6.2% 121.3 0.3% 403.4 4.3%
2013 287.6 1.9% 127.0 4.6% 414.5 2.7%
2014 288.3 0.3% 128.2 1.0% 416.6 0.5%
Note: Based on NAICS dis trict-level data, exports and imports for consumption
Source: U.S. Department of Commerce, Bureau of the Census, U.S.A. Trade Online
Port of Los
Angeles
Port of Long
Beach
Los Angeles - Long
Beach Total Port Hueneme
Port of San
Diego
2000 70,951,139 70,383,708 141,334,847 3,427,710 4,889,979
2001 74,019,253 68,339,268 142,358,521 3,294,287 4,492,692
2002 84,414,753 67,813,429 152,228,182 3,586,450 4,093,179
2003 98,348,259 65,578,071 163,926,330 3,412,548 4,498,257
2004 99,418,304 78,173,513 177,591,817 4,042,129 4,703,823
2005 98,341,194 88,191,584 186,532,778 4,603,142 5,308,982
2006 113,211,222 97,291,496 210,502,718 4,570,636 6,704,451
2007 110,779,623 100,967,777 211,747,400 3,970,701 6,547,715
2008 106,534,781 94,909,076 201,443,857 3,571,199 5,560,852
2009 92,014,894 75,840,835 167,855,729 2,997,561 3,504,885
2010 102,628,989 90,793,805 193,422,794 3,356,234 4,073,892
2011 110,602,192 88,902,784 199,504,976 4,094,528 4,286,620
2012 110,474,012 90,948,653 201,422,665 4,527,279 4,821,642
2013 106,163,280 101,064,499 207,227,779 4,921,029 5,167,884
2014 109,821,887 100,612,959 210,434,846 5,247,663 5,358,648
Source: Pacific Maritime Association
Table D-4: Merchandise Trade through the Los Angeles Customs District (Value in billions of current U.S. dollars)
Table D-5: Southern California Seaport Traffic (Tonnage in short tons – 2000 lbs.)
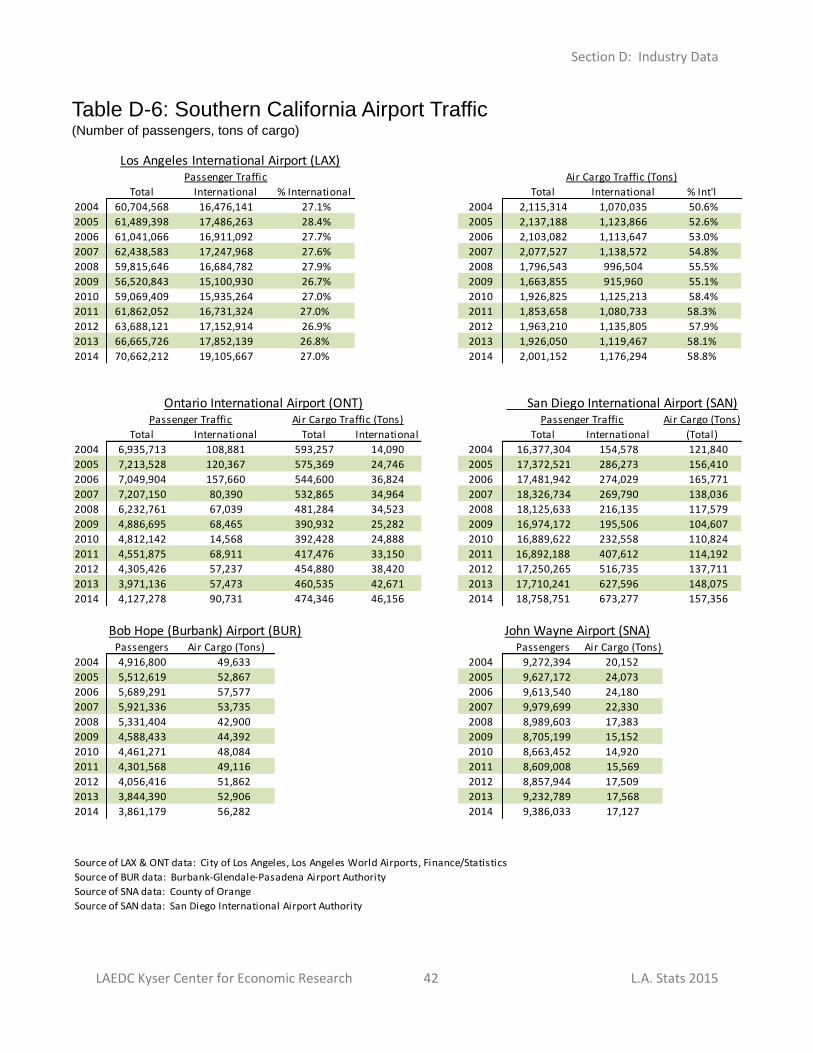
Section D: Industry Data
LAEDC Kyser Center for Economic Research 42 L.A. Stats 2015
Source of LAX & ONT data: City of Los Angeles, Los Angeles World Airports, Finance/Statistics
Source of BUR data: Burbank-Glendale-Pasadena Airport Authority
Source of SNA data: County of Orange
Source of SAN data: San Diego International Airport Authority
Passenger Traffic
Total International % International Total International % Int'l
2004 60,704,568 16,476,141 27.1% 2004 2,115,314 1,070,035 50.6%
2005 61,489,398 17,486,263 28.4% 2005 2,137,188 1,123,866 52.6%
2006 61,041,066 16,911,092 27.7% 2006 2,103,082 1,113,647 53.0%
2007 62,438,583 17,247,968 27.6% 2007 2,077,527 1,138,572 54.8%
2008 59,815,646 16,684,782 27.9% 2008 1,796,543 996,504 55.5%
2009 56,520,843 15,100,930 26.7% 2009 1,663,855 915,960 55.1%
2010 59,069,409 15,935,264 27.0% 2010 1,926,825 1,125,213 58.4%
2011 61,862,052 16,731,324 27.0% 2011 1,853,658 1,080,733 58.3%
2012 63,688,121 17,152,914 26.9% 2012 1,963,210 1,135,805 57.9%
2013 66,665,726 17,852,139 26.8% 2013 1,926,050 1,119,467 58.1%
2014 70,662,212 19,105,667 27.0% 2014 2,001,152 1,176,294 58.8%
Passenger Traffic Air Cargo Traffic (Tons) Air Cargo (Tons)
Total International Total International Total International (Total)
2004 6,935,713 108,881 593,257 14,090 2004 16,377,304 154,578 121,840
2005 7,213,528 120,367 575,369 24,746 2005 17,372,521 286,273 156,410
2006 7,049,904 157,660 544,600 36,824 2006 17,481,942 274,029 165,771
2007 7,207,150 80,390 532,865 34,964 2007 18,326,734 269,790 138,036
2008 6,232,761 67,039 481,284 34,523 2008 18,125,633 216,135 117,579
2009 4,886,695 68,465 390,932 25,282 2009 16,974,172 195,506 104,607
2010 4,812,142 14,568 392,428 24,888 2010 16,889,622 232,558 110,824
2011 4,551,875 68,911 417,476 33,150 2011 16,892,188 407,612 114,192
2012 4,305,426 57,237 454,880 38,420 2012 17,250,265 516,735 137,711
2013 3,971,136 57,473 460,535 42,671 2013 17,710,241 627,596 148,075
2014 4,127,278 90,731 474,346 46,156 2014 18,758,751 673,277 157,356
Bob Hope (Burbank) Airport (BUR) John Wayne Airport (SNA)Passengers Air Cargo (Tons) Passengers Air Cargo (Tons)
2004 4,916,800 49,633 2004 9,272,394 20,152
2005 5,512,619 52,867 2005 9,627,172 24,073
2006 5,689,291 57,577 2006 9,613,540 24,180
2007 5,921,336 53,735 2007 9,979,699 22,330
2008 5,331,404 42,900 2008 8,989,603 17,383
2009 4,588,433 44,392 2009 8,705,199 15,152
2010 4,461,271 48,084 2010 8,663,452 14,920
2011 4,301,568 49,116 2011 8,609,008 15,569
2012 4,056,416 51,862 2012 8,857,944 17,509
2013 3,844,390 52,906 2013 9,232,789 17,568
2014 3,861,179 56,282 2014 9,386,033 17,127
Passenger Traffic
Los Angeles International Airport (LAX)Air Cargo Traffic (Tons)
Ontario International Airport (ONT) San Diego International Airport (SAN)
Table D-6: Southern California Airport Traffic (Number of passengers, tons of cargo)
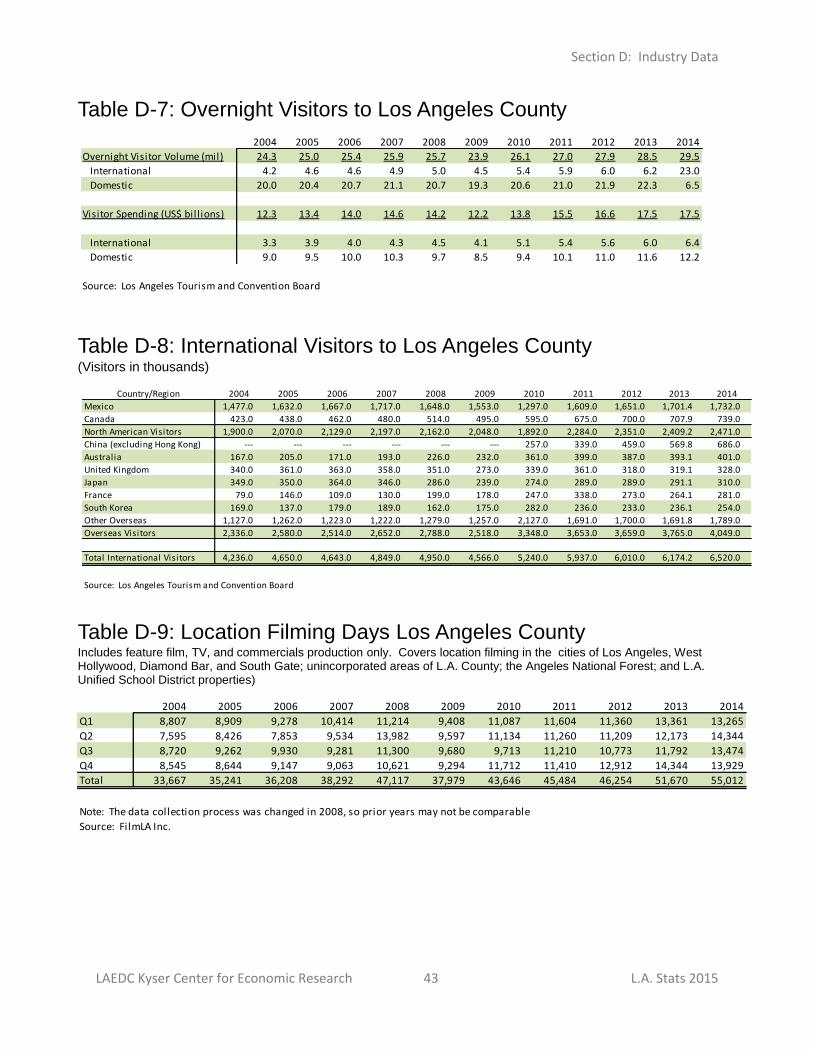
Section D: Industry Data
LAEDC Kyser Center for Economic Research 43 L.A. Stats 2015
Country/Region 2004 2005 2006 2007 2008 2009 2010 2011 2012 2013 2014
Mexico 1,477.0 1,632.0 1,667.0 1,717.0 1,648.0 1,553.0 1,297.0 1,609.0 1,651.0 1,701.4 1,732.0
Canada 423.0 438.0 462.0 480.0 514.0 495.0 595.0 675.0 700.0 707.9 739.0
North American Visitors 1,900.0 2,070.0 2,129.0 2,197.0 2,162.0 2,048.0 1,892.0 2,284.0 2,351.0 2,409.2 2,471.0
China (excluding Hong Kong) --- --- --- --- --- --- 257.0 339.0 459.0 569.8 686.0
Australia 167.0 205.0 171.0 193.0 226.0 232.0 361.0 399.0 387.0 393.1 401.0
United Kingdom 340.0 361.0 363.0 358.0 351.0 273.0 339.0 361.0 318.0 319.1 328.0
Japan 349.0 350.0 364.0 346.0 286.0 239.0 274.0 289.0 289.0 291.1 310.0
France 79.0 146.0 109.0 130.0 199.0 178.0 247.0 338.0 273.0 264.1 281.0
South Korea 169.0 137.0 179.0 189.0 162.0 175.0 282.0 236.0 233.0 236.1 254.0
Other Overseas 1,127.0 1,262.0 1,223.0 1,222.0 1,279.0 1,257.0 2,127.0 1,691.0 1,700.0 1,691.8 1,789.0
Overseas Visitors 2,336.0 2,580.0 2,514.0 2,652.0 2,788.0 2,518.0 3,348.0 3,653.0 3,659.0 3,765.0 4,049.0
Total International Visitors 4,236.0 4,650.0 4,643.0 4,849.0 4,950.0 4,566.0 5,240.0 5,937.0 6,010.0 6,174.2 6,520.0
Source: Los Angeles Tourism and Convention Board
2004 2005 2006 2007 2008 2009 2010 2011 2012 2013 2014
Q1 8,807 8,909 9,278 10,414 11,214 9,408 11,087 11,604 11,360 13,361 13,265
Q2 7,595 8,426 7,853 9,534 13,982 9,597 11,134 11,260 11,209 12,173 14,344
Q3 8,720 9,262 9,930 9,281 11,300 9,680 9,713 11,210 10,773 11,792 13,474
Q4 8,545 8,644 9,147 9,063 10,621 9,294 11,712 11,410 12,912 14,344 13,929
Total 33,667 35,241 36,208 38,292 47,117 37,979 43,646 45,484 46,254 51,670 55,012
Note: The data collection process was changed in 2008, so prior years may not be comparable
Source: FilmLA Inc.
2004 2005 2006 2007 2008 2009 2010 2011 2012 2013 2014
Overnight Visitor Volume (mil) 24.3 25.0 25.4 25.9 25.7 23.9 26.1 27.0 27.9 28.5 29.5
International 4.2 4.6 4.6 4.9 5.0 4.5 5.4 5.9 6.0 6.2 23.0
Domestic 20.0 20.4 20.7 21.1 20.7 19.3 20.6 21.0 21.9 22.3 6.5
Visitor Spending (US$ bill ions) 12.3 13.4 14.0 14.6 14.2 12.2 13.8 15.5 16.6 17.5 17.5
International 3.3 3.9 4.0 4.3 4.5 4.1 5.1 5.4 5.6 6.0 6.4
Domestic 9.0 9.5 10.0 10.3 9.7 8.5 9.4 10.1 11.0 11.6 12.2
Source: Los Angeles Tourism and Convention Board
Table D-7: Overnight Visitors to Los Angeles County
Table D-8: International Visitors to Los Angeles County (Visitors in thousands)
Table D-9: Location Filming Days Los Angeles County Includes feature film, TV, and commercials production only. Covers location filming in the cities of Los Angeles, West Hollywood, Diamond Bar, and South Gate; unincorporated areas of L.A. County; the Angeles National Forest; and L.A. Unified School District properties)
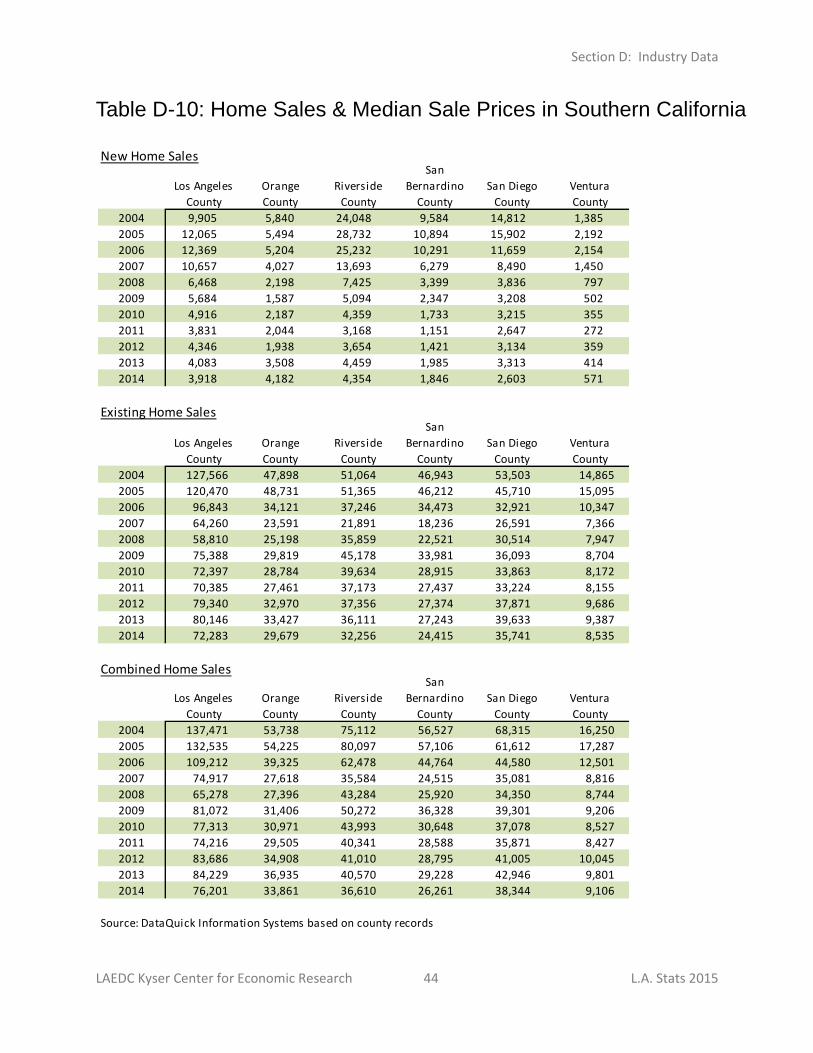
Section D: Industry Data
LAEDC Kyser Center for Economic Research 44 L.A. Stats 2015
New Home Sales
Los Angeles
County
Orange
County
Riverside
County
San
Bernardino
County
San Diego
County
Ventura
County
2004 9,905 5,840 24,048 9,584 14,812 1,385
2005 12,065 5,494 28,732 10,894 15,902 2,192
2006 12,369 5,204 25,232 10,291 11,659 2,154
2007 10,657 4,027 13,693 6,279 8,490 1,450
2008 6,468 2,198 7,425 3,399 3,836 797
2009 5,684 1,587 5,094 2,347 3,208 502
2010 4,916 2,187 4,359 1,733 3,215 355
2011 3,831 2,044 3,168 1,151 2,647 272
2012 4,346 1,938 3,654 1,421 3,134 359
2013 4,083 3,508 4,459 1,985 3,313 414
2014 3,918 4,182 4,354 1,846 2,603 571
Existing Home Sales
Los Angeles
County
Orange
County
Riverside
County
San
Bernardino
County
San Diego
County
Ventura
County
2004 127,566 47,898 51,064 46,943 53,503 14,865
2005 120,470 48,731 51,365 46,212 45,710 15,095
2006 96,843 34,121 37,246 34,473 32,921 10,347
2007 64,260 23,591 21,891 18,236 26,591 7,366
2008 58,810 25,198 35,859 22,521 30,514 7,947
2009 75,388 29,819 45,178 33,981 36,093 8,704
2010 72,397 28,784 39,634 28,915 33,863 8,172
2011 70,385 27,461 37,173 27,437 33,224 8,155
2012 79,340 32,970 37,356 27,374 37,871 9,686
2013 80,146 33,427 36,111 27,243 39,633 9,387
2014 72,283 29,679 32,256 24,415 35,741 8,535
Combined Home Sales
Los Angeles
County
Orange
County
Riverside
County
San
Bernardino
County
San Diego
County
Ventura
County
2004 137,471 53,738 75,112 56,527 68,315 16,250
2005 132,535 54,225 80,097 57,106 61,612 17,287
2006 109,212 39,325 62,478 44,764 44,580 12,501
2007 74,917 27,618 35,584 24,515 35,081 8,816
2008 65,278 27,396 43,284 25,920 34,350 8,744
2009 81,072 31,406 50,272 36,328 39,301 9,206
2010 77,313 30,971 43,993 30,648 37,078 8,527
2011 74,216 29,505 40,341 28,588 35,871 8,427
2012 83,686 34,908 41,010 28,795 41,005 10,045
2013 84,229 36,935 40,570 29,228 42,946 9,801
2014 76,201 33,861 36,610 26,261 38,344 9,106
Source: DataQuick Information Systems based on county records
Table D-10: Home Sales & Median Sale Prices in Southern California
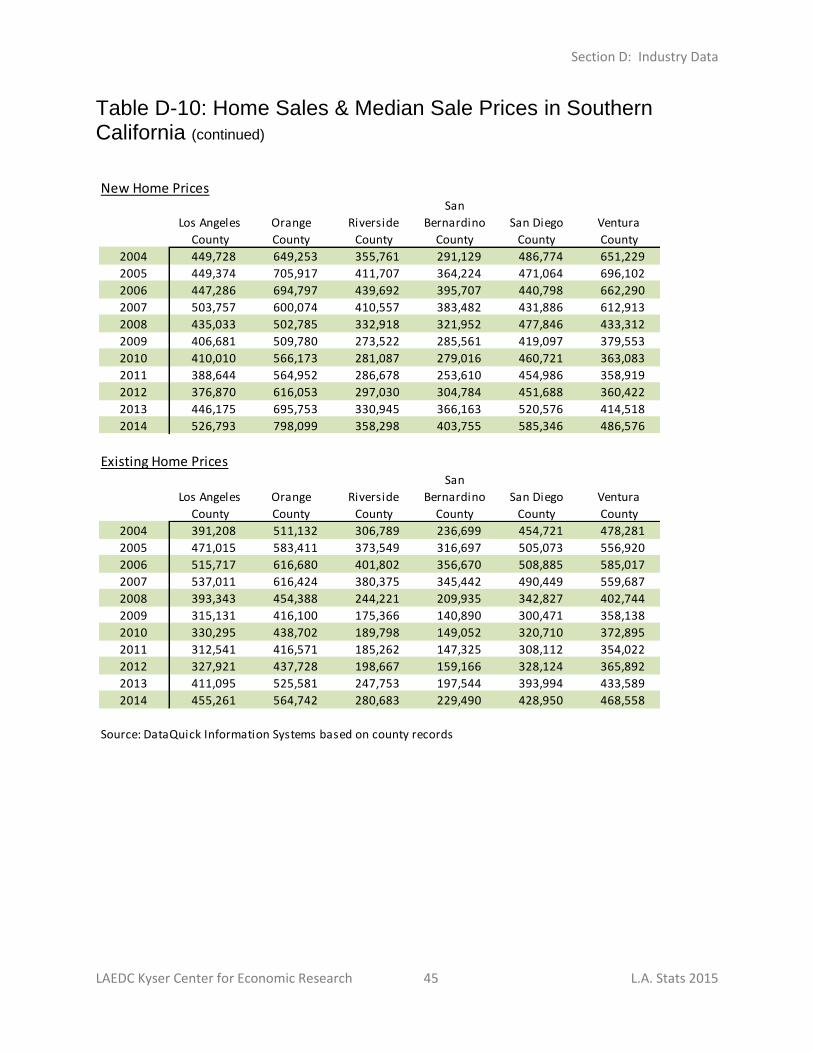
Section D: Industry Data
LAEDC Kyser Center for Economic Research 45 L.A. Stats 2015
New Home Prices
Los Angeles
County
Orange
County
Riverside
County
San
Bernardino
County
San Diego
County
Ventura
County
2004 449,728 649,253 355,761 291,129 486,774 651,229
2005 449,374 705,917 411,707 364,224 471,064 696,102
2006 447,286 694,797 439,692 395,707 440,798 662,290
2007 503,757 600,074 410,557 383,482 431,886 612,913
2008 435,033 502,785 332,918 321,952 477,846 433,312
2009 406,681 509,780 273,522 285,561 419,097 379,553
2010 410,010 566,173 281,087 279,016 460,721 363,083
2011 388,644 564,952 286,678 253,610 454,986 358,919
2012 376,870 616,053 297,030 304,784 451,688 360,422
2013 446,175 695,753 330,945 366,163 520,576 414,518
2014 526,793 798,099 358,298 403,755 585,346 486,576
Existing Home Prices
Los Angeles
County
Orange
County
Riverside
County
San
Bernardino
County
San Diego
County
Ventura
County
2004 391,208 511,132 306,789 236,699 454,721 478,281
2005 471,015 583,411 373,549 316,697 505,073 556,920
2006 515,717 616,680 401,802 356,670 508,885 585,017
2007 537,011 616,424 380,375 345,442 490,449 559,687
2008 393,343 454,388 244,221 209,935 342,827 402,744
2009 315,131 416,100 175,366 140,890 300,471 358,138
2010 330,295 438,702 189,798 149,052 320,710 372,895
2011 312,541 416,571 185,262 147,325 308,112 354,022
2012 327,921 437,728 198,667 159,166 328,124 365,892
2013 411,095 525,581 247,753 197,544 393,994 433,589
2014 455,261 564,742 280,683 229,490 428,950 468,558
Source: DataQuick Information Systems based on county records
Table D-10: Home Sales & Median Sale Prices in Southern California (continued)
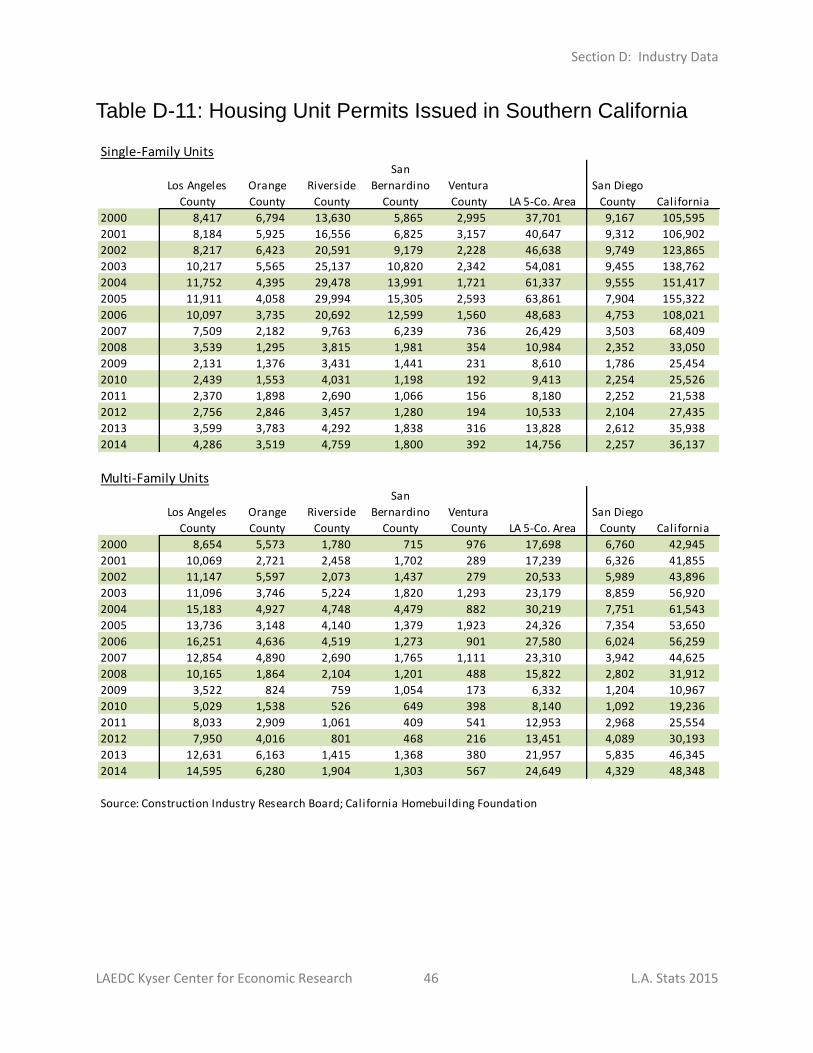
Section D: Industry Data
LAEDC Kyser Center for Economic Research 46 L.A. Stats 2015
Single-Family Units
Los Angeles
County
Orange
County
Riverside
County
San
Bernardino
County
Ventura
County LA 5-Co. Area
San Diego
County California
2000 8,417 6,794 13,630 5,865 2,995 37,701 9,167 105,595
2001 8,184 5,925 16,556 6,825 3,157 40,647 9,312 106,902
2002 8,217 6,423 20,591 9,179 2,228 46,638 9,749 123,865
2003 10,217 5,565 25,137 10,820 2,342 54,081 9,455 138,762
2004 11,752 4,395 29,478 13,991 1,721 61,337 9,555 151,417
2005 11,911 4,058 29,994 15,305 2,593 63,861 7,904 155,322
2006 10,097 3,735 20,692 12,599 1,560 48,683 4,753 108,021
2007 7,509 2,182 9,763 6,239 736 26,429 3,503 68,409
2008 3,539 1,295 3,815 1,981 354 10,984 2,352 33,050
2009 2,131 1,376 3,431 1,441 231 8,610 1,786 25,454
2010 2,439 1,553 4,031 1,198 192 9,413 2,254 25,526
2011 2,370 1,898 2,690 1,066 156 8,180 2,252 21,538
2012 2,756 2,846 3,457 1,280 194 10,533 2,104 27,435
2013 3,599 3,783 4,292 1,838 316 13,828 2,612 35,938
2014 4,286 3,519 4,759 1,800 392 14,756 2,257 36,137
Multi-Family Units
Los Angeles
County
Orange
County
Riverside
County
San
Bernardino
County
Ventura
County LA 5-Co. Area
San Diego
County California
2000 8,654 5,573 1,780 715 976 17,698 6,760 42,945
2001 10,069 2,721 2,458 1,702 289 17,239 6,326 41,855
2002 11,147 5,597 2,073 1,437 279 20,533 5,989 43,896
2003 11,096 3,746 5,224 1,820 1,293 23,179 8,859 56,920
2004 15,183 4,927 4,748 4,479 882 30,219 7,751 61,543
2005 13,736 3,148 4,140 1,379 1,923 24,326 7,354 53,650
2006 16,251 4,636 4,519 1,273 901 27,580 6,024 56,259
2007 12,854 4,890 2,690 1,765 1,111 23,310 3,942 44,625
2008 10,165 1,864 2,104 1,201 488 15,822 2,802 31,912
2009 3,522 824 759 1,054 173 6,332 1,204 10,967
2010 5,029 1,538 526 649 398 8,140 1,092 19,236
2011 8,033 2,909 1,061 409 541 12,953 2,968 25,554
2012 7,950 4,016 801 468 216 13,451 4,089 30,193
2013 12,631 6,163 1,415 1,368 380 21,957 5,835 46,345
2014 14,595 6,280 1,904 1,303 567 24,649 4,329 48,348
Source: Construction Industry Research Board; California Homebuilding Foundation
Table D-11: Housing Unit Permits Issued in Southern California
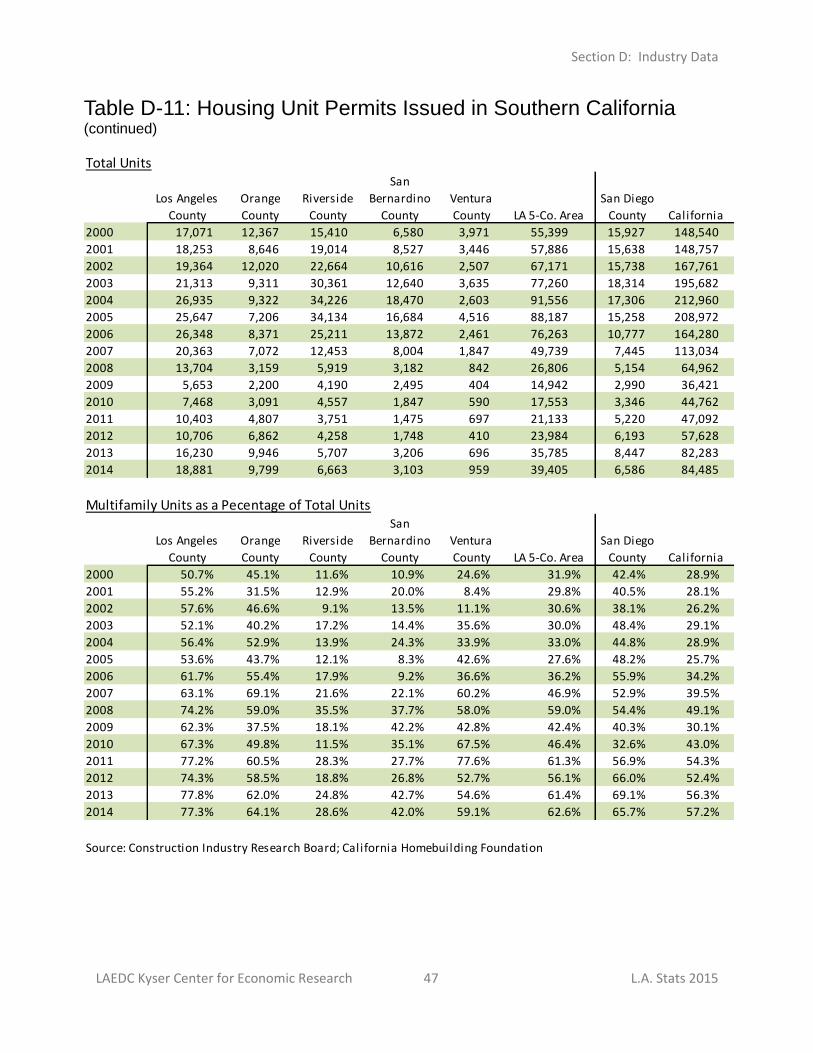
Section D: Industry Data
LAEDC Kyser Center for Economic Research 47 L.A. Stats 2015
Total Units
Los Angeles
County
Orange
County
Riverside
County
San
Bernardino
County
Ventura
County LA 5-Co. Area
San Diego
County California
2000 17,071 12,367 15,410 6,580 3,971 55,399 15,927 148,540
2001 18,253 8,646 19,014 8,527 3,446 57,886 15,638 148,757
2002 19,364 12,020 22,664 10,616 2,507 67,171 15,738 167,761
2003 21,313 9,311 30,361 12,640 3,635 77,260 18,314 195,682
2004 26,935 9,322 34,226 18,470 2,603 91,556 17,306 212,960
2005 25,647 7,206 34,134 16,684 4,516 88,187 15,258 208,972
2006 26,348 8,371 25,211 13,872 2,461 76,263 10,777 164,280
2007 20,363 7,072 12,453 8,004 1,847 49,739 7,445 113,034
2008 13,704 3,159 5,919 3,182 842 26,806 5,154 64,962
2009 5,653 2,200 4,190 2,495 404 14,942 2,990 36,421
2010 7,468 3,091 4,557 1,847 590 17,553 3,346 44,762
2011 10,403 4,807 3,751 1,475 697 21,133 5,220 47,092
2012 10,706 6,862 4,258 1,748 410 23,984 6,193 57,628
2013 16,230 9,946 5,707 3,206 696 35,785 8,447 82,283
2014 18,881 9,799 6,663 3,103 959 39,405 6,586 84,485
Multifamily Units as a Pecentage of Total Units
Los Angeles
County
Orange
County
Riverside
County
San
Bernardino
County
Ventura
County LA 5-Co. Area
San Diego
County California
2000 50.7% 45.1% 11.6% 10.9% 24.6% 31.9% 42.4% 28.9%
2001 55.2% 31.5% 12.9% 20.0% 8.4% 29.8% 40.5% 28.1%
2002 57.6% 46.6% 9.1% 13.5% 11.1% 30.6% 38.1% 26.2%
2003 52.1% 40.2% 17.2% 14.4% 35.6% 30.0% 48.4% 29.1%
2004 56.4% 52.9% 13.9% 24.3% 33.9% 33.0% 44.8% 28.9%
2005 53.6% 43.7% 12.1% 8.3% 42.6% 27.6% 48.2% 25.7%
2006 61.7% 55.4% 17.9% 9.2% 36.6% 36.2% 55.9% 34.2%
2007 63.1% 69.1% 21.6% 22.1% 60.2% 46.9% 52.9% 39.5%
2008 74.2% 59.0% 35.5% 37.7% 58.0% 59.0% 54.4% 49.1%
2009 62.3% 37.5% 18.1% 42.2% 42.8% 42.4% 40.3% 30.1%
2010 67.3% 49.8% 11.5% 35.1% 67.5% 46.4% 32.6% 43.0%
2011 77.2% 60.5% 28.3% 27.7% 77.6% 61.3% 56.9% 54.3%
2012 74.3% 58.5% 18.8% 26.8% 52.7% 56.1% 66.0% 52.4%
2013 77.8% 62.0% 24.8% 42.7% 54.6% 61.4% 69.1% 56.3%
2014 77.3% 64.1% 28.6% 42.0% 59.1% 62.6% 65.7% 57.2%
Source: Construction Industry Research Board; California Homebuilding Foundation
Table D-11: Housing Unit Permits Issued in Southern California (continued)
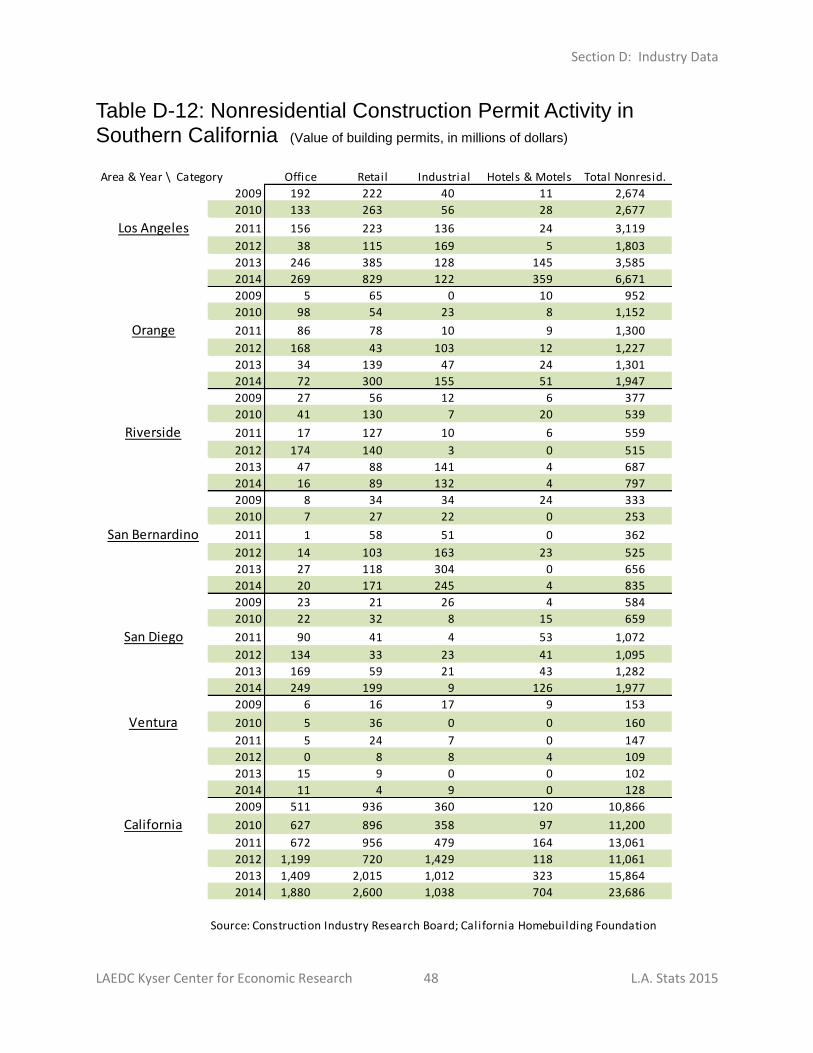
Section D: Industry Data
LAEDC Kyser Center for Economic Research 48 L.A. Stats 2015
Area & Year \ Category Office Retail Industrial Hotels & Motels Total Nonresid.
2009 192 222 40 11 2,674
2010 133 263 56 28 2,677
Los Angeles 2011 156 223 136 24 3,119
2012 38 115 169 5 1,803
2013 246 385 128 145 3,585
2014 269 829 122 359 6,671
2009 5 65 0 10 952
2010 98 54 23 8 1,152
Orange 2011 86 78 10 9 1,300
2012 168 43 103 12 1,227
2013 34 139 47 24 1,301
2014 72 300 155 51 1,947
2009 27 56 12 6 377
2010 41 130 7 20 539
Riverside 2011 17 127 10 6 559
2012 174 140 3 0 515
2013 47 88 141 4 687
2014 16 89 132 4 797
2009 8 34 34 24 333
2010 7 27 22 0 253
San Bernardino 2011 1 58 51 0 362
2012 14 103 163 23 525
2013 27 118 304 0 656
2014 20 171 245 4 835
2009 23 21 26 4 584
2010 22 32 8 15 659
San Diego 2011 90 41 4 53 1,072
2012 134 33 23 41 1,095
2013 169 59 21 43 1,282
2014 249 199 9 126 1,977
2009 6 16 17 9 153
Ventura 2010 5 36 0 0 160
2011 5 24 7 0 147
2012 0 8 8 4 109
2013 15 9 0 0 102
2014 11 4 9 0 128
2009 511 936 360 120 10,866
California 2010 627 896 358 97 11,200
2011 672 956 479 164 13,061
2012 1,199 720 1,429 118 11,061
2013 1,409 2,015 1,012 323 15,864
2014 1,880 2,600 1,038 704 23,686
Source: Construction Industry Research Board; California Homebuilding Foundation
Table D-12: Nonresidential Construction Permit Activity in Southern California (Value of building permits, in millions of dollars)
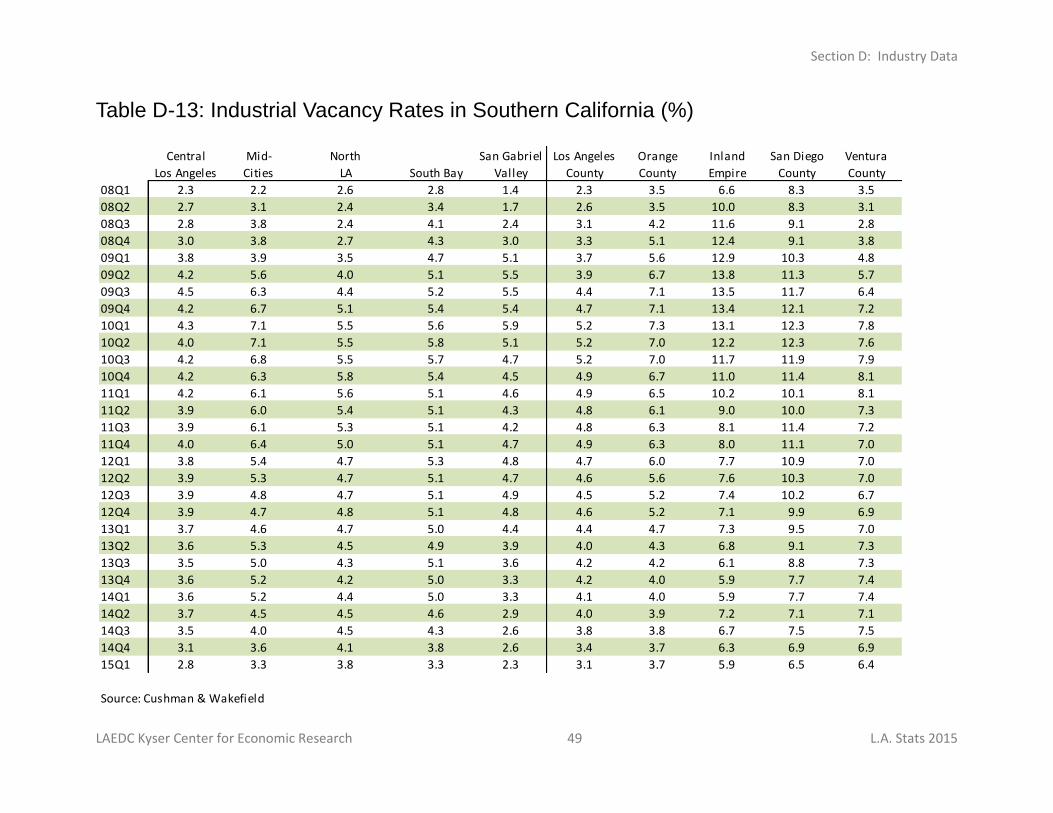
Section D: Industry Data
LAEDC Kyser Center for Economic Research 49 L.A. Stats 2015
Central Mid- North San Gabriel Los Angeles Orange Inland San Diego Ventura
Los Angeles Cities LA South Bay Valley County County Empire County County
08Q1 2.3 2.2 2.6 2.8 1.4 2.3 3.5 6.6 8.3 3.5
08Q2 2.7 3.1 2.4 3.4 1.7 2.6 3.5 10.0 8.3 3.1
08Q3 2.8 3.8 2.4 4.1 2.4 3.1 4.2 11.6 9.1 2.8
08Q4 3.0 3.8 2.7 4.3 3.0 3.3 5.1 12.4 9.1 3.8
09Q1 3.8 3.9 3.5 4.7 5.1 3.7 5.6 12.9 10.3 4.8
09Q2 4.2 5.6 4.0 5.1 5.5 3.9 6.7 13.8 11.3 5.7
09Q3 4.5 6.3 4.4 5.2 5.5 4.4 7.1 13.5 11.7 6.4
09Q4 4.2 6.7 5.1 5.4 5.4 4.7 7.1 13.4 12.1 7.2
10Q1 4.3 7.1 5.5 5.6 5.9 5.2 7.3 13.1 12.3 7.8
10Q2 4.0 7.1 5.5 5.8 5.1 5.2 7.0 12.2 12.3 7.6
10Q3 4.2 6.8 5.5 5.7 4.7 5.2 7.0 11.7 11.9 7.9
10Q4 4.2 6.3 5.8 5.4 4.5 4.9 6.7 11.0 11.4 8.1
11Q1 4.2 6.1 5.6 5.1 4.6 4.9 6.5 10.2 10.1 8.1
11Q2 3.9 6.0 5.4 5.1 4.3 4.8 6.1 9.0 10.0 7.3
11Q3 3.9 6.1 5.3 5.1 4.2 4.8 6.3 8.1 11.4 7.2
11Q4 4.0 6.4 5.0 5.1 4.7 4.9 6.3 8.0 11.1 7.0
12Q1 3.8 5.4 4.7 5.3 4.8 4.7 6.0 7.7 10.9 7.0
12Q2 3.9 5.3 4.7 5.1 4.7 4.6 5.6 7.6 10.3 7.0
12Q3 3.9 4.8 4.7 5.1 4.9 4.5 5.2 7.4 10.2 6.7
12Q4 3.9 4.7 4.8 5.1 4.8 4.6 5.2 7.1 9.9 6.9
13Q1 3.7 4.6 4.7 5.0 4.4 4.4 4.7 7.3 9.5 7.0
13Q2 3.6 5.3 4.5 4.9 3.9 4.0 4.3 6.8 9.1 7.3
13Q3 3.5 5.0 4.3 5.1 3.6 4.2 4.2 6.1 8.8 7.3
13Q4 3.6 5.2 4.2 5.0 3.3 4.2 4.0 5.9 7.7 7.4
14Q1 3.6 5.2 4.4 5.0 3.3 4.1 4.0 5.9 7.7 7.4
14Q2 3.7 4.5 4.5 4.6 2.9 4.0 3.9 7.2 7.1 7.1
14Q3 3.5 4.0 4.5 4.3 2.6 3.8 3.8 6.7 7.5 7.5
14Q4 3.1 3.6 4.1 3.8 2.6 3.4 3.7 6.3 6.9 6.9
15Q1 2.8 3.3 3.8 3.3 2.3 3.1 3.7 5.9 6.5 6.4
Source: Cushman & Wakefield
Table D-13: Industrial Vacancy Rates in Southern California (%)
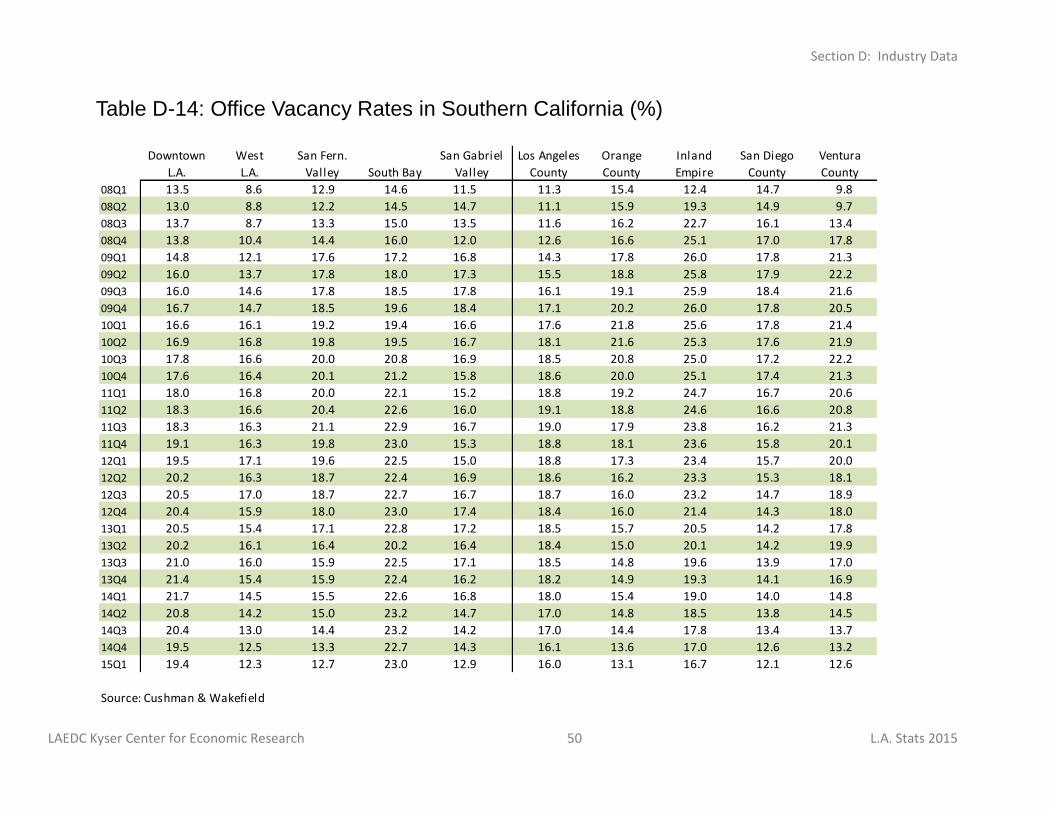
Section D: Industry Data
LAEDC Kyser Center for Economic Research 50 L.A. Stats 2015
Downtown West San Fern. San Gabriel Los Angeles Orange Inland San Diego Ventura
L.A. L.A. Valley South Bay Valley County County Empire County County
08Q1 13.5 8.6 12.9 14.6 11.5 11.3 15.4 12.4 14.7 9.8
08Q2 13.0 8.8 12.2 14.5 14.7 11.1 15.9 19.3 14.9 9.7
08Q3 13.7 8.7 13.3 15.0 13.5 11.6 16.2 22.7 16.1 13.4
08Q4 13.8 10.4 14.4 16.0 12.0 12.6 16.6 25.1 17.0 17.8
09Q1 14.8 12.1 17.6 17.2 16.8 14.3 17.8 26.0 17.8 21.3
09Q2 16.0 13.7 17.8 18.0 17.3 15.5 18.8 25.8 17.9 22.2
09Q3 16.0 14.6 17.8 18.5 17.8 16.1 19.1 25.9 18.4 21.6
09Q4 16.7 14.7 18.5 19.6 18.4 17.1 20.2 26.0 17.8 20.5
10Q1 16.6 16.1 19.2 19.4 16.6 17.6 21.8 25.6 17.8 21.4
10Q2 16.9 16.8 19.8 19.5 16.7 18.1 21.6 25.3 17.6 21.9
10Q3 17.8 16.6 20.0 20.8 16.9 18.5 20.8 25.0 17.2 22.2
10Q4 17.6 16.4 20.1 21.2 15.8 18.6 20.0 25.1 17.4 21.3
11Q1 18.0 16.8 20.0 22.1 15.2 18.8 19.2 24.7 16.7 20.6
11Q2 18.3 16.6 20.4 22.6 16.0 19.1 18.8 24.6 16.6 20.8
11Q3 18.3 16.3 21.1 22.9 16.7 19.0 17.9 23.8 16.2 21.3
11Q4 19.1 16.3 19.8 23.0 15.3 18.8 18.1 23.6 15.8 20.1
12Q1 19.5 17.1 19.6 22.5 15.0 18.8 17.3 23.4 15.7 20.0
12Q2 20.2 16.3 18.7 22.4 16.9 18.6 16.2 23.3 15.3 18.1
12Q3 20.5 17.0 18.7 22.7 16.7 18.7 16.0 23.2 14.7 18.9
12Q4 20.4 15.9 18.0 23.0 17.4 18.4 16.0 21.4 14.3 18.0
13Q1 20.5 15.4 17.1 22.8 17.2 18.5 15.7 20.5 14.2 17.8
13Q2 20.2 16.1 16.4 20.2 16.4 18.4 15.0 20.1 14.2 19.9
13Q3 21.0 16.0 15.9 22.5 17.1 18.5 14.8 19.6 13.9 17.0
13Q4 21.4 15.4 15.9 22.4 16.2 18.2 14.9 19.3 14.1 16.9
14Q1 21.7 14.5 15.5 22.6 16.8 18.0 15.4 19.0 14.0 14.8
14Q2 20.8 14.2 15.0 23.2 14.7 17.0 14.8 18.5 13.8 14.5
14Q3 20.4 13.0 14.4 23.2 14.2 17.0 14.4 17.8 13.4 13.7
14Q4 19.5 12.5 13.3 22.7 14.3 16.1 13.6 17.0 12.6 13.2
15Q1 19.4 12.3 12.7 23.0 12.9 16.0 13.1 16.7 12.1 12.6
Source: Cushman & Wakefield
Table D-14: Office Vacancy Rates in Southern California (%)
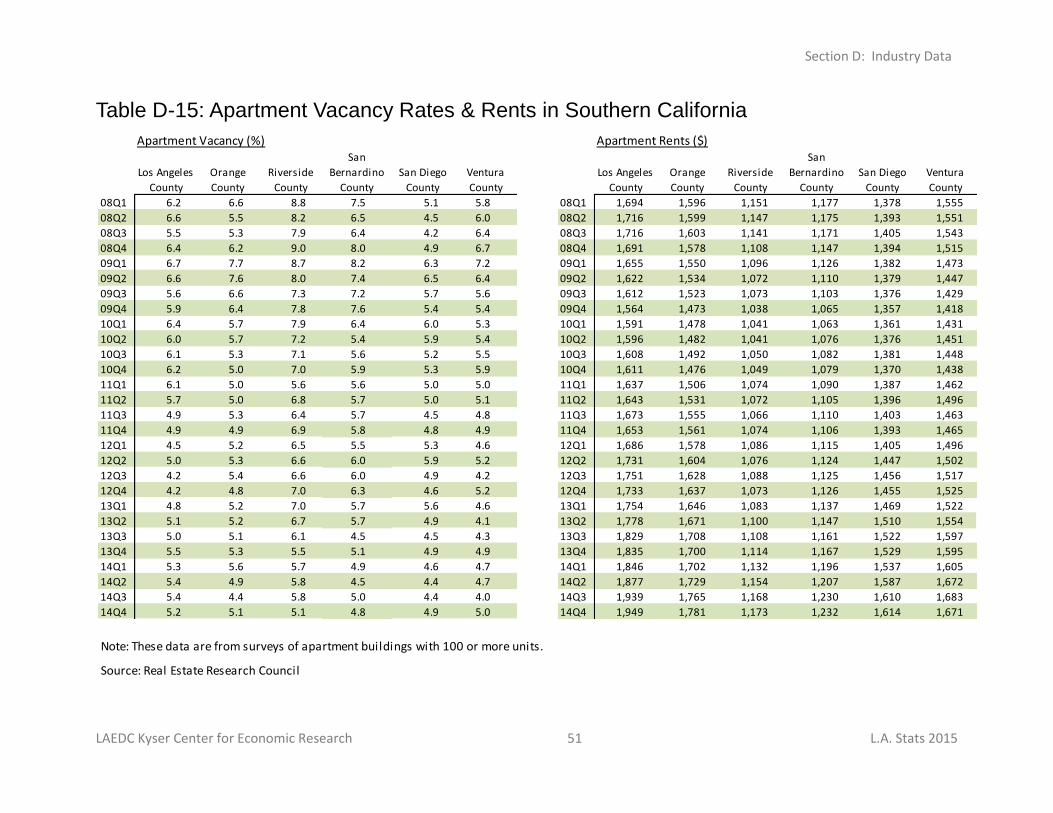
Section D: Industry Data
LAEDC Kyser Center for Economic Research 51 L.A. Stats 2015
Note: These data are from surveys of apartment buildings with 100 or more units.
Source: Real Estate Research Council
Apartment Vacancy (%)
Los Angeles
County
Orange
County
Riverside
County
San
Bernardino
County
San Diego
County
Ventura
County
08Q1 6.2 6.6 8.8 7.5 5.1 5.8
08Q2 6.6 5.5 8.2 6.5 4.5 6.0
08Q3 5.5 5.3 7.9 6.4 4.2 6.4
08Q4 6.4 6.2 9.0 8.0 4.9 6.7
09Q1 6.7 7.7 8.7 8.2 6.3 7.2
09Q2 6.6 7.6 8.0 7.4 6.5 6.4
09Q3 5.6 6.6 7.3 7.2 5.7 5.6
09Q4 5.9 6.4 7.8 7.6 5.4 5.4
10Q1 6.4 5.7 7.9 6.4 6.0 5.3
10Q2 6.0 5.7 7.2 5.4 5.9 5.4
10Q3 6.1 5.3 7.1 5.6 5.2 5.5
10Q4 6.2 5.0 7.0 5.9 5.3 5.9
11Q1 6.1 5.0 5.6 5.6 5.0 5.0
11Q2 5.7 5.0 6.8 5.7 5.0 5.1
11Q3 4.9 5.3 6.4 5.7 4.5 4.8
11Q4 4.9 4.9 6.9 5.8 4.8 4.9
12Q1 4.5 5.2 6.5 5.5 5.3 4.6
12Q2 5.0 5.3 6.6 6.0 5.9 5.2
12Q3 4.2 5.4 6.6 6.0 4.9 4.2
12Q4 4.2 4.8 7.0 6.3 4.6 5.2
13Q1 4.8 5.2 7.0 5.7 5.6 4.6
13Q2 5.1 5.2 6.7 5.7 4.9 4.1
13Q3 5.0 5.1 6.1 4.5 4.5 4.3
13Q4 5.5 5.3 5.5 5.1 4.9 4.9
14Q1 5.3 5.6 5.7 4.9 4.6 4.7
14Q2 5.4 4.9 5.8 4.5 4.4 4.7
14Q3 5.4 4.4 5.8 5.0 4.4 4.0
14Q4 5.2 5.1 5.1 4.8 4.9 5.0
Apartment Rents ($)
Los Angeles
County
Orange
County
Riverside
County
San
Bernardino
County
San Diego
County
Ventura
County
08Q1 1,694 1,596 1,151 1,177 1,378 1,555
08Q2 1,716 1,599 1,147 1,175 1,393 1,551
08Q3 1,716 1,603 1,141 1,171 1,405 1,543
08Q4 1,691 1,578 1,108 1,147 1,394 1,515
09Q1 1,655 1,550 1,096 1,126 1,382 1,473
09Q2 1,622 1,534 1,072 1,110 1,379 1,447
09Q3 1,612 1,523 1,073 1,103 1,376 1,429
09Q4 1,564 1,473 1,038 1,065 1,357 1,418
10Q1 1,591 1,478 1,041 1,063 1,361 1,431
10Q2 1,596 1,482 1,041 1,076 1,376 1,451
10Q3 1,608 1,492 1,050 1,082 1,381 1,448
10Q4 1,611 1,476 1,049 1,079 1,370 1,438
11Q1 1,637 1,506 1,074 1,090 1,387 1,462
11Q2 1,643 1,531 1,072 1,105 1,396 1,496
11Q3 1,673 1,555 1,066 1,110 1,403 1,463
11Q4 1,653 1,561 1,074 1,106 1,393 1,465
12Q1 1,686 1,578 1,086 1,115 1,405 1,496
12Q2 1,731 1,604 1,076 1,124 1,447 1,502
12Q3 1,751 1,628 1,088 1,125 1,456 1,517
12Q4 1,733 1,637 1,073 1,126 1,455 1,525
13Q1 1,754 1,646 1,083 1,137 1,469 1,522
13Q2 1,778 1,671 1,100 1,147 1,510 1,554
13Q3 1,829 1,708 1,108 1,161 1,522 1,597
13Q4 1,835 1,700 1,114 1,167 1,529 1,595
14Q1 1,846 1,702 1,132 1,196 1,537 1,605
14Q2 1,877 1,729 1,154 1,207 1,587 1,672
14Q3 1,939 1,765 1,168 1,230 1,610 1,683
14Q4 1,949 1,781 1,173 1,232 1,614 1,671
Table D-15: Apartment Vacancy Rates & Rents in Southern California
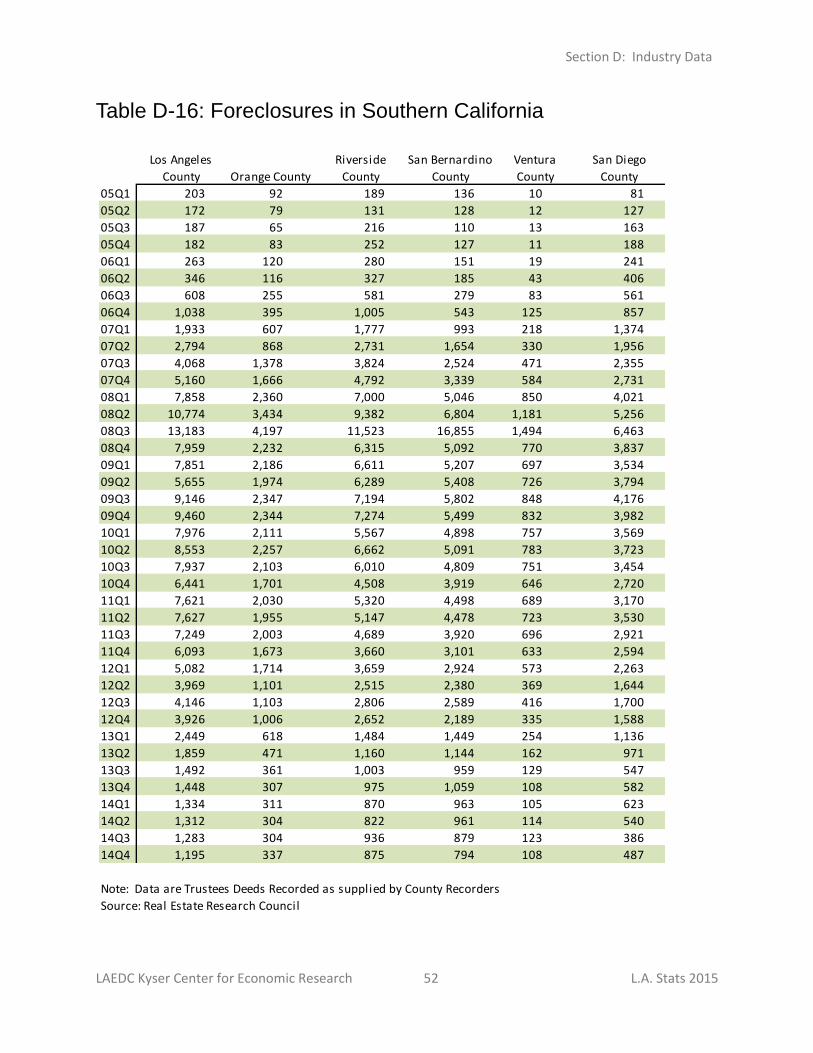
Section D: Industry Data
LAEDC Kyser Center for Economic Research 52 L.A. Stats 2015
Los Angeles
County Orange County
Riverside
County
San Bernardino
County
Ventura
County
San Diego
County
05Q1 203 92 189 136 10 81
05Q2 172 79 131 128 12 127
05Q3 187 65 216 110 13 163
05Q4 182 83 252 127 11 188
06Q1 263 120 280 151 19 241
06Q2 346 116 327 185 43 406
06Q3 608 255 581 279 83 561
06Q4 1,038 395 1,005 543 125 857
07Q1 1,933 607 1,777 993 218 1,374
07Q2 2,794 868 2,731 1,654 330 1,956
07Q3 4,068 1,378 3,824 2,524 471 2,355
07Q4 5,160 1,666 4,792 3,339 584 2,731
08Q1 7,858 2,360 7,000 5,046 850 4,021
08Q2 10,774 3,434 9,382 6,804 1,181 5,256
08Q3 13,183 4,197 11,523 16,855 1,494 6,463
08Q4 7,959 2,232 6,315 5,092 770 3,837
09Q1 7,851 2,186 6,611 5,207 697 3,534
09Q2 5,655 1,974 6,289 5,408 726 3,794
09Q3 9,146 2,347 7,194 5,802 848 4,176
09Q4 9,460 2,344 7,274 5,499 832 3,982
10Q1 7,976 2,111 5,567 4,898 757 3,569
10Q2 8,553 2,257 6,662 5,091 783 3,723
10Q3 7,937 2,103 6,010 4,809 751 3,454
10Q4 6,441 1,701 4,508 3,919 646 2,720
11Q1 7,621 2,030 5,320 4,498 689 3,170
11Q2 7,627 1,955 5,147 4,478 723 3,530
11Q3 7,249 2,003 4,689 3,920 696 2,921
11Q4 6,093 1,673 3,660 3,101 633 2,594
12Q1 5,082 1,714 3,659 2,924 573 2,263
12Q2 3,969 1,101 2,515 2,380 369 1,644
12Q3 4,146 1,103 2,806 2,589 416 1,700
12Q4 3,926 1,006 2,652 2,189 335 1,588
13Q1 2,449 618 1,484 1,449 254 1,136
13Q2 1,859 471 1,160 1,144 162 971
13Q3 1,492 361 1,003 959 129 547
13Q4 1,448 307 975 1,059 108 582
14Q1 1,334 311 870 963 105 623
14Q2 1,312 304 822 961 114 540
14Q3 1,283 304 936 879 123 386
14Q4 1,195 337 875 794 108 487
Note: Data are Trustees Deeds Recorded as supplied by County Recorders
Source: Real Estate Research Council
Table D-16: Foreclosures in Southern California
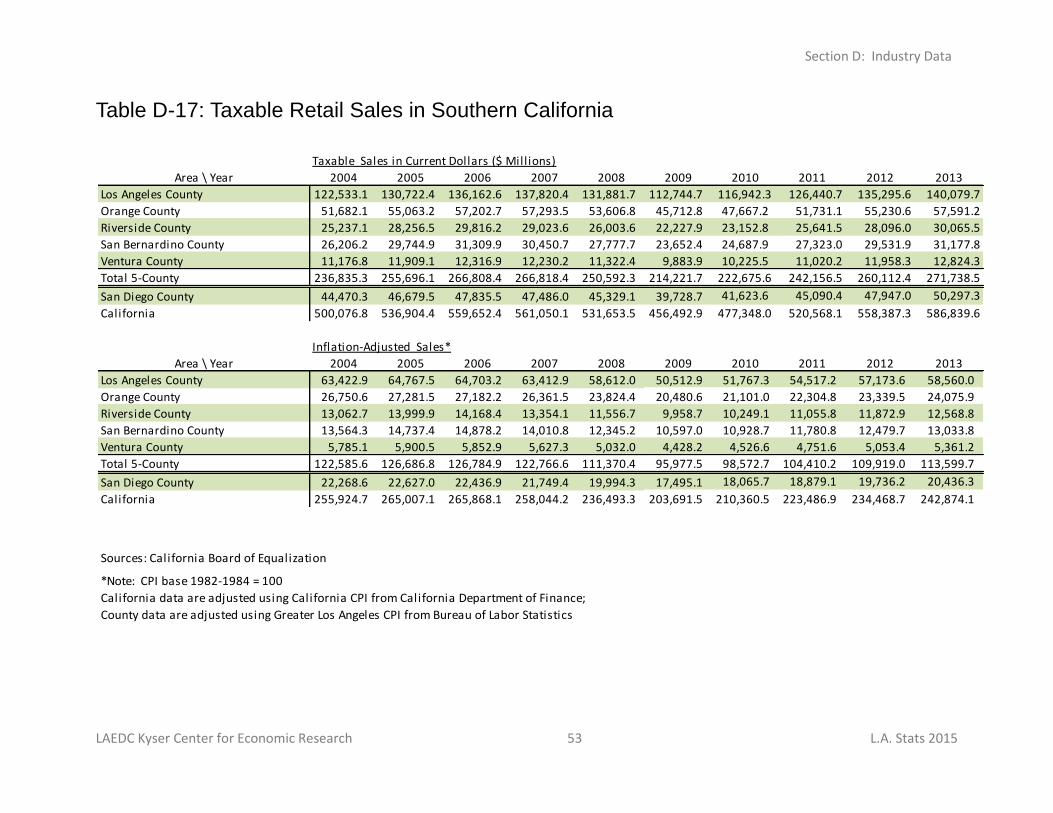
Section D: Industry Data
LAEDC Kyser Center for Economic Research 53 L.A. Stats 2015
Sources: California Board of Equalization
*Note: CPI base 1982-1984 = 100
California data are adjusted using California CPI from California Department of Finance;
County data are adjusted using Greater Los Angeles CPI from Bureau of Labor Statistics
Taxable Sales in Current Dollars ($ Mill ions)
Area \ Year 2004 2005 2006 2007 2008 2009 2010 2011 2012 2013
Los Angeles County 122,533.1 130,722.4 136,162.6 137,820.4 131,881.7 112,744.7 116,942.3 126,440.7 135,295.6 140,079.7
Orange County 51,682.1 55,063.2 57,202.7 57,293.5 53,606.8 45,712.8 47,667.2 51,731.1 55,230.6 57,591.2
Riverside County 25,237.1 28,256.5 29,816.2 29,023.6 26,003.6 22,227.9 23,152.8 25,641.5 28,096.0 30,065.5
San Bernardino County 26,206.2 29,744.9 31,309.9 30,450.7 27,777.7 23,652.4 24,687.9 27,323.0 29,531.9 31,177.8
Ventura County 11,176.8 11,909.1 12,316.9 12,230.2 11,322.4 9,883.9 10,225.5 11,020.2 11,958.3 12,824.3
Total 5-County 236,835.3 255,696.1 266,808.4 266,818.4 250,592.3 214,221.7 222,675.6 242,156.5 260,112.4 271,738.5
San Diego County 44,470.3 46,679.5 47,835.5 47,486.0 45,329.1 39,728.7 41,623.6 45,090.4 47,947.0 50,297.3
California 500,076.8 536,904.4 559,652.4 561,050.1 531,653.5 456,492.9 477,348.0 520,568.1 558,387.3 586,839.6
Inflation-Adjusted Sales*
Area \ Year 2004 2005 2006 2007 2008 2009 2010 2011 2012 2013
Los Angeles County 63,422.9 64,767.5 64,703.2 63,412.9 58,612.0 50,512.9 51,767.3 54,517.2 57,173.6 58,560.0
Orange County 26,750.6 27,281.5 27,182.2 26,361.5 23,824.4 20,480.6 21,101.0 22,304.8 23,339.5 24,075.9
Riverside County 13,062.7 13,999.9 14,168.4 13,354.1 11,556.7 9,958.7 10,249.1 11,055.8 11,872.9 12,568.8
San Bernardino County 13,564.3 14,737.4 14,878.2 14,010.8 12,345.2 10,597.0 10,928.7 11,780.8 12,479.7 13,033.8
Ventura County 5,785.1 5,900.5 5,852.9 5,627.3 5,032.0 4,428.2 4,526.6 4,751.6 5,053.4 5,361.2
Total 5-County 122,585.6 126,686.8 126,784.9 122,766.6 111,370.4 95,977.5 98,572.7 104,410.2 109,919.0 113,599.7
San Diego County 22,268.6 22,627.0 22,436.9 21,749.4 19,994.3 17,495.1 18,065.7 18,879.1 19,736.2 20,436.3
California 255,924.7 265,007.1 265,868.1 258,044.2 236,493.3 203,691.5 210,360.5 223,486.9 234,468.7 242,874.1
Table D-17: Taxable Retail Sales in Southern California
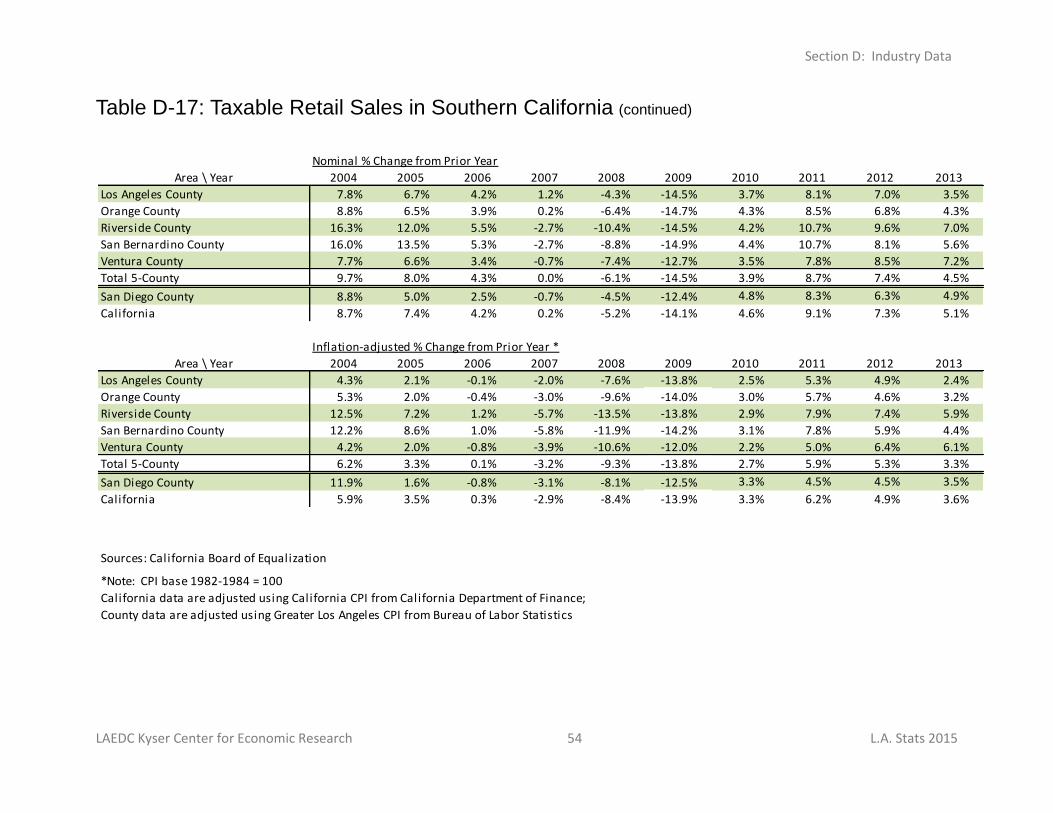
Section D: Industry Data
LAEDC Kyser Center for Economic Research 54 L.A. Stats 2015
Sources: California Board of Equalization
*Note: CPI base 1982-1984 = 100
California data are adjusted using California CPI from California Department of Finance;
County data are adjusted using Greater Los Angeles CPI from Bureau of Labor Statistics
Nominal % Change from Prior Year
Area \ Year 2004 2005 2006 2007 2008 2009 2010 2011 2012 2013
Los Angeles County 7.8% 6.7% 4.2% 1.2% -4.3% -14.5% 3.7% 8.1% 7.0% 3.5%
Orange County 8.8% 6.5% 3.9% 0.2% -6.4% -14.7% 4.3% 8.5% 6.8% 4.3%
Riverside County 16.3% 12.0% 5.5% -2.7% -10.4% -14.5% 4.2% 10.7% 9.6% 7.0%
San Bernardino County 16.0% 13.5% 5.3% -2.7% -8.8% -14.9% 4.4% 10.7% 8.1% 5.6%
Ventura County 7.7% 6.6% 3.4% -0.7% -7.4% -12.7% 3.5% 7.8% 8.5% 7.2%
Total 5-County 9.7% 8.0% 4.3% 0.0% -6.1% -14.5% 3.9% 8.7% 7.4% 4.5%
San Diego County 8.8% 5.0% 2.5% -0.7% -4.5% -12.4% 4.8% 8.3% 6.3% 4.9%
California 8.7% 7.4% 4.2% 0.2% -5.2% -14.1% 4.6% 9.1% 7.3% 5.1%
Inflation-adjusted % Change from Prior Year *
Area \ Year 2004 2005 2006 2007 2008 2009 2010 2011 2012 2013
Los Angeles County 4.3% 2.1% -0.1% -2.0% -7.6% -13.8% 2.5% 5.3% 4.9% 2.4%
Orange County 5.3% 2.0% -0.4% -3.0% -9.6% -14.0% 3.0% 5.7% 4.6% 3.2%
Riverside County 12.5% 7.2% 1.2% -5.7% -13.5% -13.8% 2.9% 7.9% 7.4% 5.9%
San Bernardino County 12.2% 8.6% 1.0% -5.8% -11.9% -14.2% 3.1% 7.8% 5.9% 4.4%
Ventura County 4.2% 2.0% -0.8% -3.9% -10.6% -12.0% 2.2% 5.0% 6.4% 6.1%
Total 5-County 6.2% 3.3% 0.1% -3.2% -9.3% -13.8% 2.7% 5.9% 5.3% 3.3%
San Diego County 11.9% 1.6% -0.8% -3.1% -8.1% -12.5% 3.3% 4.5% 4.5% 3.5%
California 5.9% 3.5% 0.3% -2.9% -8.4% -13.9% 3.3% 6.2% 4.9% 3.6%
Table D-17: Taxable Retail Sales in Southern California (continued)
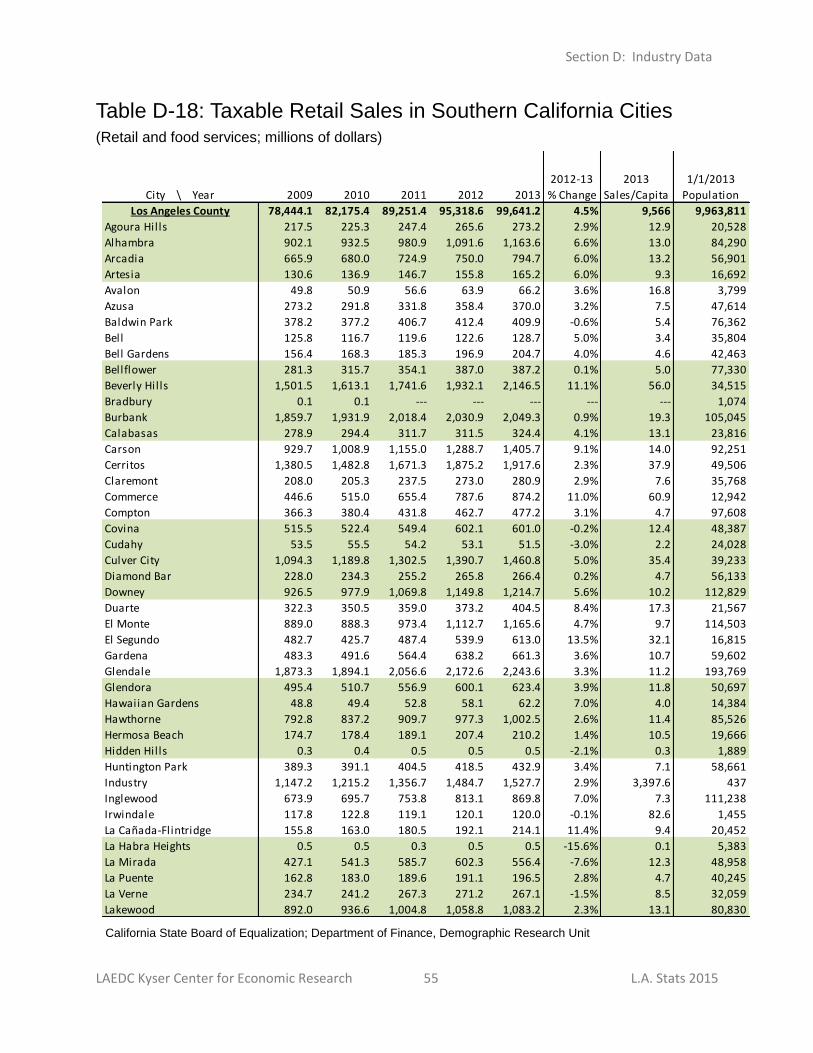
Section D: Industry Data
LAEDC Kyser Center for Economic Research 55 L.A. Stats 2015
2011 2012 2013
Los Angeles County 78,444.1 82,175.4 89,251.4 95,318.6 99,641.2 4.5% 9,566 9,963,811
Agoura Hills 217.5 225.3 247.4 265.6 273.2 2.9% 12.9 20,528
Alhambra 902.1 932.5 980.9 1,091.6 1,163.6 6.6% 13.0 84,290
Arcadia 665.9 680.0 724.9 750.0 794.7 6.0% 13.2 56,901
Artesia 130.6 136.9 146.7 155.8 165.2 6.0% 9.3 16,692
Avalon 49.8 50.9 56.6 63.9 66.2 3.6% 16.8 3,799
Azusa 273.2 291.8 331.8 358.4 370.0 3.2% 7.5 47,614
Baldwin Park 378.2 377.2 406.7 412.4 409.9 -0.6% 5.4 76,362
Bell 125.8 116.7 119.6 122.6 128.7 5.0% 3.4 35,804
Bell Gardens 156.4 168.3 185.3 196.9 204.7 4.0% 4.6 42,463
Bellflower 281.3 315.7 354.1 387.0 387.2 0.1% 5.0 77,330
Beverly Hills 1,501.5 1,613.1 1,741.6 1,932.1 2,146.5 11.1% 56.0 34,515
Bradbury 0.1 0.1 --- --- --- --- --- 1,074
Burbank 1,859.7 1,931.9 2,018.4 2,030.9 2,049.3 0.9% 19.3 105,045
Calabasas 278.9 294.4 311.7 311.5 324.4 4.1% 13.1 23,816
Carson 929.7 1,008.9 1,155.0 1,288.7 1,405.7 9.1% 14.0 92,251
Cerritos 1,380.5 1,482.8 1,671.3 1,875.2 1,917.6 2.3% 37.9 49,506
Claremont 208.0 205.3 237.5 273.0 280.9 2.9% 7.6 35,768
Commerce 446.6 515.0 655.4 787.6 874.2 11.0% 60.9 12,942
Compton 366.3 380.4 431.8 462.7 477.2 3.1% 4.7 97,608
Covina 515.5 522.4 549.4 602.1 601.0 -0.2% 12.4 48,387
Cudahy 53.5 55.5 54.2 53.1 51.5 -3.0% 2.2 24,028
Culver City 1,094.3 1,189.8 1,302.5 1,390.7 1,460.8 5.0% 35.4 39,233
Diamond Bar 228.0 234.3 255.2 265.8 266.4 0.2% 4.7 56,133
Downey 926.5 977.9 1,069.8 1,149.8 1,214.7 5.6% 10.2 112,829
Duarte 322.3 350.5 359.0 373.2 404.5 8.4% 17.3 21,567
El Monte 889.0 888.3 973.4 1,112.7 1,165.6 4.7% 9.7 114,503
El Segundo 482.7 425.7 487.4 539.9 613.0 13.5% 32.1 16,815
Gardena 483.3 491.6 564.4 638.2 661.3 3.6% 10.7 59,602
Glendale 1,873.3 1,894.1 2,056.6 2,172.6 2,243.6 3.3% 11.2 193,769
Glendora 495.4 510.7 556.9 600.1 623.4 3.9% 11.8 50,697
Hawaiian Gardens 48.8 49.4 52.8 58.1 62.2 7.0% 4.0 14,384
Hawthorne 792.8 837.2 909.7 977.3 1,002.5 2.6% 11.4 85,526
Hermosa Beach 174.7 178.4 189.1 207.4 210.2 1.4% 10.5 19,666
Hidden Hills 0.3 0.4 0.5 0.5 0.5 -2.1% 0.3 1,889
Huntington Park 389.3 391.1 404.5 418.5 432.9 3.4% 7.1 58,661
Industry 1,147.2 1,215.2 1,356.7 1,484.7 1,527.7 2.9% 3,397.6 437
Inglewood 673.9 695.7 753.8 813.1 869.8 7.0% 7.3 111,238
Irwindale 117.8 122.8 119.1 120.1 120.0 -0.1% 82.6 1,455
La Cañada-Flintridge 155.8 163.0 180.5 192.1 214.1 11.4% 9.4 20,452
La Habra Heights 0.5 0.5 0.3 0.5 0.5 -15.6% 0.1 5,383
La Mirada 427.1 541.3 585.7 602.3 556.4 -7.6% 12.3 48,958
La Puente 162.8 183.0 189.6 191.1 196.5 2.8% 4.7 40,245
La Verne 234.7 241.2 267.3 271.2 267.1 -1.5% 8.5 32,059
Lakewood 892.0 936.6 1,004.8 1,058.8 1,083.2 2.3% 13.1 80,830
2013
Sales/Capita City \ Year 2009
2012-13
% Change2010
1/1/2013
Population
Table D-18: Taxable Retail Sales in Southern California Cities
(Retail and food services; millions of dollars)
California State Board of Equalization; Department of Finance, Demographic Research Unit
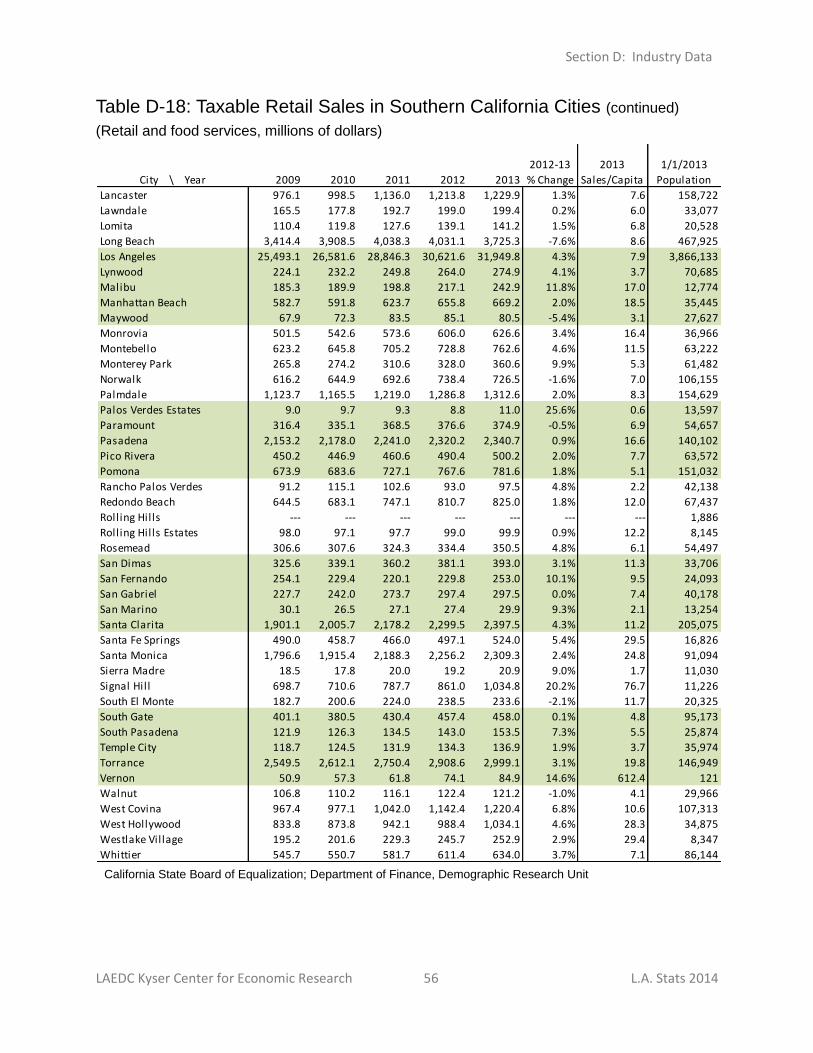
Section D: Industry Data
LAEDC Kyser Center for Economic Research 56 L.A. Stats 2014
2011 2012 2013
Lancaster 976.1 998.5 1,136.0 1,213.8 1,229.9 1.3% 7.6 158,722
Lawndale 165.5 177.8 192.7 199.0 199.4 0.2% 6.0 33,077
Lomita 110.4 119.8 127.6 139.1 141.2 1.5% 6.8 20,528
Long Beach 3,414.4 3,908.5 4,038.3 4,031.1 3,725.3 -7.6% 8.6 467,925
Los Angeles 25,493.1 26,581.6 28,846.3 30,621.6 31,949.8 4.3% 7.9 3,866,133
Lynwood 224.1 232.2 249.8 264.0 274.9 4.1% 3.7 70,685
Malibu 185.3 189.9 198.8 217.1 242.9 11.8% 17.0 12,774
Manhattan Beach 582.7 591.8 623.7 655.8 669.2 2.0% 18.5 35,445
Maywood 67.9 72.3 83.5 85.1 80.5 -5.4% 3.1 27,627
Monrovia 501.5 542.6 573.6 606.0 626.6 3.4% 16.4 36,966
Montebello 623.2 645.8 705.2 728.8 762.6 4.6% 11.5 63,222
Monterey Park 265.8 274.2 310.6 328.0 360.6 9.9% 5.3 61,482
Norwalk 616.2 644.9 692.6 738.4 726.5 -1.6% 7.0 106,155
Palmdale 1,123.7 1,165.5 1,219.0 1,286.8 1,312.6 2.0% 8.3 154,629
Palos Verdes Estates 9.0 9.7 9.3 8.8 11.0 25.6% 0.6 13,597
Paramount 316.4 335.1 368.5 376.6 374.9 -0.5% 6.9 54,657
Pasadena 2,153.2 2,178.0 2,241.0 2,320.2 2,340.7 0.9% 16.6 140,102
Pico Rivera 450.2 446.9 460.6 490.4 500.2 2.0% 7.7 63,572
Pomona 673.9 683.6 727.1 767.6 781.6 1.8% 5.1 151,032
Rancho Palos Verdes 91.2 115.1 102.6 93.0 97.5 4.8% 2.2 42,138
Redondo Beach 644.5 683.1 747.1 810.7 825.0 1.8% 12.0 67,437
Rolling Hills --- --- --- --- --- --- --- 1,886
Rolling Hills Estates 98.0 97.1 97.7 99.0 99.9 0.9% 12.2 8,145
Rosemead 306.6 307.6 324.3 334.4 350.5 4.8% 6.1 54,497
San Dimas 325.6 339.1 360.2 381.1 393.0 3.1% 11.3 33,706
San Fernando 254.1 229.4 220.1 229.8 253.0 10.1% 9.5 24,093
San Gabriel 227.7 242.0 273.7 297.4 297.5 0.0% 7.4 40,178
San Marino 30.1 26.5 27.1 27.4 29.9 9.3% 2.1 13,254
Santa Clarita 1,901.1 2,005.7 2,178.2 2,299.5 2,397.5 4.3% 11.2 205,075
Santa Fe Springs 490.0 458.7 466.0 497.1 524.0 5.4% 29.5 16,826
Santa Monica 1,796.6 1,915.4 2,188.3 2,256.2 2,309.3 2.4% 24.8 91,094
Sierra Madre 18.5 17.8 20.0 19.2 20.9 9.0% 1.7 11,030
Signal Hill 698.7 710.6 787.7 861.0 1,034.8 20.2% 76.7 11,226
South El Monte 182.7 200.6 224.0 238.5 233.6 -2.1% 11.7 20,325
South Gate 401.1 380.5 430.4 457.4 458.0 0.1% 4.8 95,173
South Pasadena 121.9 126.3 134.5 143.0 153.5 7.3% 5.5 25,874
Temple City 118.7 124.5 131.9 134.3 136.9 1.9% 3.7 35,974
Torrance 2,549.5 2,612.1 2,750.4 2,908.6 2,999.1 3.1% 19.8 146,949
Vernon 50.9 57.3 61.8 74.1 84.9 14.6% 612.4 121
Walnut 106.8 110.2 116.1 122.4 121.2 -1.0% 4.1 29,966
West Covina 967.4 977.1 1,042.0 1,142.4 1,220.4 6.8% 10.6 107,313
West Hollywood 833.8 873.8 942.1 988.4 1,034.1 4.6% 28.3 34,875
Westlake Village 195.2 201.6 229.3 245.7 252.9 2.9% 29.4 8,347
Whittier 545.7 550.7 581.7 611.4 634.0 3.7% 7.1 86,144
2009
2012-13
% Change
2013
Sales/Capita
1/1/2013
Population2010City \ Year
Table D-18: Taxable Retail Sales in Southern California Cities (continued)
(Retail and food services, millions of dollars)
California State Board of Equalization; Department of Finance, Demographic Research Unit
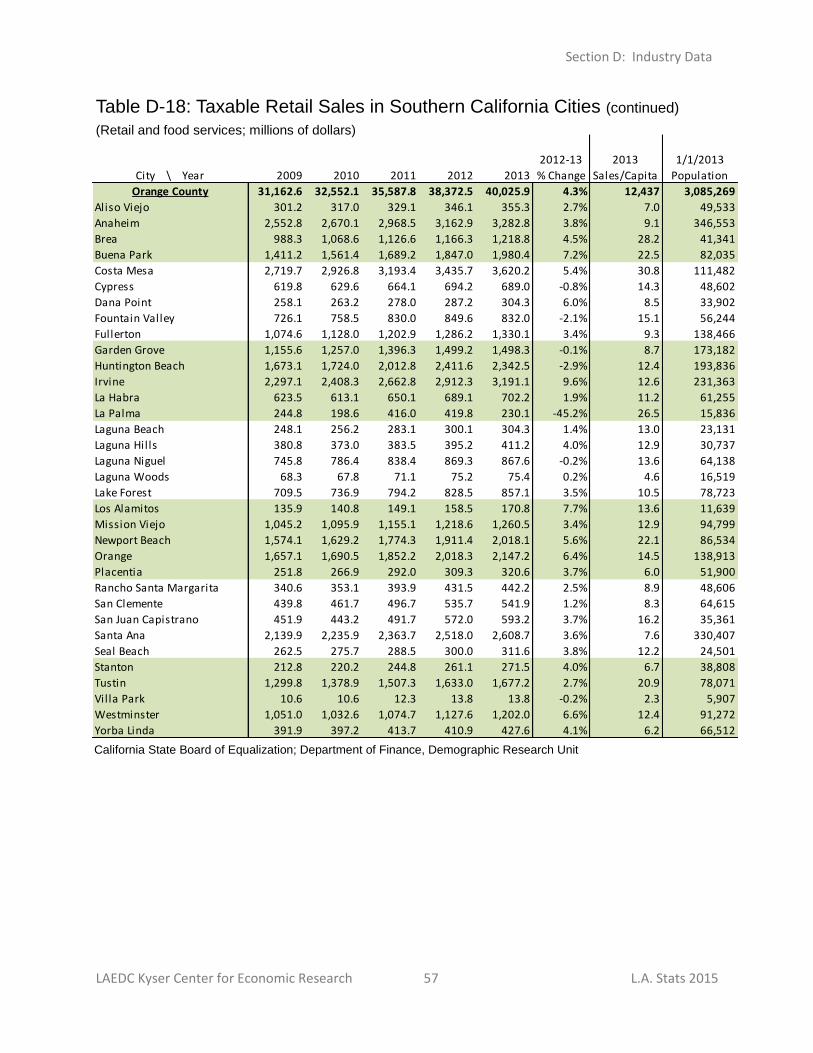
Section D: Industry Data
LAEDC Kyser Center for Economic Research 57 L.A. Stats 2015
2011 2012 2013
Orange County 31,162.6 32,552.1 35,587.8 38,372.5 40,025.9 4.3% 12,437 3,085,269
Aliso Viejo 301.2 317.0 329.1 346.1 355.3 2.7% 7.0 49,533
Anaheim 2,552.8 2,670.1 2,968.5 3,162.9 3,282.8 3.8% 9.1 346,553
Brea 988.3 1,068.6 1,126.6 1,166.3 1,218.8 4.5% 28.2 41,341
Buena Park 1,411.2 1,561.4 1,689.2 1,847.0 1,980.4 7.2% 22.5 82,035
Costa Mesa 2,719.7 2,926.8 3,193.4 3,435.7 3,620.2 5.4% 30.8 111,482
Cypress 619.8 629.6 664.1 694.2 689.0 -0.8% 14.3 48,602
Dana Point 258.1 263.2 278.0 287.2 304.3 6.0% 8.5 33,902
Fountain Valley 726.1 758.5 830.0 849.6 832.0 -2.1% 15.1 56,244
Fullerton 1,074.6 1,128.0 1,202.9 1,286.2 1,330.1 3.4% 9.3 138,466
Garden Grove 1,155.6 1,257.0 1,396.3 1,499.2 1,498.3 -0.1% 8.7 173,182
Huntington Beach 1,673.1 1,724.0 2,012.8 2,411.6 2,342.5 -2.9% 12.4 193,836
Irvine 2,297.1 2,408.3 2,662.8 2,912.3 3,191.1 9.6% 12.6 231,363
La Habra 623.5 613.1 650.1 689.1 702.2 1.9% 11.2 61,255
La Palma 244.8 198.6 416.0 419.8 230.1 -45.2% 26.5 15,836
Laguna Beach 248.1 256.2 283.1 300.1 304.3 1.4% 13.0 23,131
Laguna Hills 380.8 373.0 383.5 395.2 411.2 4.0% 12.9 30,737
Laguna Niguel 745.8 786.4 838.4 869.3 867.6 -0.2% 13.6 64,138
Laguna Woods 68.3 67.8 71.1 75.2 75.4 0.2% 4.6 16,519
Lake Forest 709.5 736.9 794.2 828.5 857.1 3.5% 10.5 78,723
Los Alamitos 135.9 140.8 149.1 158.5 170.8 7.7% 13.6 11,639
Mission Viejo 1,045.2 1,095.9 1,155.1 1,218.6 1,260.5 3.4% 12.9 94,799
Newport Beach 1,574.1 1,629.2 1,774.3 1,911.4 2,018.1 5.6% 22.1 86,534
Orange 1,657.1 1,690.5 1,852.2 2,018.3 2,147.2 6.4% 14.5 138,913
Placentia 251.8 266.9 292.0 309.3 320.6 3.7% 6.0 51,900
Rancho Santa Margarita 340.6 353.1 393.9 431.5 442.2 2.5% 8.9 48,606
San Clemente 439.8 461.7 496.7 535.7 541.9 1.2% 8.3 64,615
San Juan Capistrano 451.9 443.2 491.7 572.0 593.2 3.7% 16.2 35,361
Santa Ana 2,139.9 2,235.9 2,363.7 2,518.0 2,608.7 3.6% 7.6 330,407
Seal Beach 262.5 275.7 288.5 300.0 311.6 3.8% 12.2 24,501
Stanton 212.8 220.2 244.8 261.1 271.5 4.0% 6.7 38,808
Tustin 1,299.8 1,378.9 1,507.3 1,633.0 1,677.2 2.7% 20.9 78,071
Villa Park 10.6 10.6 12.3 13.8 13.8 -0.2% 2.3 5,907
Westminster 1,051.0 1,032.6 1,074.7 1,127.6 1,202.0 6.6% 12.4 91,272
Yorba Linda 391.9 397.2 413.7 410.9 427.6 4.1% 6.2 66,512
2009
2012-13
% Change
2013
Sales/Capita
1/1/2013
PopulationCity \ Year 2010
Table D-18: Taxable Retail Sales in Southern California Cities (continued) (Retail and food services; millions of dollars)
California State Board of Equalization; Department of Finance, Demographic Research Unit
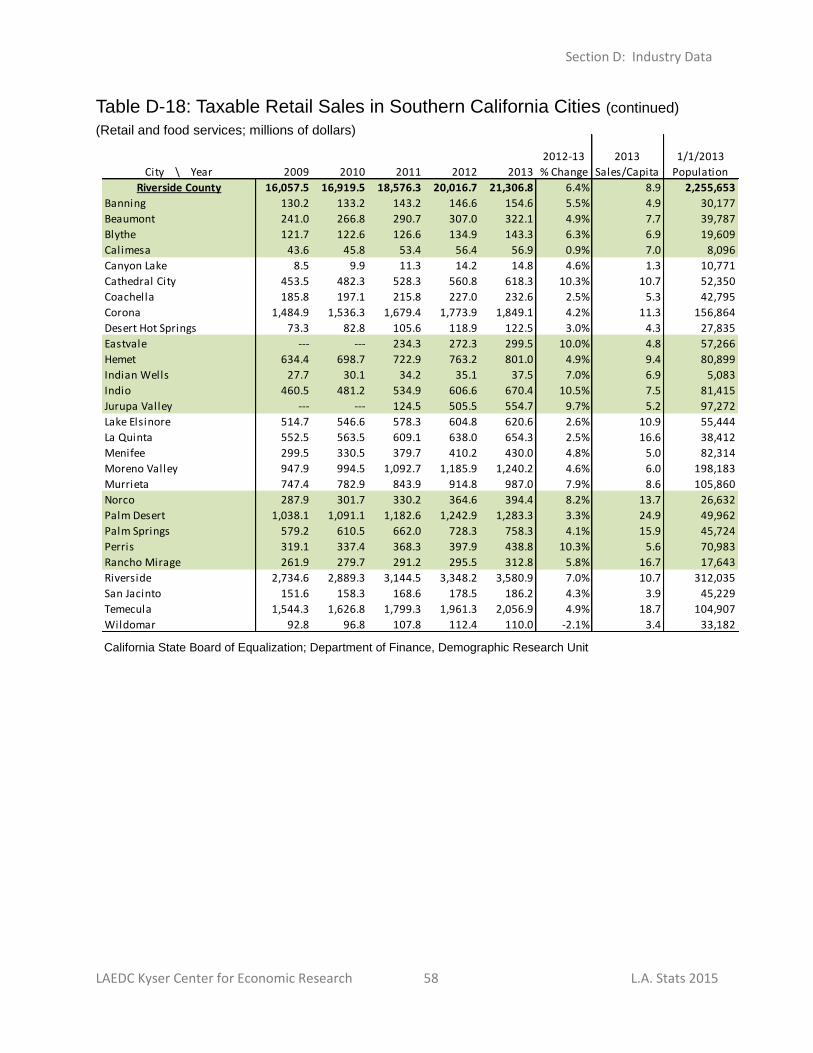
Section D: Industry Data
LAEDC Kyser Center for Economic Research 58 L.A. Stats 2015
2011 2012 2013
Riverside County 16,057.5 16,919.5 18,576.3 20,016.7 21,306.8 6.4% 8.9 2,255,653
Banning 130.2 133.2 143.2 146.6 154.6 5.5% 4.9 30,177
Beaumont 241.0 266.8 290.7 307.0 322.1 4.9% 7.7 39,787
Blythe 121.7 122.6 126.6 134.9 143.3 6.3% 6.9 19,609
Calimesa 43.6 45.8 53.4 56.4 56.9 0.9% 7.0 8,096
Canyon Lake 8.5 9.9 11.3 14.2 14.8 4.6% 1.3 10,771
Cathedral City 453.5 482.3 528.3 560.8 618.3 10.3% 10.7 52,350
Coachella 185.8 197.1 215.8 227.0 232.6 2.5% 5.3 42,795
Corona 1,484.9 1,536.3 1,679.4 1,773.9 1,849.1 4.2% 11.3 156,864
Desert Hot Springs 73.3 82.8 105.6 118.9 122.5 3.0% 4.3 27,835
Eastvale --- --- 234.3 272.3 299.5 10.0% 4.8 57,266
Hemet 634.4 698.7 722.9 763.2 801.0 4.9% 9.4 80,899
Indian Wells 27.7 30.1 34.2 35.1 37.5 7.0% 6.9 5,083
Indio 460.5 481.2 534.9 606.6 670.4 10.5% 7.5 81,415
Jurupa Valley --- --- 124.5 505.5 554.7 9.7% 5.2 97,272
Lake Elsinore 514.7 546.6 578.3 604.8 620.6 2.6% 10.9 55,444
La Quinta 552.5 563.5 609.1 638.0 654.3 2.5% 16.6 38,412
Menifee 299.5 330.5 379.7 410.2 430.0 4.8% 5.0 82,314
Moreno Valley 947.9 994.5 1,092.7 1,185.9 1,240.2 4.6% 6.0 198,183
Murrieta 747.4 782.9 843.9 914.8 987.0 7.9% 8.6 105,860
Norco 287.9 301.7 330.2 364.6 394.4 8.2% 13.7 26,632
Palm Desert 1,038.1 1,091.1 1,182.6 1,242.9 1,283.3 3.3% 24.9 49,962
Palm Springs 579.2 610.5 662.0 728.3 758.3 4.1% 15.9 45,724
Perris 319.1 337.4 368.3 397.9 438.8 10.3% 5.6 70,983
Rancho Mirage 261.9 279.7 291.2 295.5 312.8 5.8% 16.7 17,643
Riverside 2,734.6 2,889.3 3,144.5 3,348.2 3,580.9 7.0% 10.7 312,035
San Jacinto 151.6 158.3 168.6 178.5 186.2 4.3% 3.9 45,229
Temecula 1,544.3 1,626.8 1,799.3 1,961.3 2,056.9 4.9% 18.7 104,907
Wildomar 92.8 96.8 107.8 112.4 110.0 -2.1% 3.4 33,182
2013
Sales/Capita
1/1/2013
PopulationCity \ Year 20102009
2012-13
% Change
Table D-18: Taxable Retail Sales in Southern California Cities (continued) (Retail and food services; millions of dollars)
California State Board of Equalization; Department of Finance, Demographic Research Unit
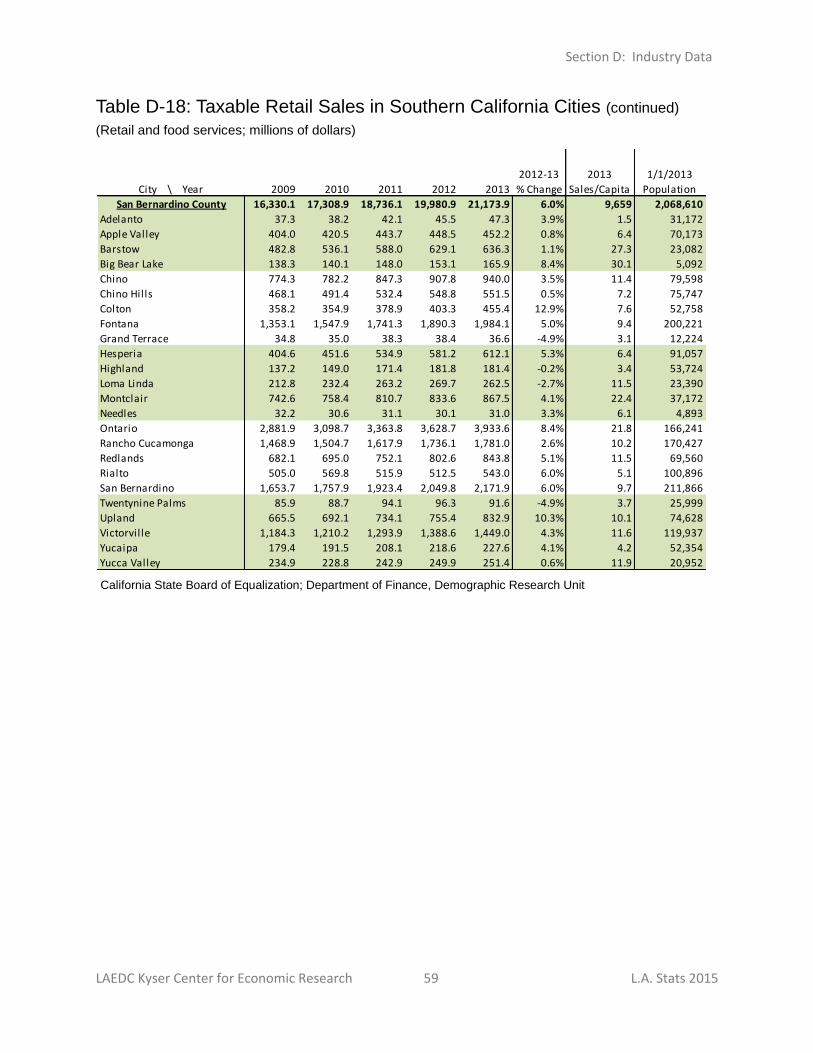
Section D: Industry Data
LAEDC Kyser Center for Economic Research 59 L.A. Stats 2015
2011 2012 2013
San Bernardino County 16,330.1 17,308.9 18,736.1 19,980.9 21,173.9 6.0% 9,659 2,068,610
Adelanto 37.3 38.2 42.1 45.5 47.3 3.9% 1.5 31,172
Apple Valley 404.0 420.5 443.7 448.5 452.2 0.8% 6.4 70,173
Barstow 482.8 536.1 588.0 629.1 636.3 1.1% 27.3 23,082
Big Bear Lake 138.3 140.1 148.0 153.1 165.9 8.4% 30.1 5,092
Chino 774.3 782.2 847.3 907.8 940.0 3.5% 11.4 79,598
Chino Hills 468.1 491.4 532.4 548.8 551.5 0.5% 7.2 75,747
Colton 358.2 354.9 378.9 403.3 455.4 12.9% 7.6 52,758
Fontana 1,353.1 1,547.9 1,741.3 1,890.3 1,984.1 5.0% 9.4 200,221
Grand Terrace 34.8 35.0 38.3 38.4 36.6 -4.9% 3.1 12,224
Hesperia 404.6 451.6 534.9 581.2 612.1 5.3% 6.4 91,057
Highland 137.2 149.0 171.4 181.8 181.4 -0.2% 3.4 53,724
Loma Linda 212.8 232.4 263.2 269.7 262.5 -2.7% 11.5 23,390
Montclair 742.6 758.4 810.7 833.6 867.5 4.1% 22.4 37,172
Needles 32.2 30.6 31.1 30.1 31.0 3.3% 6.1 4,893
Ontario 2,881.9 3,098.7 3,363.8 3,628.7 3,933.6 8.4% 21.8 166,241
Rancho Cucamonga 1,468.9 1,504.7 1,617.9 1,736.1 1,781.0 2.6% 10.2 170,427
Redlands 682.1 695.0 752.1 802.6 843.8 5.1% 11.5 69,560
Rialto 505.0 569.8 515.9 512.5 543.0 6.0% 5.1 100,896
San Bernardino 1,653.7 1,757.9 1,923.4 2,049.8 2,171.9 6.0% 9.7 211,866
Twentynine Palms 85.9 88.7 94.1 96.3 91.6 -4.9% 3.7 25,999
Upland 665.5 692.1 734.1 755.4 832.9 10.3% 10.1 74,628
Victorville 1,184.3 1,210.2 1,293.9 1,388.6 1,449.0 4.3% 11.6 119,937
Yucaipa 179.4 191.5 208.1 218.6 227.6 4.1% 4.2 52,354
Yucca Valley 234.9 228.8 242.9 249.9 251.4 0.6% 11.9 20,952
2009
2012-13
% Change2010
2013
Sales/Capita
1/1/2013
PopulationCity \ Year
Table D-18: Taxable Retail Sales in Southern California Cities (continued) (Retail and food services; millions of dollars)
California State Board of Equalization; Department of Finance, Demographic Research Unit
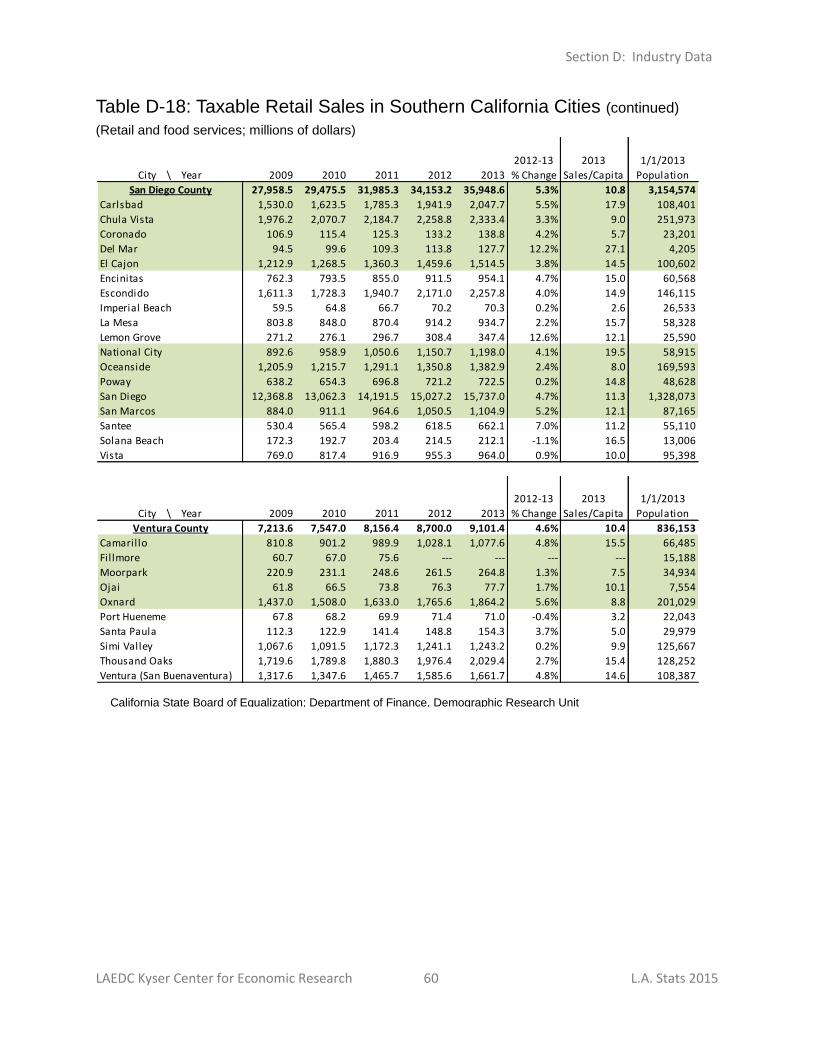
Section D: Industry Data
LAEDC Kyser Center for Economic Research 60 L.A. Stats 2015
2011 2012 2013
San Diego County 27,958.5 29,475.5 31,985.3 34,153.2 35,948.6 5.3% 10.8 3,154,574
Carlsbad 1,530.0 1,623.5 1,785.3 1,941.9 2,047.7 5.5% 17.9 108,401
Chula Vista 1,976.2 2,070.7 2,184.7 2,258.8 2,333.4 3.3% 9.0 251,973
Coronado 106.9 115.4 125.3 133.2 138.8 4.2% 5.7 23,201
Del Mar 94.5 99.6 109.3 113.8 127.7 12.2% 27.1 4,205
El Cajon 1,212.9 1,268.5 1,360.3 1,459.6 1,514.5 3.8% 14.5 100,602
Encinitas 762.3 793.5 855.0 911.5 954.1 4.7% 15.0 60,568
Escondido 1,611.3 1,728.3 1,940.7 2,171.0 2,257.8 4.0% 14.9 146,115
Imperial Beach 59.5 64.8 66.7 70.2 70.3 0.2% 2.6 26,533
La Mesa 803.8 848.0 870.4 914.2 934.7 2.2% 15.7 58,328
Lemon Grove 271.2 276.1 296.7 308.4 347.4 12.6% 12.1 25,590
National City 892.6 958.9 1,050.6 1,150.7 1,198.0 4.1% 19.5 58,915
Oceanside 1,205.9 1,215.7 1,291.1 1,350.8 1,382.9 2.4% 8.0 169,593
Poway 638.2 654.3 696.8 721.2 722.5 0.2% 14.8 48,628
San Diego 12,368.8 13,062.3 14,191.5 15,027.2 15,737.0 4.7% 11.3 1,328,073
San Marcos 884.0 911.1 964.6 1,050.5 1,104.9 5.2% 12.1 87,165
Santee 530.4 565.4 598.2 618.5 662.1 7.0% 11.2 55,110
Solana Beach 172.3 192.7 203.4 214.5 212.1 -1.1% 16.5 13,006
Vista 769.0 817.4 916.9 955.3 964.0 0.9% 10.0 95,398
2011 2012 2013
Ventura County 7,213.6 7,547.0 8,156.4 8,700.0 9,101.4 4.6% 10.4 836,153
Camarillo 810.8 901.2 989.9 1,028.1 1,077.6 4.8% 15.5 66,485
Fillmore 60.7 67.0 75.6 --- --- --- --- 15,188
Moorpark 220.9 231.1 248.6 261.5 264.8 1.3% 7.5 34,934
Ojai 61.8 66.5 73.8 76.3 77.7 1.7% 10.1 7,554
Oxnard 1,437.0 1,508.0 1,633.0 1,765.6 1,864.2 5.6% 8.8 201,029
Port Hueneme 67.8 68.2 69.9 71.4 71.0 -0.4% 3.2 22,043
Santa Paula 112.3 122.9 141.4 148.8 154.3 3.7% 5.0 29,979
Simi Valley 1,067.6 1,091.5 1,172.3 1,241.1 1,243.2 0.2% 9.9 125,667
Thousand Oaks 1,719.6 1,789.8 1,880.3 1,976.4 2,029.4 2.7% 15.4 128,252
Ventura (San Buenaventura) 1,317.6 1,347.6 1,465.7 1,585.6 1,661.7 4.8% 14.6 108,387
City \ Year
City \ Year
2009
2012-13
% Change
2013
Sales/Capita
1/1/2013
Population
2009
2012-13
% Change
2013
Sales/Capita
1/1/2013
Population2010
2010
California State Board of Equalization; Department of Finance, Demographic Research Unit
Table D-18: Taxable Retail Sales in Southern California Cities (continued) (Retail and food services; millions of dollars)
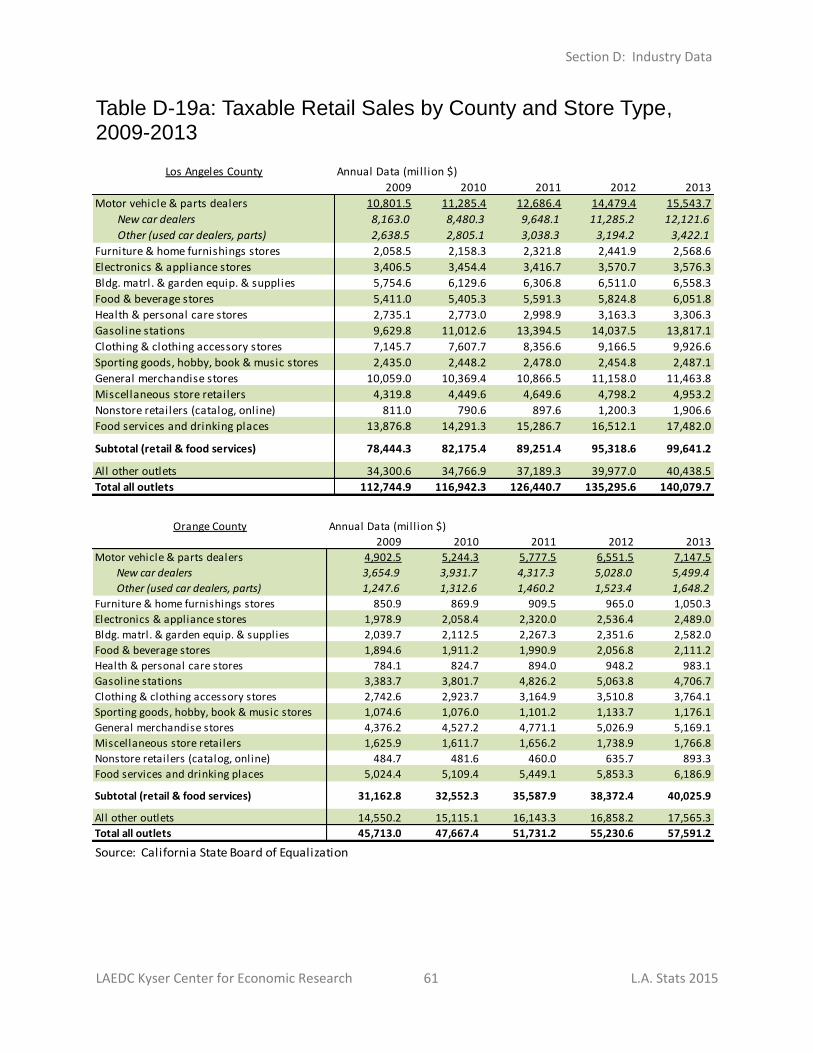
Section D: Industry Data
LAEDC Kyser Center for Economic Research 61 L.A. Stats 2015
Los Angeles County Annual Data (mill ion $)
2009 2010 2011 2012 2013
Motor vehicle & parts dealers 10,801.5 11,285.4 12,686.4 14,479.4 15,543.7
New car dealers 8,163.0 8,480.3 9,648.1 11,285.2 12,121.6
Other (used car dealers, parts) 2,638.5 2,805.1 3,038.3 3,194.2 3,422.1
Furniture & home furnishings stores 2,058.5 2,158.3 2,321.8 2,441.9 2,568.6
Electronics & appliance stores 3,406.5 3,454.4 3,416.7 3,570.7 3,576.3
Bldg. matrl. & garden equip. & supplies 5,754.6 6,129.6 6,306.8 6,511.0 6,558.3
Food & beverage stores 5,411.0 5,405.3 5,591.3 5,824.8 6,051.8
Health & personal care stores 2,735.1 2,773.0 2,998.9 3,163.3 3,306.3
Gasoline stations 9,629.8 11,012.6 13,394.5 14,037.5 13,817.1
Clothing & clothing accessory stores 7,145.7 7,607.7 8,356.6 9,166.5 9,926.6
Sporting goods, hobby, book & music stores 2,435.0 2,448.2 2,478.0 2,454.8 2,487.1
General merchandise stores 10,059.0 10,369.4 10,866.5 11,158.0 11,463.8
Miscellaneous store retailers 4,319.8 4,449.6 4,649.6 4,798.2 4,953.2
Nonstore retailers (catalog, online) 811.0 790.6 897.6 1,200.3 1,906.6
Food services and drinking places 13,876.8 14,291.3 15,286.7 16,512.1 17,482.0
Subtotal (retail & food services) 78,444.3 82,175.4 89,251.4 95,318.6 99,641.2
All other outlets 34,300.6 34,766.9 37,189.3 39,977.0 40,438.5
Total all outlets 112,744.9 116,942.3 126,440.7 135,295.6 140,079.7
Orange County Annual Data (mill ion $)
2009 2010 2011 2012 2013
Motor vehicle & parts dealers 4,902.5 5,244.3 5,777.5 6,551.5 7,147.5
New car dealers 3,654.9 3,931.7 4,317.3 5,028.0 5,499.4
Other (used car dealers, parts) 1,247.6 1,312.6 1,460.2 1,523.4 1,648.2
Furniture & home furnishings stores 850.9 869.9 909.5 965.0 1,050.3
Electronics & appliance stores 1,978.9 2,058.4 2,320.0 2,536.4 2,489.0
Bldg. matrl. & garden equip. & supplies 2,039.7 2,112.5 2,267.3 2,351.6 2,582.0
Food & beverage stores 1,894.6 1,911.2 1,990.9 2,056.8 2,111.2
Health & personal care stores 784.1 824.7 894.0 948.2 983.1
Gasoline stations 3,383.7 3,801.7 4,826.2 5,063.8 4,706.7
Clothing & clothing accessory stores 2,742.6 2,923.7 3,164.9 3,510.8 3,764.1
Sporting goods, hobby, book & music stores 1,074.6 1,076.0 1,101.2 1,133.7 1,176.1
General merchandise stores 4,376.2 4,527.2 4,771.1 5,026.9 5,169.1
Miscellaneous store retailers 1,625.9 1,611.7 1,656.2 1,738.9 1,766.8
Nonstore retailers (catalog, online) 484.7 481.6 460.0 635.7 893.3
Food services and drinking places 5,024.4 5,109.4 5,449.1 5,853.3 6,186.9
Subtotal (retail & food services) 31,162.8 32,552.3 35,587.9 38,372.4 40,025.9
All other outlets 14,550.2 15,115.1 16,143.3 16,858.2 17,565.3
Total all outlets 45,713.0 47,667.4 51,731.2 55,230.6 57,591.2
Source: California State Board of Equalization
Table D-19a: Taxable Retail Sales by County and Store Type, 2009-2013
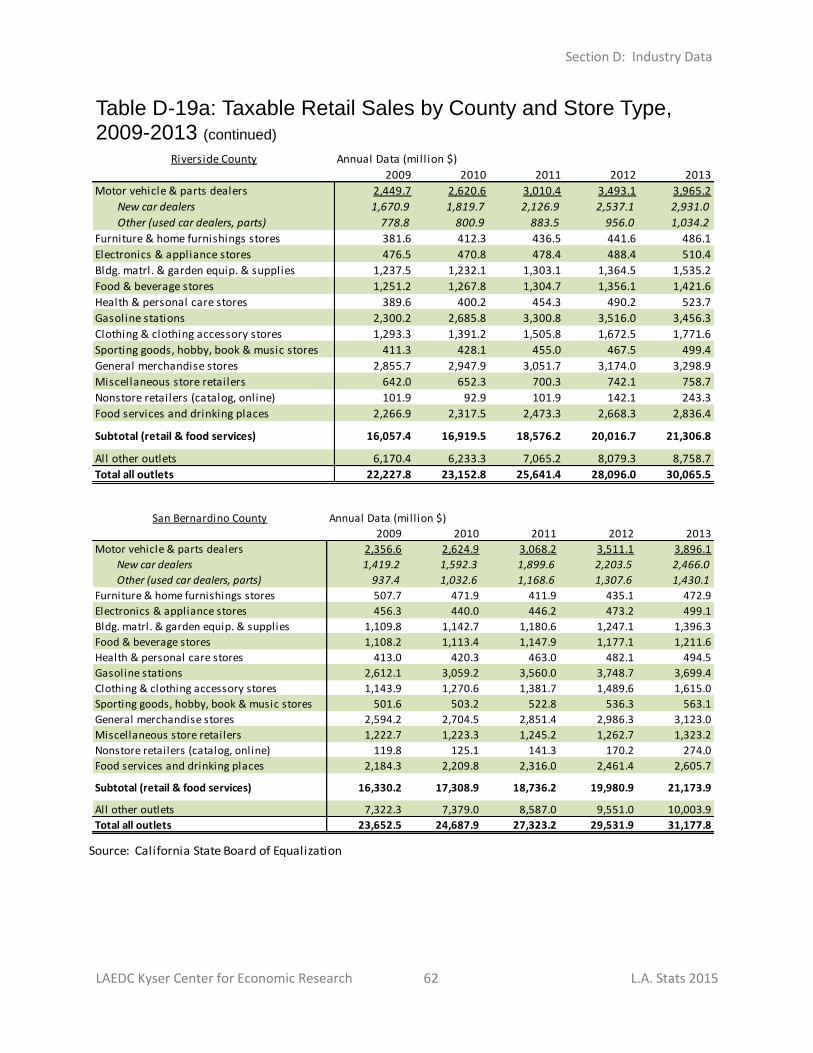
Section D: Industry Data
LAEDC Kyser Center for Economic Research 62 L.A. Stats 2015
Riverside County Annual Data (mill ion $)
2009 2010 2011 2012 2013
Motor vehicle & parts dealers 2,449.7 2,620.6 3,010.4 3,493.1 3,965.2
New car dealers 1,670.9 1,819.7 2,126.9 2,537.1 2,931.0
Other (used car dealers, parts) 778.8 800.9 883.5 956.0 1,034.2
Furniture & home furnishings stores 381.6 412.3 436.5 441.6 486.1
Electronics & appliance stores 476.5 470.8 478.4 488.4 510.4
Bldg. matrl. & garden equip. & supplies 1,237.5 1,232.1 1,303.1 1,364.5 1,535.2
Food & beverage stores 1,251.2 1,267.8 1,304.7 1,356.1 1,421.6
Health & personal care stores 389.6 400.2 454.3 490.2 523.7
Gasoline stations 2,300.2 2,685.8 3,300.8 3,516.0 3,456.3
Clothing & clothing accessory stores 1,293.3 1,391.2 1,505.8 1,672.5 1,771.6
Sporting goods, hobby, book & music stores 411.3 428.1 455.0 467.5 499.4
General merchandise stores 2,855.7 2,947.9 3,051.7 3,174.0 3,298.9
Miscellaneous store retailers 642.0 652.3 700.3 742.1 758.7
Nonstore retailers (catalog, online) 101.9 92.9 101.9 142.1 243.3
Food services and drinking places 2,266.9 2,317.5 2,473.3 2,668.3 2,836.4
Subtotal (retail & food services) 16,057.4 16,919.5 18,576.2 20,016.7 21,306.8
All other outlets 6,170.4 6,233.3 7,065.2 8,079.3 8,758.7
Total all outlets 22,227.8 23,152.8 25,641.4 28,096.0 30,065.5
San Bernardino County Annual Data (mill ion $)
2009 2010 2011 2012 2013
Motor vehicle & parts dealers 2,356.6 2,624.9 3,068.2 3,511.1 3,896.1
New car dealers 1,419.2 1,592.3 1,899.6 2,203.5 2,466.0
Other (used car dealers, parts) 937.4 1,032.6 1,168.6 1,307.6 1,430.1
Furniture & home furnishings stores 507.7 471.9 411.9 435.1 472.9
Electronics & appliance stores 456.3 440.0 446.2 473.2 499.1
Bldg. matrl. & garden equip. & supplies 1,109.8 1,142.7 1,180.6 1,247.1 1,396.3
Food & beverage stores 1,108.2 1,113.4 1,147.9 1,177.1 1,211.6
Health & personal care stores 413.0 420.3 463.0 482.1 494.5
Gasoline stations 2,612.1 3,059.2 3,560.0 3,748.7 3,699.4
Clothing & clothing accessory stores 1,143.9 1,270.6 1,381.7 1,489.6 1,615.0
Sporting goods, hobby, book & music stores 501.6 503.2 522.8 536.3 563.1
General merchandise stores 2,594.2 2,704.5 2,851.4 2,986.3 3,123.0
Miscellaneous store retailers 1,222.7 1,223.3 1,245.2 1,262.7 1,323.2
Nonstore retailers (catalog, online) 119.8 125.1 141.3 170.2 274.0
Food services and drinking places 2,184.3 2,209.8 2,316.0 2,461.4 2,605.7
Subtotal (retail & food services) 16,330.2 17,308.9 18,736.2 19,980.9 21,173.9
All other outlets 7,322.3 7,379.0 8,587.0 9,551.0 10,003.9
Total all outlets 23,652.5 24,687.9 27,323.2 29,531.9 31,177.8
Source: California State Board of Equalization
Table D-19a: Taxable Retail Sales by County and Store Type, 2009-2013 (continued)
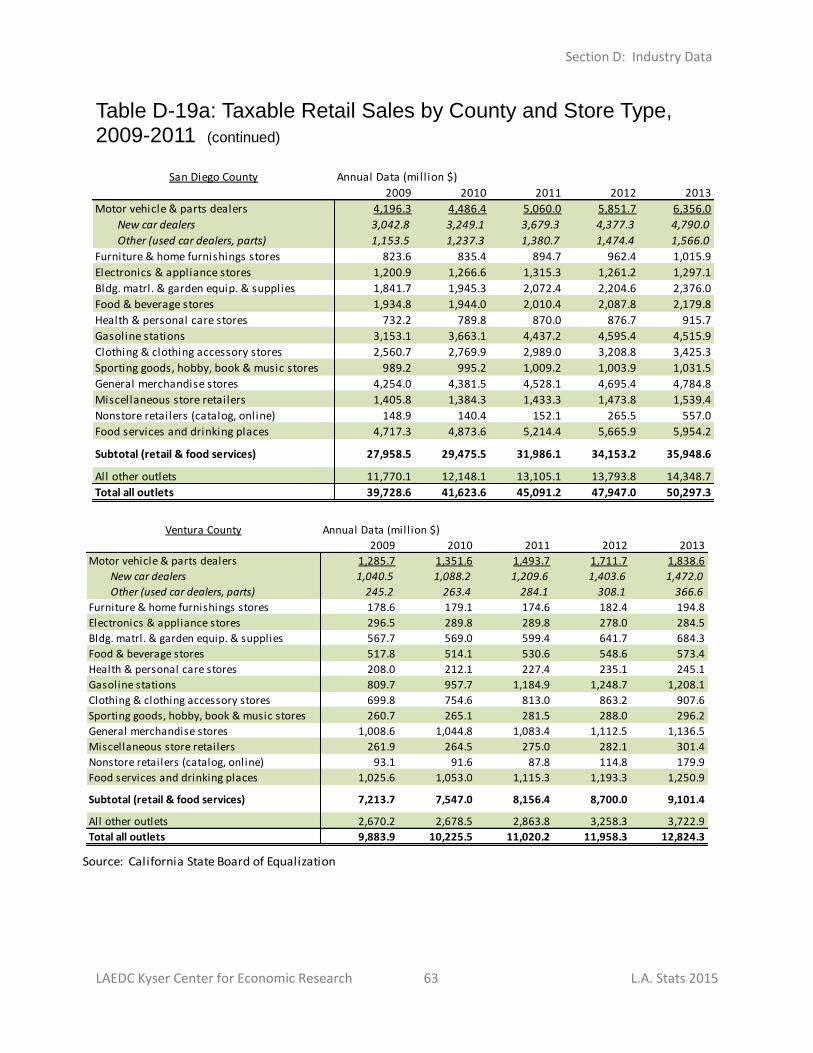
Section D: Industry Data
LAEDC Kyser Center for Economic Research 63 L.A. Stats 2015
San Diego County Annual Data (mill ion $)
2009 2010 2011 2012 2013
Motor vehicle & parts dealers 4,196.3 4,486.4 5,060.0 5,851.7 6,356.0
New car dealers 3,042.8 3,249.1 3,679.3 4,377.3 4,790.0
Other (used car dealers, parts) 1,153.5 1,237.3 1,380.7 1,474.4 1,566.0
Furniture & home furnishings stores 823.6 835.4 894.7 962.4 1,015.9
Electronics & appliance stores 1,200.9 1,266.6 1,315.3 1,261.2 1,297.1
Bldg. matrl. & garden equip. & supplies 1,841.7 1,945.3 2,072.4 2,204.6 2,376.0
Food & beverage stores 1,934.8 1,944.0 2,010.4 2,087.8 2,179.8
Health & personal care stores 732.2 789.8 870.0 876.7 915.7
Gasoline stations 3,153.1 3,663.1 4,437.2 4,595.4 4,515.9
Clothing & clothing accessory stores 2,560.7 2,769.9 2,989.0 3,208.8 3,425.3
Sporting goods, hobby, book & music stores 989.2 995.2 1,009.2 1,003.9 1,031.5
General merchandise stores 4,254.0 4,381.5 4,528.1 4,695.4 4,784.8
Miscellaneous store retailers 1,405.8 1,384.3 1,433.3 1,473.8 1,539.4
Nonstore retailers (catalog, online) 148.9 140.4 152.1 265.5 557.0
Food services and drinking places 4,717.3 4,873.6 5,214.4 5,665.9 5,954.2
Subtotal (retail & food services) 27,958.5 29,475.5 31,986.1 34,153.2 35,948.6
All other outlets 11,770.1 12,148.1 13,105.1 13,793.8 14,348.7
Total all outlets 39,728.6 41,623.6 45,091.2 47,947.0 50,297.3
Ventura County Annual Data (mill ion $)
2009 2010 2011 2012 2013
Motor vehicle & parts dealers 1,285.7 1,351.6 1,493.7 1,711.7 1,838.6
New car dealers 1,040.5 1,088.2 1,209.6 1,403.6 1,472.0
Other (used car dealers, parts) 245.2 263.4 284.1 308.1 366.6
Furniture & home furnishings stores 178.6 179.1 174.6 182.4 194.8
Electronics & appliance stores 296.5 289.8 289.8 278.0 284.5
Bldg. matrl. & garden equip. & supplies 567.7 569.0 599.4 641.7 684.3
Food & beverage stores 517.8 514.1 530.6 548.6 573.4
Health & personal care stores 208.0 212.1 227.4 235.1 245.1
Gasoline stations 809.7 957.7 1,184.9 1,248.7 1,208.1
Clothing & clothing accessory stores 699.8 754.6 813.0 863.2 907.6
Sporting goods, hobby, book & music stores 260.7 265.1 281.5 288.0 296.2
General merchandise stores 1,008.6 1,044.8 1,083.4 1,112.5 1,136.5
Miscellaneous store retailers 261.9 264.5 275.0 282.1 301.4
Nonstore retailers (catalog, online) 93.1 91.6 87.8 114.8 179.9
Food services and drinking places 1,025.6 1,053.0 1,115.3 1,193.3 1,250.9
Subtotal (retail & food services) 7,213.7 7,547.0 8,156.4 8,700.0 9,101.4
All other outlets 2,670.2 2,678.5 2,863.8 3,258.3 3,722.9
Total all outlets 9,883.9 10,225.5 11,020.2 11,958.3 12,824.3
Source: California State Board of Equalization
Table D-19a: Taxable Retail Sales by County and Store Type, 2009-2011 (continued)
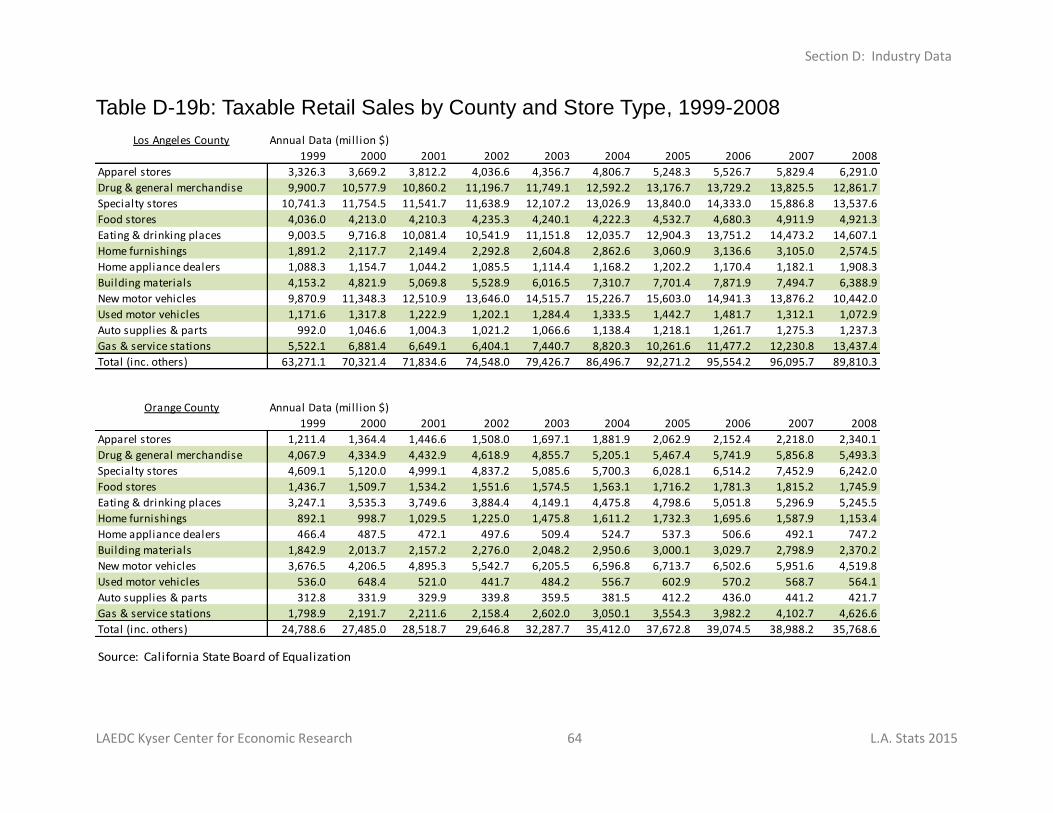
Section D: Industry Data
LAEDC Kyser Center for Economic Research 64 L.A. Stats 2015
Los Angeles County Annual Data (million $)
1999 2000 2001 2002 2003 2004 2005 2006 2007 2008
Apparel stores 3,326.3 3,669.2 3,812.2 4,036.6 4,356.7 4,806.7 5,248.3 5,526.7 5,829.4 6,291.0
Drug & general merchandise 9,900.7 10,577.9 10,860.2 11,196.7 11,749.1 12,592.2 13,176.7 13,729.2 13,825.5 12,861.7
Specialty stores 10,741.3 11,754.5 11,541.7 11,638.9 12,107.2 13,026.9 13,840.0 14,333.0 15,886.8 13,537.6
Food stores 4,036.0 4,213.0 4,210.3 4,235.3 4,240.1 4,222.3 4,532.7 4,680.3 4,911.9 4,921.3
Eating & drinking places 9,003.5 9,716.8 10,081.4 10,541.9 11,151.8 12,035.7 12,904.3 13,751.2 14,473.2 14,607.1
Home furnishings 1,891.2 2,117.7 2,149.4 2,292.8 2,604.8 2,862.6 3,060.9 3,136.6 3,105.0 2,574.5
Home appliance dealers 1,088.3 1,154.7 1,044.2 1,085.5 1,114.4 1,168.2 1,202.2 1,170.4 1,182.1 1,908.3
Building materials 4,153.2 4,821.9 5,069.8 5,528.9 6,016.5 7,310.7 7,701.4 7,871.9 7,494.7 6,388.9
New motor vehicles 9,870.9 11,348.3 12,510.9 13,646.0 14,515.7 15,226.7 15,603.0 14,941.3 13,876.2 10,442.0
Used motor vehicles 1,171.6 1,317.8 1,222.9 1,202.1 1,284.4 1,333.5 1,442.7 1,481.7 1,312.1 1,072.9
Auto supplies & parts 992.0 1,046.6 1,004.3 1,021.2 1,066.6 1,138.4 1,218.1 1,261.7 1,275.3 1,237.3
Gas & service stations 5,522.1 6,881.4 6,649.1 6,404.1 7,440.7 8,820.3 10,261.6 11,477.2 12,230.8 13,437.4
Total (inc. others) 63,271.1 70,321.4 71,834.6 74,548.0 79,426.7 86,496.7 92,271.2 95,554.2 96,095.7 89,810.3
Orange County Annual Data (million $)
1999 2000 2001 2002 2003 2004 2005 2006 2007 2008
Apparel stores 1,211.4 1,364.4 1,446.6 1,508.0 1,697.1 1,881.9 2,062.9 2,152.4 2,218.0 2,340.1
Drug & general merchandise 4,067.9 4,334.9 4,432.9 4,618.9 4,855.7 5,205.1 5,467.4 5,741.9 5,856.8 5,493.3
Specialty stores 4,609.1 5,120.0 4,999.1 4,837.2 5,085.6 5,700.3 6,028.1 6,514.2 7,452.9 6,242.0
Food stores 1,436.7 1,509.7 1,534.2 1,551.6 1,574.5 1,563.1 1,716.2 1,781.3 1,815.2 1,745.9
Eating & drinking places 3,247.1 3,535.3 3,749.6 3,884.4 4,149.1 4,475.8 4,798.6 5,051.8 5,296.9 5,245.5
Home furnishings 892.1 998.7 1,029.5 1,225.0 1,475.8 1,611.2 1,732.3 1,695.6 1,587.9 1,153.4
Home appliance dealers 466.4 487.5 472.1 497.6 509.4 524.7 537.3 506.6 492.1 747.2
Building materials 1,842.9 2,013.7 2,157.2 2,276.0 2,048.2 2,950.6 3,000.1 3,029.7 2,798.9 2,370.2
New motor vehicles 3,676.5 4,206.5 4,895.3 5,542.7 6,205.5 6,596.8 6,713.7 6,502.6 5,951.6 4,519.8
Used motor vehicles 536.0 648.4 521.0 441.7 484.2 556.7 602.9 570.2 568.7 564.1
Auto supplies & parts 312.8 331.9 329.9 339.8 359.5 381.5 412.2 436.0 441.2 421.7
Gas & service stations 1,798.9 2,191.7 2,211.6 2,158.4 2,602.0 3,050.1 3,554.3 3,982.2 4,102.7 4,626.6
Total (inc. others) 24,788.6 27,485.0 28,518.7 29,646.8 32,287.7 35,412.0 37,672.8 39,074.5 38,988.2 35,768.6
Source: California State Board of Equalization
Table D-19b: Taxable Retail Sales by County and Store Type, 1999-2008
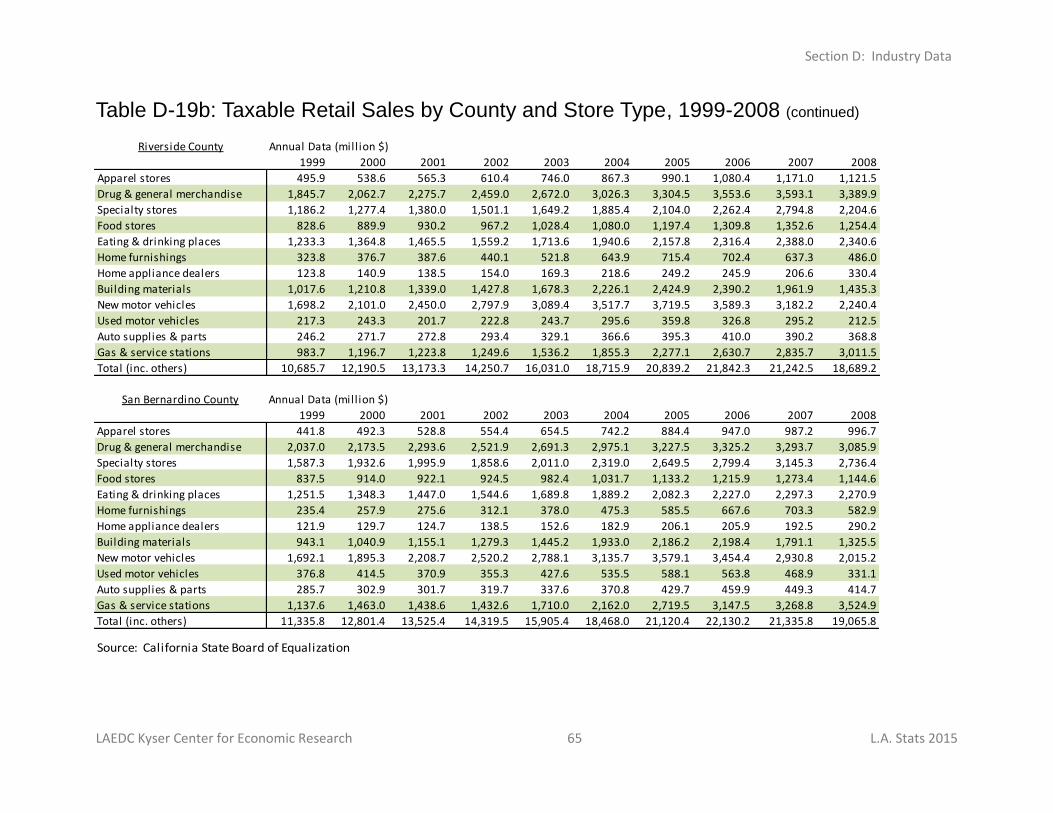
Section D: Industry Data
LAEDC Kyser Center for Economic Research 65 L.A. Stats 2015
Riverside County Annual Data (million $)
1999 2000 2001 2002 2003 2004 2005 2006 2007 2008
Apparel stores 495.9 538.6 565.3 610.4 746.0 867.3 990.1 1,080.4 1,171.0 1,121.5
Drug & general merchandise 1,845.7 2,062.7 2,275.7 2,459.0 2,672.0 3,026.3 3,304.5 3,553.6 3,593.1 3,389.9
Specialty stores 1,186.2 1,277.4 1,380.0 1,501.1 1,649.2 1,885.4 2,104.0 2,262.4 2,794.8 2,204.6
Food stores 828.6 889.9 930.2 967.2 1,028.4 1,080.0 1,197.4 1,309.8 1,352.6 1,254.4
Eating & drinking places 1,233.3 1,364.8 1,465.5 1,559.2 1,713.6 1,940.6 2,157.8 2,316.4 2,388.0 2,340.6
Home furnishings 323.8 376.7 387.6 440.1 521.8 643.9 715.4 702.4 637.3 486.0
Home appliance dealers 123.8 140.9 138.5 154.0 169.3 218.6 249.2 245.9 206.6 330.4
Building materials 1,017.6 1,210.8 1,339.0 1,427.8 1,678.3 2,226.1 2,424.9 2,390.2 1,961.9 1,435.3
New motor vehicles 1,698.2 2,101.0 2,450.0 2,797.9 3,089.4 3,517.7 3,719.5 3,589.3 3,182.2 2,240.4
Used motor vehicles 217.3 243.3 201.7 222.8 243.7 295.6 359.8 326.8 295.2 212.5
Auto supplies & parts 246.2 271.7 272.8 293.4 329.1 366.6 395.3 410.0 390.2 368.8
Gas & service stations 983.7 1,196.7 1,223.8 1,249.6 1,536.2 1,855.3 2,277.1 2,630.7 2,835.7 3,011.5
Total (inc. others) 10,685.7 12,190.5 13,173.3 14,250.7 16,031.0 18,715.9 20,839.2 21,842.3 21,242.5 18,689.2
San Bernardino County Annual Data (million $)
1999 2000 2001 2002 2003 2004 2005 2006 2007 2008
Apparel stores 441.8 492.3 528.8 554.4 654.5 742.2 884.4 947.0 987.2 996.7
Drug & general merchandise 2,037.0 2,173.5 2,293.6 2,521.9 2,691.3 2,975.1 3,227.5 3,325.2 3,293.7 3,085.9
Specialty stores 1,587.3 1,932.6 1,995.9 1,858.6 2,011.0 2,319.0 2,649.5 2,799.4 3,145.3 2,736.4
Food stores 837.5 914.0 922.1 924.5 982.4 1,031.7 1,133.2 1,215.9 1,273.4 1,144.6
Eating & drinking places 1,251.5 1,348.3 1,447.0 1,544.6 1,689.8 1,889.2 2,082.3 2,227.0 2,297.3 2,270.9
Home furnishings 235.4 257.9 275.6 312.1 378.0 475.3 585.5 667.6 703.3 582.9
Home appliance dealers 121.9 129.7 124.7 138.5 152.6 182.9 206.1 205.9 192.5 290.2
Building materials 943.1 1,040.9 1,155.1 1,279.3 1,445.2 1,933.0 2,186.2 2,198.4 1,791.1 1,325.5
New motor vehicles 1,692.1 1,895.3 2,208.7 2,520.2 2,788.1 3,135.7 3,579.1 3,454.4 2,930.8 2,015.2
Used motor vehicles 376.8 414.5 370.9 355.3 427.6 535.5 588.1 563.8 468.9 331.1
Auto supplies & parts 285.7 302.9 301.7 319.7 337.6 370.8 429.7 459.9 449.3 414.7
Gas & service stations 1,137.6 1,463.0 1,438.6 1,432.6 1,710.0 2,162.0 2,719.5 3,147.5 3,268.8 3,524.9
Total (inc. others) 11,335.8 12,801.4 13,525.4 14,319.5 15,905.4 18,468.0 21,120.4 22,130.2 21,335.8 19,065.8
Source: California State Board of Equalization
Table D-19b: Taxable Retail Sales by County and Store Type, 1999-2008 (continued)
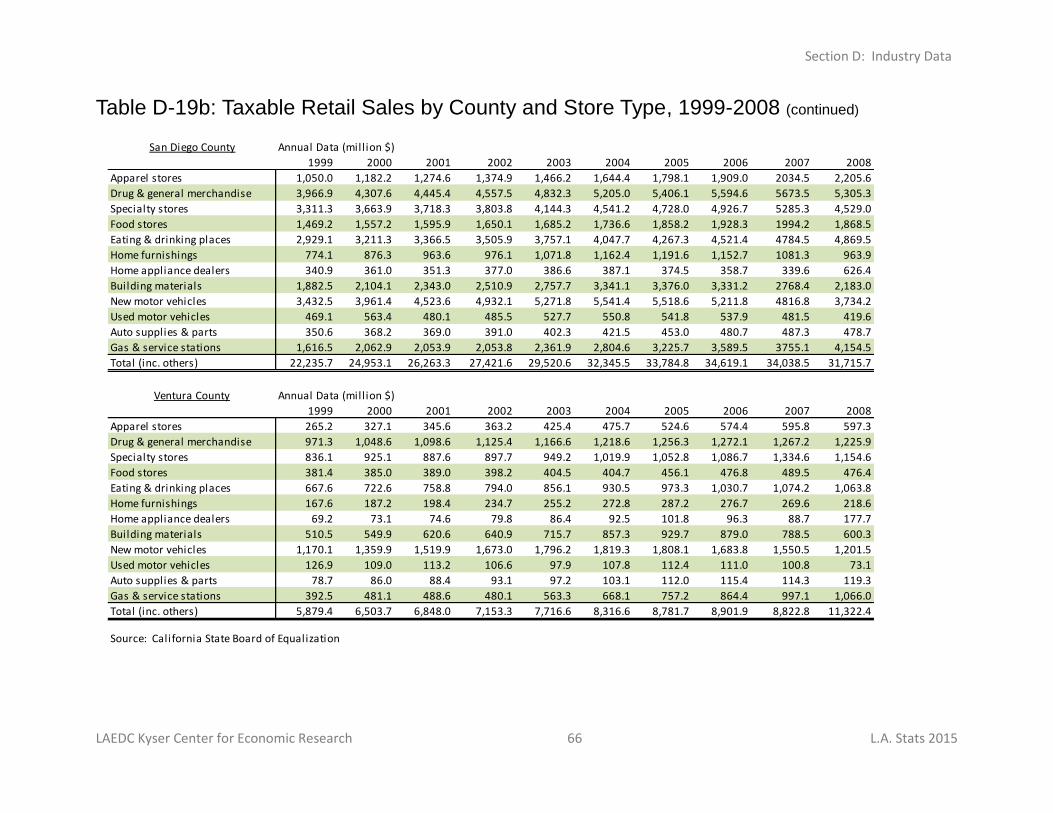
Section D: Industry Data
LAEDC Kyser Center for Economic Research 66 L.A. Stats 2015
San Diego County Annual Data (mill ion $)
1999 2000 2001 2002 2003 2004 2005 2006 2007 2008
Apparel stores 1,050.0 1,182.2 1,274.6 1,374.9 1,466.2 1,644.4 1,798.1 1,909.0 2034.5 2,205.6
Drug & general merchandise 3,966.9 4,307.6 4,445.4 4,557.5 4,832.3 5,205.0 5,406.1 5,594.6 5673.5 5,305.3
Specialty stores 3,311.3 3,663.9 3,718.3 3,803.8 4,144.3 4,541.2 4,728.0 4,926.7 5285.3 4,529.0
Food stores 1,469.2 1,557.2 1,595.9 1,650.1 1,685.2 1,736.6 1,858.2 1,928.3 1994.2 1,868.5
Eating & drinking places 2,929.1 3,211.3 3,366.5 3,505.9 3,757.1 4,047.7 4,267.3 4,521.4 4784.5 4,869.5
Home furnishings 774.1 876.3 963.6 976.1 1,071.8 1,162.4 1,191.6 1,152.7 1081.3 963.9
Home appliance dealers 340.9 361.0 351.3 377.0 386.6 387.1 374.5 358.7 339.6 626.4
Building materials 1,882.5 2,104.1 2,343.0 2,510.9 2,757.7 3,341.1 3,376.0 3,331.2 2768.4 2,183.0
New motor vehicles 3,432.5 3,961.4 4,523.6 4,932.1 5,271.8 5,541.4 5,518.6 5,211.8 4816.8 3,734.2
Used motor vehicles 469.1 563.4 480.1 485.5 527.7 550.8 541.8 537.9 481.5 419.6
Auto supplies & parts 350.6 368.2 369.0 391.0 402.3 421.5 453.0 480.7 487.3 478.7
Gas & service stations 1,616.5 2,062.9 2,053.9 2,053.8 2,361.9 2,804.6 3,225.7 3,589.5 3755.1 4,154.5
Total (inc. others) 22,235.7 24,953.1 26,263.3 27,421.6 29,520.6 32,345.5 33,784.8 34,619.1 34,038.5 31,715.7
Ventura County Annual Data (mill ion $)
1999 2000 2001 2002 2003 2004 2005 2006 2007 2008
Apparel stores 265.2 327.1 345.6 363.2 425.4 475.7 524.6 574.4 595.8 597.3
Drug & general merchandise 971.3 1,048.6 1,098.6 1,125.4 1,166.6 1,218.6 1,256.3 1,272.1 1,267.2 1,225.9
Specialty stores 836.1 925.1 887.6 897.7 949.2 1,019.9 1,052.8 1,086.7 1,334.6 1,154.6
Food stores 381.4 385.0 389.0 398.2 404.5 404.7 456.1 476.8 489.5 476.4
Eating & drinking places 667.6 722.6 758.8 794.0 856.1 930.5 973.3 1,030.7 1,074.2 1,063.8
Home furnishings 167.6 187.2 198.4 234.7 255.2 272.8 287.2 276.7 269.6 218.6
Home appliance dealers 69.2 73.1 74.6 79.8 86.4 92.5 101.8 96.3 88.7 177.7
Building materials 510.5 549.9 620.6 640.9 715.7 857.3 929.7 879.0 788.5 600.3
New motor vehicles 1,170.1 1,359.9 1,519.9 1,673.0 1,796.2 1,819.3 1,808.1 1,683.8 1,550.5 1,201.5
Used motor vehicles 126.9 109.0 113.2 106.6 97.9 107.8 112.4 111.0 100.8 73.1
Auto supplies & parts 78.7 86.0 88.4 93.1 97.2 103.1 112.0 115.4 114.3 119.3
Gas & service stations 392.5 481.1 488.6 480.1 563.3 668.1 757.2 864.4 997.1 1,066.0
Total (inc. others) 5,879.4 6,503.7 6,848.0 7,153.3 7,716.6 8,316.6 8,781.7 8,901.9 8,822.8 11,322.4
Source: California State Board of Equalization
Table D-19b: Taxable Retail Sales by County and Store Type, 1999-2008 (continued)