Embed Size (px)
Citation preview

la lucia mall, durban

V&a Waterfront
3
ABOUT THIS REPORT
INTEGRATED ANNUAL REPORT (IAR)Incorporating an overview of our organisation, key operational matters, our strategic intent, performance reviews including reports from our Chairman, Chief Executive Officer and Financial Director, sectoral reviews, corporate social responsibility, corporate governance and risk management.
The integrated annual report should be read together with the statutory annual financial statements, which combined provide a complete overview of Growthpoint’s performance and prospects.
ANNUAL FINANCIAL STATEMENTS (AFS)The statutory annual financial statements prepared in accordance with International Financial Reporting Standards (IFRS), JSE Listings Requirements and the requirements of the Companies Act 2008, as amended.
AGM NOTICEThe booklet containing the AGM notice also includes the summarised audited AFS for FY15, relevant extracts from the IAR supporting the notice and the report to shareholders by the Social, Ethics and Transformation Committee.
GROWTHPOINT’S REPORTING CONSISTS OF
These consolidated financial statements have been audited by KPMG Inc. in compliance with s30 of the Companies Act 2008, as amended, and the preparation of the consolidated financial statements has been supervised by Gerald Völkel CA(SA), Growthpoint’s Financial Director. These consolidated annual financial statements require publication by 30 September 2015. The complete annual financial statements and integrated annual report of the company and Group for the financial years ended 30 June 2015 and 2014 may be obtained:
• from the Transfer Secretaries, Computershare Investor Services (Pty) Ltd, Ground Floor, 70 Marshall Street, Johannesburg, 2001, or
• from the company’s website at: www.growthpoint.co.za, or • by request from the company.
In preparing this report we have endeavoured to present a holistic and integrated representation of the company’s performance in terms of both its profitability and its long-term sustainability. This report aims to inform our stakeholders about the objectives and strategies of the company, as well as its performance with regard to financial, human and environmental issues.
30 JUNE 2015
INTEGRATED ANNUAL REPORT
Cover 2015 aj.indd 1 2015/09/11 3:18 PM
30 JUNE 2015
ANNUAL FINANCIAL STATEMENTS
GROW
THPO
INT PRO
PERTIES ANN
UAL FIN
ANCIAL STATEM
ENTS 2015
ABOUT THIS REPORT 3
ANNUAL FINANCIAL STATEMENTSDirectors’ responsibility statement 6
Declaration by Company Secretary 6
Report of the Audit Committee 7
Directors’ Report 8
Independent Auditor’s Report 13
Accounting policies 14
Statement of profit or loss and other comprehensive income 24
Statement of financial position 25
Statement of changes in equity 26
Statement of cash flows 27
Segmental analysis 28
Notes to the financial statements 32
propErTy porTFoLIoProperty portfolio summary 80
Property portfolio detail 82
gENErAL INForMATIoNShareholders’ analysis 102
Shareholders’ information 106
Directorate and administration 107
CONTACT DETAILS IBC
Turn over for abbreviations
alIcE laNE, SaNdTON
The Place, 1 Sandton Drive, Sandton, Gauteng, 2196, South AfricaTel: +27 (0) 11 944 6000, Fax: +27 (0) 11 944 6005 PO Box 78949, Sandton, 2146, South AfricaDocex: 48 Sandton [email protected]
WWW.GROWTHPOINT.CO.ZA
The Place, 1 Sandton Drive, Sandton, Gauteng, 2196, South AfricaTel: +27 (0) 11 944 6000, Fax: +27 (0) 11 944 6005 PO Box 78949, Sandton, 2146, South AfricaDocex: 48 Sandton [email protected]
WWW.GROWTHPOINT.CO.ZA
44 on grand central, MIdrand
30 JUNE 2015
Notice of aNd proxy for aNNual geNeral meetiNg aNd summarised audited fiNaNcial statemeNts
groW
tHPo
Int Pro
PertIeS aNN
ual fiNaN
cial statemeN
ts 2015

country club estate, jonhannesburg
bridgeWay park, cape toWn
ANNUAL FINANCIAL STATEMENTS
DIRECTORS’ RESPONSIBILITY STATEMENT 6
DECLARATION BY COMPANY SECRETARY 6
REPORT Of ThE AuDIT COMMITTEE 7
DIRECTORS’ REPORT 8
INDEPENDENT AuDITOR’S REPORT 13
ACCOuNTINg POLICIES 14
STATEMENT Of PROfIT OR LOSS AND OThER COMPREhENSIVE INCOME 24
STATEMENT Of fINANCIAL POSITION 25
STATEMENT Of ChANgES IN EQuITY 26
STATEMENT Of CASh fLOwS 27
SEgMENTAL ANALYSIS 28
NOTES TO ThE fINANCIAL STATEMENTS 32
6 ANNUAL FINANCIAL STATEMENTS
GRO
WTH
POIN
T PR
OPE
RTIE
S LI
MIT
ED A
nnua
l Fin
anci
al S
tate
men
ts 2
015
DIRECTORS’ RESPONSIBILITY STATEMENT
The directors are responsible for the preparation and fair presentation of the Group annual financial statements of Growthpoint Properties Limited. These financial statements comprise the following:• Statement of profit or loss and other comprehensive income for the
year ended 30 June 2015• Statement of financial position at 30 June 2015• Statement of changes in equity for the year ended 30 June 2015• Statement of cash flows for the year ended 30 June 2015• Notes to the financial statements, which include a summary of
significant accounting policies and other explanatory notes, in accordance with International Financial Reporting Standards and the requirements of the Companies Act 2008, as amended. In addition, the directors are responsible for preparing the Directors’ Report.
The directors are also responsible for such internal control as they may determine necessary to enable the preparation of financial statements that are free from material misstatement, whether due to fraud or error, and for maintaining adequate accounting records and an effective system of risk management, as well as the preparation of the supplementary schedules included in these financial statements.
The directors have made an assessment of the ability of the company and its subsidiaries to continue as going concerns and have no reason to believe that the businesses will not be going concerns in the year ahead.
The auditor is responsible for reporting on whether the consolidated financial statements are fairly presented in accordance with the applicable financial reporting framework.
APPROVAL OF GROUP ANNUAL FINANCIAL STATEMENTSThe Group annual financial statements of Growthpoint Properties Limited, as identified in the first paragraph, were approved by the Board of Directors on 25 August 2015 and are signed on their behalf by:
LN Sasse JF MaraisChief Executive Officer Chairman
25 August 2015 25 August 2015Sandton Sandton
DECLARATION BY COMPANY SECRETARY
In terms of section 88(2)(e) of the Companies Act 2008, as amended (the Act), I hereby certify that the company has filed the required returns and notices in terms of the Act in respect of the financial year ended 30 June 2015 and that, to the best of my knowledge and belief, all such returns and notices are true, correct and up to date.
RA KrabbenhöftCompany Secretary
25 August 2015Sandton
7DIRECTORS’ RESPONSIBILITY STATEMENT/DECLARATION BY COMPANY SECRETARY/REPORT OF THE AUDIT COMMITTEE
REPORT OF THE AUDIT COMMITTEE
The activities of the Audit Committee (the committee) are determined by its terms of reference. The committee considers that it has adequately performed its functions in terms of its mandate, the King Code of Governance Principles for South Africa 2009, and the Companies Act, No 71 of 2008, as amended.
The committee carried out its duties by reviewing the following on a quarterly basis:• internal audit reports • financial management reports• dashboard reflecting key financial, property and operational information/
indicators• information technology reports pertaining specifically to financial
reporting related matters• annual returns and tax status reports• external audit reports• Risk Management Committee minutes.
The aforementioned information, together with the interactions with persons attending the meetings in an ex officio capacity, collectively enabled the committee to conclude that the systems of internal financial control had been designed effectively and were operating effectively during the financial period under review.
Furthermore, the committee is satisfied:• with the independence of the external auditor, including the provision
of non-audit services and compliance with the company policy in this regard. The external auditor attended all meetings of the committee
• with the terms, nature, scope and proposed fee of the external auditor for the financial year ended 30 June 2015
• with the annual financial statements and the accounting practices utilised in the preparation thereof and have recommended the financial statements for approval to the Board
• with the company’s continuing viability as a going concern, which it has reported to the Board for its deliberation
• that the company’s Financial Director had the necessary expertise and experience to carry out his duties.
No concerns and complaints were received from within or outside the Group relating to accounting practices and internal financial controls, and the content or auditing of the company’s financial statements.
The committee assesses its performance on an annual basis to determine whether or not it had delivered on its mandate and continuously enhanced its contribution to the Board. The assessment takes the form of a questionnaire, which is independently completed by each member of the committee. The composition of the self-assessment questionnaire, as well as the consolidation of the related results, is the responsibility of the Company Secretary in conjunction with the Head of Internal Audit and Risk Management.
LA FinlayAudit Committee Chairman
25 August 2015Sandton
8 ANNUAL FINANCIAL STATEMENTS
GRO
WTH
POIN
T PR
OPE
RTIE
S LI
MIT
ED A
nnua
l Fin
anci
al S
tate
men
ts 2
015
DIRECTORS’ REPORT
The directors are pleased to present their 27th annual report that forms part of the annual financial statements for the year ended 30 June 2015.
NATURE OF BUSINESSOn 1 July 2013, Growthpoint converted from a Property Loan Stock company to a Real Estate Investment Trust (REIT), which status was granted by the JSE in accordance with the REIT provisions contained in section 13 of the JSE Listings Requirements.
Growthpoint’s listing on the JSE (ISIN code: ZAE000179420) is in the Sector: Financial Services – Real Estate Investment Trusts (Diversified REITs).
The primary business of Growthpoint is long-term investment in quality, rental-generating properties, which are maintained and upgraded or refurbished as necessary, so as to increase the long-term value of the property assets.
As at 30 June 2015, Growthpoint’s property portfolio comprised 471 owned and managed properties in the South African Industrial, Office and Retail Sectors valued at R71,6 billion (2014: R49,4 billion). More information on the nature of the business of these sectors is reported on separately in the FY15 integrated annual report.
In addition, Growthpoint has a 50% shareholding in properties owned by V&A Waterfront Holdings (Pty) Ltd in Cape Town, with property assets totalling R13,5 billion (2014: R11,9 billion) as part of a joint arrangement with the Government Employees’ Pension Fund (GEPF) represented by the Public Investment Corporation (SOC) Limited (PIC), and holds a majority stake of 65.0% (2014: 64.0%) in Growthpoint Properties Australia, listed on the Australian Securities exchange (ASX) as an A-REIT (Code: GOZ), which owns 53 properties valued at AUD2,3 billion (R22,0 billion) as at 30 June 2015.
REGULATIONAs a REIT, the company is regulated by the JSE.
SHARE CAPITALThe number of authorised ordinary shares of no par value is 4 000 000 000. As at 30 June 2015, there were 2 711 056 264 ordinary shares of no par value in issue.
The following share issues took place during the financial year ended 30 June 2015:• On 1 September 2014: 3 792 120 shares at R25.00 per share, as
consideration for the remaining 50% interest in the properties owned by Truzen 75 Trust from its remaining beneficiaries and the remaining 50% shares in Erf 99 and 100 Parktown Township Share Block (Pty) Ltd from its remaining shareholder.
• On 23 September 2014: 42 221 311 shares, pursuant to elections of the dividend re-investment alternative offered in respect of the final 2014 dividend of 82.80 cents per share, issued at a price of R24.20 per share (which equated to a 1.71% discount to the five-day volume weighted average price of R25.45 less the dividend, as at the close of business on Thursday, 4 September 2014).
• On 1 April 2015: 46 472 377 shares, pursuant to elections of the dividend re-investment alternative offered in respect of the interim 2015 dividend of 84.40 cents per share for the six-month period ended 31 December 2014, issued at a price of R26.25 per share (which equated to a discount of 3.94% to the five-day volume weighted average price of R28.17 less the dividend, as at the close of business on Thursday, 12 March 2015).
• On 28 April 2015: 317 370 060 shares at R28.66 per share, being the clean spot price of a Growthpoint ordinary share on 1 April 2015, as consideration for Growthpoint’s acquisition by scheme of arrangement (the scheme) of all of the remaining issued shares in Acucap Properties Ltd (Acucap) that it did not already own, the effective date and implementation date of the scheme being 1 April and 28 April 2015, respectively.
• On 30 April 2015: 16 292 139 shares, pursuant to elections of the dividend re-investment alternative offered in respect of a special cash dividend of 44.50 cents per share for the three months ended 31 March 2015, issued at a price of R27.25 per share (which equated to a 2.97% discount to the five-day volume weighted average price of R28.53 less the special dividend, as at the close of business on Thursday, 9 April 2015).
DIVIDEND POLICYThe company declares and pays an interim and a final dividend in respect of each financial year (see shareholders’ information on page 106 of these annual financial statements).
In considering the payment of dividends, the Board, with the Audit Committee’s assurance, takes the following into account:• the financial status of the company as at the end of the first and second
six months of the financial year, subject to solvency and liquidity testing as required by the Act; and
• the capital commitments of the company and its funding requirements.
FINAL AND INTERIM DIVIDENDSThe Board declared the following dividends in respect of the financial year ended 30 June 2015:
DividendGross amount
(cents per share)
Interim (6 months ended 31 December 2014) 84.40Special (3 months ended 31 March 2015) 44.50Final (3 months ended 30 June 2015) 44.50
Total 173.40
These dividends have been declared from distributable earnings and meet the requirements of a REIT “qualifying distribution” for purposes of section 25BB of the Income Tax Act, No 58 of 1962 (as amended).
INTERESTS IN SUBSIDIARIESInterests in subsidiaries and joint ventures are reflected in the notes to the financial statements, notes 44.1 and 15.
9DIRECTORS’ REPORT continued
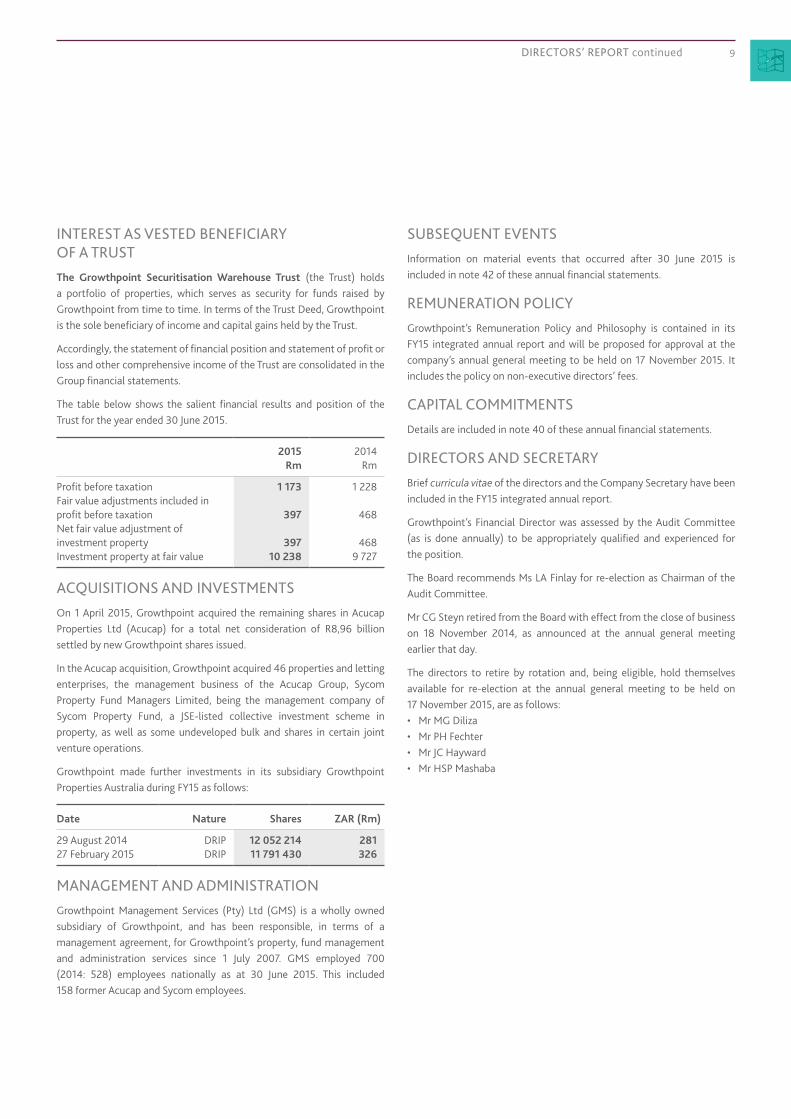
INTEREST AS VESTED BENEFICIARY OF A TRUSTThe Growthpoint Securitisation Warehouse Trust (the Trust) holds a portfolio of properties, which serves as security for funds raised by Growthpoint from time to time. In terms of the Trust Deed, Growthpoint is the sole beneficiary of income and capital gains held by the Trust.
Accordingly, the statement of financial position and statement of profit or loss and other comprehensive income of the Trust are consolidated in the Group financial statements.
The table below shows the salient financial results and position of the Trust for the year ended 30 June 2015.
2015Rm
2014Rm
Profit before taxation 1 173 1 228Fair value adjustments included inprofit before taxation 397 468Net fair value adjustment of investment property 397 468Investment property at fair value 10 238 9 727
ACQUISITIONS AND INVESTMENTSOn 1 April 2015, Growthpoint acquired the remaining shares in Acucap Properties Ltd (Acucap) for a total net consideration of R8,96 billion settled by new Growthpoint shares issued.
In the Acucap acquisition, Growthpoint acquired 46 properties and letting enterprises, the management business of the Acucap Group, Sycom Property Fund Managers Limited, being the management company of Sycom Property Fund, a JSE-listed collective investment scheme in property, as well as some undeveloped bulk and shares in certain joint venture operations.
Growthpoint made further investments in its subsidiary Growthpoint Properties Australia during FY15 as follows:
Date Nature Shares ZAR (Rm)
29 August 2014 DRIP 12 052 214 28127 February 2015 DRIP 11 791 430 326
MANAGEMENT AND ADMINISTRATIONGrowthpoint Management Services (Pty) Ltd (GMS) is a wholly owned subsidiary of Growthpoint, and has been responsible, in terms of a management agreement, for Growthpoint’s property, fund management and administration services since 1 July 2007. GMS employed 700 (2014: 528) employees nationally as at 30 June 2015. This included 158 former Acucap and Sycom employees.
SUBSEQUENT EVENTSInformation on material events that occurred after 30 June 2015 is included in note 42 of these annual financial statements.
REMUNERATION POLICYGrowthpoint’s Remuneration Policy and Philosophy is contained in its FY15 integrated annual report and will be proposed for approval at the company’s annual general meeting to be held on 17 November 2015. It includes the policy on non-executive directors’ fees.
CAPITAL COMMITMENTSDetails are included in note 40 of these annual financial statements.
DIRECTORS AND SECRETARYBrief curricula vitae of the directors and the Company Secretary have been included in the FY15 integrated annual report.
Growthpoint’s Financial Director was assessed by the Audit Committee (as is done annually) to be appropriately qualified and experienced for the position.
The Board recommends Ms LA Finlay for re-election as Chairman of the Audit Committee.
Mr CG Steyn retired from the Board with effect from the close of business on 18 November 2014, as announced at the annual general meeting earlier that day.
The directors to retire by rotation and, being eligible, hold themselves available for re-election at the annual general meeting to be held on 17 November 2015, are as follows:• Mr MG Diliza• Mr PH Fechter• Mr JC Hayward• Mr HSP Mashaba
10 ANNUAL FINANCIAL STATEMENTS
GRO
WTH
POIN
T PR
OPE
RTIE
S LI
MIT
ED A
nnua
l Fin
anci
al S
tate
men
ts 2
015
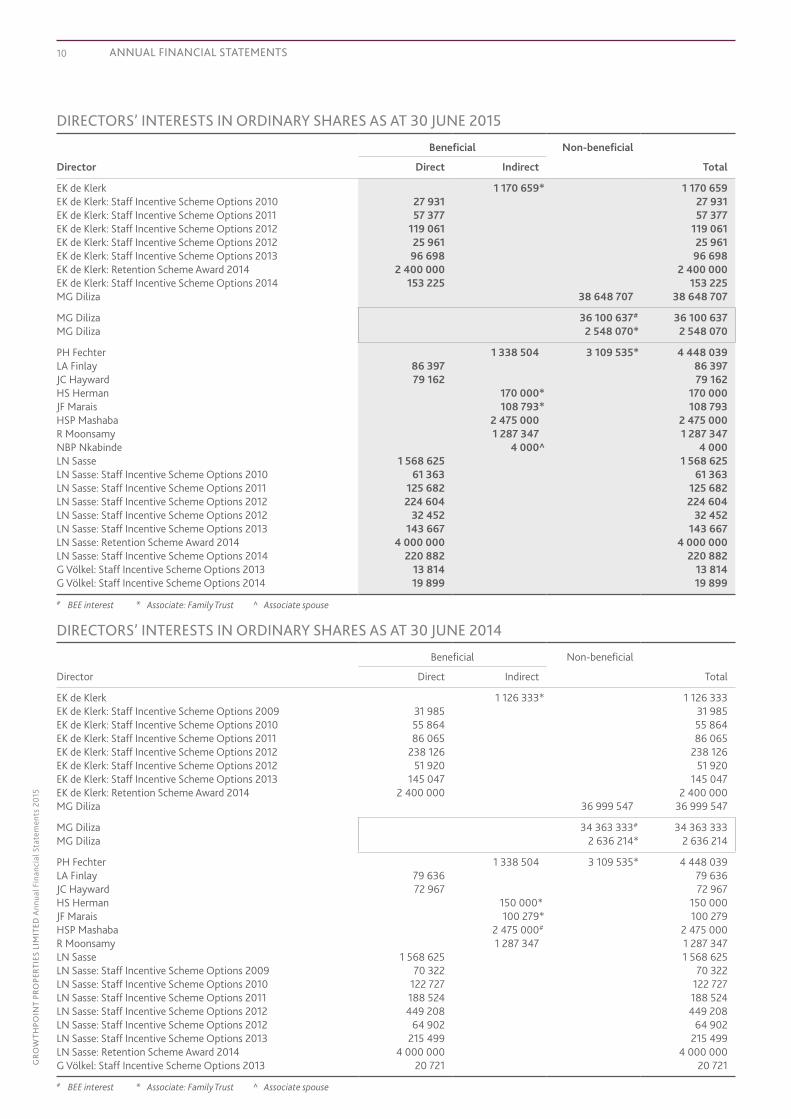
DIRECTORS’ INTERESTS IN ORDINARY SHARES AS AT 30 JUNE 2015
Beneficial Non-beneficial
Director Direct Indirect Total
EK de Klerk 1 170 659* 1 170 659EK de Klerk: Staff Incentive Scheme Options 2010 27 931 27 931EK de Klerk: Staff Incentive Scheme Options 2011 57 377 57 377EK de Klerk: Staff Incentive Scheme Options 2012 119 061 119 061EK de Klerk: Staff Incentive Scheme Options 2012 25 961 25 961EK de Klerk: Staff Incentive Scheme Options 2013 96 698 96 698EK de Klerk: Retention Scheme Award 2014 2 400 000 2 400 000EK de Klerk: Staff Incentive Scheme Options 2014 153 225 153 225MG Diliza 38 648 707 38 648 707
MG Diliza 36 100 637# 36 100 637MG Diliza 2 548 070* 2 548 070
PH Fechter 1 338 504 3 109 535* 4 448 039LA Finlay 86 397 86 397JC Hayward 79 162 79 162HS Herman 170 000* 170 000JF Marais 108 793* 108 793HSP Mashaba 2 475 000 2 475 000R Moonsamy 1 287 347 1 287 347NBP Nkabinde 4 000^ 4 000LN Sasse 1 568 625 1 568 625LN Sasse: Staff Incentive Scheme Options 2010 61 363 61 363LN Sasse: Staff Incentive Scheme Options 2011 125 682 125 682LN Sasse: Staff Incentive Scheme Options 2012 224 604 224 604LN Sasse: Staff Incentive Scheme Options 2012 32 452 32 452LN Sasse: Staff Incentive Scheme Options 2013 143 667 143 667LN Sasse: Retention Scheme Award 2014 4 000 000 4 000 000LN Sasse: Staff Incentive Scheme Options 2014 220 882 220 882G Völkel: Staff Incentive Scheme Options 2013 13 814 13 814G Völkel: Staff Incentive Scheme Options 2014 19 899 19 899
# BEE interest * Associate: Family Trust ^ Associate spouse
DIRECTORS’ INTERESTS IN ORDINARY SHARES AS AT 30 JUNE 2014
Beneficial Non-beneficial
Director Direct Indirect Total
EK de Klerk 1 126 333* 1 126 333EK de Klerk: Staff Incentive Scheme Options 2009 31 985 31 985EK de Klerk: Staff Incentive Scheme Options 2010 55 864 55 864EK de Klerk: Staff Incentive Scheme Options 2011 86 065 86 065EK de Klerk: Staff Incentive Scheme Options 2012 238 126 238 126EK de Klerk: Staff Incentive Scheme Options 2012 51 920 51 920EK de Klerk: Staff Incentive Scheme Options 2013 145 047 145 047EK de Klerk: Retention Scheme Award 2014 2 400 000 2 400 000MG Diliza 36 999 547 36 999 547
MG Diliza 34 363 333# 34 363 333MG Diliza 2 636 214* 2 636 214
PH Fechter 1 338 504 3 109 535* 4 448 039LA Finlay 79 636 79 636JC Hayward 72 967 72 967HS Herman 150 000* 150 000JF Marais 100 279* 100 279HSP Mashaba 2 475 000# 2 475 000R Moonsamy 1 287 347 1 287 347LN Sasse 1 568 625 1 568 625LN Sasse: Staff Incentive Scheme Options 2009 70 322 70 322LN Sasse: Staff Incentive Scheme Options 2010 122 727 122 727LN Sasse: Staff Incentive Scheme Options 2011 188 524 188 524LN Sasse: Staff Incentive Scheme Options 2012 449 208 449 208LN Sasse: Staff Incentive Scheme Options 2012 64 902 64 902LN Sasse: Staff Incentive Scheme Options 2013 215 499 215 499LN Sasse: Retention Scheme Award 2014 4 000 000 4 000 000G Völkel: Staff Incentive Scheme Options 2013 20 721 20 721
# BEE interest * Associate: Family Trust ^ Associate spouse
11DIRECTORS’ REPORT continued
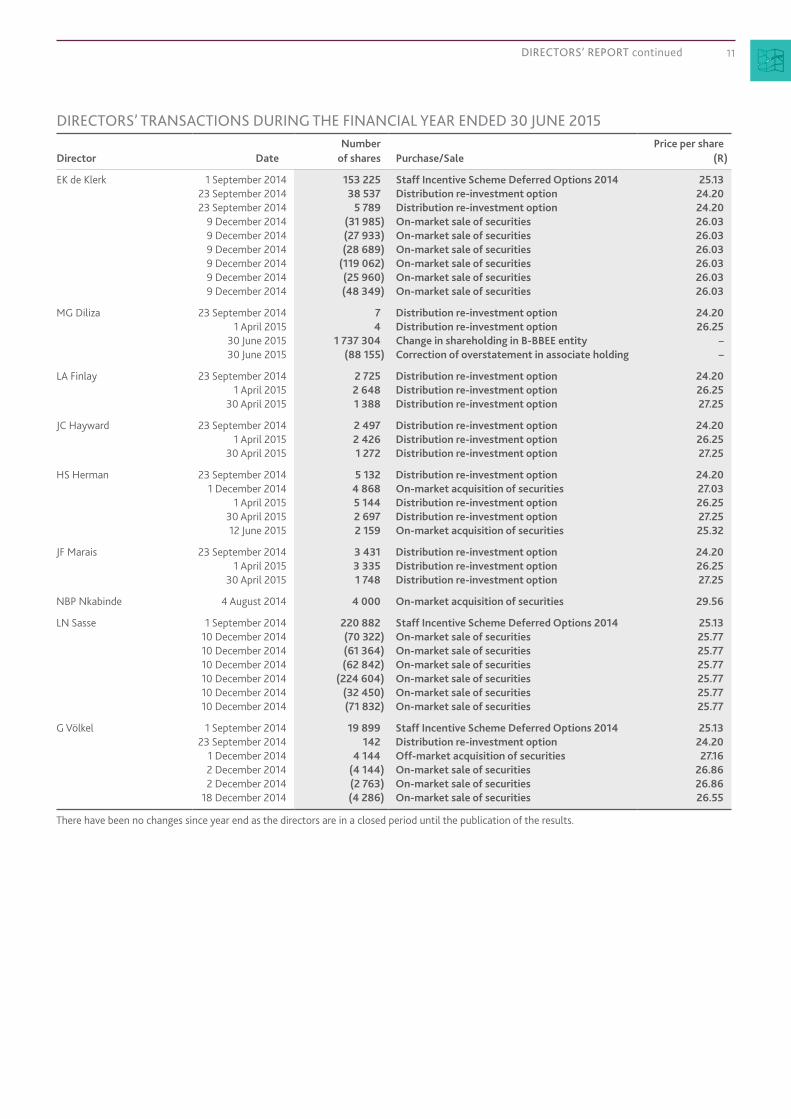
DIRECTORS’ TRANSACTIONS DURING THE FINANCIAL YEAR ENDED 30 JUNE 2015
Director DateNumber
of shares Purchase/SalePrice per share
(R)
EK de Klerk 1 September 2014 153 225 Staff Incentive Scheme Deferred Options 2014 25.1323 September 2014 38 537 Distribution re-investment option 24.2023 September 2014 5 789 Distribution re-investment option 24.20
9 December 2014 (31 985) On-market sale of securities 26.039 December 2014 (27 933) On-market sale of securities 26.039 December 2014 (28 689) On-market sale of securities 26.039 December 2014 (119 062) On-market sale of securities 26.039 December 2014 (25 960) On-market sale of securities 26.039 December 2014 (48 349) On-market sale of securities 26.03
MG Diliza 23 September 2014 7 Distribution re-investment option 24.201 April 2015 4 Distribution re-investment option 26.25
30 June 2015 1 737 304 Change in shareholding in B-BBEE entity –30 June 2015 (88 155) Correction of overstatement in associate holding –
LA Finlay 23 September 2014 2 725 Distribution re-investment option 24.201 April 2015 2 648 Distribution re-investment option 26.25
30 April 2015 1 388 Distribution re-investment option 27.25
JC Hayward 23 September 2014 2 497 Distribution re-investment option 24.201 April 2015 2 426 Distribution re-investment option 26.25
30 April 2015 1 272 Distribution re-investment option 27.25
HS Herman 23 September 2014 5 132 Distribution re-investment option 24.201 December 2014 4 868 On-market acquisition of securities 27.03
1 April 2015 5 144 Distribution re-investment option 26.2530 April 2015 2 697 Distribution re-investment option 27.2512 June 2015 2 159 On-market acquisition of securities 25.32
JF Marais 23 September 2014 3 431 Distribution re-investment option 24.201 April 2015 3 335 Distribution re-investment option 26.25
30 April 2015 1 748 Distribution re-investment option 27.25
NBP Nkabinde 4 August 2014 4 000 On-market acquisition of securities 29.56
LN Sasse 1 September 2014 220 882 Staff Incentive Scheme Deferred Options 2014 25.1310 December 2014 (70 322) On-market sale of securities 25.7710 December 2014 (61 364) On-market sale of securities 25.7710 December 2014 (62 842) On-market sale of securities 25.7710 December 2014 (224 604) On-market sale of securities 25.7710 December 2014 (32 450) On-market sale of securities 25.7710 December 2014 (71 832) On-market sale of securities 25.77
G Völkel 1 September 2014 19 899 Staff Incentive Scheme Deferred Options 2014 25.1323 September 2014 142 Distribution re-investment option 24.20
1 December 2014 4 144 Off-market acquisition of securities 27.162 December 2014 (4 144) On-market sale of securities 26.862 December 2014 (2 763) On-market sale of securities 26.86
18 December 2014 (4 286) On-market sale of securities 26.55
There have been no changes since year end as the directors are in a closed period until the publication of the results.
12 ANNUAL FINANCIAL STATEMENTS
GRO
WTH
POIN
T PR
OPE
RTIE
S LI
MIT
ED A
nnua
l Fin
anci
al S
tate
men
ts 2
015
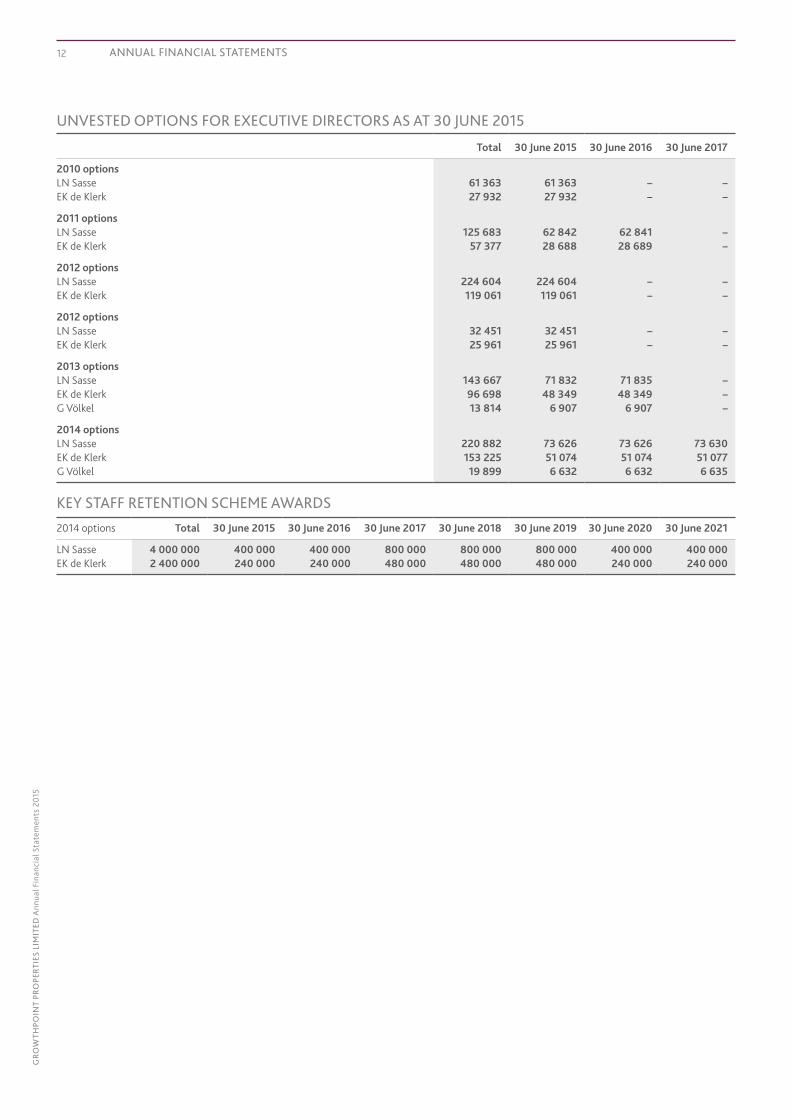
UNVESTED OPTIONS FOR EXECUTIVE DIRECTORS AS AT 30 JUNE 2015
Total 30 June 2015 30 June 2016 30 June 2017
2010 optionsLN Sasse 61 363 61 363 – –EK de Klerk 27 932 27 932 – –
2011 optionsLN Sasse 125 683 62 842 62 841 –EK de Klerk 57 377 28 688 28 689 –
2012 optionsLN Sasse 224 604 224 604 – –EK de Klerk 119 061 119 061 – –
2012 optionsLN Sasse 32 451 32 451 – –EK de Klerk 25 961 25 961 – –
2013 optionsLN Sasse 143 667 71 832 71 835 –EK de Klerk 96 698 48 349 48 349 –G Völkel 13 814 6 907 6 907 –
2014 optionsLN Sasse 220 882 73 626 73 626 73 630EK de Klerk 153 225 51 074 51 074 51 077G Völkel 19 899 6 632 6 632 6 635
KEY STAFF RETENTION SCHEME AWARDS2014 options Total 30 June 2015 30 June 2016 30 June 2017 30 June 2018 30 June 2019 30 June 2020 30 June 2021
LN Sasse 4 000 000 400 000 400 000 800 000 800 000 800 000 400 000 400 000EK de Klerk 2 400 000 240 000 240 000 480 000 480 000 480 000 240 000 240 000
13DIRECTORS’ REPORT continued/INDEPENDENT AUDITOR’S REPORT
TO THE SHAREHOLDERS OF GROWTHPOINT PROPERTIES LIMITEDWe have audited the consolidated financial statements of Growthpoint Properties Limited, which comprise the consolidated statement of financial position at 30 June 2015, and the consolidated statements of profit or loss and other comprehensive income, changes in equity and cash flows for the year then ended, and the notes to the financial statements which include a summary of significant accounting policies and other explanatory notes, as set out on pages 14 to 77.
DIRECTORS’ RESPONSIBILITY FOR THE FINANCIAL STATEMENTS The company’s directors are responsible for the preparation and fair presentation of these financial statements in accordance with International Financial Reporting Standards and the requirements of the Companies Act of South Africa, and for such internal control as the directors determine is necessary to enable the preparation of financial statements that are free from material misstatement, whether due to fraud or error.
AUDITOR’S RESPONSIBILITYOur responsibility is to express an opinion on these financial statements based on our audit. We conducted our audit in accordance with International Standards on Auditing. Those standards require that we comply with ethical requirements and plan and perform the audit to obtain reasonable assurance about whether the financial statements are free from material misstatement.
An audit involves performing procedures to obtain audit evidence about the amounts and disclosures in the financial statements. The procedures selected depend on the auditor’s judgement, including the assessment of the risks of material misstatement of the financial statements, whether due to fraud or error. In making those risk assessments, the auditor considers internal control relevant to the entity’s preparation and fair presentation of the financial statements in order to design audit procedures that are appropriate in the circumstances, but not for the purpose of expressing an opinion on the effectiveness of the entity’s internal control. An audit also includes evaluating the appropriateness of accounting policies used and the reasonableness of accounting estimates made by management, as well as evaluating the overall presentation of the financial statements.
We believe that the audit evidence we have obtained is sufficient and appropriate to provide a basis for our audit opinion.
OPINION In our opinion, these financial statements present fairly, in all material respects, the consolidated financial position of Growthpoint Properties Limited at 30 June 2015, and its consolidated financial performance and consolidated cash flows for the year then ended in accordance with International Financial Reporting Standards and the requirements of the Companies Act of South Africa.
OTHER REPORTS REQUIRED BY THE COMPANIES ACT As part of our audit of the financial statements for the year ended 30 June 2015, we have read the Directors’ Report, the Declaration by Company Secretary and the Report of the Audit Committee for the purpose of identifying whether there are material inconsistencies between these reports and the audited financial statements. These reports are the responsibility of the respective preparers. Based on reading these reports we have not identified material inconsistencies between these reports and the audited financial statements. However, we have not audited these reports and accordingly do not express an opinion on these reports.
KPMG Inc.Registered Auditor
Per GL de LangeChartered Accountant (SA)Registered AuditorDirector
25 August 2015
INDEPENDENT AUDITOR’S REPORT
14 ANNUAL FINANCIAL STATEMENTS
GRO
WTH
POIN
T PR
OPE
RTIE
S LI
MIT
ED A
nnua
l Fin
anci
al S
tate
men
ts 2
015
ACCOUNTING POLICIES
REPORTING ENTITY Growthpoint Properties Ltd (Growthpoint or the company) is a
company domiciled in South Africa. The address of the company’s registered office is The Place, 1 Sandton Drive, Sandton.
The consolidated financial statements include the financial statements of Growthpoint, its subsidiary companies and controlled trusts (together referred to as the Group and individually as group companies), the share of the profit or loss and other comprehensive income of equity-accounted investees, and the Group’s share of the assets, liabilities, income, expenses and cash flows of jointly controlled operations. Where reference is made to the “entity”, this means the company or the Group as appropriate in the context.
NATURE OF BUSINESS
Growthpoint is a Real Estate Investment Trust (REIT) company and is the largest South African listed property company which owns a property portfolio of 471 directly owned properties in South Africa valued at R71,6 billion, 53 properties valued at R22,0 billion through its 65.0% investment in Growthpoint Properties Australia (GOZ), and a 50% interest in the properties of the V&A Waterfront.
From 1 July 2013, Growthpoint became a REIT company and the existing linked unit capital structure converted to an all-equity capital structure in order to align Growthpoint’s linked unit capital structure with the capital structures of international REITs.
The primary business of Growthpoint is long-term investment in quality, rental-generating properties. Properties are maintained, upgraded and refurbished, where necessary, so as to increase their long-term value.
BASIS OF PREPARATION
a) Statement of compliance The Group financial statements comprise the consolidated financial
statements. The consolidated financial statements are prepared in accordance with International Financial Reporting Standards (IFRS), the SAICA Financial Reporting Guides as issued by the Accounting Practices Committee, the JSE Listings Requirements, the requirements of the South African Companies Act, 2008, as amended, and incorporate the principal accounting policies set out below.
Except for the new standards adopted as set out below, all accounting policies applied in the preparation of these consolidated financial statements are in terms of IFRS and are consistent with those applied in the previous consolidated financial statements.
Growthpoint adopted the following new standards and amendments:• Investment entities (Amendments to IFRS 10, IFRS 12 and IAS 27)• Offsetting financial assets and financial liabilities (Amendments to
IAS 32)
• Recoverable amount disclosure for non-financial assets (Amendments to IAS 36)
• Novation of derivative and continuation of hedge accounting (Amendments to IAS 39)
• Annual improvements to IFRS 2010 – 2012• Annual improvements to IFRS 2011 – 2013.
There was no material impact on the financial statements identified based on management’s assessment of these standards.
The financial statements of the company are presented separately from the consolidated financial statements and were approved by the directors on 25 August 2015, the same date as these financial statements. The separate financial statements are available from the Company Secretary.
b) Basis of measurement The financial statements are prepared on the fair value basis for
investment properties as set out in note 1.3, investment properties reclassified as held for sale as set out in note 1.7, and financial instruments as set out in note 1.2. Other assets, liabilities and equity are stated at historic cost. Fair value adjustments (where applicable) do not affect the calculation of distributable earnings but affect the net asset value per share to the extent that adjustments are made to the carrying values of assets and liabilities.
c) Functional and presentation currency The consolidated financial statements are presented in South
African Rand (Rand), which is the company’s functional currency. All financial information presented in Rand has been rounded to the nearest million.
1. SIGNIFICANT ACCOUNTING POLICIES1.1 Basis of consolidation1.1.1 Accounting for business combinations Acquisitions on or after 1 July 2009 The Group accounts for business combinations on or after
1 July 2009 by applying the acquisition method as at the acquisition date and measures goodwill as the fair value of the consideration transferred including the recognised amount of any non-controlling interest in the acquiree, plus the fair value of any existing equity interest, less the net recognised amount (generally fair value) of the identifiable assets acquired and liabilities assumed, all measured at the acquisition date. If this amount is negative, the Group recognises a gain on bargain purchase in profit or loss.
The Group controls an entity when it is exposed to, or has rights to, variable returns from its involvement with the entity and has the ability to affect those through its power over the entity. The acquisition date is the date on which control is transferred to the acquirer. Judgement is applied in determining the acquisition date and determining whether control is transferred from one party to another.
15ACCOUNTING POLICIES
Consideration transferred includes the fair values of the assets transferred, liabilities incurred by the Group to the previous owners of the acquiree, and equity interests issued by the Group. Consideration transferred also includes the fair value of any contingent consideration. If a business combination results in the termination of pre-existing relationships between the Group and the acquiree, then the lower of the termination amount, as contained in the agreement, and the value of the off-market element is deducted from the consideration transferred and recognised in other expenses.
A contingent liability of the acquiree is assumed in a business combination only if such a liability represents a present obligation and arises from a past event, and its fair value can be measured reliably.
The Group measures any non-controlling interest at its proportionate interest in the identifiable net assets of the acquiree.
Transaction costs that the Group incurs in connection with a business combination, such as finder’s fees, legal fees, due diligence fees, and other professional and consulting fees, are expensed as incurred.
Acquisitions between 1 July 2003 and 1 July 2009 For acquisitions between 1 July 2003 and 1 July 2009, goodwill
represents the excess of the cost of the acquisition over the Group’s interest in the recognised amount (generally fair value) of the identifiable assets, liabilities and contingent liabilities of the acquiree. When the excess was negative, the Group immediately recognised a bargain purchase gain in profit or loss.
The Group capitalised transaction costs in connection with the business combination, other than those associated with the issue of debt or equity interests, as part of the cost of the acquisition.
1.1.2 Accounting for acquisitions of non-controlling interests Acquisitions of non-controlling interests that do not result in a loss
of control are accounted for as transactions with equity holders in their capacity as equity holders and therefore, no goodwill is recognised as a result of such transactions.
1.1.3 Subsidiaries Subsidiaries are those entities controlled by the Group. The financial
results of subsidiaries and controlled trusts are included in the consolidated financial statements from the date that control commences until the date that control ceases.
A list of the Group’s subsidiaries is set out in note 44.1, related party transactions.
1.1.4 Interests in equity-accounted investees The Group’s interests in equity-accounted investees comprise
interests in joint ventures. A joint venture is an arrangement in which the Group has joint control, whereby the Group has rights to the net assets of the arrangement, rather than rights to its assets and obligations for its liabilities.
Interests in joint ventures are accounted for using the equity method. They are recognised initially at cost, which includes transaction costs. Subsequent to initial recognition, the consolidated financial statements include the Group’s share of the profit or loss and the other comprehensive income of
equity-accounted investees, until the date on which joint control ceases.
1.1.5 Jointly controlled operations A jointly controlled operation is a joint arrangement whereby the
parties that have joint control of the arrangement have rights to the assets, and obligations to the liabilities, relating to the arrangement. Jointly controlled operations are accounted for by including the Group’s share of the jointly controlled assets, liabilities, income, expenses and cash flows on a line-by-line basis in the financial statements from the date that joint control commences until the date that joint control ceases.
1.1.6 Transactions eliminated on consolidation Intra-group balances, transactions and any unrealised gains and
losses arising from intra-group transactions are eliminated in preparing the consolidated financial statements. Unrealised gains arising from transactions with joint operations and equity-accounted investees are eliminated to the extent of the Group’s interest in the joint operations and investees. Unrealised losses are eliminated in the same way as unrealised gains, but only to the extent that there is no evidence of impairment.
1.2 Financial instruments Financial instruments are contracts that give rise to a financial
asset of one entity, and a financial liability or equity instrument of another entity. All transaction costs relating to “financial instruments at fair value through profit or loss” are expensed immediately. Any gains or losses on these instruments arising from fair value adjustments, where appropriate, do not affect distributable earnings. The Group recognises financial instruments on the date it commits to purchase or sell such instruments. From this date, any gains and losses in the fair value of the financial assets and financial liabilities are recorded in profit or loss.
Certain financial instruments are designated upon initial recognition as “at fair value through profit or loss” as this eliminates or significantly reduces a measurement or recognition inconsistency that would otherwise arise from measuring assets or liabilities or recognising gains or losses on them on different bases.
The Group derecognises a financial asset when the contractual rights to the cash flows from the asset expire, or it transfers the rights to receive the contractual cash flows on the financial asset in a transaction in which substantially all the risks and rewards of ownership of the financial asset are transferred. Any interest in transferred financial assets that is created or retained by the entity is recognised as a separate asset or liability.
The Group derecognises a financial liability when its contractual obligations are discharged, cancelled or expired.
1.2.1 Listed investments In the prior year, the listed investments in Acucap and Sycom were
designated as available-for-sale financial assets and were initially recognised at fair value plus any directly attributable transaction costs.
Subsequent to initial recognition, they were measured at fair value and changes therein were recognised in other comprehensive income and presented in a non-distributable reserve in equity. When the investments were derecognised, the gain or loss accumulated in equity was reclassified to profit or loss.
16 ANNUAL FINANCIAL STATEMENTS
GRO
WTH
POIN
T PR
OPE
RTIE
S LI
MIT
ED A
nnua
l Fin
anci
al S
tate
men
ts 2
015
Listed investments in Stenham European Shopping Centre Fund (SESCF) are designated as at fair value through profit or loss upon initial recognition as such designation eliminates or significantly reduces a measurement or recognition inconsistency that would otherwise arise. The underlying investment in SESCF is property and therefore it would give greater meaning to the financial statements if this was treated in the same way as the other property investment, i.e. at fair value through profit or loss.
Upon initial recognition attributable transaction costs are recognised in profit or loss when incurred. Financial assets at fair value through profit or loss are measured at fair value, with any resultant gain or loss recognised in profit or loss.
1.2.2 Long-term loans Long-term loans are initially recognised and subsequently
measured at fair value. The gain or loss on remeasurement to fair value is recognised immediately in profit or loss. Interest earned on long-term loans is recognised on an accrual basis using the effective interest method.
1.2.3 Trade and other receivables Trade and other receivables are financial assets with fixed or
determinable payments that are not quoted in an active market, are initially recognised at fair value plus any directly attributable transaction costs and subsequently measured at amortised cost which approximates fair value. An estimate is made for credit losses based on a review of all outstanding amounts at year end. Bad debts are written off to profit or loss during the year in which they are identified. Interest earned on trade receivables is recognised on an accrual basis using the effective interest method.
1.2.4 Cash and cash equivalents Cash and cash equivalents comprise cash balances and call deposits
with maturities of three months or less from the acquisition date. Cash equivalents are short-term, highly liquid investments that are readily convertible to known amounts of cash and which are subject to an insignificant risk of change in fair value. Cash and cash equivalents are measured at amortised cost, which approximates fair value. Interest earned on cash invested with financial institutions is recognised on an accrual basis using the effective interest method.
1.2.5 Trade payables Trade payables are initially recognised and subsequently measured
at amortised cost which approximates fair value. Interest payable on trade payables is recognised on an accrual basis using the effective interest method.
1.2.6 Derivative financial instruments The Group uses derivative financial instruments to hedge its
exposure to interest rate risk arising from its financing activities and to hedge its exposure to foreign currency risk.
In accordance with its treasury policy, the Group does not hold or issue derivative financial instruments for trading purposes. However, as the hedge relationship is not designated as a hedge for accounting purposes, the derivatives are accounted for as trading instruments.
Derivative financial instruments are initially recognised and subsequently measured at fair value. The gain or loss on remeasurement to fair value is recognised immediately in profit or
loss. Fair value adjustments are transferred to a non-distributable reserve in the statement of changes in equity.
The Group holds interest rate swap and foreign exchange derivative instruments. The fair value of interest rate swaps is the estimated amount that the entity would receive or pay to terminate the swap at the reporting date, taking into account current interest rates and the current creditworthiness of the swap counterparties. The fair value of foreign exchange contracts is valued by discounting the forward rates applied at year end to the open hedged positions.
1.2.7 Financial liabilities Non-derivative financial liabilities comprising long-term interest-
bearing loans are initially recognised and subsequently measured at fair value, with gains or losses being recognised in profit or loss. The fair value is estimated by discounting the future cash payments using the market rate applicable at the reporting date. Interest payable on financial liabilities is recognised on an accrual basis using the effective interest method.
1.2.8 Offset Financial assets and financial liabilities are offset and the net
amount presented in the statement of financial position when the Group has a legally enforceable right to offset the recognised amounts, and intends either to settle on a net basis, or to realise the asset and settle the liability simultaneously. An entity currently has a legally enforceable right to set-off if that right is not contingent on a future event and enforceable both in the normal course of business and in the event of default, insolvency or bankruptcy of the entity and all counterparties. Gross settlement is equivalent to net settlement if, and only if, the gross settlement mechanism has features that eliminate or result in insignificant credit and liquidity risk, and process receivables and payables in a single settlement process or cycle.
1.3 Investment property Investment property consists of land and buildings, installed
equipment and undeveloped land held to earn rental income for the long term and subsequent capital appreciation.
Properties are initially recognised at cost on acquisition, including all costs directly attributable to the acquisition, and subsequent additions that will result in future economic benefits and whose cost can be measured reliably are capitalised. Investment property under construction is valued at fair value.
Direct costs relating to major capital projects are capitalised until the properties are brought into commercial operation.
Subsequent to initial recognition, investment properties are measured at their fair value. Fair value adjustments are transferred to a non-distributable reserve in the statement of changes in equity.
Investment property is maintained, upgraded and refurbished, where necessary, in order to preserve or improve the capital value as far as it is possible to do so. Maintenance and repairs which neither materially add to the value of the properties nor prolong their useful lives are charged against profit or loss.
Independent valuations are obtained on a rotational basis, ensuring that every property is valued at least once every three years by an external independent valuer. The directors value the remaining properties annually on an open-market basis. The calculations are
17ACCOUNTING POLICIES continued
prepared by considering the aggregate of the net annual rent receivable from the properties and, where relevant, associated costs, using the discounted cash flow method. This method takes projected cash flows and discounts them at a rate which is consistent with comparable market transactions. The discount rates reflect the risks inherent in the net cash flows and are constantly monitored by reference to comparable market transactions. Undeveloped land is valued in terms of the internationally accepted and preferred method of comparison.
Gains or losses on subsequent measurement or disposals of investment properties are recognised in profit or loss. Such gains or losses are excluded from the calculation of distributable earnings.
When properties comprise a portion that is held to earn rental or for capital appreciation, and another portion that is held for use in the production or supply of goods or services or for administrative purposes, then these portions are accounted for separately only if these portions could be sold separately.
If they cannot be sold separately, the entire property is accounted for as an investment property only if an insignificant portion is held for use in the production or supply of goods or services or for administrative purposes.
Investment property held under an operating lease relates to long-term land leases and is recognised in the Group’s statement of financial position at its fair value. This accounting treatment is consistently applied for all such long-term land leases.
1.4 Intangible assets1.4.1 Goodwill Goodwill that arises upon the acquisition of subsidiaries is included
in intangible assets.
Where the net recognised amount of the identifiable assets acquired and liabilities assumed exceeds the fair value of the consideration transferred (including the recognised amount of any non-controlling interest in the acquiree and the fair value of any existing equity interest), this excess is recognised immediately in profit or loss (gain on bargain purchase).
Subsequent to initial recognition, goodwill is measured at cost less accumulated impairment losses.
1.4.2 Other intangible assets Other intangible assets that are acquired by the entity, which have
finite useful lives, are recognised initially at cost and subsequently measured at cost less accumulated amortisation and accumulated impairment losses. Subsequent expenditure is capitalised only when it increases the future economic benefits of the asset to which it relates.
1.4.3 Amortisation Amortisation is recognised in profit or loss on a straight-line
basis over the estimated useful lives of intangible assets, other than goodwill, from the date that they are available for use. Subsequently, the amortisation is transferred to a non-distributable reserve in the statement of changes in equity.
The residual value of the intangible asset is assessed as Rnil and the estimated total useful lives for the current and comparative periods are as follows:
• Rights to manage investment property 15 years• Software development 20 years
Amortisation methods, useful lives and residual values are reassessed annually.
1.5 Equipment Items of equipment are recognised initially at cost and subsequently
measured at cost less accumulated depreciation and accumulated impairment losses. Items of equipment are depreciated from the date they are ready for use. Depreciation is based on the cost of the asset less its residual value and recognised on a straight-line basis, over the current estimated useful lives of the assets. The estimated useful lives of the assets for the current and comparative periods are:• Furniture and fittings 5 years• Equipment 2 – 5 years
Depreciation methods, useful lives and residual values are reassessed annually.
Subsequent expenditure relating to an item of equipment is capitalised when it is probable that future economic benefits will flow to the entity and its cost can be measured reliably.
All other subsequent expenditure is recognised as an expense in the period in which it is incurred.
1.6 Impairment The carrying amount of the Group’s non-financial assets, other
than investment property and deferred tax assets, are reviewed at each reporting date to determine whether there is any indication of impairment. If any such indication exists, then the asset’s recoverable amount is estimated. For goodwill, the recoverable amount is estimated at each reporting date.
For the purpose of impairment testing, assets are grouped together into the smaller group of assets that generate cash inflows from continuing use that are largely independent of the cash inflows of the other assets or groups of assets (the cash-generating unit). The goodwill acquired in a business combination, for the purpose of impairment testing, is allocated to cash-generating units that are expected to benefit from the synergies of the combination.
The recoverable amount of an asset or cash-generating unit is the greater of its value in use and its fair value less costs of disposal. In assessing value in use, the estimated future cash flows are discounted to their present values using a pre-tax discount rate that reflects current market assessments of the time value of money and the risks specific to the asset.
An impairment loss is recognised if the carrying amount of an asset or its cash-generating unit exceeds its estimated recoverable amount. Impairment losses are recognised in profit or loss. Impairment losses recognised in respect of the cash-generating units are allocated first to reduce the carrying amount of any goodwill allocated to the units and then to reduce the carrying amount of the other assets in the unit (group of units) on a pro rata basis.
Impairment losses in respect of goodwill are not reversed. In respect of other assets, impairment losses recognised in prior periods are assessed at each reporting date for any indications that
18 ANNUAL FINANCIAL STATEMENTS
GRO
WTH
POIN
T PR
OPE
RTIE
S LI
MIT
ED A
nnua
l Fin
anci
al S
tate
men
ts 2
015
the loss has decreased or no longer exists. An impairment loss is reversed if there has been a change in estimates used to determine the recoverable amount. An impairment loss is reversed only to the extent that the asset’s carrying amount does not exceed the carrying amount that would have been determined, net of depreciation or amortisation, if no impairment loss had been recognised.
Goodwill and intangible assets with indefinite lives are tested annually for impairment.
1.7 Non-current assets held for sale Non-current assets, or disposal groups comprising assets and
liabilities, that are expected to be recovered primarily through sale rather than through continuing use, are classified as held for sale. Immediately before classification as held for sale, the measurement of assets (and all assets and liabilities in a disposal group) is brought up to date in accordance with applicable IFRS. Then, on initial classification as held for sale, non-current assets and disposal groups are recognised at the lower of the carrying amount and fair value less costs to sell. Investment properties classified as held for sale are measured in accordance with IAS 40 Investment property at fair value with gains and losses on subsequent measurement being recognised in profit or loss.
1.8 Financial guarantee contracts A financial guarantee contract is a contract that requires the issuer
to make specified payments to reimburse the holder for a loss it incurs because a specified debtor fails to make payment when due in accordance with the original or modified terms of a debt instrument. These financial guarantee contracts are classified as insurance contracts as defined in IFRS 4 Insurance contracts.
A liability is recognised when it is probable that an outflow of resources embodying economic benefits will be required to settle the contract and a reliable estimate can be made of the amount of the obligation. The amount recognised is the best estimate of the expenditure required to settle the contract at the reporting date. Where the effect of discounting is material, the liability is discounted. The discount rate used is a pre-tax rate that reflects current market assessments of the time value of money and, where appropriate, the risks specific to the liability.
The Group performs liability adequacy tests on financial guarantee contract liabilities to ensure that the carrying amount of the liabilities is sufficient in view of estimated future cash flows. When performing the liability adequacy test, the Group discounts all expected contractual cash flows and compares this amount to the carrying value of the liability. Where a shortfall is identified, an additional provision is made.
1.9 Provisions Provisions are recognised when the Group has a present legal or
constructive obligation as a result of a past event and it is probable that an outflow of resources embodying economic benefits will be required to settle the obligation and, in addition, a reliable estimate of the amount can be made. Provisions are determined by discounting the expected future cash flows at a pre-tax rate that
reflects current market assessments of the time value of money and the risks specific to the liability. The unwinding of the discount is recognised as a finance cost.
1.10 Ordinary shares Ordinary shares are classified as equity. Incremental costs directly
attributable to the issue of ordinary shares are recognised as a deduction from equity.
1.11 Treasury shares Shares in the company held by Growthpoint Management Services
(Pty) Ltd and unvested restricted shares held for employee participants in the Staff Incentive Scheme Trust are classified as treasury shares. The cost price of these shares, together with related transaction costs, is deducted from equity, but disclosed separately in the statement of changes in equity. The issued and weighted average number of shares is reduced by the treasury shares for the purposes of the basic and headline earnings per share calculations. The issued number of shares is not reduced by the treasury shares for the purpose of the dividend per share calculations. Dividends received on treasury shares are recognised directly in equity.
When treasury shares held for employee participants vest in such participants, the shares will no longer be classified as treasury shares, their cost will no longer be deducted from equity and their number will be taken into account for the purposes of basic and headline earnings per share calculations.
1.12 Dividends paid Dividends or other distributions to the holders of equity
instruments, in their capacity as owners, are recognised directly in equity on the date of declaration.
1.13 Foreign currency Foreign currency transactions Transactions in foreign currencies are translated to the respective
functional currencies of Group entities at exchange rates at the dates of the transactions. Monetary assets and liabilities denominated in foreign currencies at the reporting date are re-translated to the functional currency at the exchange rate at that date.
The foreign currency gain or loss on monetary items is the difference between the amortised cost in the functional currency at the beginning of the period, adjusted for effective interest and payments during the period, and the amortised cost in foreign currency translated at the exchange rate at the end of the reporting period. Non-monetary assets and liabilities denominated in foreign currencies that are measured at fair value are re-translated to the functional currency at the exchange rate at the date that the fair value was determined.
Foreign currency differences arising on re-translation are recognised in profit or loss. Non-monetary items that are measured in terms of historical cost in a foreign currency are translated using the exchange rate at the date of the transaction.
Foreign operations The assets and liabilities of foreign operations, including goodwill
and fair value adjustments arising on acquisition, are translated to
19ACCOUNTING POLICIES continued
the Group’s presentation currency (Rand) at exchange rates at the reporting date. The income and expenses of foreign operations are translated to Rand at exchange rates at the dates of the transactions (an average rate per month is used).
When the Group disposes of only part of its interest in a subsidiary that includes foreign operations while retaining control, the relevant proportion of the cumulative amount is re-attributed to non-controlling interests.
Foreign currency differences on translation of the financial position and results of a foreign operation into the Group’s presentation currency are recognised in other comprehensive income and accumulated in the foreign currency translation reserve (FCTR), except to the extent that the translation difference is allocated to non-controlling interests. When a foreign operation is disposed of, in part or in full, such that control, significant influence or joint control is lost, the cumulative amount in the FCTR is reclassified to profit or loss as part of the gain or loss on disposal. When the Group disposes of only part of an associate or joint venture while retaining significant influence or joint control, the relevant portion of the cumulative amount is reclassified to profit or loss.
1.14 Non-distributable reserve The non-distributable reserve relates to items that are not
distributable to shareholders, such as fair value adjustments on the revaluation of investment property, long-term loans, borrowings and derivatives, the amortisation of intangible assets, share-based payment transactions, the straight-line lease income adjustment, non-cash charges, capital items, deferred taxation, bargain purchases and reserves with the non-controlling interest.
1.15 Leases The Group is party to numerous leasing contracts as the lessor of
property. All leases are operating leases, which are those leases where the Group retains a significant portion of the risks and rewards of ownership.
An adjustment is made to contractual rental income earned to bring to account in the current period the difference between the rental income that the entity is currently entitled to and the rental for the period calculated on a smoothed, straight-line basis over the period of the lease term. This does not affect distributable earnings.
The Group provides certain incentives for the lessee to enter into lease agreements. Initial periods of the lease term may be agreed to be rent-free or at a reduced rent. All incentives are recognised as an integral part of the net consideration agreed for the use of the leased asset, irrespective of the incentive’s nature or form or the timing of payments. The Group recognises the aggregate cost of incentives as a reduction of rental income over the lease term, on a straight-line basis.
The Group is party to leasing contracts as the lessee of some property and equipment. Leases are classified as operating leases where substantially all the risks and rewards associated with
ownership of the asset are not transferred from the lessor to the lessee. Operating lease rentals with fixed escalation clauses are recognised in profit or loss on a straight-line basis over the lease term. The resulting difference arising from the straight-line basis and contractual cash flows is recognised as an operating lease asset or operating lease liability.
1.16 Revenue recognition Revenue from the letting of investment property comprises gross
rental income and recoveries of fixed operating costs, net of value added tax. Rental income is recognised in profit or loss on a straight-line basis over the term of the lease. Recoveries of costs from lessees, where the entity merely acts as an agent and makes payment of these costs on behalf of lessees, are offset against the relevant costs. The Group recognises the aggregate cost of incentives as a reduction of rental income over the lease term, on a straight-line basis.
1.17 Property letting commissions and tenant installations When considered material, letting commissions and tenant
installations are written off over the period of the lease. Letting commissions paid in respect of new developments are capitalised to the cost of the property.
1.18 Operating profit Operating profit included in profit or loss represents the net
property income earned from investment property, adjusted for other operating expenses and income.
1.19 Taxation Income tax for the year comprises current and deferred tax. Income
tax is recognised in profit or loss except to the extent that it relates to items recognised directly in equity or other comprehensive income, in which case it is recognised in equity or other comprehensive income. Current tax is the expected tax payable on the taxable income, after deducting the qualifying distribution for that year of assessment, using tax rates enacted or substantively enacted at the reporting date, and any adjustments to tax payable in respect of previous years. In accordance with the status as a REIT, dividends declared meet the requirements of a qualifying distribution for the purposes of section 25BB of the Income Tax Act, No. 58 of 1962, (as amended) (Income Tax Act).
Deferred tax is recognised for temporary differences between the carrying amounts of assets and liabilities for financial reporting purposes and the amounts used for taxation purposes. Deferred tax is not recognised for the following temporary differences:• The initial recognition of assets or liabilities in a transaction that
is not a business combination and that affects neither accounting nor taxable profit.
• Goodwill that arises on initial recognition.• Differences relating to investments in subsidiaries and jointly
controlled entities to the extent that the Group is able to control the reversal of the temporary differences and it is probable that they will not reverse in the foreseeable future.
20 ANNUAL FINANCIAL STATEMENTS
GRO
WTH
POIN
T PR
OPE
RTIE
S LI
MIT
ED A
nnua
l Fin
anci
al S
tate
men
ts 2
015
No deferred tax was recognised on the fair value of investment property. Investment property will be realised through sale, and subsequent to the conversion to a REIT, capital gains tax is no longer applicable in terms of section 25BB of the Income Tax Act.
The deferred tax relating to the amortisation of the intangible asset is initially recognised in profit or loss and is subsequently transferred to a non-distributable reserve in the statement of changes in equity. The amount of deferred tax recognised is based on the expected manner of realisation or settlement of the carrying amount of assets and liabilities, using tax rates expected to be applied to temporary differences when they reverse, based on tax laws enacted or substantively enacted at the reporting date.
Deferred tax assets and liabilities are offset if there is a legally enforceable right to offset current tax liabilities and assets, and they relate to income taxes levied by the same tax authority on the same taxable entity, or on different tax entities, but they intend to either settle current tax liabilities and assets on a net basis or realise the assets and settle the liabilities simultaneously.
A deferred tax asset is recognised for deductible temporary differences and unused tax losses to the extent that it is probable that future taxable profits will be available against which the asset can be utilised. Deferred tax assets are reviewed at each reporting date and are reduced to the extent that it is no longer probable that the related tax benefit will be realised.
Dividends received by or accrued to South African tax residents are exempt from dividend withholding tax, but will be included in the gross income of such shareholders and will not be exempt from the income tax in terms of the exclusion to the general dividend exemption contained in section 10(1)(k)(i)(aa) of the Income Tax Act because they are dividends distributed by a REIT. With effect from 1 January 2014, any dividend received by a non-resident from a REIT will be subject to dividend withholding tax at 15%, unless the rate is reduced in terms of any applicable agreement for the avoidance of double taxation between South Africa and the country of residence of the non-resident shareholder. Dividends received by non-resident shareholders from a REIT will not be taxable as income in South Africa and instead will be treated as ordinary dividends which are exempt from income tax in terms of the general dividend exemption section 10(1)(k) of the Income Tax Act.
Withholding tax relating to foreign distributions received is recognised as part of the tax expense, and the financial results are reflected at the gross amounts, before withholding tax.
1.20 Borrowing costs Borrowing costs incurred on qualifying assets are capitalised until
such time as the assets are substantially ready for their intended use. Qualifying assets are those that necessarily take a substantial period of time to prepare for their intended use. Capitalisation is suspended during extended periods in which active development is interrupted.
All other borrowing costs are expensed in profit or loss in the period in which they are incurred using the effective interest method.
1.21 Employee benefits1.21.1 Short-term benefits The cost of all short-term employee benefits is recognised during
the period in which the employee renders the related service. Short-term employee benefits are measured on an undiscounted basis. The accrual for employee entitlements to salaries, bonuses, staff incentive schemes and annual leave represents the amount which the Group has a present legal or constructive obligation to pay as a result of employees’ services provided up to the reporting date.
1.21.2 Defined contribution plans A defined contribution plan is a post-employment benefit plan
under which an entity pays fixed contributions to a separate entity and will have no legal or constructive obligation to pay further amounts. Obligations for contributions to the defined contribution provident plan are recognised as an employee benefit expense in profit or loss in the periods during which related services are rendered by employees. Prepaid contributions are recognised as an asset to the extent that a cash refund or a reduction in future payments is available.
1.21.3 Share-based payment transactions In respect of linked units allocated to employees, subsequent to the
8,5 million linked units relating to the management “buy-in” transaction but before the conversion to a REIT, the grant-date fair value of the linked unit payment award granted to employees was recognised as an employee expense, with a corresponding increase in liabilities, over the period that the employees became unconditionally entitled to the awards in terms of IFRS 2 Share-based payment transactions. The liability was remeasured at each reporting date and at settlement date based on the fair value of the linked units. Any changes in the liability were recognised as employee benefit expenses in profit or loss.
The grant-date fair value of share-based payment awards granted to employees is recognised as an employee expense, with a corresponding increase in equity, over the period that the employees become unconditionally entitled to the awards. The amount recognised as an expense is adjusted to reflect the number of awards for which the related service and non-market performance conditions are expected to be met, such that the amount ultimately recognised as an expense is based on the number of awards that meet the related service and non-market performance conditions at the vesting date.
1.22 Non-cash charges and capital items Amortisation of intangible assets, as well as expenses relating to
the staff incentive scheme are recurring expenses and are classified as non-cash charges. Impairment of goodwill, although not recurring, are also classified as non-cash charges as the expense relates to intangible assets.
Costs incurred on business acquisitions and items reclassified from other comprehensive income to profit or loss are classified as capital items.
21ACCOUNTING POLICIES continued
1.23 Segment reporting Determination and presentation of operating segments The Group determines and presents operating segments based on
the information that is provided internally to the Executive Management Committee (Exco), the Group’s operating decision- making forum. The Group has five main reportable segments namely:• Retail • Office• Industrial• Australia• V&A Waterfront
An operating segment is a component of the Group that engages in business activities from which it may earn revenues and incur expenses, including revenues and expenses that relate to transactions with any of the Group’s other components. An operating segment’s operating results are reviewed regularly by Exco to make decisions about resources to be allocated to the segment and assess its performance, and for which discrete financial information is available.
Segment results that are reported to Exco include items directly attributable to a segment or a region, as well as those that can be allocated on a reasonable basis. Unallocated items are reported by location and mainly comprise long-term loans granted, intangible assets, derivatives, trade and other receivables, cash and cash equivalents, deferred tax, other non-current liabilities (borrowings), trade and other payables, and the related income and expenses to these items.
Segment capital expenditure is the total cost incurred during the period on investment property, including costs incurred on the investment property of the V&A Waterfront, as well as other joint ventures.
In addition to the main reportable segments, the Group also includes a geographical analysis of net property income, excluding straight-line lease income adjustment and investment property. The following segments have been identified:• Greater Johannesburg• Pretoria• Western Cape• KwaZulu-Natal• Eastern Cape• North West• Australia• V&A Waterfront
1.24 Key judgements and sources of estimation uncertainty The preparation of financial statements in conformity with IFRS
requires management to make judgements, estimates and assumptions that affect the application of accounting policies and the reported amounts of assets, liabilities, income and expenses. Actual results may differ from these estimates. Estimates and
underlying assumptions are reviewed on an ongoing basis. Revisions to accounting estimates are recognised in the period in which the estimates are revised and in any future periods affected. Information regarding judgements that have the most significant effect on the amounts recognised in the financial statements, as well as the key sources of estimation uncertainty, is set out in:• Note 11 Taxation• Note 14 Investment property• Note 17 Intangible assets• Note 30 Deferred taxation• Note 45 Financial instruments
1.25 Standards and interpretations applicable to the Group not yet effective
There are new or revised accounting standards and interpretations in issue that are not yet effective. These include the following standards and interpretations that are material to the business of the entity and which may have an impact on future financial statements, or those for which the impact has not as yet been assessed. These standards were not early adopted.
IFRS 9 Financial instruments IFRS 9 will be adopted by the Group for the first time for its financial
reporting period ending 30 June 2019. The standard will be applied retrospectively, subject to transitional provisions.
IFRS 9 addresses the following and will replace the relevant sections of IAS 39:• The classification and measurement of financial assets• The classification and measurement of financial liabilities• The derecognition of financial assets and liabilities
Under IFRS 9 there are two options in respect of the classification of financial assets, namely, financial assets measured at amortised cost or at fair value. Financial assets are measured at amortised cost when the business model is to hold assets in order to collect contractual cash flows and when they give rise to cash flows that are solely payments of principal and interest on the principal outstanding. All other financial assets are measured at fair value.
Embedded derivatives are no longer separated from hybrid contracts that have a financial asset host.
IFRS 9 has retained in general the requirements of IAS 39 for financial liabilities, except for the following two aspects:• Fair value changes for financial liabilities (other than financial
guarantees and loan commitments) designated at fair value through profit or loss, that are attributable to the changes in the credit risk of the liability, will be presented in other comprehensive income (OCI). The remaining amount of the fair value change is recognised in profit or loss. However, if this requirement creates or enlarges an accounting mismatch in profit or loss, then the whole fair value change is presented in profit or loss. The determination as to whether such presentation would create or enlarge an accounting mismatch is made on initial recognition and is not subsequently re-assessed.
22 ANNUAL FINANCIAL STATEMENTS
GRO
WTH
POIN
T PR
OPE
RTIE
S LI
MIT
ED A
nnua
l Fin
anci
al S
tate
men
ts 2
015
• Derivative liabilities that are linked to and must be settled by delivery of an unquoted equity instrument whose fair value cannot be reliably measured, are measured at fair value.
IFRS 9 incorporates the guidance in IAS 39 dealing with fair value measurement and accounting for derivatives embedded in a host contract that is not a financial asset, as well as the requirements of IFRIC 9 Reassessment of embedded derivatives.
The Group is assessing the potential impact on its consolidated financial statements resulting from the application of IFRS 9.
IFRS 15 Revenue from contracts with customers This standard replaces IAS 11 Construction contracts, IAS 18
Revenue, IFRIC 13 Customer loyalty programmes, IFRIC 15 Agreements for the construction of real estate, IFRIC 18 Transfer of assets from customers and SIC-31 Revenue – barter of transactions involving advertising services.
IFRS 15 will be adopted by the Group for the first time for its financial reporting period ending 30 June 2019.
The standard contains a single model that applies to contracts with customers and two approaches to recognising revenue: at a point in time or over time. The model features a contract-based five-step analysis of transactions to determine whether, how much and when revenue is recognised.
The Group is assessing the potential impact on its consolidated financial statements resulting from the application of IFRS 15.
IFRS 11 Joint arrangements (amendments) The objective was to add new guidance to IFRS 11 Joint
Arrangements on the accounting for the acquisition of an interest in a joint operation that constitutes a business. The IASB decided that acquirers of such interests shall apply all of the principles on business combinations accounting in IFRS 3 Business Combinations, and other IFRSs, that do not conflict with the guidance in IFRS 11 and disclose the information that is required in those IFRSs in relation to business combinations. IFRS 11 (amended) will be adopted by the Group for the first time for its financial reporting period ending 30 June 2017.
The Group is assessing the potential impact on its consolidated financial statements resulting from the application of IFRS 11 (amended).
Sale or contribution of assets between an investor and its associate or joint venture (amendment to IFRS 10 and IAS 28)
The objective of the project is to address an acknowledged inconsistency between the requirements in IFRS 10 and those in IAS 28 (2011), in dealing with the sale or contribution of assets between an investor and its associate or joint venture. The amendments address an acknowledged inconsistency between the requirements in IFRS 10 and those in IAS 28 (2011), in dealing
with the sale or contribution of assets between an investor and its associate or joint venture. The main consequence of the amendments is that a full gain or loss is recognised when a transaction involves a business (whether it is housed in a subsidiary or not). A partial gain or loss is recognised when a transaction involves assets that do not constitute a business, even if these assets are housed in a subsidiary. It will be adopted by the Group for the first time for its financial reporting period ending 30 June 2018.
The Group is assessing the potential impact on its consolidated financial statements resulting from the application of IFRS 11 (amended).
Disclosure initiative (amendments to IAS 1) The International Accounting Standards Board (IASB) has published
“Disclosure Initiative (Amendments to IAS 1)”. The amendments aim at clarifying IAS 1 to address perceived impediments to preparers exercising their judgement in presenting their financial reports. It will be adopted by the Group for the first time for its financial reporting period ending 30 June 2017.
The Group is assessing the potential impact on its consolidated financial statements resulting from the application of IAS 1 (amended).
IFRS 5 Changes in methods of disposal Assets (or disposal groups) are generally disposed of either through
sale or through distribution to owners. The amendment to IFRS 5 clarifies that changing from one of these disposal methods to the other should not be considered to be a new plan of disposal, rather it is a continuation of the original plan. There is therefore no interruption of the application of the requirements in IFRS 5.
The amendment also clarifies that changing the disposal method does not change the date of classification. For example, on 1 September 2016, Entity A determines that it will distribute shares of its subsidiary to its shareholders. Consequently, it classifies the subsidiary as “held for distribution”. However, on 1 December 2016, Entity A decides that, instead of distributing the shares to its shareholders, it will sell the subsidiary. Therefore, it changes the disposal method to “held for sale”. The date of classification continues to be 1 September 2016 and the sale must be completed within one year from that date.
The Group is assessing the potential impact on its consolidated financial statements resulting from the application of IFRS 5 (amended).
IFRS 7 Financial instruments: disclosures In December 2011, IFRS 7 was amended to add guidance on
offsetting of financial assets and financial liabilities. In the effective date and transition for that amendment, paragraph 44R of IFRS 7 states that “[A]n entity shall apply those amendments for annual periods beginning on or after 1 January 2013 and interim periods within those annual periods.” The interim disclosure standard, IAS 34, does not reflect this requirement, however, and it is not
23ACCOUNTING POLICIES continued
clear whether those disclosures are required in the condensed interim financial report.
The amendment removes the phrase “and interim periods within those annual periods” from paragraph 44R, clarifying that these IFRS 7 disclosures are not required in the condensed interim financial report. However, the IASB noted that IAS 34 requires an entity to disclose “[…] an explanation of events and transactions that are significant to an understanding of the changes in financial position and performance of the entity since the end of the last annual reporting period”. Therefore, if the IFRS 7 disclosures provide a significant update to the information reported in the most recent annual report, the IASB would expect the disclosures to be included in the entity’s condensed interim financial report.
The Group is assessing the potential impact on its consolidated financial statements resulting from the application of IFRS 7 (amended).
IAS 34 Interim financial reporting: disclosure of information “elsewhere in the interim financial report”
IAS 34 requires entities to disclose information in the notes to the interim financial statements “if not disclosed elsewhere in the interim financial report”. However, it is unclear what the IASB means by “elsewhere in the interim financial report”.
The amendment states that the required interim disclosures must either be in the interim financial statements or incorporated by cross-reference between the interim financial statements and wherever they are included within the greater interim financial report (e.g. in the management commentary or risk report).
The IASB specified that the other information within the interim financial report must be available to users on the same terms as the interim financial statements and at the same time. If users do not have access to the other information in this manner, then the interim financial report is incomplete.
The Group is assessing the potential impact on its consolidated financial statements resulting from the application of IAS 34 (amended).
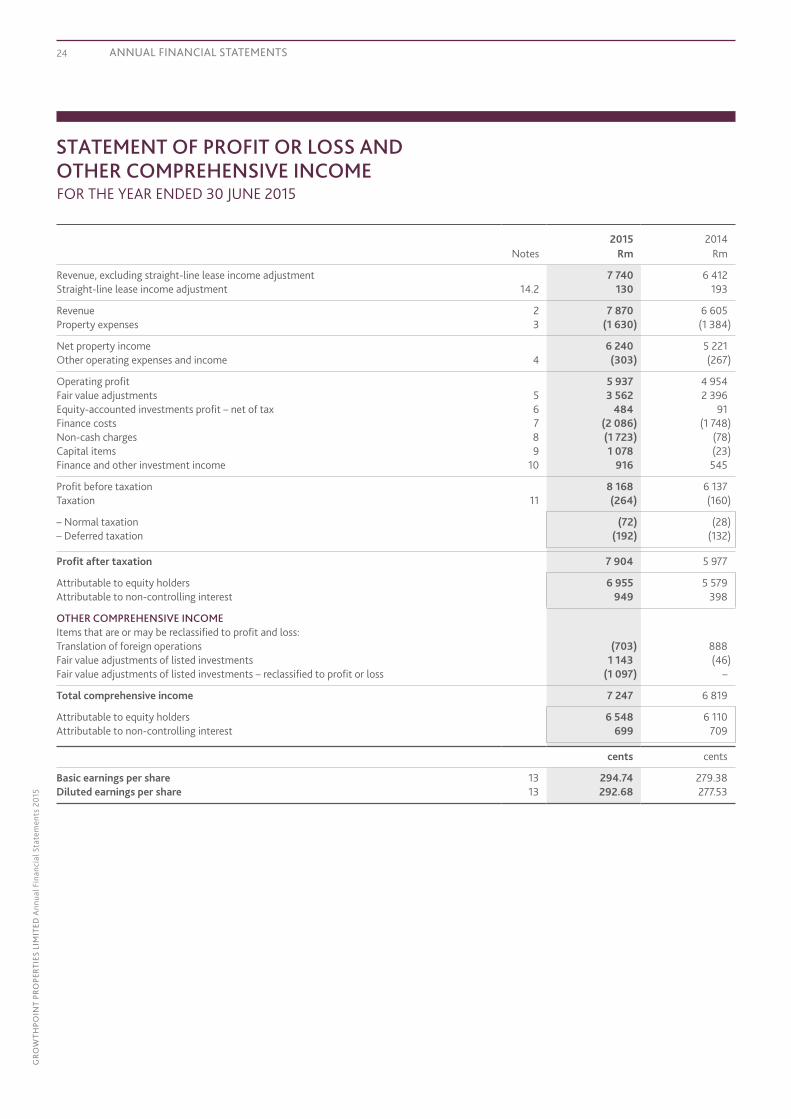
24 ANNUAL FINANCIAL STATEMENTS
GRO
WTH
POIN
T PR
OPE
RTIE
S LI
MIT
ED A
nnua
l Fin
anci
al S
tate
men
ts 2
015
Notes2015
Rm2014
Rm
Revenue, excluding straight-line lease income adjustment 7 740 6 412 Straight-line lease income adjustment 14.2 130 193
Revenue 2 7 870 6 605 Property expenses 3 (1 630) (1 384)
Net property income 6 240 5 221 Other operating expenses and income 4 (303) (267)
Operating profit 5 937 4 954 Fair value adjustments 5 3 562 2 396 Equity-accounted investments profit – net of tax 6 484 91 Finance costs 7 (2 086) (1 748)Non-cash charges 8 (1 723) (78)Capital items 9 1 078 (23)Finance and other investment income 10 916 545
Profit before taxation 8 168 6 137 Taxation 11 (264) (160)
– Normal taxation (72) (28)– Deferred taxation (192) (132)
Profit after taxation 7 904 5 977
Attributable to equity holders 6 955 5 579 Attributable to non-controlling interest 949 398
OTHER COMPREHENSIVE INCOMEItems that are or may be reclassified to profit and loss:Translation of foreign operations (703) 888 Fair value adjustments of listed investments 1 143 (46)Fair value adjustments of listed investments – reclassified to profit or loss (1 097) –
Total comprehensive income 7 247 6 819
Attributable to equity holders 6 548 6 110 Attributable to non-controlling interest 699 709
cents cents
Basic earnings per share 13 294.74 279.38 Diluted earnings per share 13 292.68 277.53
STATEMENT OF PROFIT OR LOSS AND OTHER COMPREHENSIVE INCOMEFOR THE YEAR ENDED 30 JUNE 2015
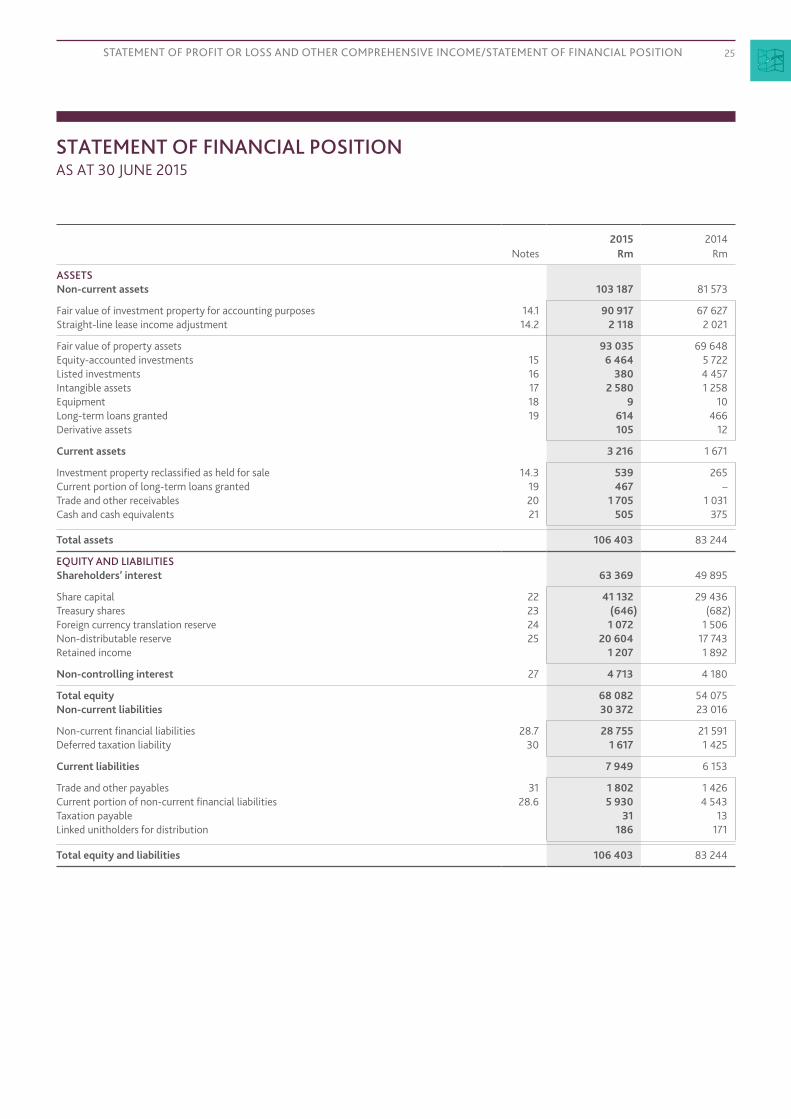
25STATEMENT OF PROFIT OR LOSS AND OTHER COMPREHENSIVE INCOME/STATEMENT OF FINANCIAL POSITION
STATEMENT OF FINANCIAL POSITIONAS AT 30 JUNE 2015
Notes2015
Rm2014
Rm
ASSETSNon-current assets 103 187 81 573
Fair value of investment property for accounting purposes 14.1 90 917 67 627 Straight-line lease income adjustment 14.2 2 118 2 021
Fair value of property assets 93 035 69 648 Equity-accounted investments 15 6 464 5 722 Listed investments 16 380 4 457 Intangible assets 17 2 580 1 258 Equipment 18 9 10 Long-term loans granted 19 614 466 Derivative assets 105 12
Current assets 3 216 1 671
Investment property reclassified as held for sale 14.3 539 265 Current portion of long-term loans granted 19 467 – Trade and other receivables 20 1 705 1 031 Cash and cash equivalents 21 505 375
Total assets 106 403 83 244
EQUITY AND LIABILITIESShareholders’ interest 63 369 49 895
Share capital 22 41 132 29 436 Treasury shares 23 (646) (682)Foreign currency translation reserve 24 1 072 1 506 Non-distributable reserve 25 20 604 17 743 Retained income 1 207 1 892
Non-controlling interest 27 4 713 4 180
Total equity 68 082 54 075 Non-current liabilities 30 372 23 016
Non-current financial liabilities 28.7 28 755 21 591 Deferred taxation liability 30 1 617 1 425
Current liabilities 7 949 6 153
Trade and other payables 31 1 802 1 426 Current portion of non-current financial liabilities 28.6 5 930 4 543 Taxation payable 31 13 Linked unitholders for distribution 186 171
Total equity and liabilities 106 403 83 244
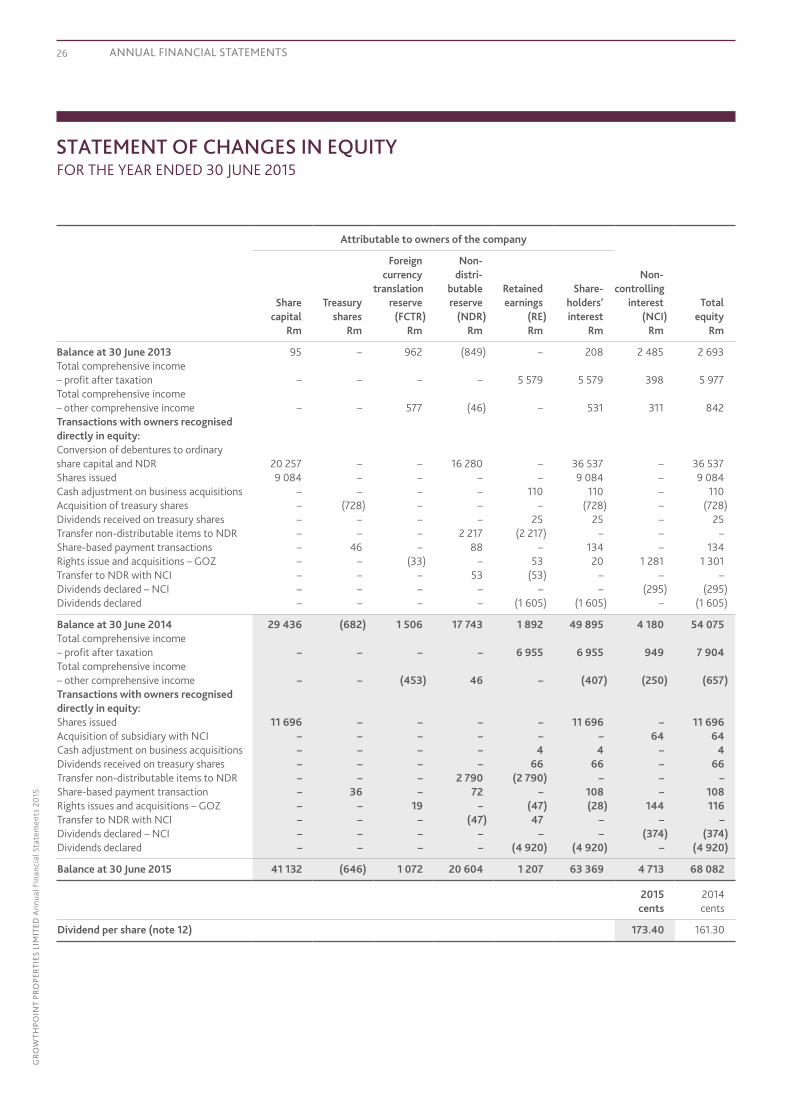
26 ANNUAL FINANCIAL STATEMENTS
GRO
WTH
POIN
T PR
OPE
RTIE
S LI
MIT
ED A
nnua
l Fin
anci
al S
tate
men
ts 2
015
Attributable to owners of the company
Share capital
Rm
Treasury shares
Rm
Foreign currency
translation reserve
(FCTR)Rm
Non-distri-
butable reserve
(NDR)Rm
Retained earnings
(RE)Rm
Share-holders’ interest
Rm
Non-controlling
interest (NCI)
Rm
Total equity
Rm
Balance at 30 June 2013 95 – 962 (849) – 208 2 485 2 693 Total comprehensive income – profit after taxation – – – – 5 579 5 579 398 5 977 Total comprehensive income – other comprehensive income – – 577 (46) – 531 311 842 Transactions with owners recognised directly in equity:Conversion of debentures to ordinary share capital and NDR 20 257 – – 16 280 – 36 537 – 36 537 Shares issued 9 084 – – – – 9 084 – 9 084 Cash adjustment on business acquisitions – – – – 110 110 – 110 Acquisition of treasury shares – (728) – – – (728) – (728)Dividends received on treasury shares – – – – 25 25 – 25 Transfer non-distributable items to NDR – – – 2 217 (2 217) – – – Share-based payment transactions – 46 – 88 – 134 – 134 Rights issue and acquisitions – GOZ – – (33) – 53 20 1 281 1 301 Transfer to NDR with NCI – – – 53 (53) – – – Dividends declared – NCI – – – – – – (295) (295)Dividends declared – – – – (1 605) (1 605) – (1 605)
Balance at 30 June 2014 29 436 (682) 1 506 17 743 1 892 49 895 4 180 54 075 Total comprehensive income – profit after taxation – – – – 6 955 6 955 949 7 904 Total comprehensive income – other comprehensive income – – (453) 46 – (407) (250) (657)Transactions with owners recognised directly in equity:Shares issued 11 696 – – – – 11 696 – 11 696 Acquisition of subsidiary with NCI – – – – – – 64 64 Cash adjustment on business acquisitions – – – – 4 4 – 4 Dividends received on treasury shares – – – – 66 66 – 66 Transfer non-distributable items to NDR – – – 2 790 (2 790) – – – Share-based payment transaction – 36 – 72 – 108 – 108 Rights issues and acquisitions – GOZ – – 19 – (47) (28) 144 116 Transfer to NDR with NCI – – – (47) 47 – – – Dividends declared – NCI – – – – – – (374) (374)Dividends declared – – – – (4 920) (4 920) – (4 920)
Balance at 30 June 2015 41 132 (646) 1 072 20 604 1 207 63 369 4 713 68 082
2015cents
2014cents
Dividend per share (note 12) 173.40 161.30
STATEMENT OF CHANGES IN EQUITYFOR THE YEAR ENDED 30 JUNE 2015
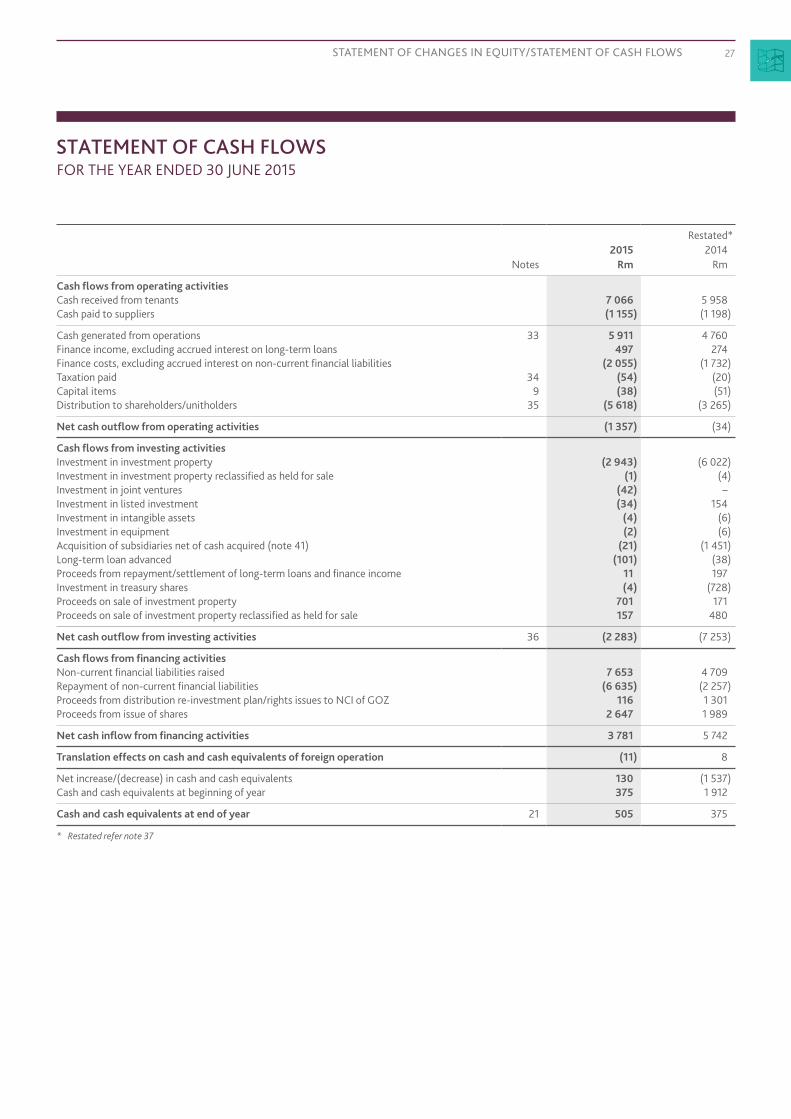
27STATEMENT OF CHANGES IN EQUITY/STATEMENT OF CASH FLOWS
STATEMENT OF CASH FLOWSFOR THE YEAR ENDED 30 JUNE 2015
Notes2015
Rm
Restated*2014
Rm
Cash flows from operating activitiesCash received from tenants 7 066 5 958 Cash paid to suppliers (1 155) (1 198)
Cash generated from operations 33 5 911 4 760 Finance income, excluding accrued interest on long-term loans 497 274 Finance costs, excluding accrued interest on non-current financial liabilities (2 055) (1 732)Taxation paid 34 (54) (20)Capital items 9 (38) (51)Distribution to shareholders/unitholders 35 (5 618) (3 265)
Net cash outflow from operating activities (1 357) (34)
Cash flows from investing activities Investment in investment property (2 943) (6 022)Investment in investment property reclassified as held for sale (1) (4)Investment in joint ventures (42) – Investment in listed investment (34) 154 Investment in intangible assets (4) (6)Investment in equipment (2) (6)Acquisition of subsidiaries net of cash acquired (note 41) (21) (1 451)Long-term loan advanced (101) (38)Proceeds from repayment/settlement of long-term loans and finance income 11 197 Investment in treasury shares (4) (728)Proceeds on sale of investment property 701 171 Proceeds on sale of investment property reclassified as held for sale 157 480
Net cash outflow from investing activities 36 (2 283) (7 253)
Cash flows from financing activitiesNon-current financial liabilities raised 7 653 4 709 Repayment of non-current financial liabilities (6 635) (2 257)Proceeds from distribution re-investment plan/rights issues to NCI of GOZ 116 1 301 Proceeds from issue of shares 2 647 1 989
Net cash inflow from financing activities 3 781 5 742
Translation effects on cash and cash equivalents of foreign operation (11) 8
Net increase/(decrease) in cash and cash equivalents 130 (1 537)Cash and cash equivalents at beginning of year 375 1 912
Cash and cash equivalents at end of year 21 505 375
* Restated refer note 37
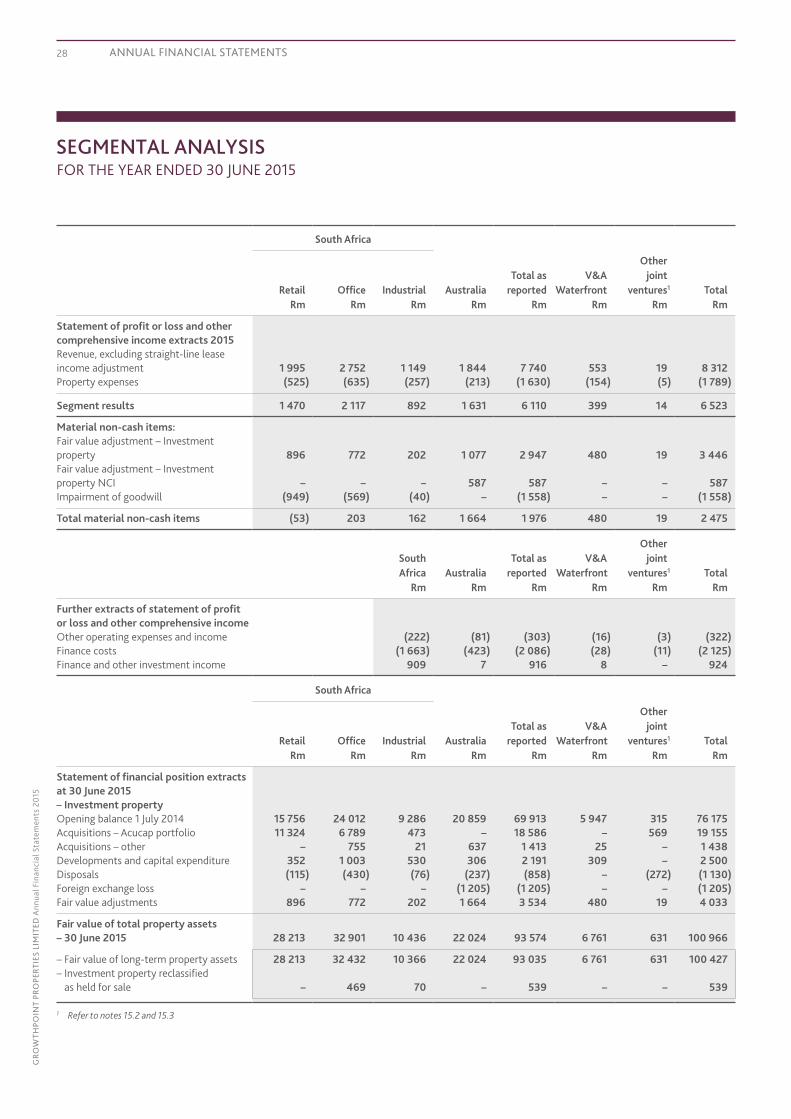
28 ANNUAL FINANCIAL STATEMENTS
GRO
WTH
POIN
T PR
OPE
RTIE
S LI
MIT
ED A
nnua
l Fin
anci
al S
tate
men
ts 2
015
SEGMENTAL ANALYSISFOR THE YEAR ENDED 30 JUNE 2015
South Africa
RetailRm
OfficeRm
Industrial Rm
AustraliaRm
Total as reported
Rm
V&A Waterfront
Rm
Other joint
ventures1
RmTotal
Rm
Statement of profit or loss and other comprehensive income extracts 2015Revenue, excluding straight-line lease income adjustment 1 995 2 752 1 149 1 844 7 740 553 19 8 312 Property expenses (525) (635) (257) (213) (1 630) (154) (5) (1 789)
Segment results 1 470 2 117 892 1 631 6 110 399 14 6 523
Material non-cash items:Fair value adjustment – Investment property 896 772 202 1 077 2 947 480 19 3 446 Fair value adjustment – Investment property NCI – – – 587 587 – – 587 Impairment of goodwill (949) (569) (40) – (1 558) – – (1 558)
Total material non-cash items (53) 203 162 1 664 1 976 480 19 2 475
South Africa
RmAustralia
Rm
Total as reported
Rm
V&A Waterfront
Rm
Other joint
ventures1
RmTotal
Rm
Further extracts of statement of profit or loss and other comprehensive incomeOther operating expenses and income (222) (81) (303) (16) (3) (322)Finance costs (1 663) (423) (2 086) (28) (11) (2 125)Finance and other investment income 909 7 916 8 – 924
South Africa
RetailRm
OfficeRm
Industrial Rm
AustraliaRm
Total as reported
Rm
V&A Waterfront
Rm
Other joint
ventures1
RmTotal
Rm
Statement of financial position extracts at 30 June 2015– Investment propertyOpening balance 1 July 2014 15 756 24 012 9 286 20 859 69 913 5 947 315 76 175Acquisitions – Acucap portfolio 11 324 6 789 473 – 18 586 – 569 19 155Acquisitions – other – 755 21 637 1 413 25 – 1 438Developments and capital expenditure 352 1 003 530 306 2 191 309 – 2 500Disposals (115) (430) (76) (237) (858) – (272) (1 130)Foreign exchange loss – – – (1 205) (1 205) – – (1 205)Fair value adjustments 896 772 202 1 664 3 534 480 19 4 033
Fair value of total property assets – 30 June 2015 28 213 32 901 10 436 22 024 93 574 6 761 631 100 966
– Fair value of long-term property assets 28 213 32 432 10 366 22 024 93 035 6 761 631 100 427– Investment property reclassified
as held for sale – 469 70 – 539 – – 539
1 Refer to notes 15.2 and 15.3
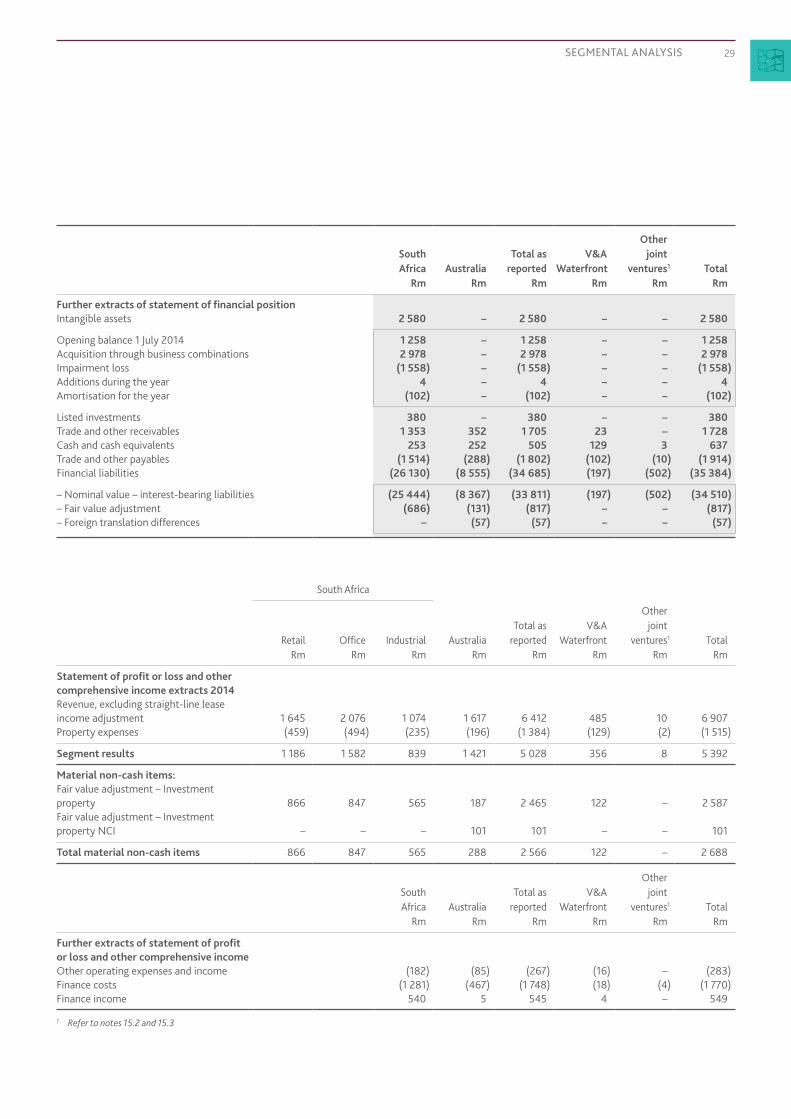
29SEGMENTAL ANALYSIS
South Africa
RmAustralia
Rm
Total as reported
Rm
V&A Waterfront
Rm
Other joint
ventures1
RmTotal
Rm
Further extracts of statement of financial positionIntangible assets 2 580 – 2 580 – – 2 580
Opening balance 1 July 2014 1 258 – 1 258 – – 1 258Acquisition through business combinations 2 978 – 2 978 – – 2 978Impairment loss (1 558) – (1 558) – – (1 558)Additions during the year 4 – 4 – – 4Amortisation for the year (102) – (102) – – (102)
Listed investments 380 – 380 – – 380 Trade and other receivables 1 353 352 1 705 23 – 1 728 Cash and cash equivalents 253 252 505 129 3 637 Trade and other payables (1 514) (288) (1 802) (102) (10) (1 914)Financial liabilities (26 130) (8 555) (34 685) (197) (502) (35 384)
– Nominal value – interest-bearing liabilities (25 444) (8 367) (33 811) (197) (502) (34 510)– Fair value adjustment (686) (131) (817) – – (817)– Foreign translation differences – (57) (57) – – (57)
South Africa
RetailRm
OfficeRm
Industrial Rm
AustraliaRm
Total as reported
Rm
V&A Waterfront
Rm
Other joint
ventures1
RmTotal
Rm
Statement of profit or loss and other comprehensive income extracts 2014Revenue, excluding straight-line lease income adjustment 1 645 2 076 1 074 1 617 6 412 485 10 6 907 Property expenses (459) (494) (235) (196) (1 384) (129) (2) (1 515)
Segment results 1 186 1 582 839 1 421 5 028 356 8 5 392
Material non-cash items:Fair value adjustment – Investment property 866 847 565 187 2 465 122 – 2 587 Fair value adjustment – Investment property NCI – – – 101 101 – – 101
Total material non-cash items 866 847 565 288 2 566 122 – 2 688
South Africa
RmAustralia
Rm
Total as reported
Rm
V&A Waterfront
Rm
Otherjoint
ventures1
RmTotal
Rm
Further extracts of statement of profit or loss and other comprehensive incomeOther operating expenses and income (182) (85) (267) (16) – (283)Finance costs (1 281) (467) (1 748) (18) (4) (1 770)Finance income 540 5 545 4 – 549
1 Refer to notes 15.2 and 15.3
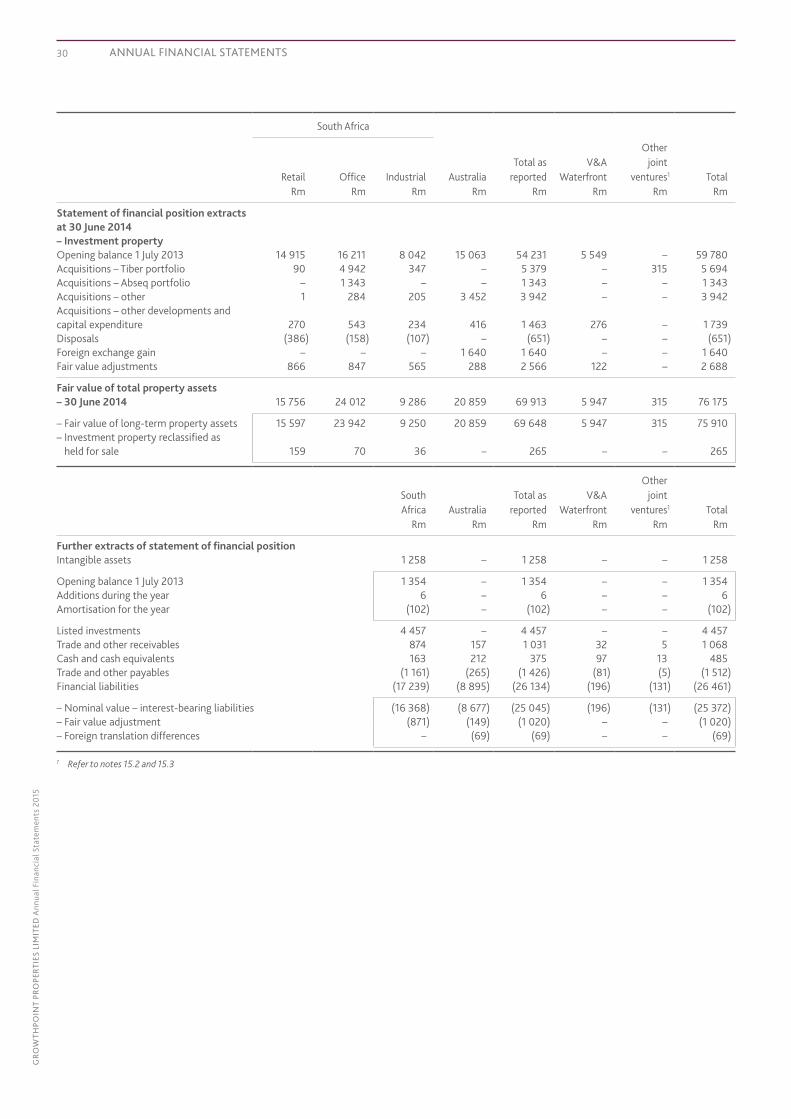
30 ANNUAL FINANCIAL STATEMENTS
GRO
WTH
POIN
T PR
OPE
RTIE
S LI
MIT
ED A
nnua
l Fin
anci
al S
tate
men
ts 2
015
South Africa
RetailRm
OfficeRm
IndustrialRm
AustraliaRm
Total as reported
Rm
V&A Waterfront
Rm
Other joint
ventures1
RmTotal
Rm
Statement of financial position extracts at 30 June 2014– Investment propertyOpening balance 1 July 2013 14 915 16 211 8 042 15 063 54 231 5 549 – 59 780Acquisitions – Tiber portfolio 90 4 942 347 – 5 379 – 315 5 694Acquisitions – Abseq portfolio – 1 343 – – 1 343 – – 1 343Acquisitions – other 1 284 205 3 452 3 942 – – 3 942Acquisitions – other developments and capital expenditure 270 543 234 416 1 463 276 – 1 739Disposals (386) (158) (107) – (651) – – (651)Foreign exchange gain – – – 1 640 1 640 – – 1 640Fair value adjustments 866 847 565 288 2 566 122 – 2 688
Fair value of total property assets – 30 June 2014 15 756 24 012 9 286 20 859 69 913 5 947 315 76 175
– Fair value of long-term property assets 15 597 23 942 9 250 20 859 69 648 5 947 315 75 910– Investment property reclassified as
held for sale 159 70 36 – 265 – – 265
South Africa
RmAustralia
Rm
Total as reported
Rm
V&A Waterfront
Rm
Other joint
ventures1
RmTotal
Rm
Further extracts of statement of financial positionIntangible assets 1 258 – 1 258 – – 1 258
Opening balance 1 July 2013 1 354 – 1 354 – – 1 354Additions during the year 6 – 6 – – 6Amortisation for the year (102) – (102) – – (102)
Listed investments 4 457 – 4 457 – – 4 457 Trade and other receivables 874 157 1 031 32 5 1 068 Cash and cash equivalents 163 212 375 97 13 485 Trade and other payables (1 161) (265) (1 426) (81) (5) (1 512)Financial liabilities (17 239) (8 895) (26 134) (196) (131) (26 461)
– Nominal value – interest-bearing liabilities (16 368) (8 677) (25 045) (196) (131) (25 372)– Fair value adjustment (871) (149) (1 020) – – (1 020)– Foreign translation differences – (69) (69) – – (69)
1 Refer to notes 15.2 and 15.3
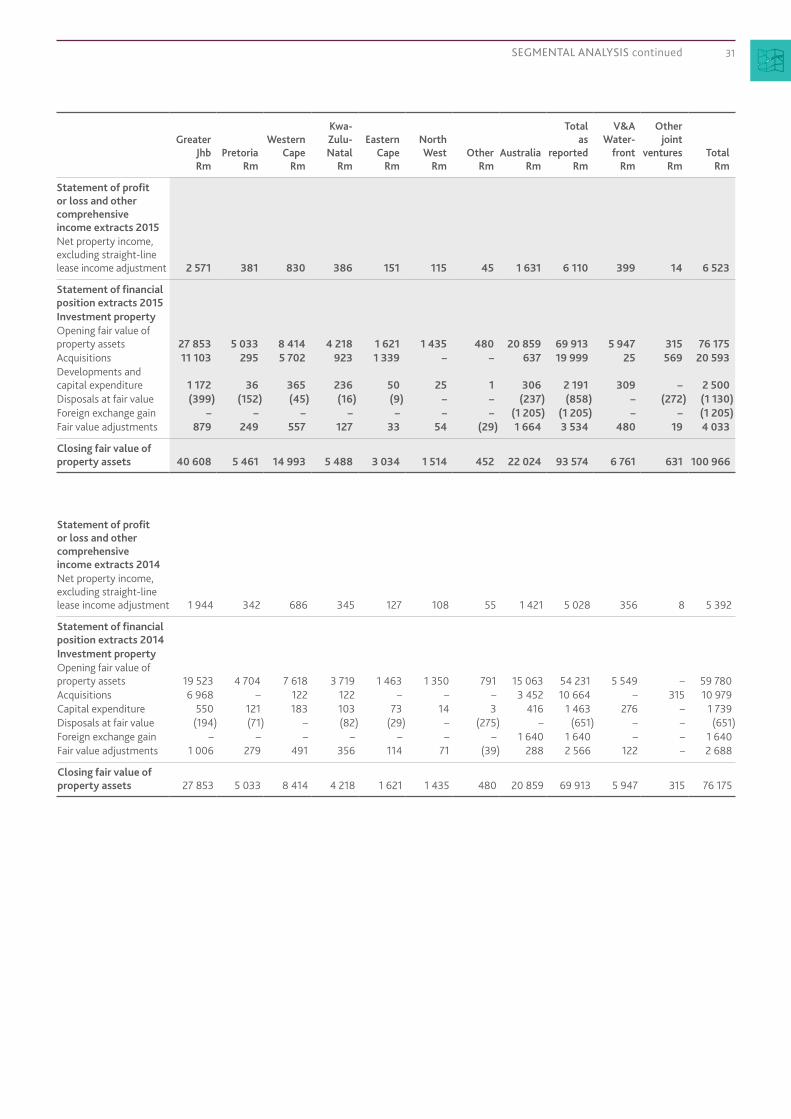
31SEGMENTAL ANALYSIS continued
Greater JhbRm
Pretoria Rm
Western Cape
Rm
Kwa-Zulu-Natal
Rm
Eastern Cape
Rm
North West
RmOther
RmAustralia
Rm
Total as
reportedRm
V&A Water-
frontRm
Other joint
venturesRm
TotalRm
Statement of profit or loss and other comprehensive income extracts 2015Net property income, excluding straight-line lease income adjustment 2 571 381 830 386 151 115 45 1 631 6 110 399 14 6 523
Statement of financial position extracts 2015Investment propertyOpening fair value of property assets 27 853 5 033 8 414 4 218 1 621 1 435 480 20 859 69 913 5 947 315 76 175 Acquisitions 11 103 295 5 702 923 1 339 – – 637 19 999 25 569 20 593 Developments and capital expenditure 1 172 36 365 236 50 25 1 306 2 191 309 – 2 500 Disposals at fair value (399) (152) (45) (16) (9) – – (237) (858) – (272) (1 130)Foreign exchange gain – – – – – – – (1 205) (1 205) – – (1 205)Fair value adjustments 879 249 557 127 33 54 (29) 1 664 3 534 480 19 4 033
Closing fair value of property assets 40 608 5 461 14 993 5 488 3 034 1 514 452 22 024 93 574 6 761 631 100 966
Statement of profit or loss and other comprehensive income extracts 2014Net property income, excluding straight-line lease income adjustment 1 944 342 686 345 127 108 55 1 421 5 028 356 8 5 392
Statement of financial position extracts 2014Investment propertyOpening fair value of property assets 19 523 4 704 7 618 3 719 1 463 1 350 791 15 063 54 231 5 549 – 59 780 Acquisitions 6 968 – 122 122 – – – 3 452 10 664 – 315 10 979 Capital expenditure 550 121 183 103 73 14 3 416 1 463 276 – 1 739 Disposals at fair value (194) (71) – (82) (29) – (275) – (651) – – (651)Foreign exchange gain – – – – – – – 1 640 1 640 – – 1 640 Fair value adjustments 1 006 279 491 356 114 71 (39) 288 2 566 122 – 2 688
Closing fair value of property assets 27 853 5 033 8 414 4 218 1 621 1 435 480 20 859 69 913 5 947 315 76 175
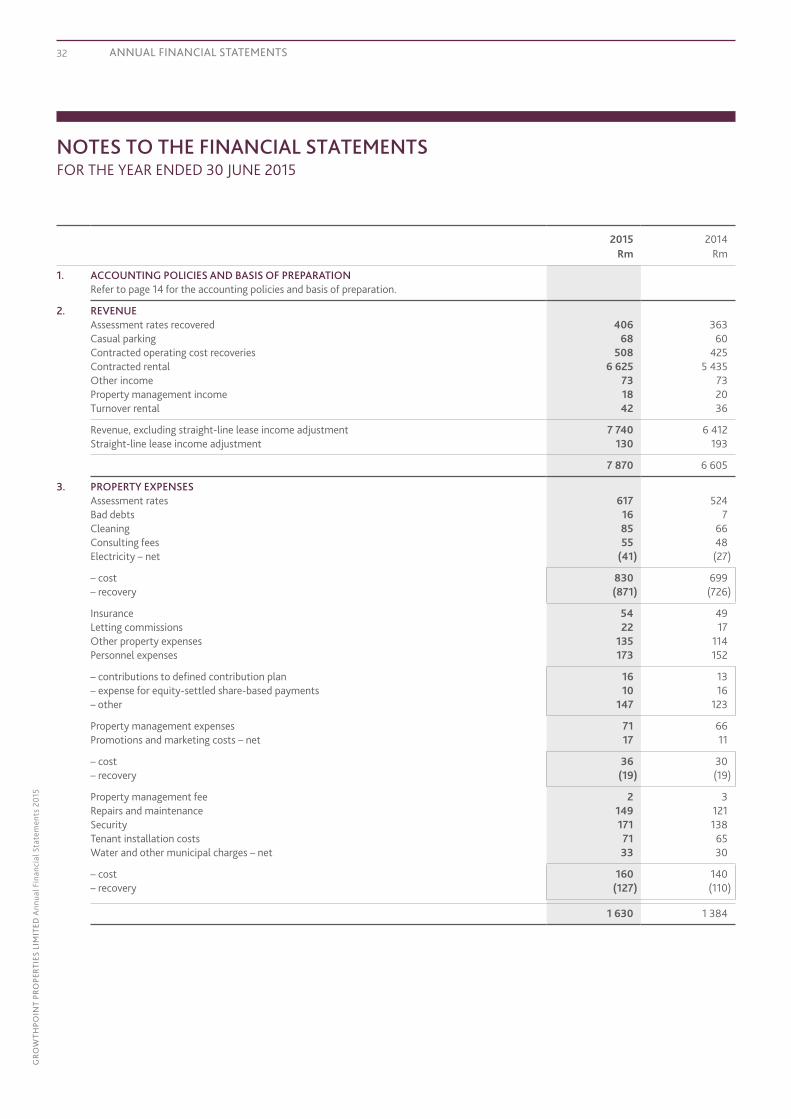
32 ANNUAL FINANCIAL STATEMENTS
GRO
WTH
POIN
T PR
OPE
RTIE
S LI
MIT
ED A
nnua
l Fin
anci
al S
tate
men
ts 2
015
NOTES TO THE FINANCIAL STATEMENTSFOR THE YEAR ENDED 30 JUNE 2015
2015Rm
2014Rm
1. ACCOUNTING POLICIES AND BASIS OF PREPARATION Refer to page 14 for the accounting policies and basis of preparation.
2. REVENUEAssessment rates recovered 406 363 Casual parking 68 60 Contracted operating cost recoveries 508 425 Contracted rental 6 625 5 435 Other income 73 73 Property management income 18 20 Turnover rental 42 36
Revenue, excluding straight-line lease income adjustment 7 740 6 412 Straight-line lease income adjustment 130 193
7 870 6 605
3. PROPERTY EXPENSESAssessment rates 617 524 Bad debts 16 7 Cleaning 85 66 Consulting fees 55 48 Electricity – net (41) (27)
– cost 830 699 – recovery (871) (726)
Insurance 54 49 Letting commissions 22 17 Other property expenses 135 114 Personnel expenses 173 152
– contributions to defined contribution plan 16 13 – expense for equity-settled share-based payments 10 16 – other 147 123
Property management expenses 71 66 Promotions and marketing costs – net 17 11
– cost 36 30 – recovery (19) (19)
Property management fee 2 3 Repairs and maintenance 149 121 Security 171 138 Tenant installation costs 71 65 Water and other municipal charges – net 33 30
– cost 160 140 – recovery (127) (110)
1 630 1 384
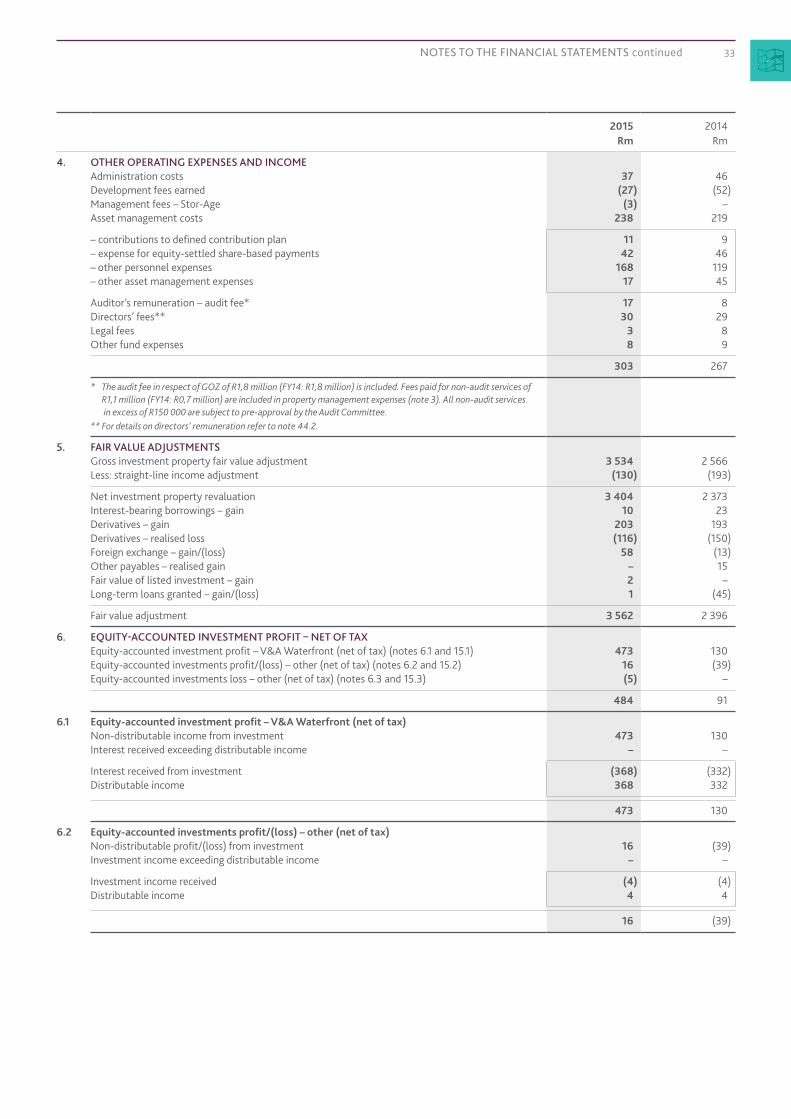
33NOTES TO THE FINANCIAL STATEMENTS continued
2015Rm
2014Rm
4. OTHER OPERATING EXPENSES AND INCOMEAdministration costs 37 46 Development fees earned (27) (52)Management fees – Stor-Age (3) – Asset management costs 238 219
– contributions to defined contribution plan 11 9 – expense for equity-settled share-based payments 42 46 – other personnel expenses 168 119 – other asset management expenses 17 45
Auditor’s remuneration – audit fee* 17 8 Directors’ fees** 30 29 Legal fees 3 8 Other fund expenses 8 9
303 267
* The audit fee in respect of GOZ of R1,8 million (FY14: R1,8 million) is included. Fees paid for non-audit services of R1,1 million (FY14: R0,7 million) are included in property management expenses (note 3). All non-audit services in excess of R150 000 are subject to pre-approval by the Audit Committee.
** For details on directors’ remuneration refer to note 44.2.
5. FAIR VALUE ADJUSTMENTSGross investment property fair value adjustment 3 534 2 566 Less: straight-line income adjustment (130) (193)
Net investment property revaluation 3 404 2 373 Interest-bearing borrowings – gain 10 23 Derivatives – gain 203 193 Derivatives – realised loss (116) (150)Foreign exchange – gain/(loss) 58 (13)Other payables – realised gain – 15 Fair value of listed investment – gain 2 –Long-term loans granted – gain/(loss) 1 (45)
Fair value adjustment 3 562 2 396
6. EQUITY-ACCOUNTED INVESTMENT PROFIT – NET OF TAXEquity-accounted investment profit – V&A Waterfront (net of tax) (notes 6.1 and 15.1) 473 130 Equity-accounted investments profit/(loss) – other (net of tax) (notes 6.2 and 15.2) 16 (39)Equity-accounted investments loss – other (net of tax) (notes 6.3 and 15.3) (5) –
484 91
6.1 Equity-accounted investment profit – V&A Waterfront (net of tax)Non-distributable income from investment 473 130 Interest received exceeding distributable income – –
Interest received from investment (368) (332)Distributable income 368 332
473 130
6.2 Equity-accounted investments profit/(loss) – other (net of tax)Non-distributable profit/(loss) from investment 16 (39)Investment income exceeding distributable income – –
Investment income received (4) (4)Distributable income 4 4
16 (39)
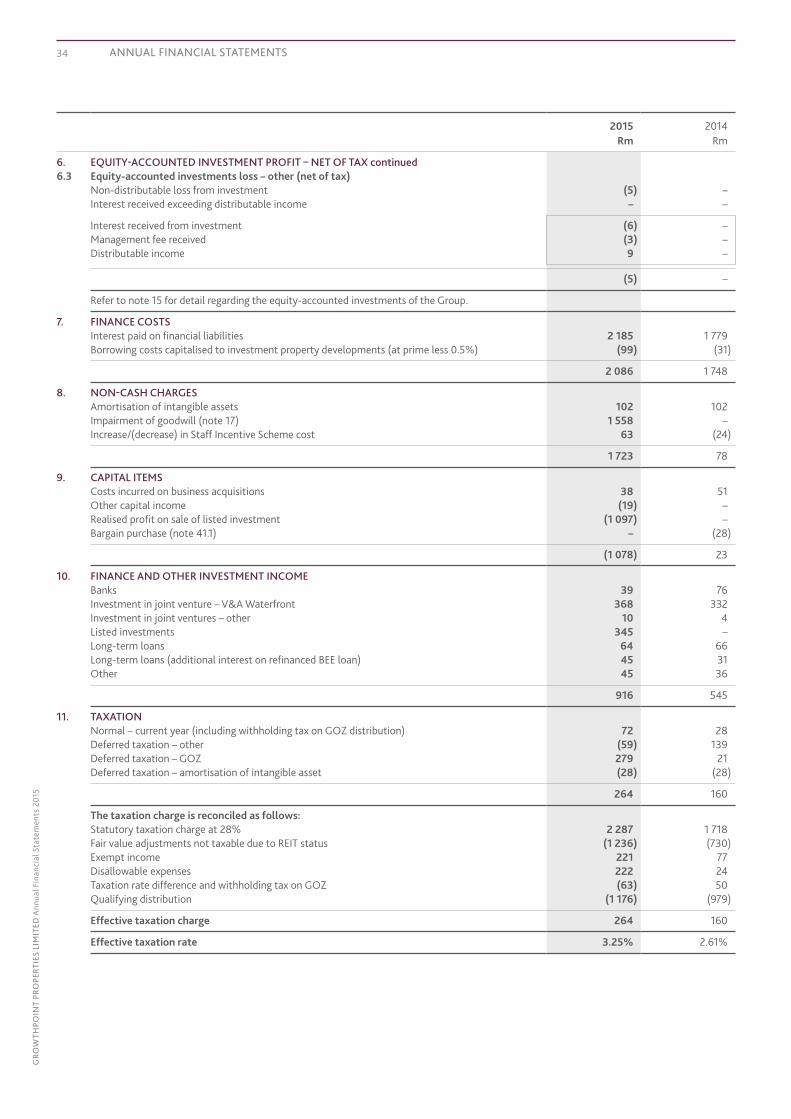
34 ANNUAL FINANCIAL STATEMENTS
GRO
WTH
POIN
T PR
OPE
RTIE
S LI
MIT
ED A
nnua
l Fin
anci
al S
tate
men
ts 2
015
2015Rm
2014Rm
6. EQUITY-ACCOUNTED INVESTMENT PROFIT – NET OF TAX continued6.3 Equity-accounted investments loss – other (net of tax)
Non-distributable loss from investment (5) – Interest received exceeding distributable income – –
Interest received from investment (6) – Management fee received (3) – Distributable income 9 –
(5) –
Refer to note 15 for detail regarding the equity-accounted investments of the Group.
7. FINANCE COSTSInterest paid on financial liabilities 2 185 1 779 Borrowing costs capitalised to investment property developments (at prime less 0.5%) (99) (31)
2 086 1 748
8. NON-CASH CHARGESAmortisation of intangible assets 102 102 Impairment of goodwill (note 17) 1 558 – Increase/(decrease) in Staff Incentive Scheme cost 63 (24)
1 723 78
9. CAPITAL ITEMSCosts incurred on business acquisitions 38 51 Other capital income (19) – Realised profit on sale of listed investment (1 097) – Bargain purchase (note 41.1) – (28)
(1 078) 23
10. FINANCE AND OTHER INVESTMENT INCOMEBanks 39 76 Investment in joint venture – V&A Waterfront 368 332 Investment in joint ventures – other 10 4 Listed investments 345 – Long-term loans 64 66 Long-term loans (additional interest on refinanced BEE loan) 45 31 Other 45 36
916 545
11. TAXATIONNormal – current year (including withholding tax on GOZ distribution) 72 28 Deferred taxation – other (59) 139 Deferred taxation – GOZ 279 21 Deferred taxation – amortisation of intangible asset (28) (28)
264 160
The taxation charge is reconciled as follows:Statutory taxation charge at 28% 2 287 1 718 Fair value adjustments not taxable due to REIT status (1 236) (730)Exempt income 221 77 Disallowable expenses 222 24 Taxation rate difference and withholding tax on GOZ (63) 50 Qualifying distribution (1 176) (979)
Effective taxation charge 264 160
Effective taxation rate 3.25% 2.61%
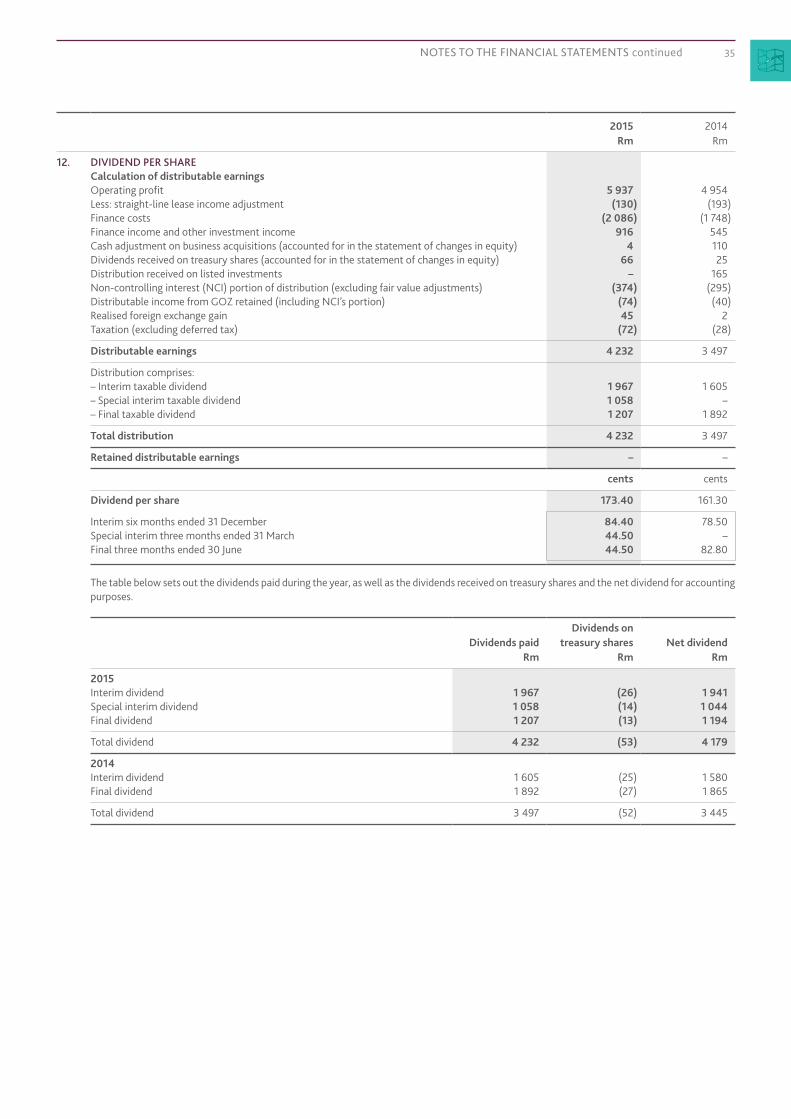
35NOTES TO THE FINANCIAL STATEMENTS continued
2015Rm
2014Rm
12. DIVIDEND PER SHARECalculation of distributable earningsOperating profit 5 937 4 954 Less: straight-line lease income adjustment (130) (193)Finance costs (2 086) (1 748)Finance income and other investment income 916 545 Cash adjustment on business acquisitions (accounted for in the statement of changes in equity) 4 110 Dividends received on treasury shares (accounted for in the statement of changes in equity) 66 25 Distribution received on listed investments – 165 Non-controlling interest (NCI) portion of distribution (excluding fair value adjustments) (374) (295)Distributable income from GOZ retained (including NCI’s portion) (74) (40)Realised foreign exchange gain 45 2 Taxation (excluding deferred tax) (72) (28)
Distributable earnings 4 232 3 497
Distribution comprises:– Interim taxable dividend 1 967 1 605 – Special interim taxable dividend 1 058 – – Final taxable dividend 1 207 1 892
Total distribution 4 232 3 497
Retained distributable earnings – –
cents cents
Dividend per share 173.40 161.30
Interim six months ended 31 December 84.40 78.50 Special interim three months ended 31 March 44.50 – Final three months ended 30 June 44.50 82.80
The table below sets out the dividends paid during the year, as well as the dividends received on treasury shares and the net dividend for accounting purposes.
Dividends paidRm
Dividends on treasury shares
RmNet dividend
Rm
2015Interim dividend 1 967 (26) 1 941Special interim dividend 1 058 (14) 1 044Final dividend 1 207 (13) 1 194
Total dividend 4 232 (53) 4 179
2014Interim dividend 1 605 (25) 1 580Final dividend 1 892 (27) 1 865
Total dividend 3 497 (52) 3 445
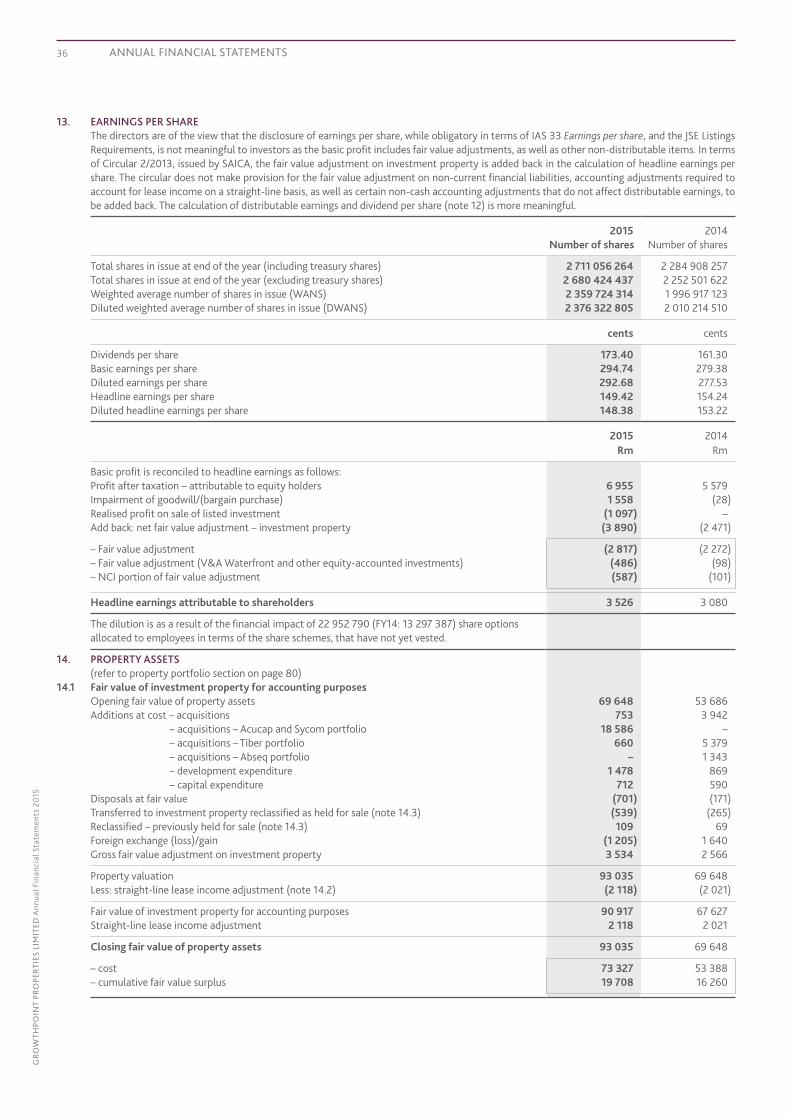
36 ANNUAL FINANCIAL STATEMENTS
GRO
WTH
POIN
T PR
OPE
RTIE
S LI
MIT
ED A
nnua
l Fin
anci
al S
tate
men
ts 2
015
13. EARNINGS PER SHAREThe directors are of the view that the disclosure of earnings per share, while obligatory in terms of IAS 33 Earnings per share, and the JSE Listings Requirements, is not meaningful to investors as the basic profit includes fair value adjustments, as well as other non-distributable items. In terms of Circular 2/2013, issued by SAICA, the fair value adjustment on investment property is added back in the calculation of headline earnings per share. The circular does not make provision for the fair value adjustment on non-current financial liabilities, accounting adjustments required to account for lease income on a straight-line basis, as well as certain non-cash accounting adjustments that do not affect distributable earnings, to be added back. The calculation of distributable earnings and dividend per share (note 12) is more meaningful.
2015 2014 Number of shares Number of shares
Total shares in issue at end of the year (including treasury shares) 2 711 056 264 2 284 908 257 Total shares in issue at end of the year (excluding treasury shares) 2 680 424 437 2 252 501 622 Weighted average number of shares in issue (WANS) 2 359 724 314 1 996 917 123 Diluted weighted average number of shares in issue (DWANS) 2 376 322 805 2 010 214 510
cents cents
Dividends per share 173.40 161.30 Basic earnings per share 294.74 279.38 Diluted earnings per share 292.68 277.53 Headline earnings per share 149.42 154.24 Diluted headline earnings per share 148.38 153.22
2015 Rm
2014 Rm
Basic profit is reconciled to headline earnings as follows:Profit after taxation – attributable to equity holders 6 955 5 579 Impairment of goodwill/(bargain purchase) 1 558 (28)Realised profit on sale of listed investment (1 097) –Add back: net fair value adjustment – investment property (3 890) (2 471)
– Fair value adjustment (2 817) (2 272)– Fair value adjustment (V&A Waterfront and other equity-accounted investments) (486) (98)– NCI portion of fair value adjustment (587) (101)
Headline earnings attributable to shareholders 3 526 3 080
The dilution is as a result of the financial impact of 22 952 790 (FY14: 13 297 387) share options allocated to employees in terms of the share schemes, that have not yet vested.
14. PROPERTY ASSETS(refer to property portfolio section on page 80)
14.1 Fair value of investment property for accounting purposesOpening fair value of property assets 69 648 53 686 Additions at cost – acquisitions 753 3 942 – acquisitions – Acucap and Sycom portfolio 18 586 – – acquisitions – Tiber portfolio 660 5 379 – acquisitions – Abseq portfolio – 1 343 – development expenditure 1 478 869 – capital expenditure 712 590 Disposals at fair value (701) (171)Transferred to investment property reclassified as held for sale (note 14.3) (539) (265)Reclassified – previously held for sale (note 14.3) 109 69 Foreign exchange (loss)/gain (1 205) 1 640 Gross fair value adjustment on investment property 3 534 2 566
Property valuation 93 035 69 648 Less: straight-line lease income adjustment (note 14.2) (2 118) (2 021)
Fair value of investment property for accounting purposes 90 917 67 627 Straight-line lease income adjustment 2 118 2 021
Closing fair value of property assets 93 035 69 648
– cost 73 327 53 388 – cumulative fair value surplus 19 708 16 260
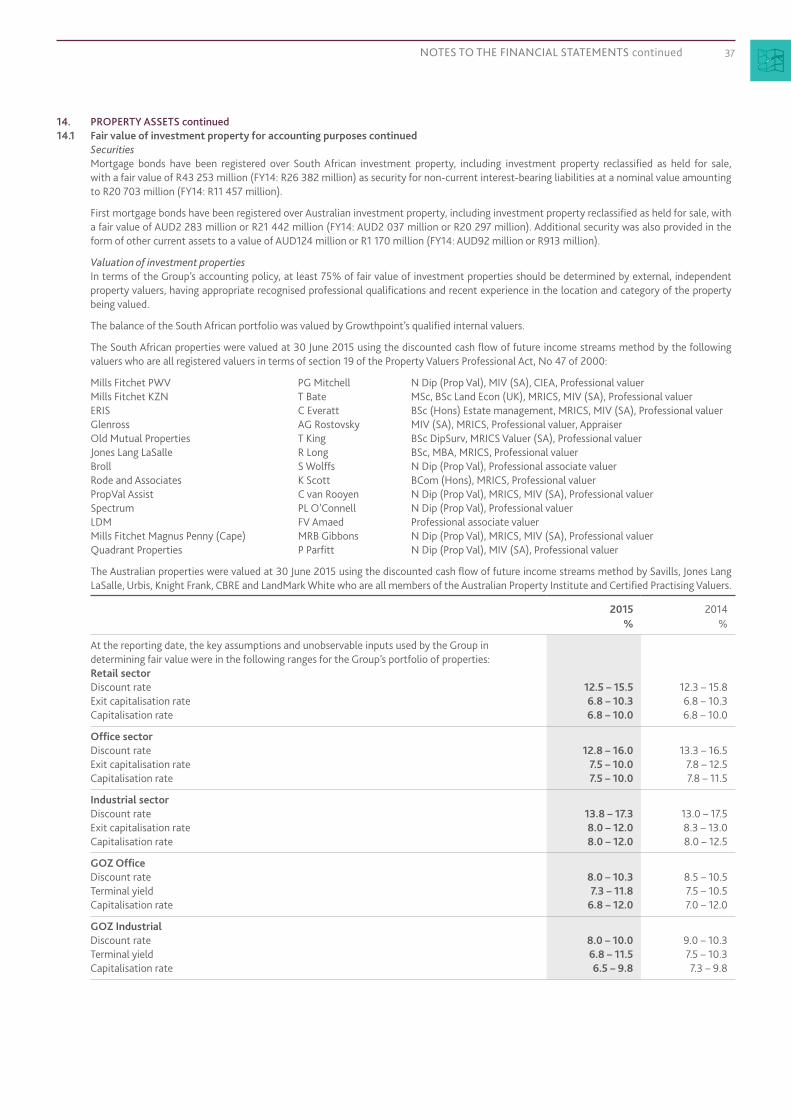
37NOTES TO THE FINANCIAL STATEMENTS continued
14. PROPERTY ASSETS continued14.1 Fair value of investment property for accounting purposes continued
SecuritiesMortgage bonds have been registered over South African investment property, including investment property reclassified as held for sale, with a fair value of R43 253 million (FY14: R26 382 million) as security for non-current interest-bearing liabilities at a nominal value amounting to R20 703 million (FY14: R11 457 million).
First mortgage bonds have been registered over Australian investment property, including investment property reclassified as held for sale, with a fair value of AUD2 283 million or R21 442 million (FY14: AUD2 037 million or R20 297 million). Additional security was also provided in the form of other current assets to a value of AUD124 million or R1 170 million (FY14: AUD92 million or R913 million).
Valuation of investment propertiesIn terms of the Group’s accounting policy, at least 75% of fair value of investment properties should be determined by external, independent property valuers, having appropriate recognised professional qualifications and recent experience in the location and category of the property being valued.
The balance of the South African portfolio was valued by Growthpoint’s qualified internal valuers.
The South African properties were valued at 30 June 2015 using the discounted cash flow of future income streams method by the following valuers who are all registered valuers in terms of section 19 of the Property Valuers Professional Act, No 47 of 2000:
Mills Fitchet PWV PG Mitchell N Dip (Prop Val), MIV (SA), CIEA, Professional valuerMills Fitchet KZN T Bate MSc, BSc Land Econ (UK), MRICS, MIV (SA), Professional valuerERIS C Everatt BSc (Hons) Estate management, MRICS, MIV (SA), Professional valuerGlenross AG Rostovsky MIV (SA), MRICS, Professional valuer, AppraiserOld Mutual Properties T King BSc DipSurv, MRICS Valuer (SA), Professional valuerJones Lang LaSalle R Long BSc, MBA, MRICS, Professional valuerBroll S Wolffs N Dip (Prop Val), Professional associate valuerRode and Associates K Scott BCom (Hons), MRICS, Professional valuerPropVal Assist C van Rooyen N Dip (Prop Val), MRICS, MIV (SA), Professional valuerSpectrum PL O’Connell N Dip (Prop Val), Professional valuerLDM FV Amaed Professional associate valuerMills Fitchet Magnus Penny (Cape) MRB Gibbons N Dip (Prop Val), MRICS, MIV (SA), Professional valuerQuadrant Properties P Parfitt N Dip (Prop Val), MIV (SA), Professional valuer
The Australian properties were valued at 30 June 2015 using the discounted cash flow of future income streams method by Savills, Jones Lang LaSalle, Urbis, Knight Frank, CBRE and LandMark White who are all members of the Australian Property Institute and Certified Practising Valuers.
2015%
2014%
At the reporting date, the key assumptions and unobservable inputs used by the Group in determining fair value were in the following ranges for the Group’s portfolio of properties: Retail sectorDiscount rate 12.5 – 15.5 12.3 – 15.8Exit capitalisation rate 6.8 – 10.3 6.8 – 10.3Capitalisation rate 6.8 – 10.0 6.8 – 10.0
Office sectorDiscount rate 12.8 – 16.0 13.3 – 16.5Exit capitalisation rate 7.5 – 10.0 7.8 – 12.5Capitalisation rate 7.5 – 10.0 7.8 – 11.5
Industrial sectorDiscount rate 13.8 – 17.3 13.0 – 17.5Exit capitalisation rate 8.0 – 12.0 8.3 – 13.0Capitalisation rate 8.0 – 12.0 8.0 – 12.5
GOZ OfficeDiscount rate 8.0 – 10.3 8.5 – 10.5Terminal yield 7.3 – 11.8 7.5 – 10.5Capitalisation rate 6.8 – 12.0 7.0 – 12.0
GOZ IndustrialDiscount rate 8.0 – 10.0 9.0 – 10.3Terminal yield 6.8 – 11.5 7.5 – 10.3Capitalisation rate 6.5 – 9.8 7.3 – 9.8
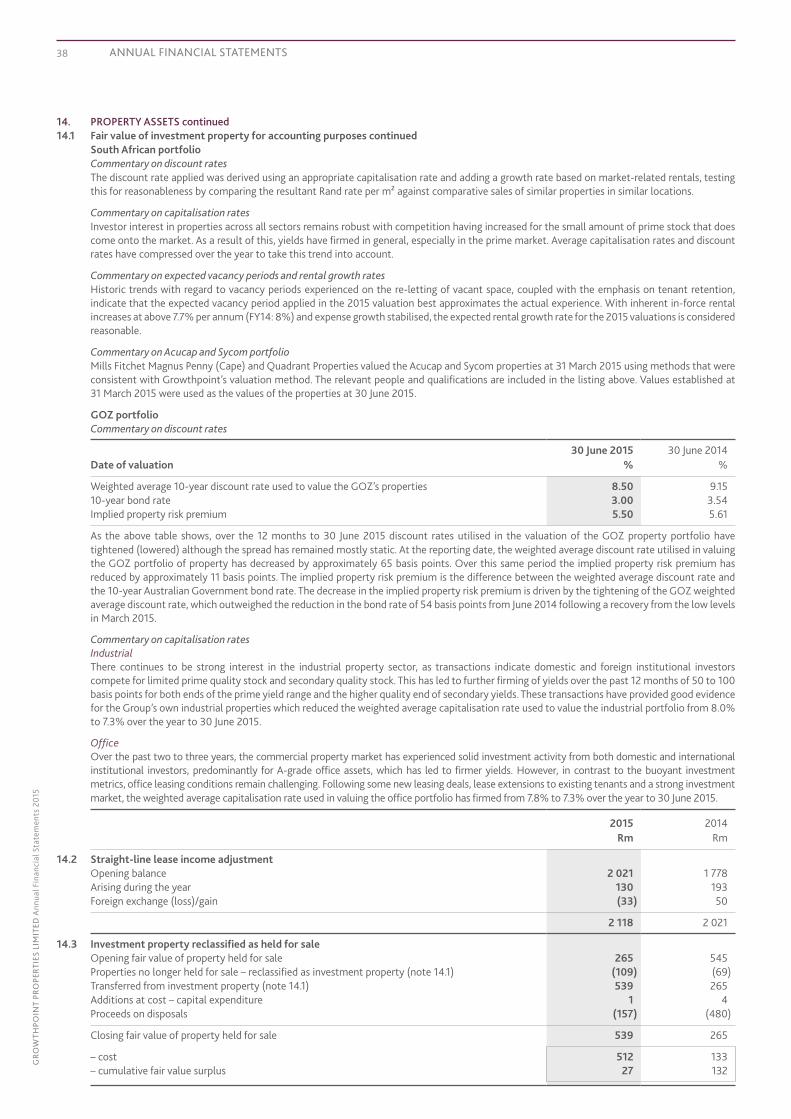
38 ANNUAL FINANCIAL STATEMENTS
GRO
WTH
POIN
T PR
OPE
RTIE
S LI
MIT
ED A
nnua
l Fin
anci
al S
tate
men
ts 2
015
14. PROPERTY ASSETS continued14.1 Fair value of investment property for accounting purposes continued
South African portfolioCommentary on discount ratesThe discount rate applied was derived using an appropriate capitalisation rate and adding a growth rate based on market-related rentals, testing this for reasonableness by comparing the resultant Rand rate per m² against comparative sales of similar properties in similar locations.
Commentary on capitalisation ratesInvestor interest in properties across all sectors remains robust with competition having increased for the small amount of prime stock that does come onto the market. As a result of this, yields have firmed in general, especially in the prime market. Average capitalisation rates and discount rates have compressed over the year to take this trend into account.
Commentary on expected vacancy periods and rental growth ratesHistoric trends with regard to vacancy periods experienced on the re-letting of vacant space, coupled with the emphasis on tenant retention, indicate that the expected vacancy period applied in the 2015 valuation best approximates the actual experience. With inherent in-force rental increases at above 7.7% per annum (FY14: 8%) and expense growth stabilised, the expected rental growth rate for the 2015 valuations is considered reasonable.
Commentary on Acucap and Sycom portfolioMills Fitchet Magnus Penny (Cape) and Quadrant Properties valued the Acucap and Sycom properties at 31 March 2015 using methods that were consistent with Growthpoint’s valuation method. The relevant people and qualifications are included in the listing above. Values established at 31 March 2015 were used as the values of the properties at 30 June 2015.
GOZ portfolioCommentary on discount rates
Date of valuation30 June 2015
%30 June 2014
%
Weighted average 10-year discount rate used to value the GOZ’s properties 8.50 9.1510-year bond rate 3.00 3.54Implied property risk premium 5.50 5.61
As the above table shows, over the 12 months to 30 June 2015 discount rates utilised in the valuation of the GOZ property portfolio have tightened (lowered) although the spread has remained mostly static. At the reporting date, the weighted average discount rate utilised in valuing the GOZ portfolio of property has decreased by approximately 65 basis points. Over this same period the implied property risk premium has reduced by approximately 11 basis points. The implied property risk premium is the difference between the weighted average discount rate and the 10-year Australian Government bond rate. The decrease in the implied property risk premium is driven by the tightening of the GOZ weighted average discount rate, which outweighed the reduction in the bond rate of 54 basis points from June 2014 following a recovery from the low levels in March 2015.
Commentary on capitalisation ratesIndustrialThere continues to be strong interest in the industrial property sector, as transactions indicate domestic and foreign institutional investors compete for limited prime quality stock and secondary quality stock. This has led to further firming of yields over the past 12 months of 50 to 100 basis points for both ends of the prime yield range and the higher quality end of secondary yields. These transactions have provided good evidence for the Group’s own industrial properties which reduced the weighted average capitalisation rate used to value the industrial portfolio from 8.0% to 7.3% over the year to 30 June 2015.
OfficeOver the past two to three years, the commercial property market has experienced solid investment activity from both domestic and international institutional investors, predominantly for A-grade office assets, which has led to firmer yields. However, in contrast to the buoyant investment metrics, office leasing conditions remain challenging. Following some new leasing deals, lease extensions to existing tenants and a strong investment market, the weighted average capitalisation rate used in valuing the office portfolio has firmed from 7.8% to 7.3% over the year to 30 June 2015.
2015 Rm
2014Rm
14.2 Straight-line lease income adjustmentOpening balance 2 021 1 778Arising during the year 130 193Foreign exchange (loss)/gain (33) 50
2 118 2 021
14.3 Investment property reclassified as held for saleOpening fair value of property held for sale 265 545 Properties no longer held for sale – reclassified as investment property (note 14.1) (109) (69)Transferred from investment property (note 14.1) 539 265 Additions at cost – capital expenditure 1 4 Proceeds on disposals (157) (480)
Closing fair value of property held for sale 539 265
– cost 512 133 – cumulative fair value surplus 27 132
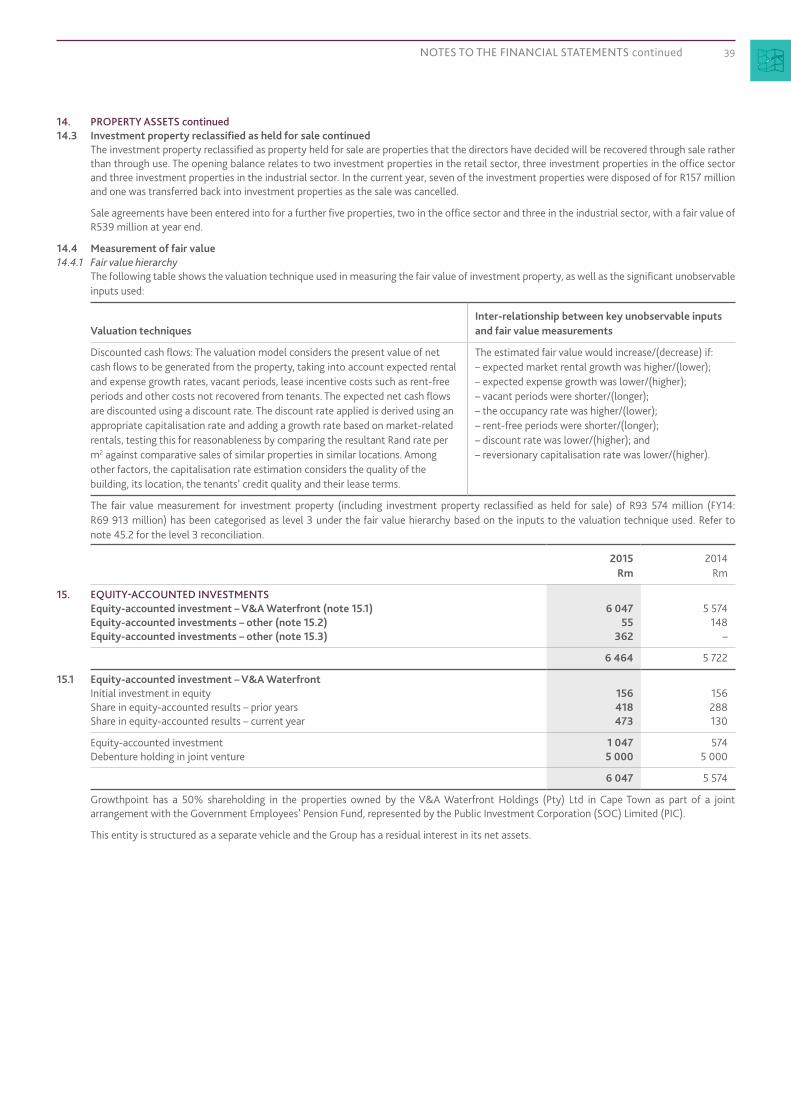
39NOTES TO THE FINANCIAL STATEMENTS continued
14. PROPERTY ASSETS continued14.3 Investment property reclassified as held for sale continued
The investment property reclassified as property held for sale are properties that the directors have decided will be recovered through sale rather than through use. The opening balance relates to two investment properties in the retail sector, three investment properties in the office sector and three investment properties in the industrial sector. In the current year, seven of the investment properties were disposed of for R157 million and one was transferred back into investment properties as the sale was cancelled.
Sale agreements have been entered into for a further five properties, two in the office sector and three in the industrial sector, with a fair value of R539 million at year end.
14.4 Measurement of fair value14.4.1 Fair value hierarchy
The following table shows the valuation technique used in measuring the fair value of investment property, as well as the significant unobservable inputs used:
Valuation techniquesInter-relationship between key unobservable inputs and fair value measurements
Discounted cash flows: The valuation model considers the present value of net cash flows to be generated from the property, taking into account expected rental and expense growth rates, vacant periods, lease incentive costs such as rent-free periods and other costs not recovered from tenants. The expected net cash flows are discounted using a discount rate. The discount rate applied is derived using an appropriate capitalisation rate and adding a growth rate based on market-related rentals, testing this for reasonableness by comparing the resultant Rand rate per m2 against comparative sales of similar properties in similar locations. Among other factors, the capitalisation rate estimation considers the quality of the building, its location, the tenants’ credit quality and their lease terms.
The estimated fair value would increase/(decrease) if:– expected market rental growth was higher/(lower);– expected expense growth was lower/(higher);– vacant periods were shorter/(longer);– the occupancy rate was higher/(lower);– rent-free periods were shorter/(longer);– discount rate was lower/(higher); and– reversionary capitalisation rate was lower/(higher).
The fair value measurement for investment property (including investment property reclassified as held for sale) of R93 574 million (FY14: R69 913 million) has been categorised as level 3 under the fair value hierarchy based on the inputs to the valuation technique used. Refer to note 45.2 for the level 3 reconciliation.
2015Rm
2014Rm
15. EQUITY-ACCOUNTED INVESTMENTSEquity-accounted investment – V&A Waterfront (note 15.1) 6 047 5 574Equity-accounted investments – other (note 15.2) 55 148Equity-accounted investments – other (note 15.3) 362 –
6 464 5 722
15.1 Equity-accounted investment – V&A WaterfrontInitial investment in equity 156 156 Share in equity-accounted results – prior years 418 288 Share in equity-accounted results – current year 473 130
Equity-accounted investment 1 047 574 Debenture holding in joint venture 5 000 5 000
6 047 5 574
Growthpoint has a 50% shareholding in the properties owned by the V&A Waterfront Holdings (Pty) Ltd in Cape Town as part of a joint arrangement with the Government Employees’ Pension Fund, represented by the Public Investment Corporation (SOC) Limited (PIC).
This entity is structured as a separate vehicle and the Group has a residual interest in its net assets.
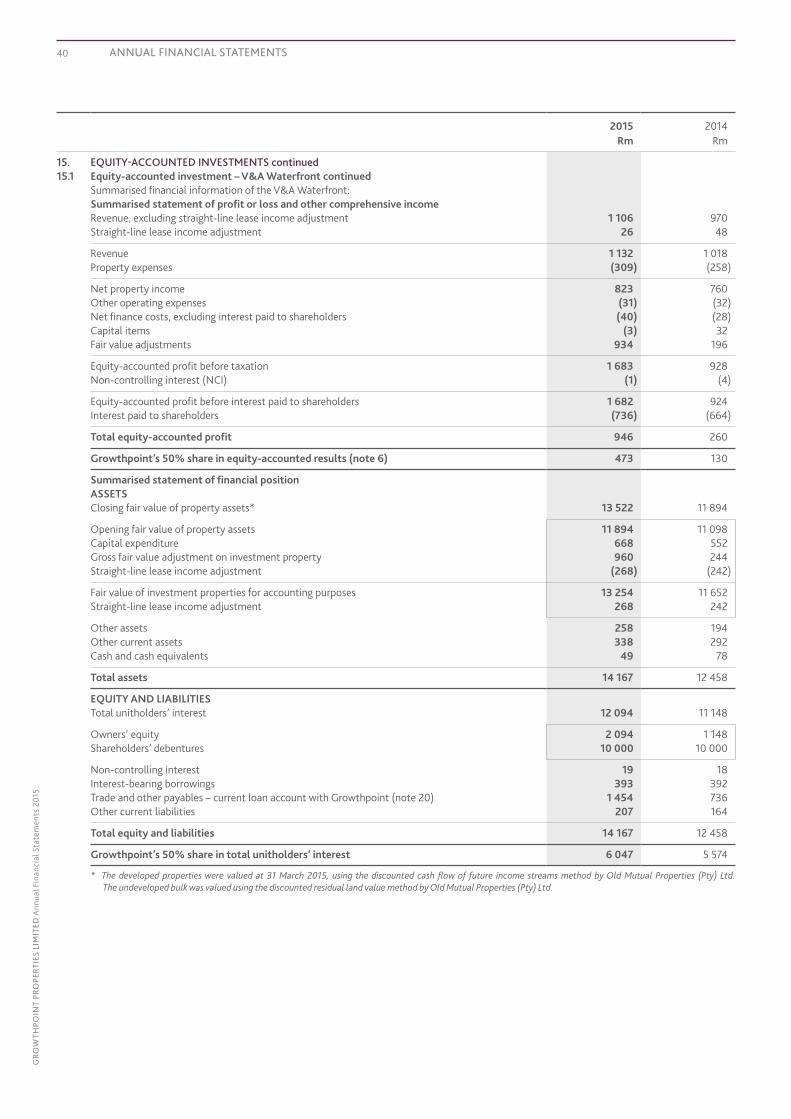
40 ANNUAL FINANCIAL STATEMENTS
GRO
WTH
POIN
T PR
OPE
RTIE
S LI
MIT
ED A
nnua
l Fin
anci
al S
tate
men
ts 2
015
2015Rm
2014Rm
15. EQUITY-ACCOUNTED INVESTMENTS continued15.1 Equity-accounted investment – V&A Waterfront continued
Summarised financial information of the V&A Waterfront:Summarised statement of profit or loss and other comprehensive incomeRevenue, excluding straight-line lease income adjustment 1 106 970 Straight-line lease income adjustment 26 48
Revenue 1 132 1 018 Property expenses (309) (258)
Net property income 823 760 Other operating expenses (31) (32)Net finance costs, excluding interest paid to shareholders (40) (28)Capital items (3) 32 Fair value adjustments 934 196
Equity-accounted profit before taxation 1 683 928 Non-controlling interest (NCI) (1) (4)
Equity-accounted profit before interest paid to shareholders 1 682 924 Interest paid to shareholders (736) (664)
Total equity-accounted profit 946 260
Growthpoint’s 50% share in equity-accounted results (note 6) 473 130
Summarised statement of financial positionASSETSClosing fair value of property assets* 13 522 11 894
Opening fair value of property assets 11 894 11 098 Capital expenditure 668 552 Gross fair value adjustment on investment property 960 244 Straight-line lease income adjustment (268) (242)
Fair value of investment properties for accounting purposes 13 254 11 652 Straight-line lease income adjustment 268 242
Other assets 258 194Other current assets 338 292Cash and cash equivalents 49 78
Total assets 14 167 12 458
EQUITY AND LIABILITIESTotal unitholders’ interest 12 094 11 148
Owners’ equity 2 094 1 148 Shareholders’ debentures 10 000 10 000
Non-controlling interest 19 18 Interest-bearing borrowings 393 392 Trade and other payables – current loan account with Growthpoint (note 20) 1 454 736 Other current liabilities 207 164
Total equity and liabilities 14 167 12 458
Growthpoint’s 50% share in total unitholders’ interest 6 047 5 574
* The developed properties were valued at 31 March 2015, using the discounted cash flow of future income streams method by Old Mutual Properties (Pty) Ltd. The undeveloped bulk was valued using the discounted residual land value method by Old Mutual Properties (Pty) Ltd.
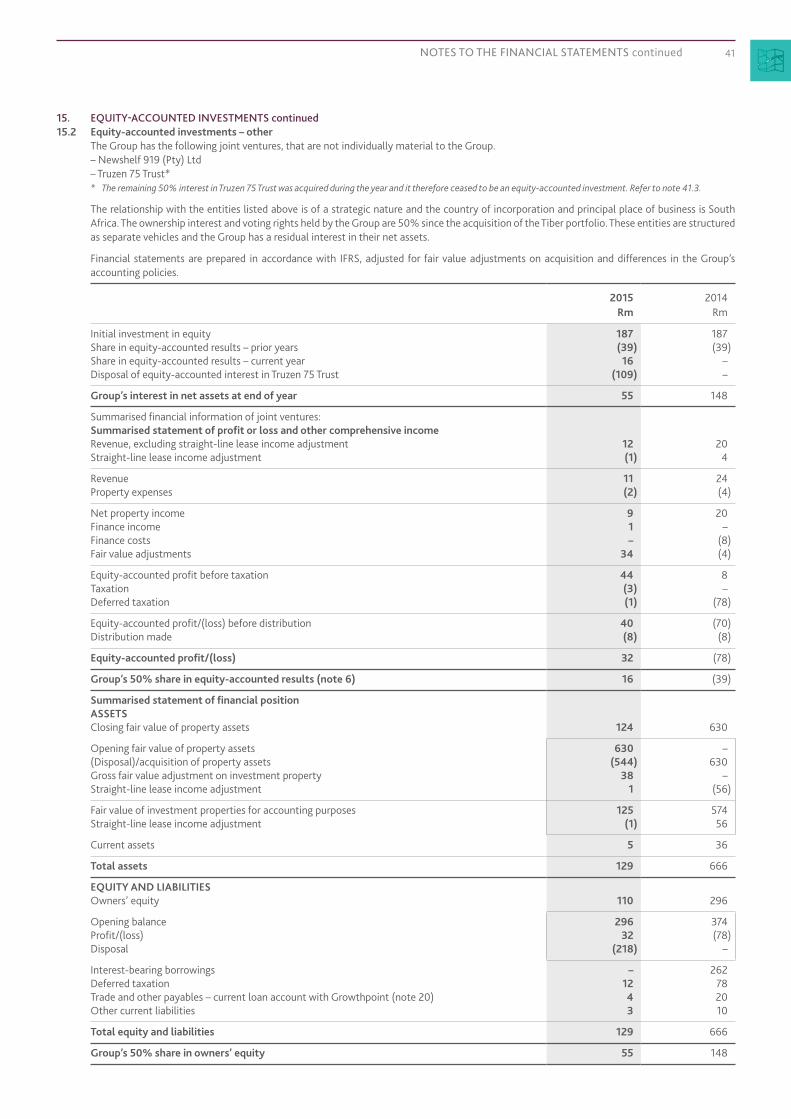
41NOTES TO THE FINANCIAL STATEMENTS continued
15. EQUITY-ACCOUNTED INVESTMENTS continued15.2 Equity-accounted investments – other
The Group has the following joint ventures, that are not individually material to the Group.– Newshelf 919 (Pty) Ltd– Truzen 75 Trust** The remaining 50% interest in Truzen 75 Trust was acquired during the year and it therefore ceased to be an equity-accounted investment. Refer to note 41.3.
The relationship with the entities listed above is of a strategic nature and the country of incorporation and principal place of business is South Africa. The ownership interest and voting rights held by the Group are 50% since the acquisition of the Tiber portfolio. These entities are structured as separate vehicles and the Group has a residual interest in their net assets.
Financial statements are prepared in accordance with IFRS, adjusted for fair value adjustments on acquisition and differences in the Group’s accounting policies.
2015 Rm
2014 Rm
Initial investment in equity 187 187 Share in equity-accounted results – prior years (39) (39)Share in equity-accounted results – current year 16 – Disposal of equity-accounted interest in Truzen 75 Trust (109) –
Group’s interest in net assets at end of year 55 148
Summarised financial information of joint ventures:Summarised statement of profit or loss and other comprehensive incomeRevenue, excluding straight-line lease income adjustment 12 20Straight-line lease income adjustment (1) 4
Revenue 11 24Property expenses (2) (4)
Net property income 9 20Finance income 1 –Finance costs – (8)Fair value adjustments 34 (4)
Equity-accounted profit before taxation 44 8 Taxation (3) – Deferred taxation (1) (78)
Equity-accounted profit/(loss) before distribution 40 (70)Distribution made (8) (8)
Equity-accounted profit/(loss) 32 (78)
Group’s 50% share in equity-accounted results (note 6) 16 (39)
Summarised statement of financial positionASSETSClosing fair value of property assets 124 630
Opening fair value of property assets 630 – (Disposal)/acquisition of property assets (544) 630 Gross fair value adjustment on investment property 38 – Straight-line lease income adjustment 1 (56)
Fair value of investment properties for accounting purposes 125 574 Straight-line lease income adjustment (1) 56
Current assets 5 36
Total assets 129 666
EQUITY AND LIABILITIESOwners’ equity 110 296
Opening balance 296 374 Profit/(loss) 32 (78)Disposal (218) –
Interest-bearing borrowings – 262 Deferred taxation 12 78 Trade and other payables – current loan account with Growthpoint (note 20) 4 20 Other current liabilities 3 10
Total equity and liabilities 129 666
Group’s 50% share in owners’ equity 55 148
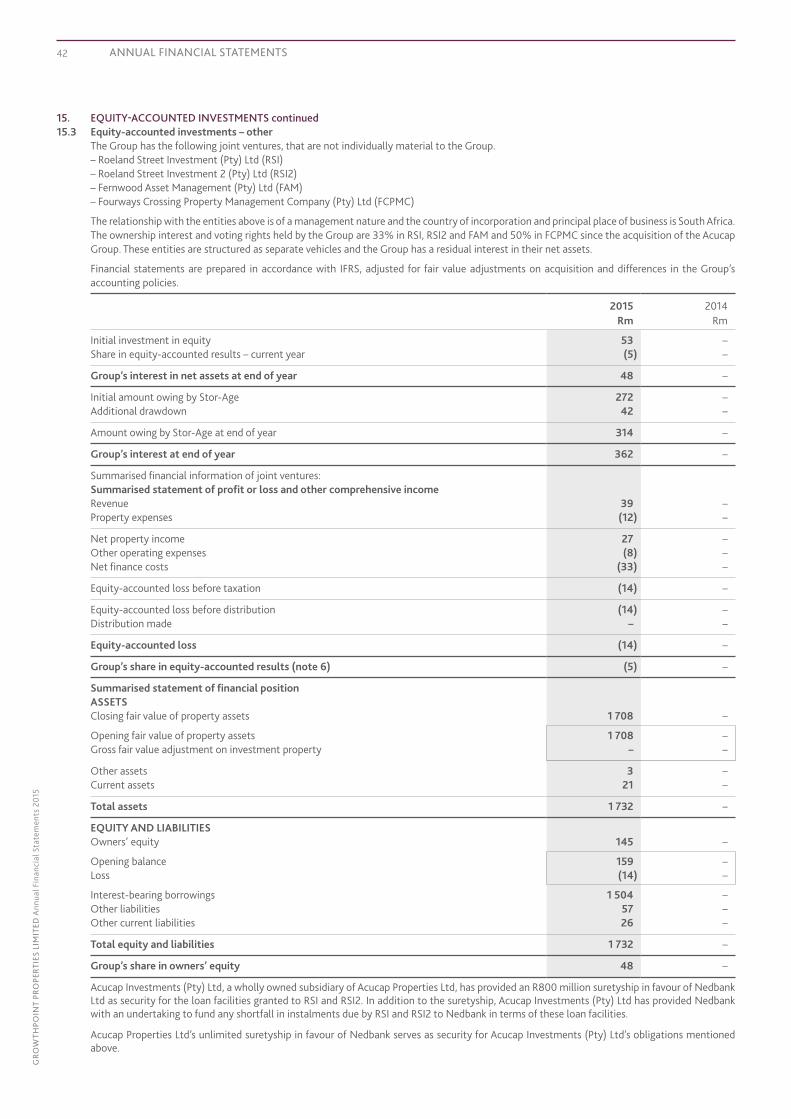
42 ANNUAL FINANCIAL STATEMENTS
GRO
WTH
POIN
T PR
OPE
RTIE
S LI
MIT
ED A
nnua
l Fin
anci
al S
tate
men
ts 2
015
15. EQUITY-ACCOUNTED INVESTMENTS continued15.3 Equity-accounted investments – other
The Group has the following joint ventures, that are not individually material to the Group.– Roeland Street Investment (Pty) Ltd (RSI) – Roeland Street Investment 2 (Pty) Ltd (RSI2)– Fernwood Asset Management (Pty) Ltd (FAM)– Fourways Crossing Property Management Company (Pty) Ltd (FCPMC)
The relationship with the entities above is of a management nature and the country of incorporation and principal place of business is South Africa. The ownership interest and voting rights held by the Group are 33% in RSI, RSI2 and FAM and 50% in FCPMC since the acquisition of the Acucap Group. These entities are structured as separate vehicles and the Group has a residual interest in their net assets.
Financial statements are prepared in accordance with IFRS, adjusted for fair value adjustments on acquisition and differences in the Group’s accounting policies.
2015 Rm
2014 Rm
Initial investment in equity 53 – Share in equity-accounted results – current year (5) –
Group’s interest in net assets at end of year 48 –
Initial amount owing by Stor-Age 272 – Additional drawdown 42 –
Amount owing by Stor-Age at end of year 314 –
Group’s interest at end of year 362 –
Summarised financial information of joint ventures:Summarised statement of profit or loss and other comprehensive incomeRevenue 39 – Property expenses (12) –
Net property income 27 – Other operating expenses (8) – Net finance costs (33) –
Equity-accounted loss before taxation (14) –
Equity-accounted loss before distribution (14) – Distribution made – –
Equity-accounted loss (14) –
Group’s share in equity-accounted results (note 6) (5) –
Summarised statement of financial positionASSETSClosing fair value of property assets 1 708 –
Opening fair value of property assets 1 708 – Gross fair value adjustment on investment property – –
Other assets 3 – Current assets 21 –
Total assets 1 732 –
EQUITY AND LIABILITIESOwners’ equity 145 –
Opening balance 159 – Loss (14) –
Interest-bearing borrowings 1 504 – Other liabilities 57 – Other current liabilities 26 –
Total equity and liabilities 1 732 –
Group’s share in owners’ equity 48 –
Acucap Investments (Pty) Ltd, a wholly owned subsidiary of Acucap Properties Ltd, has provided an R800 million suretyship in favour of Nedbank Ltd as security for the loan facilities granted to RSI and RSI2. In addition to the suretyship, Acucap Investments (Pty) Ltd has provided Nedbank with an undertaking to fund any shortfall in instalments due by RSI and RSI2 to Nedbank in terms of these loan facilities.
Acucap Properties Ltd’s unlimited suretyship in favour of Nedbank serves as security for Acucap Investments (Pty) Ltd’s obligations mentioned above.
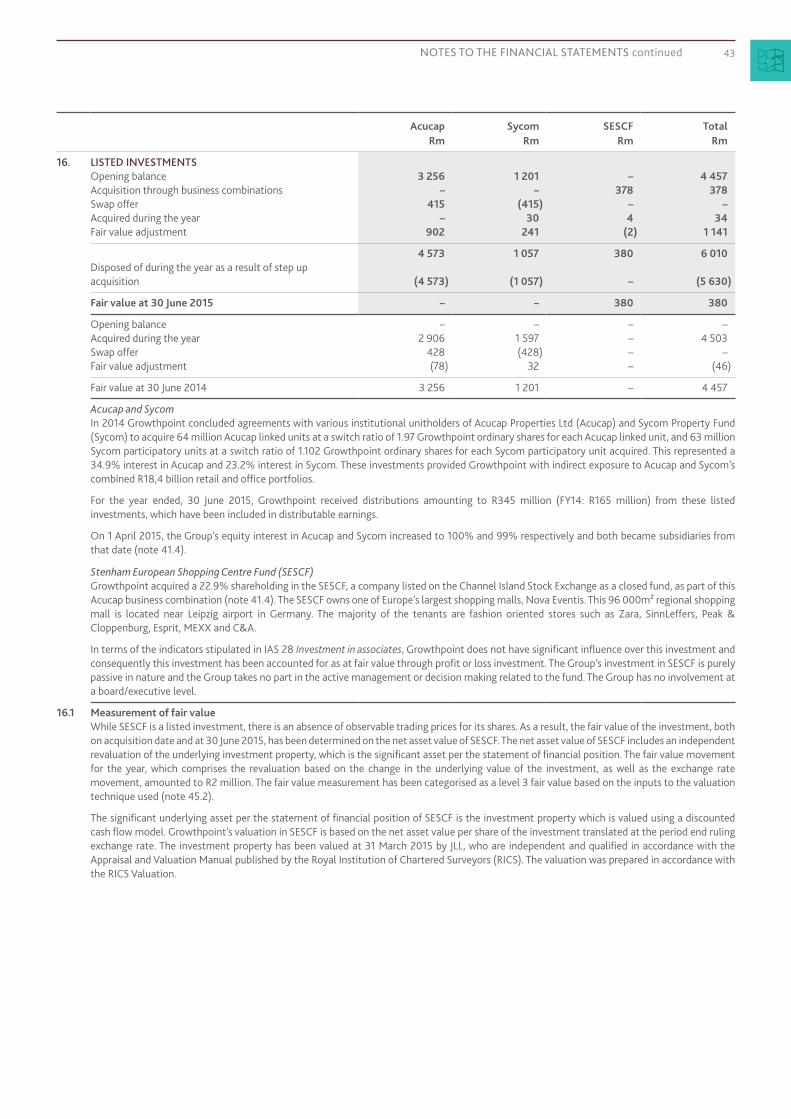
43NOTES TO THE FINANCIAL STATEMENTS continued
AcucapRm
SycomRm
SESCFRm
Total Rm
16. LISTED INVESTMENTSOpening balance 3 256 1 201 – 4 457 Acquisition through business combinations – – 378 378 Swap offer 415 (415) – – Acquired during the year – 30 4 34 Fair value adjustment 902 241 (2) 1 141
4 573 1 057 380 6 010 Disposed of during the year as a result of step up acquisition (4 573) (1 057) – (5 630)
Fair value at 30 June 2015 – – 380 380
Opening balance – – – – Acquired during the year 2 906 1 597 – 4 503 Swap offer 428 (428) – – Fair value adjustment (78) 32 – (46)
Fair value at 30 June 2014 3 256 1 201 – 4 457
Acucap and SycomIn 2014 Growthpoint concluded agreements with various institutional unitholders of Acucap Properties Ltd (Acucap) and Sycom Property Fund (Sycom) to acquire 64 million Acucap linked units at a switch ratio of 1.97 Growthpoint ordinary shares for each Acucap linked unit, and 63 million Sycom participatory units at a switch ratio of 1.102 Growthpoint ordinary shares for each Sycom participatory unit acquired. This represented a 34.9% interest in Acucap and 23.2% interest in Sycom. These investments provided Growthpoint with indirect exposure to Acucap and Sycom’s combined R18,4 billion retail and office portfolios.
For the year ended, 30 June 2015, Growthpoint received distributions amounting to R345 million (FY14: R165 million) from these listed investments, which have been included in distributable earnings.
On 1 April 2015, the Group’s equity interest in Acucap and Sycom increased to 100% and 99% respectively and both became subsidiaries from that date (note 41.4).
Stenham European Shopping Centre Fund (SESCF)Growthpoint acquired a 22.9% shareholding in the SESCF, a company listed on the Channel Island Stock Exchange as a closed fund, as part of this Acucap business combination (note 41.4). The SESCF owns one of Europe’s largest shopping malls, Nova Eventis. This 96 000m² regional shopping mall is located near Leipzig airport in Germany. The majority of the tenants are fashion oriented stores such as Zara, SinnLeffers, Peak & Cloppenburg, Esprit, MEXX and C&A.
In terms of the indicators stipulated in IAS 28 Investment in associates, Growthpoint does not have significant influence over this investment and consequently this investment has been accounted for as at fair value through profit or loss investment. The Group’s investment in SESCF is purely passive in nature and the Group takes no part in the active management or decision making related to the fund. The Group has no involvement at a board/executive level.
16.1 Measurement of fair valueWhile SESCF is a listed investment, there is an absence of observable trading prices for its shares. As a result, the fair value of the investment, both on acquisition date and at 30 June 2015, has been determined on the net asset value of SESCF. The net asset value of SESCF includes an independent revaluation of the underlying investment property, which is the significant asset per the statement of financial position. The fair value movement for the year, which comprises the revaluation based on the change in the underlying value of the investment, as well as the exchange rate movement, amounted to R2 million. The fair value measurement has been categorised as a level 3 fair value based on the inputs to the valuation technique used (note 45.2).
The significant underlying asset per the statement of financial position of SESCF is the investment property which is valued using a discounted cash flow model. Growthpoint’s valuation in SESCF is based on the net asset value per share of the investment translated at the period end ruling exchange rate. The investment property has been valued at 31 March 2015 by JLL, who are independent and qualified in accordance with the Appraisal and Valuation Manual published by the Royal Institution of Chartered Surveyors (RICS). The valuation was prepared in accordance with the RICS Valuation.
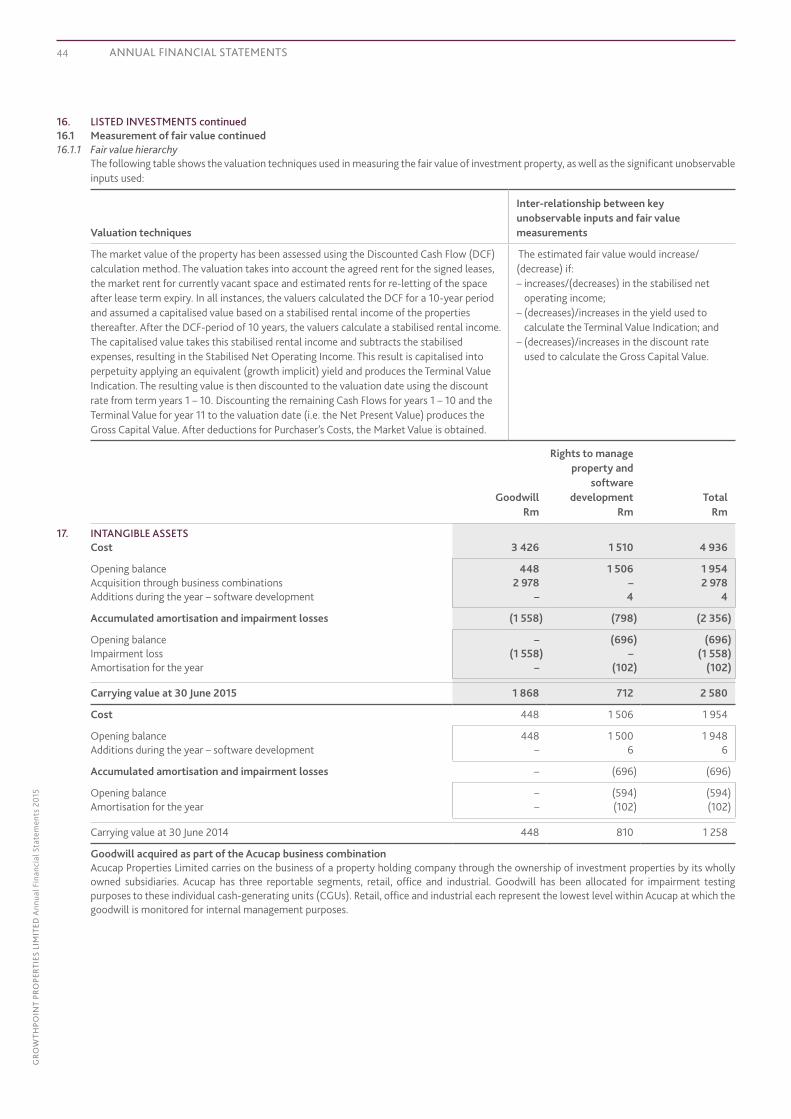
44 ANNUAL FINANCIAL STATEMENTS
GRO
WTH
POIN
T PR
OPE
RTIE
S LI
MIT
ED A
nnua
l Fin
anci
al S
tate
men
ts 2
015
16. LISTED INVESTMENTS continued16.1 Measurement of fair value continued16.1.1 Fair value hierarchy
The following table shows the valuation techniques used in measuring the fair value of investment property, as well as the significant unobservable inputs used:
Valuation techniques
Inter-relationship between key unobservable inputs and fair value measurements
The market value of the property has been assessed using the Discounted Cash Flow (DCF) calculation method. The valuation takes into account the agreed rent for the signed leases, the market rent for currently vacant space and estimated rents for re-letting of the space after lease term expiry. In all instances, the valuers calculated the DCF for a 10-year period and assumed a capitalised value based on a stabilised rental income of the properties thereafter. After the DCF-period of 10 years, the valuers calculate a stabilised rental income. The capitalised value takes this stabilised rental income and subtracts the stabilised expenses, resulting in the Stabilised Net Operating Income. This result is capitalised into perpetuity applying an equivalent (growth implicit) yield and produces the Terminal Value Indication. The resulting value is then discounted to the valuation date using the discount rate from term years 1 – 10. Discounting the remaining Cash Flows for years 1 – 10 and the Terminal Value for year 11 to the valuation date (i.e. the Net Present Value) produces the Gross Capital Value. After deductions for Purchaser’s Costs, the Market Value is obtained.
The estimated fair value would increase/(decrease) if:– increases/(decreases) in the stabilised net
operating income;– (decreases)/increases in the yield used to
calculate the Terminal Value Indication; and– (decreases)/increases in the discount rate
used to calculate the Gross Capital Value.
GoodwillRm
Rights to manage property and
software development
RmTotal
Rm
17. INTANGIBLE ASSETSCost 3 426 1 510 4 936
Opening balance 448 1 506 1 954 Acquisition through business combinations 2 978 – 2 978 Additions during the year – software development – 4 4
Accumulated amortisation and impairment losses (1 558) (798) (2 356)
Opening balance – (696) (696)Impairment loss (1 558) – (1 558)Amortisation for the year – (102) (102)
Carrying value at 30 June 2015 1 868 712 2 580
Cost 448 1 506 1 954
Opening balance 448 1 500 1 948Additions during the year – software development – 6 6
Accumulated amortisation and impairment losses – (696) (696)
Opening balance – (594) (594)Amortisation for the year – (102) (102)
Carrying value at 30 June 2014 448 810 1 258
Goodwill acquired as part of the Acucap business combinationAcucap Properties Limited carries on the business of a property holding company through the ownership of investment properties by its wholly owned subsidiaries. Acucap has three reportable segments, retail, office and industrial. Goodwill has been allocated for impairment testing purposes to these individual cash-generating units (CGUs). Retail, office and industrial each represent the lowest level within Acucap at which the goodwill is monitored for internal management purposes.
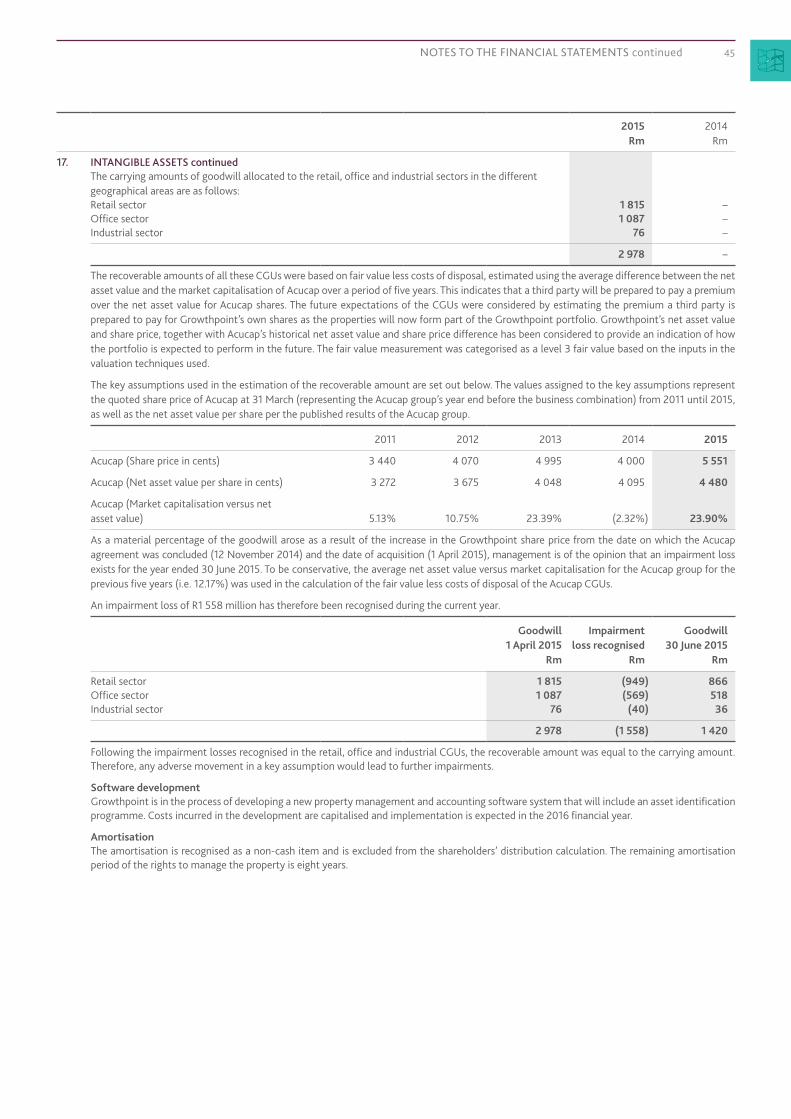
45NOTES TO THE FINANCIAL STATEMENTS continued
2015Rm
2014Rm
17. INTANGIBLE ASSETS continuedThe carrying amounts of goodwill allocated to the retail, office and industrial sectors in the different geographical areas are as follows:Retail sector 1 815 –Office sector 1 087 –Industrial sector 76 –
2 978 –
The recoverable amounts of all these CGUs were based on fair value less costs of disposal, estimated using the average difference between the net asset value and the market capitalisation of Acucap over a period of five years. This indicates that a third party will be prepared to pay a premium over the net asset value for Acucap shares. The future expectations of the CGUs were considered by estimating the premium a third party is prepared to pay for Growthpoint’s own shares as the properties will now form part of the Growthpoint portfolio. Growthpoint’s net asset value and share price, together with Acucap’s historical net asset value and share price difference has been considered to provide an indication of how the portfolio is expected to perform in the future. The fair value measurement was categorised as a level 3 fair value based on the inputs in the valuation techniques used.
The key assumptions used in the estimation of the recoverable amount are set out below. The values assigned to the key assumptions represent the quoted share price of Acucap at 31 March (representing the Acucap group’s year end before the business combination) from 2011 until 2015, as well as the net asset value per share per the published results of the Acucap group.
2011 2012 2013 2014 2015
Acucap (Share price in cents) 3 440 4 070 4 995 4 000 5 551
Acucap (Net asset value per share in cents) 3 272 3 675 4 048 4 095 4 480
Acucap (Market capitalisation versus net asset value) 5.13% 10.75% 23.39% (2.32%) 23.90%
As a material percentage of the goodwill arose as a result of the increase in the Growthpoint share price from the date on which the Acucap agreement was concluded (12 November 2014) and the date of acquisition (1 April 2015), management is of the opinion that an impairment loss exists for the year ended 30 June 2015. To be conservative, the average net asset value versus market capitalisation for the Acucap group for the previous five years (i.e. 12.17%) was used in the calculation of the fair value less costs of disposal of the Acucap CGUs.
An impairment loss of R1 558 million has therefore been recognised during the current year.
Goodwill1 April 2015
Rm
Impairmentloss recognised
Rm
Goodwill30 June 2015
Rm
Retail sector 1 815 (949) 866 Office sector 1 087 (569) 518 Industrial sector 76 (40) 36
2 978 (1 558) 1 420
Following the impairment losses recognised in the retail, office and industrial CGUs, the recoverable amount was equal to the carrying amount. Therefore, any adverse movement in a key assumption would lead to further impairments.
Software development Growthpoint is in the process of developing a new property management and accounting software system that will include an asset identification programme. Costs incurred in the development are capitalised and implementation is expected in the 2016 financial year.
AmortisationThe amortisation is recognised as a non-cash item and is excluded from the shareholders’ distribution calculation. The remaining amortisation period of the rights to manage the property is eight years.
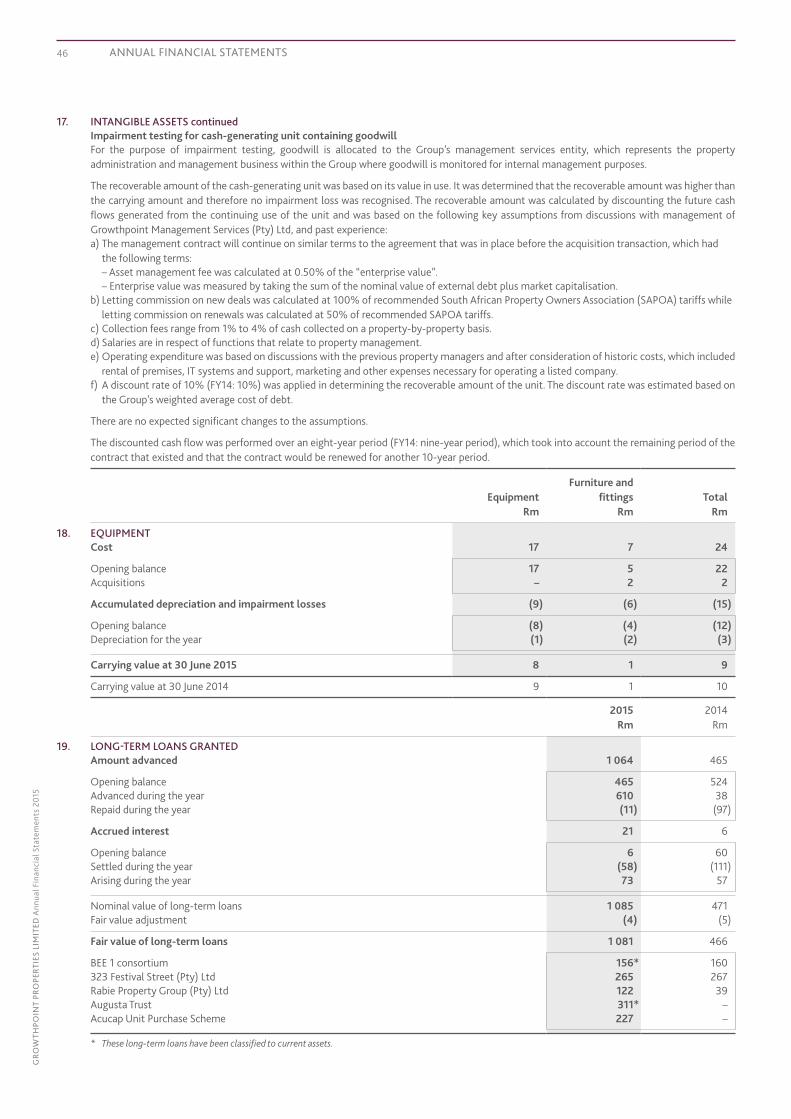
46 ANNUAL FINANCIAL STATEMENTS
GRO
WTH
POIN
T PR
OPE
RTIE
S LI
MIT
ED A
nnua
l Fin
anci
al S
tate
men
ts 2
015
17. INTANGIBLE ASSETS continuedImpairment testing for cash-generating unit containing goodwill For the purpose of impairment testing, goodwill is allocated to the Group’s management services entity, which represents the property administration and management business within the Group where goodwill is monitored for internal management purposes.
The recoverable amount of the cash-generating unit was based on its value in use. It was determined that the recoverable amount was higher than the carrying amount and therefore no impairment loss was recognised. The recoverable amount was calculated by discounting the future cash flows generated from the continuing use of the unit and was based on the following key assumptions from discussions with management of Growthpoint Management Services (Pty) Ltd, and past experience:a) The management contract will continue on similar terms to the agreement that was in place before the acquisition transaction, which had
the following terms: – Asset management fee was calculated at 0.50% of the “enterprise value”. – Enterprise value was measured by taking the sum of the nominal value of external debt plus market capitalisation.b) Letting commission on new deals was calculated at 100% of recommended South African Property Owners Association (SAPOA) tariffs while
letting commission on renewals was calculated at 50% of recommended SAPOA tariffs.c) Collection fees range from 1% to 4% of cash collected on a property-by-property basis.d) Salaries are in respect of functions that relate to property management.e) Operating expenditure was based on discussions with the previous property managers and after consideration of historic costs, which included
rental of premises, IT systems and support, marketing and other expenses necessary for operating a listed company.f) A discount rate of 10% (FY14: 10%) was applied in determining the recoverable amount of the unit. The discount rate was estimated based on
the Group’s weighted average cost of debt.
There are no expected significant changes to the assumptions.
The discounted cash flow was performed over an eight-year period (FY14: nine-year period), which took into account the remaining period of the contract that existed and that the contract would be renewed for another 10-year period.
EquipmentRm
Furniture and fittings
RmTotal
Rm
18. EQUIPMENTCost 17 7 24
Opening balance 17 5 22 Acquisitions – 2 2
Accumulated depreciation and impairment losses (9) (6) (15)
Opening balance (8) (4) (12)Depreciation for the year (1) (2) (3)
Carrying value at 30 June 2015 8 1 9
Carrying value at 30 June 2014 9 1 10
2015 Rm
2014Rm
19. LONG-TERM LOANS GRANTEDAmount advanced 1 064 465
Opening balance 465 524 Advanced during the year 610 38 Repaid during the year (11) (97)
Accrued interest 21 6
Opening balance 6 60 Settled during the year (58) (111)Arising during the year 73 57
Nominal value of long-term loans 1 085 471 Fair value adjustment (4) (5)
Fair value of long-term loans 1 081 466
BEE 1 consortium 156* 160 323 Festival Street (Pty) Ltd 265 267 Rabie Property Group (Pty) Ltd 122 39 Augusta Trust 311* – Acucap Unit Purchase Scheme 227 –
* These long-term loans have been classified to current assets.
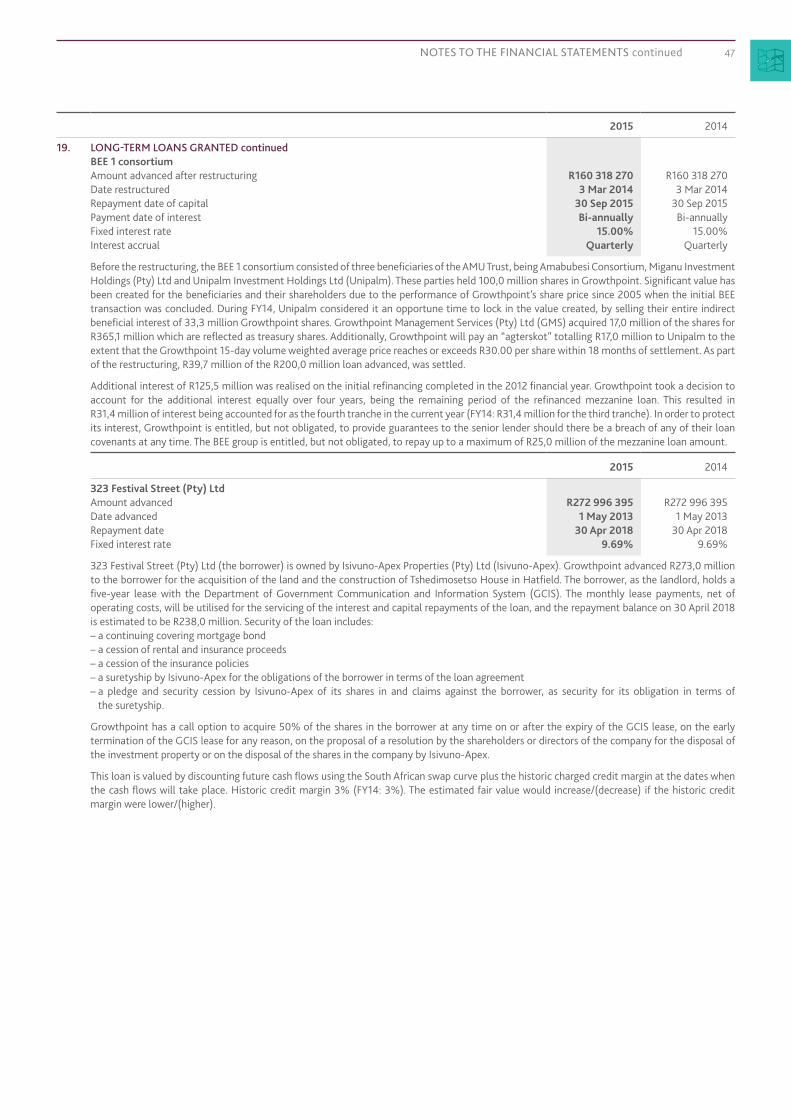
47NOTES TO THE FINANCIAL STATEMENTS continued
2015 2014
19. LONG-TERM LOANS GRANTED continuedBEE 1 consortiumAmount advanced after restructuring R160 318 270 R160 318 270 Date restructured 3 Mar 2014 3 Mar 2014Repayment date of capital 30 Sep 2015 30 Sep 2015Payment date of interest Bi-annually Bi-annuallyFixed interest rate 15.00% 15.00%Interest accrual Quarterly Quarterly
Before the restructuring, the BEE 1 consortium consisted of three beneficiaries of the AMU Trust, being Amabubesi Consortium, Miganu Investment Holdings (Pty) Ltd and Unipalm Investment Holdings Ltd (Unipalm). These parties held 100,0 million shares in Growthpoint. Significant value has been created for the beneficiaries and their shareholders due to the performance of Growthpoint’s share price since 2005 when the initial BEE transaction was concluded. During FY14, Unipalm considered it an opportune time to lock in the value created, by selling their entire indirect beneficial interest of 33,3 million Growthpoint shares. Growthpoint Management Services (Pty) Ltd (GMS) acquired 17,0 million of the shares for R365,1 million which are reflected as treasury shares. Additionally, Growthpoint will pay an “agterskot” totalling R17,0 million to Unipalm to the extent that the Growthpoint 15-day volume weighted average price reaches or exceeds R30.00 per share within 18 months of settlement. As part of the restructuring, R39,7 million of the R200,0 million loan advanced, was settled.
Additional interest of R125,5 million was realised on the initial refinancing completed in the 2012 financial year. Growthpoint took a decision to account for the additional interest equally over four years, being the remaining period of the refinanced mezzanine loan. This resulted in R31,4 million of interest being accounted for as the fourth tranche in the current year (FY14: R31,4 million for the third tranche). In order to protect its interest, Growthpoint is entitled, but not obligated, to provide guarantees to the senior lender should there be a breach of any of their loan covenants at any time. The BEE group is entitled, but not obligated, to repay up to a maximum of R25,0 million of the mezzanine loan amount.
2015 2014
323 Festival Street (Pty) LtdAmount advanced R272 996 395 R272 996 395Date advanced 1 May 2013 1 May 2013Repayment date 30 Apr 2018 30 Apr 2018Fixed interest rate 9.69% 9.69%
323 Festival Street (Pty) Ltd (the borrower) is owned by Isivuno-Apex Properties (Pty) Ltd (Isivuno-Apex). Growthpoint advanced R273,0 million to the borrower for the acquisition of the land and the construction of Tshedimosetso House in Hatfield. The borrower, as the landlord, holds a five-year lease with the Department of Government Communication and Information System (GCIS). The monthly lease payments, net of operating costs, will be utilised for the servicing of the interest and capital repayments of the loan, and the repayment balance on 30 April 2018 is estimated to be R238,0 million. Security of the loan includes:– a continuing covering mortgage bond– a cession of rental and insurance proceeds– a cession of the insurance policies– a suretyship by Isivuno-Apex for the obligations of the borrower in terms of the loan agreement– a pledge and security cession by Isivuno-Apex of its shares in and claims against the borrower, as security for its obligation in terms of
the suretyship.
Growthpoint has a call option to acquire 50% of the shares in the borrower at any time on or after the expiry of the GCIS lease, on the early termination of the GCIS lease for any reason, on the proposal of a resolution by the shareholders or directors of the company for the disposal of the investment property or on the disposal of the shares in the company by Isivuno-Apex.
This loan is valued by discounting future cash flows using the South African swap curve plus the historic charged credit margin at the dates when the cash flows will take place. Historic credit margin 3% (FY14: 3%). The estimated fair value would increase/(decrease) if the historic credit margin were lower/(higher).
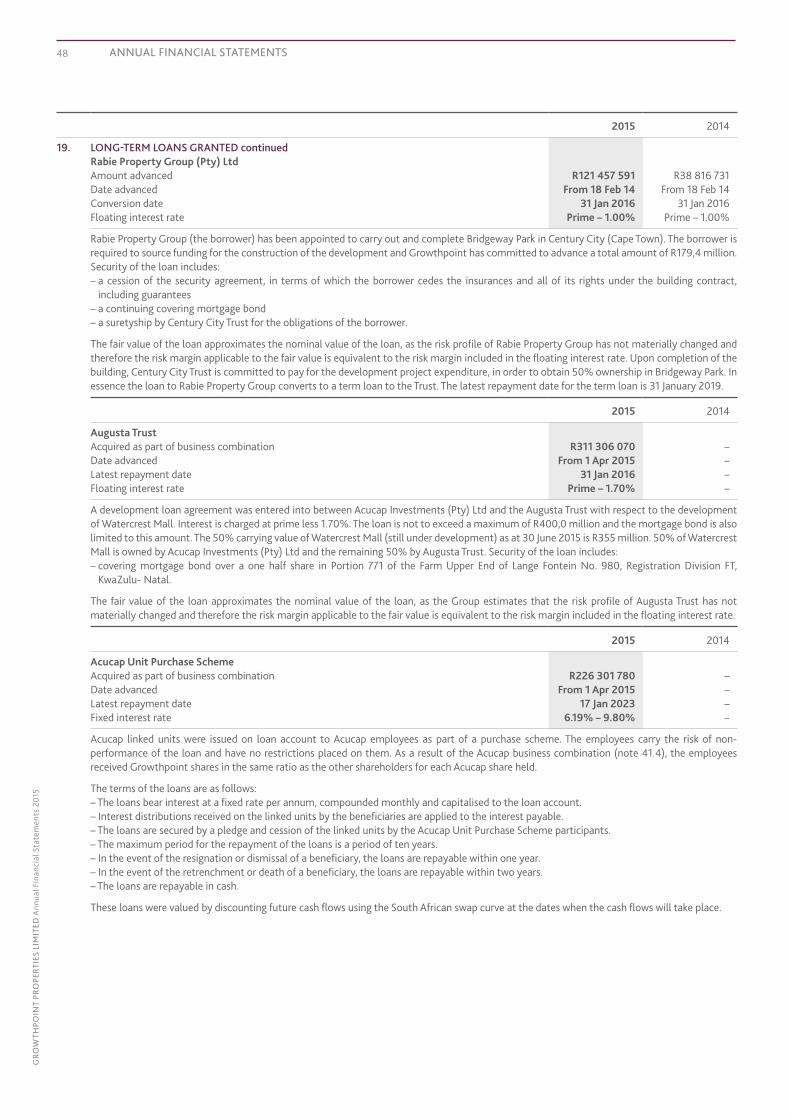
48 ANNUAL FINANCIAL STATEMENTS
GRO
WTH
POIN
T PR
OPE
RTIE
S LI
MIT
ED A
nnua
l Fin
anci
al S
tate
men
ts 2
015
2015 2014
19. LONG-TERM LOANS GRANTED continuedRabie Property Group (Pty) LtdAmount advanced R121 457 591 R38 816 731Date advanced From 18 Feb 14 From 18 Feb 14Conversion date 31 Jan 2016 31 Jan 2016Floating interest rate Prime – 1.00% Prime – 1.00%
Rabie Property Group (the borrower) has been appointed to carry out and complete Bridgeway Park in Century City (Cape Town). The borrower is required to source funding for the construction of the development and Growthpoint has committed to advance a total amount of R179,4 million. Security of the loan includes:– a cession of the security agreement, in terms of which the borrower cedes the insurances and all of its rights under the building contract,
including guarantees– a continuing covering mortgage bond– a suretyship by Century City Trust for the obligations of the borrower.
The fair value of the loan approximates the nominal value of the loan, as the risk profile of Rabie Property Group has not materially changed and therefore the risk margin applicable to the fair value is equivalent to the risk margin included in the floating interest rate. Upon completion of the building, Century City Trust is committed to pay for the development project expenditure, in order to obtain 50% ownership in Bridgeway Park. In essence the loan to Rabie Property Group converts to a term loan to the Trust. The latest repayment date for the term loan is 31 January 2019.
2015 2014
Augusta TrustAcquired as part of business combination R311 306 070 – Date advanced From 1 Apr 2015 – Latest repayment date 31 Jan 2016 – Floating interest rate Prime – 1.70% –
A development loan agreement was entered into between Acucap Investments (Pty) Ltd and the Augusta Trust with respect to the development of Watercrest Mall. Interest is charged at prime less 1.70%. The loan is not to exceed a maximum of R400,0 million and the mortgage bond is also limited to this amount. The 50% carrying value of Watercrest Mall (still under development) as at 30 June 2015 is R355 million. 50% of Watercrest Mall is owned by Acucap Investments (Pty) Ltd and the remaining 50% by Augusta Trust. Security of the loan includes:– covering mortgage bond over a one half share in Portion 771 of the Farm Upper End of Lange Fontein No. 980, Registration Division FT,
KwaZulu- Natal.
The fair value of the loan approximates the nominal value of the loan, as the Group estimates that the risk profile of Augusta Trust has not materially changed and therefore the risk margin applicable to the fair value is equivalent to the risk margin included in the floating interest rate.
2015 2014
Acucap Unit Purchase SchemeAcquired as part of business combination R226 301 780 – Date advanced From 1 Apr 2015 – Latest repayment date 17 Jan 2023 – Fixed interest rate 6.19% – 9.80% –
Acucap linked units were issued on loan account to Acucap employees as part of a purchase scheme. The employees carry the risk of non-performance of the loan and have no restrictions placed on them. As a result of the Acucap business combination (note 41.4), the employees received Growthpoint shares in the same ratio as the other shareholders for each Acucap share held.
The terms of the loans are as follows:– The loans bear interest at a fixed rate per annum, compounded monthly and capitalised to the loan account.– Interest distributions received on the linked units by the beneficiaries are applied to the interest payable.– The loans are secured by a pledge and cession of the linked units by the Acucap Unit Purchase Scheme participants.– The maximum period for the repayment of the loans is a period of ten years.– In the event of the resignation or dismissal of a beneficiary, the loans are repayable within one year.– In the event of the retrenchment or death of a beneficiary, the loans are repayable within two years.– The loans are repayable in cash.
These loans were valued by discounting future cash flows using the South African swap curve at the dates when the cash flows will take place.
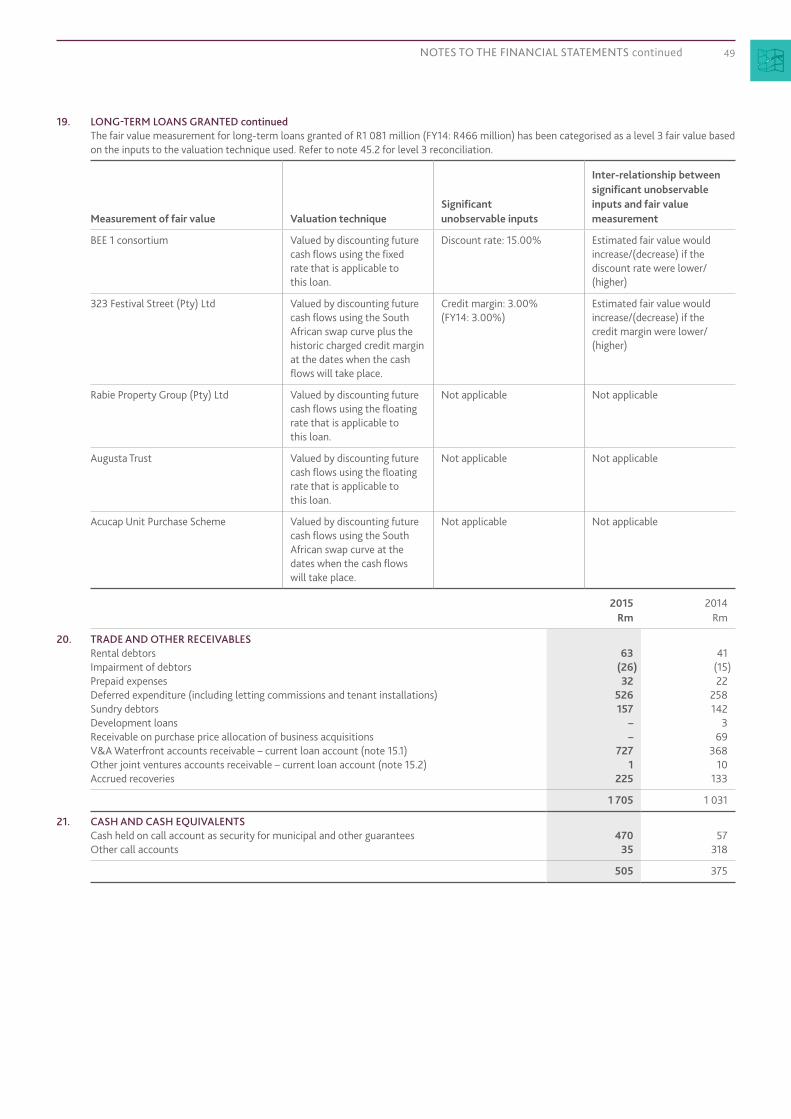
49NOTES TO THE FINANCIAL STATEMENTS continued
19. LONG-TERM LOANS GRANTED continuedThe fair value measurement for long-term loans granted of R1 081 million (FY14: R466 million) has been categorised as a level 3 fair value based on the inputs to the valuation technique used. Refer to note 45.2 for level 3 reconciliation.
Measurement of fair value Valuation techniqueSignificant unobservable inputs
Inter-relationship between significant unobservable inputs and fair value measurement
BEE 1 consortium Valued by discounting future cash flows using the fixed rate that is applicable to this loan.
Discount rate: 15.00% Estimated fair value would increase/(decrease) if the discount rate were lower/(higher)
323 Festival Street (Pty) Ltd Valued by discounting future cash flows using the South African swap curve plus the historic charged credit margin at the dates when the cash flows will take place.
Credit margin: 3.00% (FY14: 3.00%)
Estimated fair value would increase/(decrease) if the credit margin were lower/(higher)
Rabie Property Group (Pty) Ltd Valued by discounting future cash flows using the floating rate that is applicable to this loan.
Not applicable Not applicable
Augusta Trust Valued by discounting future cash flows using the floating rate that is applicable to this loan.
Not applicable Not applicable
Acucap Unit Purchase Scheme Valued by discounting future cash flows using the South African swap curve at the dates when the cash flows will take place.
Not applicable Not applicable
2015Rm
2014Rm
20. TRADE AND OTHER RECEIVABLESRental debtors 63 41 Impairment of debtors (26) (15)Prepaid expenses 32 22 Deferred expenditure (including letting commissions and tenant installations) 526 258 Sundry debtors 157 142 Development loans – 3 Receivable on purchase price allocation of business acquisitions – 69 V&A Waterfront accounts receivable – current loan account (note 15.1) 727 368 Other joint ventures accounts receivable – current loan account (note 15.2) 1 10 Accrued recoveries 225 133
1 705 1 031
21. CASH AND CASH EQUIVALENTSCash held on call account as security for municipal and other guarantees 470 57 Other call accounts 35 318
505 375
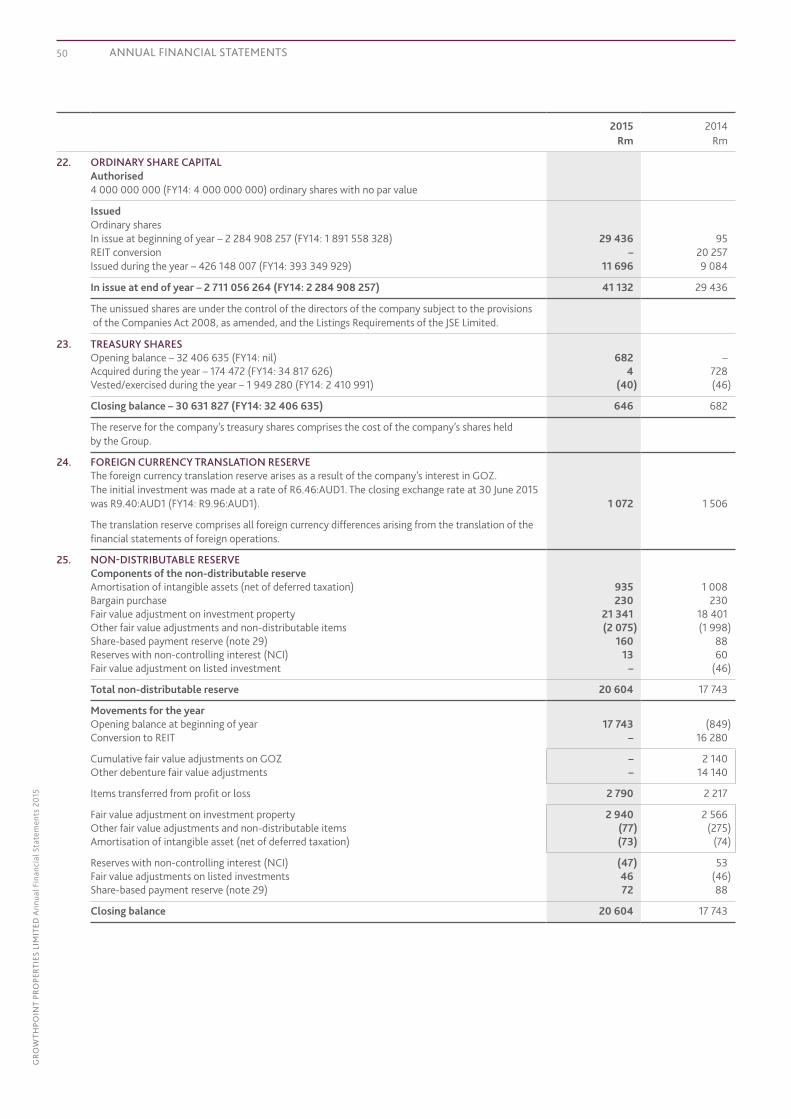
50 ANNUAL FINANCIAL STATEMENTS
GRO
WTH
POIN
T PR
OPE
RTIE
S LI
MIT
ED A
nnua
l Fin
anci
al S
tate
men
ts 2
015
2015Rm
2014Rm
22. ORDINARY SHARE CAPITALAuthorised4 000 000 000 (FY14: 4 000 000 000) ordinary shares with no par value
IssuedOrdinary shares In issue at beginning of year – 2 284 908 257 (FY14: 1 891 558 328) 29 436 95REIT conversion – 20 257Issued during the year – 426 148 007 (FY14: 393 349 929) 11 696 9 084
In issue at end of year – 2 711 056 264 (FY14: 2 284 908 257) 41 132 29 436
The unissued shares are under the control of the directors of the company subject to the provisions of the Companies Act 2008, as amended, and the Listings Requirements of the JSE Limited.
23. TREASURY SHARESOpening balance – 32 406 635 (FY14: nil) 682 – Acquired during the year – 174 472 (FY14: 34 817 626) 4 728 Vested/exercised during the year – 1 949 280 (FY14: 2 410 991) (40) (46)
Closing balance – 30 631 827 (FY14: 32 406 635) 646 682
The reserve for the company’s treasury shares comprises the cost of the company’s shares held by the Group.
24. FOREIGN CURRENCY TRANSLATION RESERVEThe foreign currency translation reserve arises as a result of the company’s interest in GOZ. The initial investment was made at a rate of R6.46:AUD1. The closing exchange rate at 30 June 2015 was R9.40:AUD1 (FY14: R9.96:AUD1). 1 072 1 506
The translation reserve comprises all foreign currency differences arising from the translation of the financial statements of foreign operations.
25. NON-DISTRIBUTABLE RESERVEComponents of the non-distributable reserveAmortisation of intangible assets (net of deferred taxation) 935 1 008Bargain purchase 230 230 Fair value adjustment on investment property 21 341 18 401 Other fair value adjustments and non-distributable items (2 075) (1 998)Share-based payment reserve (note 29) 160 88 Reserves with non-controlling interest (NCI) 13 60 Fair value adjustment on listed investment – (46)
Total non-distributable reserve 20 604 17 743
Movements for the yearOpening balance at beginning of year 17 743 (849)Conversion to REIT – 16 280
Cumulative fair value adjustments on GOZ – 2 140 Other debenture fair value adjustments – 14 140
Items transferred from profit or loss 2 790 2 217
Fair value adjustment on investment property 2 940 2 566 Other fair value adjustments and non-distributable items (77) (275)Amortisation of intangible asset (net of deferred taxation) (73) (74)
Reserves with non-controlling interest (NCI) (47) 53 Fair value adjustments on listed investments 46 (46)Share-based payment reserve (note 29) 72 88
Closing balance 20 604 17 743
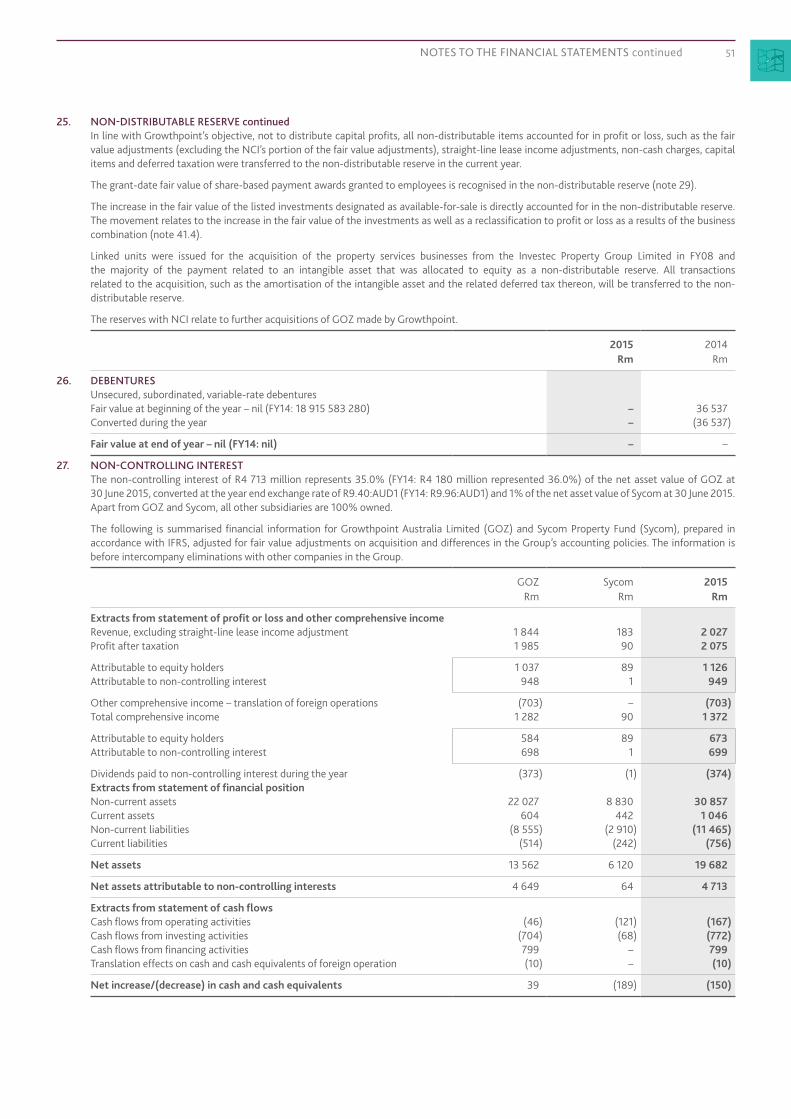
51NOTES TO THE FINANCIAL STATEMENTS continued
25. NON-DISTRIBUTABLE RESERVE continuedIn line with Growthpoint’s objective, not to distribute capital profits, all non-distributable items accounted for in profit or loss, such as the fair value adjustments (excluding the NCI’s portion of the fair value adjustments), straight-line lease income adjustments, non-cash charges, capital items and deferred taxation were transferred to the non-distributable reserve in the current year.
The grant-date fair value of share-based payment awards granted to employees is recognised in the non-distributable reserve (note 29).
The increase in the fair value of the listed investments designated as available-for-sale is directly accounted for in the non-distributable reserve. The movement relates to the increase in the fair value of the investments as well as a reclassification to profit or loss as a results of the business combination (note 41.4).
Linked units were issued for the acquisition of the property services businesses from the Investec Property Group Limited in FY08 and the majority of the payment related to an intangible asset that was allocated to equity as a non-distributable reserve. All transactions related to the acquisition, such as the amortisation of the intangible asset and the related deferred tax thereon, will be transferred to the non-distributable reserve.
The reserves with NCI relate to further acquisitions of GOZ made by Growthpoint.
2015 Rm
2014Rm
26. DEBENTURESUnsecured, subordinated, variable-rate debenturesFair value at beginning of the year – nil (FY14: 18 915 583 280) – 36 537 Converted during the year – (36 537)
Fair value at end of year – nil (FY14: nil) – –
27. NON-CONTROLLING INTEREST The non-controlling interest of R4 713 million represents 35.0% (FY14: R4 180 million represented 36.0%) of the net asset value of GOZ at 30 June 2015, converted at the year end exchange rate of R9.40:AUD1 (FY14: R9.96:AUD1) and 1% of the net asset value of Sycom at 30 June 2015. Apart from GOZ and Sycom, all other subsidiaries are 100% owned.
The following is summarised financial information for Growthpoint Australia Limited (GOZ) and Sycom Property Fund (Sycom), prepared in accordance with IFRS, adjusted for fair value adjustments on acquisition and differences in the Group’s accounting policies. The information is before intercompany eliminations with other companies in the Group.
GOZ Rm
Sycom Rm
2015 Rm
Extracts from statement of profit or loss and other comprehensive incomeRevenue, excluding straight-line lease income adjustment 1 844 183 2 027Profit after taxation 1 985 90 2 075
Attributable to equity holders 1 037 89 1 126Attributable to non-controlling interest 948 1 949
Other comprehensive income – translation of foreign operations (703) – (703)Total comprehensive income 1 282 90 1 372
Attributable to equity holders 584 89 673Attributable to non-controlling interest 698 1 699
Dividends paid to non-controlling interest during the year (373) (1) (374)Extracts from statement of financial positionNon-current assets 22 027 8 830 30 857Current assets 604 442 1 046Non-current liabilities (8 555) (2 910) (11 465)Current liabilities (514) (242) (756)
Net assets 13 562 6 120 19 682
Net assets attributable to non-controlling interests 4 649 64 4 713
Extracts from statement of cash flows Cash flows from operating activities (46) (121) (167)Cash flows from investing activities (704) (68) (772)Cash flows from financing activities 799 – 799Translation effects on cash and cash equivalents of foreign operation (10) – (10)
Net increase/(decrease) in cash and cash equivalents 39 (189) (150)
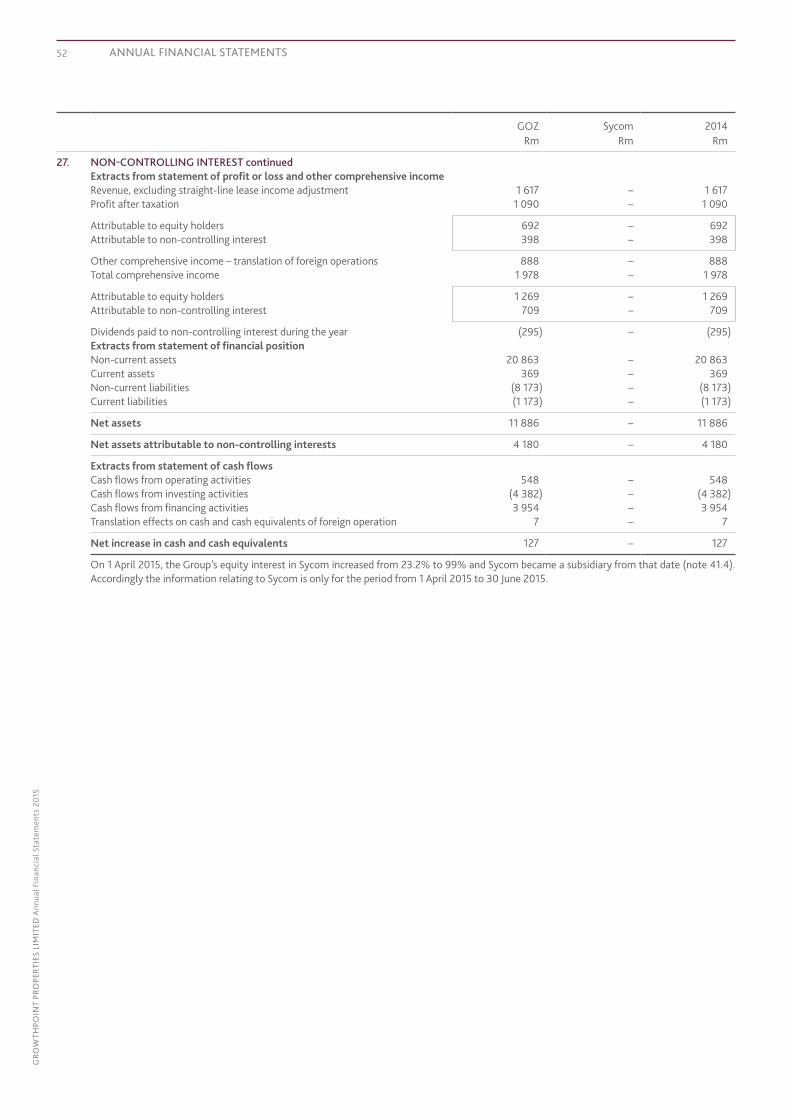
52 ANNUAL FINANCIAL STATEMENTS
GRO
WTH
POIN
T PR
OPE
RTIE
S LI
MIT
ED A
nnua
l Fin
anci
al S
tate
men
ts 2
015
GOZ Rm
Sycom Rm
2014 Rm
27. NON-CONTROLLING INTEREST continuedExtracts from statement of profit or loss and other comprehensive incomeRevenue, excluding straight-line lease income adjustment 1 617 – 1 617 Profit after taxation 1 090 – 1 090
Attributable to equity holders 692 – 692 Attributable to non-controlling interest 398 – 398
Other comprehensive income – translation of foreign operations 888 – 888 Total comprehensive income 1 978 – 1 978
Attributable to equity holders 1 269 – 1 269 Attributable to non-controlling interest 709 – 709
Dividends paid to non-controlling interest during the year (295) – (295)Extracts from statement of financial positionNon-current assets 20 863 – 20 863Current assets 369 – 369 Non-current liabilities (8 173) – (8 173)Current liabilities (1 173) – (1 173)
Net assets 11 886 – 11 886
Net assets attributable to non-controlling interests 4 180 – 4 180
Extracts from statement of cash flows Cash flows from operating activities 548 – 548 Cash flows from investing activities (4 382) – (4 382) Cash flows from financing activities 3 954 – 3 954 Translation effects on cash and cash equivalents of foreign operation 7 – 7
Net increase in cash and cash equivalents 127 – 127
On 1 April 2015, the Group’s equity interest in Sycom increased from 23.2% to 99% and Sycom became a subsidiary from that date (note 41.4). Accordingly the information relating to Sycom is only for the period from 1 April 2015 to 30 June 2015.
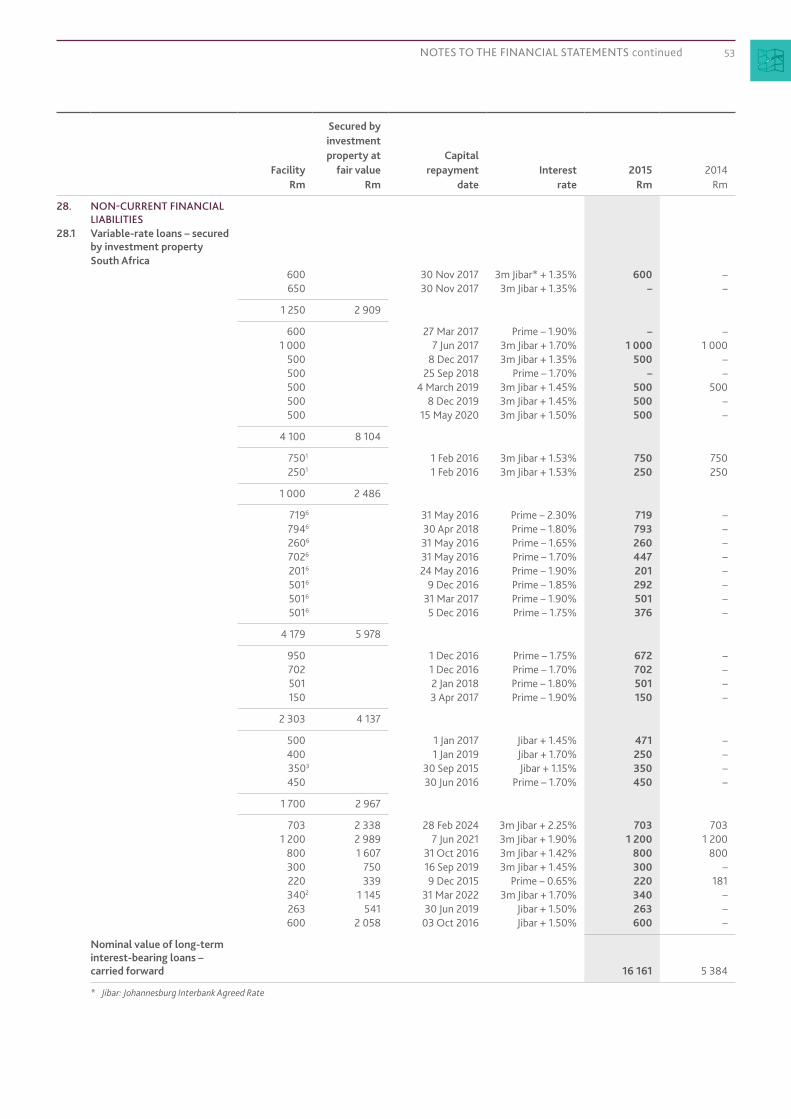
53NOTES TO THE FINANCIAL STATEMENTS continued
Facility Rm
Secured by investment property at
fair valueRm
Capital repayment
dateInterest
rate2015
Rm2014
Rm
28. NON-CURRENT FINANCIAL LIABILITIES
28.1 Variable-rate loans – secured by investment propertySouth Africa
600 30 Nov 2017 3m Jibar* + 1.35% 600 –650 30 Nov 2017 3m Jibar + 1.35% – –
1 250 2 909
600 27 Mar 2017 Prime – 1.90% – – 1 000 7 Jun 2017 3m Jibar + 1.70% 1 000 1 000
500 8 Dec 2017 3m Jibar + 1.35% 500 – 500 25 Sep 2018 Prime – 1.70% – – 500 4 March 2019 3m Jibar + 1.45% 500 500 500 8 Dec 2019 3m Jibar + 1.45% 500 – 500 15 May 2020 3m Jibar + 1.50% 500 –
4 100 8 104
7501 1 Feb 2016 3m Jibar + 1.53% 750 750 2501 1 Feb 2016 3m Jibar + 1.53% 250 250
1 000 2 486
7196 31 May 2016 Prime – 2.30% 719 – 7946 30 Apr 2018 Prime – 1.80% 793 – 2606 31 May 2016 Prime – 1.65% 260 – 7026 31 May 2016 Prime – 1.70% 447 – 2016 24 May 2016 Prime – 1.90% 201 – 5016 9 Dec 2016 Prime – 1.85% 292 – 5016 31 Mar 2017 Prime – 1.90% 501 – 5016 5 Dec 2016 Prime – 1.75% 376 –
4 179 5 978
950 1 Dec 2016 Prime – 1.75% 672 – 702 1 Dec 2016 Prime – 1.70% 702 – 501 2 Jan 2018 Prime – 1.80% 501 – 150 3 Apr 2017 Prime – 1.90% 150 –
2 303 4 137
500 1 Jan 2017 Jibar + 1.45% 471 – 400 1 Jan 2019 Jibar + 1.70% 250 – 3503 30 Sep 2015 Jibar + 1.15% 350 – 450 30 Jun 2016 Prime – 1.70% 450 –
1 700 2 967
703 2 338 28 Feb 2024 3m Jibar + 2.25% 703 703 1 200 2 989 7 Jun 2021 3m Jibar + 1.90% 1 200 1 200
800 1 607 31 Oct 2016 3m Jibar + 1.42% 800 800 300 750 16 Sep 2019 3m Jibar + 1.45% 300 – 220 339 9 Dec 2015 Prime – 0.65% 220 181 3402 1 145 31 Mar 2022 3m Jibar + 1.70% 340 – 263 541 30 Jun 2019 Jibar + 1.50% 263 – 600 2 058 03 Oct 2016 Jibar + 1.50% 600 –
Nominal value of long-term interest-bearing loans – carried forward 16 161 5 384
* Jibar: Johannesburg Interbank Agreed Rate
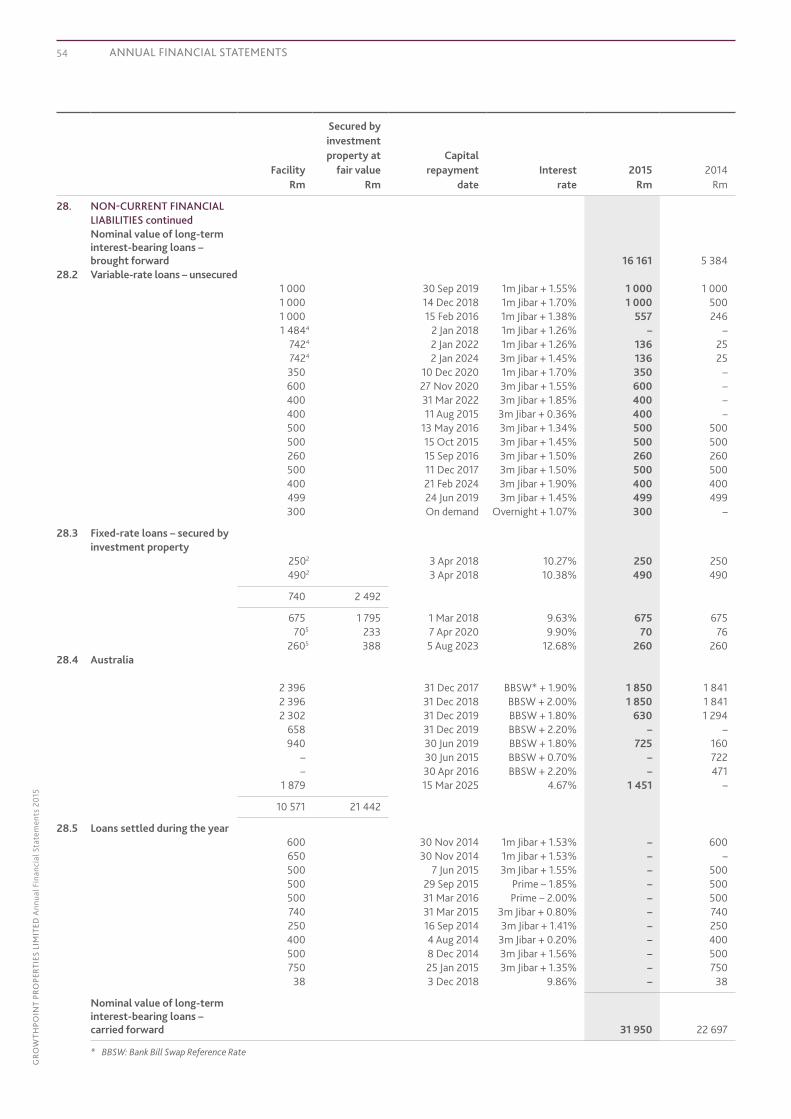
54 ANNUAL FINANCIAL STATEMENTS
GRO
WTH
POIN
T PR
OPE
RTIE
S LI
MIT
ED A
nnua
l Fin
anci
al S
tate
men
ts 2
015
Facility Rm
Secured by investment property at
fair valueRm
Capital repayment
dateInterest
rate2015
Rm2014
Rm
28. NON-CURRENT FINANCIAL LIABILITIES continuedNominal value of long-term interest-bearing loans – brought forward 16 161 5 384
28.2 Variable-rate loans – unsecured1 000 30 Sep 2019 1m Jibar + 1.55% 1 000 1 000 1 000 14 Dec 2018 1m Jibar + 1.70% 1 000 500 1 000 15 Feb 2016 1m Jibar + 1.38% 557 246 1 4844 2 Jan 2018 1m Jibar + 1.26% – –
7424 2 Jan 2022 1m Jibar + 1.26% 136 25 7424 2 Jan 2024 3m Jibar + 1.45% 136 25 350 10 Dec 2020 1m Jibar + 1.70% 350 – 600 27 Nov 2020 3m Jibar + 1.55% 600 – 400 31 Mar 2022 3m Jibar + 1.85% 400 – 400 11 Aug 2015 3m Jibar + 0.36% 400 – 500 13 May 2016 3m Jibar + 1.34% 500 500 500 15 Oct 2015 3m Jibar + 1.45% 500 500 260 15 Sep 2016 3m Jibar + 1.50% 260 260 500 11 Dec 2017 3m Jibar + 1.50% 500 500 400 21 Feb 2024 3m Jibar + 1.90% 400 400 499 24 Jun 2019 3m Jibar + 1.45% 499 499 300 On demand Overnight + 1.07% 300 –
28.3 Fixed-rate loans – secured by investment property
2502 3 Apr 2018 10.27% 250 250 4902 3 Apr 2018 10.38% 490 490
740 2 492
675 1 795 1 Mar 2018 9.63% 675 675 705 233 7 Apr 2020 9.90% 70 76
2605 388 5 Aug 2023 12.68% 260 260 28.4 Australia
2 396 31 Dec 2017 BBSW* + 1.90% 1 850 1 841 2 396 31 Dec 2018 BBSW + 2.00% 1 850 1 841 2 302 31 Dec 2019 BBSW + 1.80% 630 1 294
658 31 Dec 2019 BBSW + 2.20% – – 940 30 Jun 2019 BBSW + 1.80% 725 160
– 30 Jun 2015 BBSW + 0.70% – 722 – 30 Apr 2016 BBSW + 2.20% – 471
1 879 15 Mar 2025 4.67% 1 451 –
10 571 21 442
28.5 Loans settled during the year600 30 Nov 2014 1m Jibar + 1.53% – 600 650 30 Nov 2014 1m Jibar + 1.53% – – 500 7 Jun 2015 3m Jibar + 1.55% – 500 500 29 Sep 2015 Prime – 1.85% – 500 500 31 Mar 2016 Prime – 2.00% – 500 740 31 Mar 2015 3m Jibar + 0.80% – 740 250 16 Sep 2014 3m Jibar + 1.41% – 250 400 4 Aug 2014 3m Jibar + 0.20% – 400 500 8 Dec 2014 3m Jibar + 1.56% – 500 750 25 Jan 2015 3m Jibar + 1.35% – 750
38 3 Dec 2018 9.86% – 38
Nominal value of long-term interest-bearing loans – carried forward 31 950 22 697
* BBSW: Bank Bill Swap Reference Rate
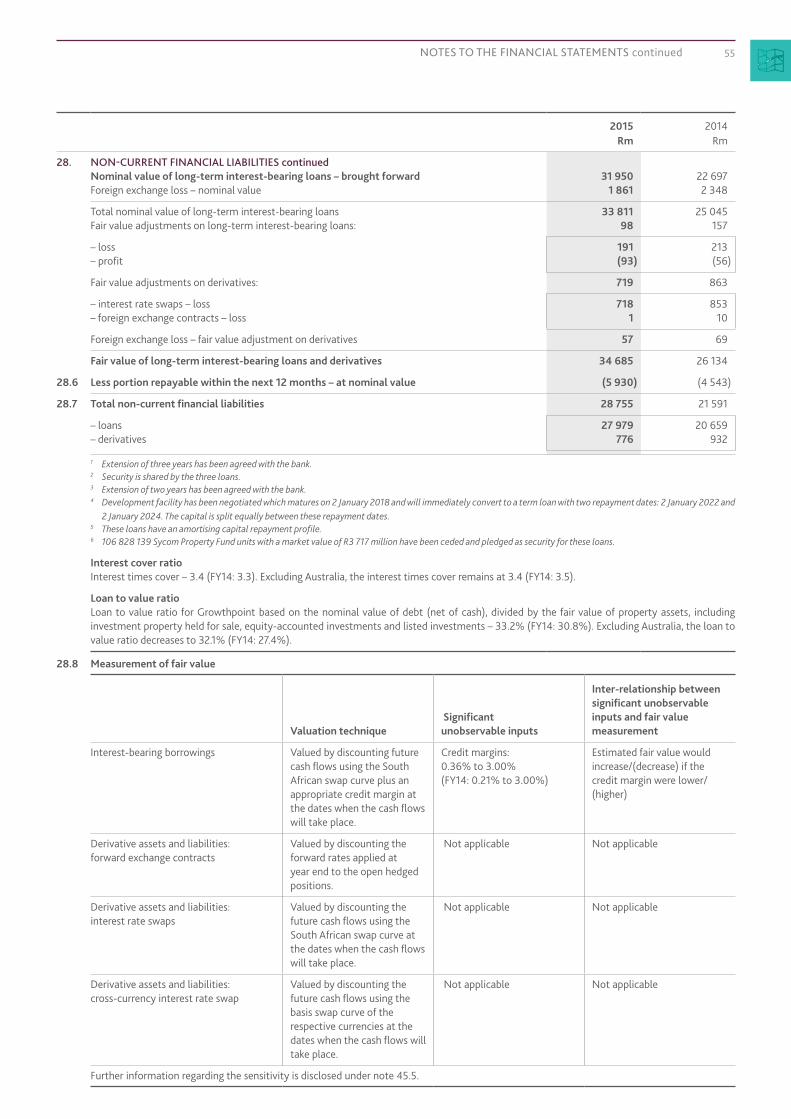
55NOTES TO THE FINANCIAL STATEMENTS continued
2015Rm
2014Rm
28. NON-CURRENT FINANCIAL LIABILITIES continuedNominal value of long-term interest-bearing loans – brought forward 31 950 22 697 Foreign exchange loss – nominal value 1 861 2 348
Total nominal value of long-term interest-bearing loans 33 811 25 045 Fair value adjustments on long-term interest-bearing loans: 98 157
– loss 191 213 – profit (93) (56)
Fair value adjustments on derivatives: 719 863
– interest rate swaps – loss 718 853 – foreign exchange contracts – loss 1 10
Foreign exchange loss – fair value adjustment on derivatives 57 69
Fair value of long-term interest-bearing loans and derivatives 34 685 26 134
28.6 Less portion repayable within the next 12 months – at nominal value (5 930) (4 543)
28.7 Total non-current financial liabilities 28 755 21 591
– loans 27 979 20 659 – derivatives 776 932
1 Extension of three years has been agreed with the bank.2 Security is shared by the three loans.3 Extension of two years has been agreed with the bank.4 Development facility has been negotiated which matures on 2 January 2018 and will immediately convert to a term loan with two repayment dates: 2 January 2022 and
2 January 2024. The capital is split equally between these repayment dates.5 These loans have an amortising capital repayment profile.6 106 828 139 Sycom Property Fund units with a market value of R3 717 million have been ceded and pledged as security for these loans.
Interest cover ratioInterest times cover – 3.4 (FY14: 3.3). Excluding Australia, the interest times cover remains at 3.4 (FY14: 3.5).
Loan to value ratioLoan to value ratio for Growthpoint based on the nominal value of debt (net of cash), divided by the fair value of property assets, including investment property held for sale, equity-accounted investments and listed investments – 33.2% (FY14: 30.8%). Excluding Australia, the loan to value ratio decreases to 32.1% (FY14: 27.4%).
28.8 Measurement of fair value
Valuation technique Significant unobservable inputs
Inter-relationship between significant unobservable inputs and fair value measurement
Interest-bearing borrowings Valued by discounting future cash flows using the South African swap curve plus an appropriate credit margin at the dates when the cash flows will take place.
Credit margins: 0.36% to 3.00%(FY14: 0.21% to 3.00%)
Estimated fair value would increase/(decrease) if the credit margin were lower/(higher)
Derivative assets and liabilities: forward exchange contracts
Valued by discounting the forward rates applied at year end to the open hedged positions.
Not applicable Not applicable
Derivative assets and liabilities: interest rate swaps
Valued by discounting the future cash flows using the South African swap curve at the dates when the cash flows will take place.
Not applicable Not applicable
Derivative assets and liabilities: cross-currency interest rate swap
Valued by discounting the future cash flows using the basis swap curve of the respective currencies at the dates when the cash flows will take place.
Not applicable Not applicable
Further information regarding the sensitivity is disclosed under note 45.5.
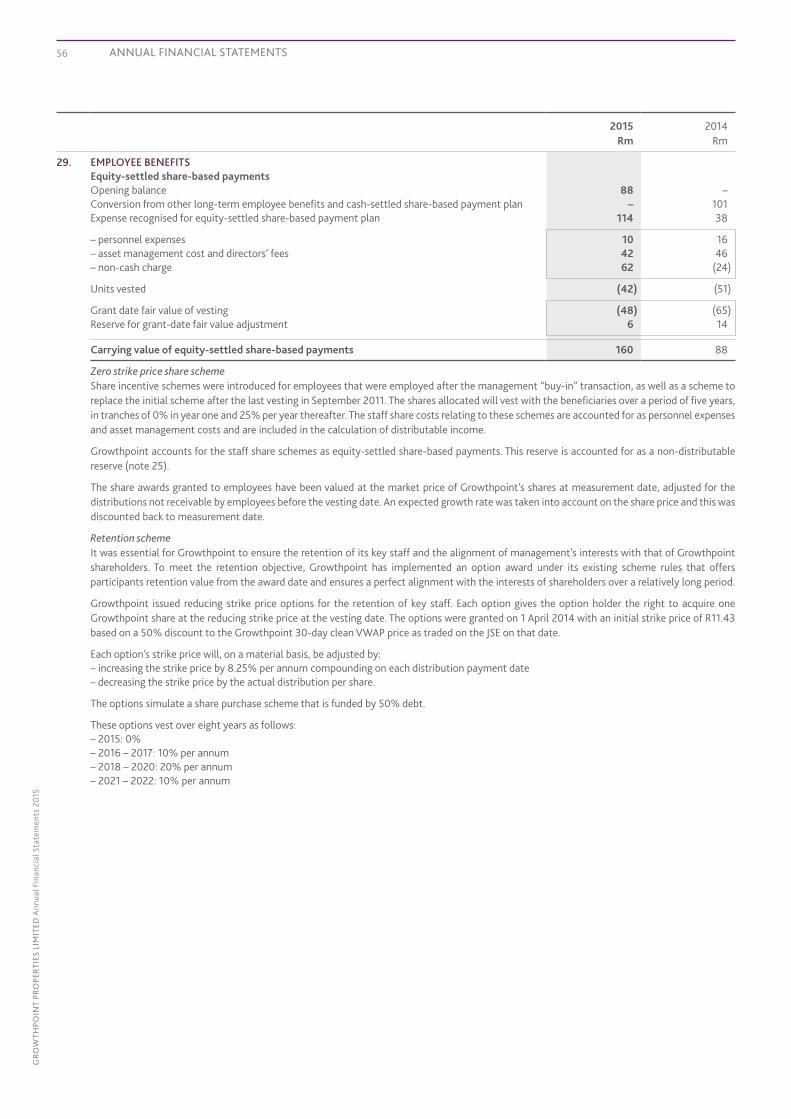
56 ANNUAL FINANCIAL STATEMENTS
GRO
WTH
POIN
T PR
OPE
RTIE
S LI
MIT
ED A
nnua
l Fin
anci
al S
tate
men
ts 2
015
2015Rm
2014Rm
29. EMPLOYEE BENEFITSEquity-settled share-based paymentsOpening balance 88 – Conversion from other long-term employee benefits and cash-settled share-based payment plan – 101 Expense recognised for equity-settled share-based payment plan 114 38
– personnel expenses 10 16 – asset management cost and directors’ fees 42 46 – non-cash charge 62 (24)
Units vested (42) (51)
Grant date fair value of vesting (48) (65)Reserve for grant-date fair value adjustment 6 14
Carrying value of equity-settled share-based payments 160 88
Zero strike price share schemeShare incentive schemes were introduced for employees that were employed after the management “buy-in” transaction, as well as a scheme to replace the initial scheme after the last vesting in September 2011. The shares allocated will vest with the beneficiaries over a period of five years, in tranches of 0% in year one and 25% per year thereafter. The staff share costs relating to these schemes are accounted for as personnel expenses and asset management costs and are included in the calculation of distributable income.
Growthpoint accounts for the staff share schemes as equity-settled share-based payments. This reserve is accounted for as a non-distributable reserve (note 25).
The share awards granted to employees have been valued at the market price of Growthpoint’s shares at measurement date, adjusted for the distributions not receivable by employees before the vesting date. An expected growth rate was taken into account on the share price and this was discounted back to measurement date.
Retention schemeIt was essential for Growthpoint to ensure the retention of its key staff and the alignment of management’s interests with that of Growthpoint shareholders. To meet the retention objective, Growthpoint has implemented an option award under its existing scheme rules that offers participants retention value from the award date and ensures a perfect alignment with the interests of shareholders over a relatively long period.
Growthpoint issued reducing strike price options for the retention of key staff. Each option gives the option holder the right to acquire one Growthpoint share at the reducing strike price at the vesting date. The options were granted on 1 April 2014 with an initial strike price of R11.43 based on a 50% discount to the Growthpoint 30-day clean VWAP price as traded on the JSE on that date.
Each option’s strike price will, on a material basis, be adjusted by:– increasing the strike price by 8.25% per annum compounding on each distribution payment date– decreasing the strike price by the actual distribution per share.
The options simulate a share purchase scheme that is funded by 50% debt.
These options vest over eight years as follows:– 2015: 0%– 2016 – 2017: 10% per annum– 2018 – 2020: 20% per annum– 2021 – 2022: 10% per annum
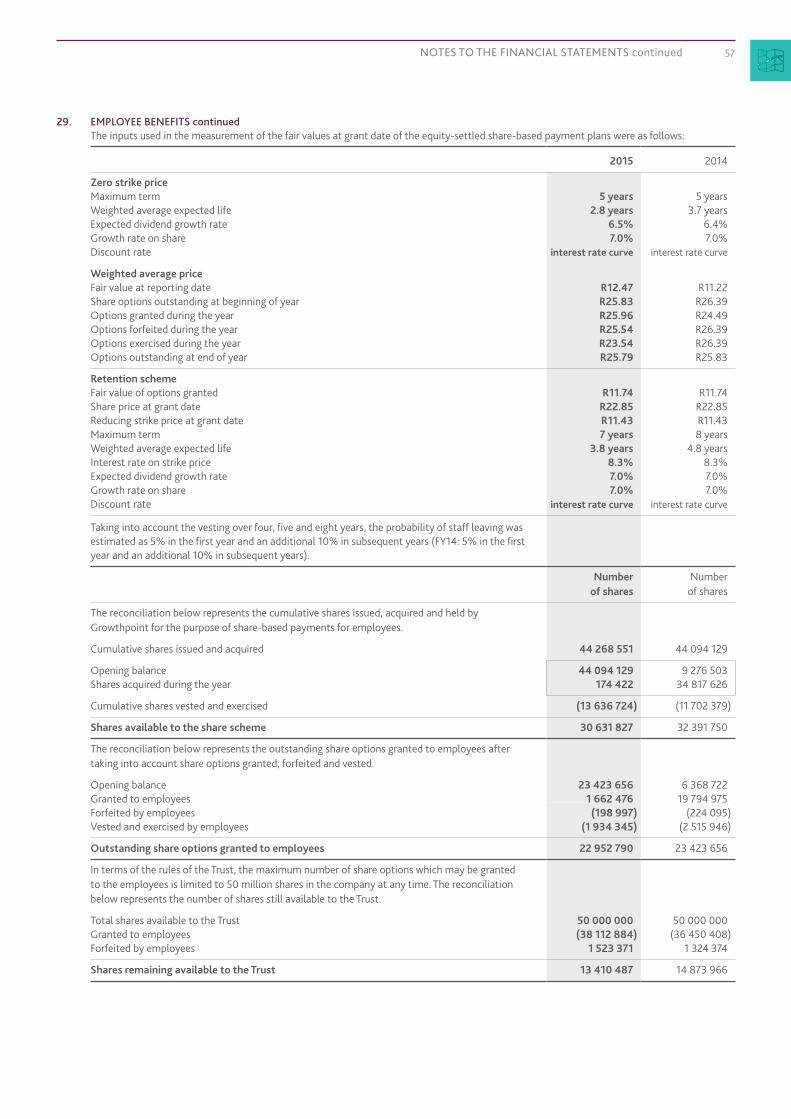
57NOTES TO THE FINANCIAL STATEMENTS continued
29. EMPLOYEE BENEFITS continuedThe inputs used in the measurement of the fair values at grant date of the equity-settled share-based payment plans were as follows:
2015 2014
Zero strike priceMaximum term 5 years 5 yearsWeighted average expected life 2.8 years 3.7 yearsExpected dividend growth rate 6.5% 6.4%Growth rate on share 7.0% 7.0%Discount rate interest rate curve interest rate curve
Weighted average priceFair value at reporting date R12.47 R11.22 Share options outstanding at beginning of year R25.83 R26.39 Options granted during the year R25.96 R24.49 Options forfeited during the year R25.54 R26.39Options exercised during the year R23.54 R26.39Options outstanding at end of year R25.79 R25.83
Retention schemeFair value of options granted R11.74 R11.74 Share price at grant date R22.85 R22.85Reducing strike price at grant date R11.43 R11.43Maximum term 7 years 8 yearsWeighted average expected life 3.8 years 4.8 yearsInterest rate on strike price 8.3% 8.3%Expected dividend growth rate 7.0% 7.0%Growth rate on share 7.0% 7.0%Discount rate interest rate curve interest rate curve
Taking into account the vesting over four, five and eight years, the probability of staff leaving was estimated as 5% in the first year and an additional 10% in subsequent years (FY14: 5% in the first year and an additional 10% in subsequent years).
Number of shares
Number of shares
The reconciliation below represents the cumulative shares issued, acquired and held by Growthpoint for the purpose of share-based payments for employees.
Cumulative shares issued and acquired 44 268 551 44 094 129
Opening balance 44 094 129 9 276 503 Shares acquired during the year 174 422 34 817 626
Cumulative shares vested and exercised (13 636 724) (11 702 379)
Shares available to the share scheme 30 631 827 32 391 750
The reconciliation below represents the outstanding share options granted to employees after taking into account share options granted, forfeited and vested.
Opening balance 23 423 656 6 368 722 Granted to employees 1 662 476 19 794 975 Forfeited by employees (198 997) (224 095) Vested and exercised by employees (1 934 345) (2 515 946)
Outstanding share options granted to employees 22 952 790 23 423 656
In terms of the rules of the Trust, the maximum number of share options which may be granted to the employees is limited to 50 million shares in the company at any time. The reconciliation below represents the number of shares still available to the Trust.
Total shares available to the Trust 50 000 000 50 000 000 Granted to employees (38 112 884) (36 450 408)Forfeited by employees 1 523 371 1 324 374
Shares remaining available to the Trust 13 410 487 14 873 966
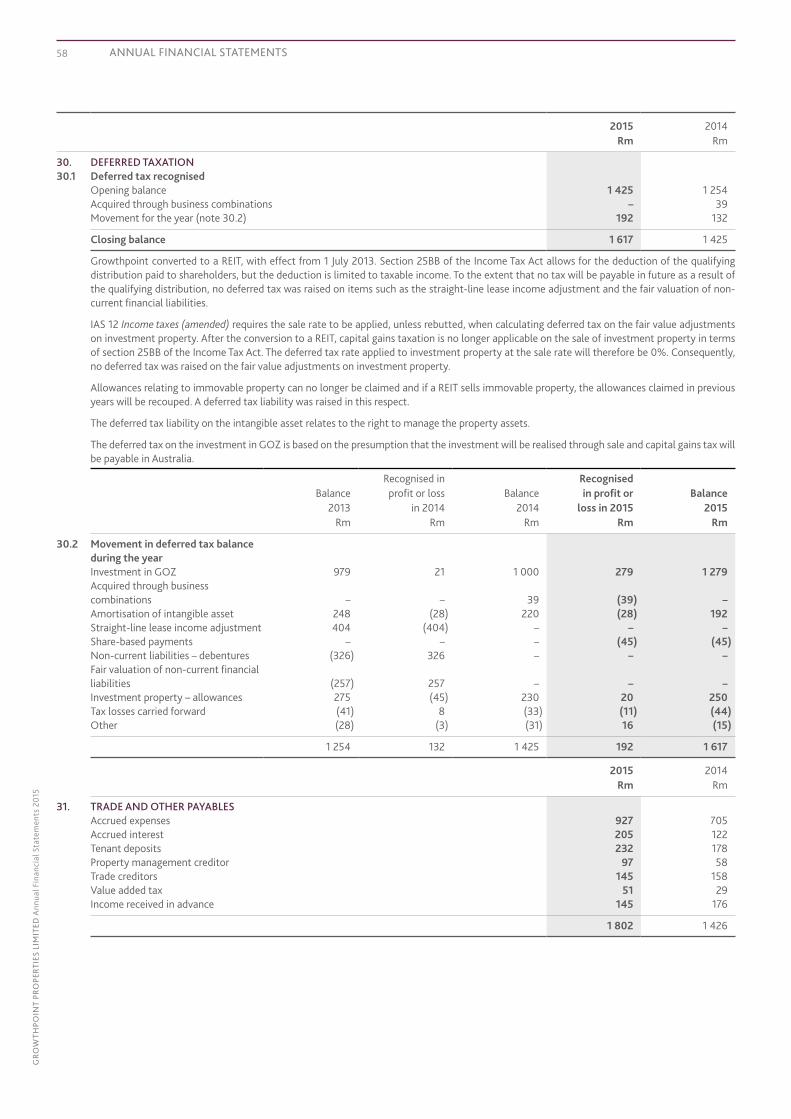
58 ANNUAL FINANCIAL STATEMENTS
GRO
WTH
POIN
T PR
OPE
RTIE
S LI
MIT
ED A
nnua
l Fin
anci
al S
tate
men
ts 2
015
2015Rm
2014Rm
30. DEFERRED TAXATION30.1 Deferred tax recognised
Opening balance 1 425 1 254Acquired through business combinations – 39Movement for the year (note 30.2) 192 132
Closing balance 1 617 1 425
Growthpoint converted to a REIT, with effect from 1 July 2013. Section 25BB of the Income Tax Act allows for the deduction of the qualifying distribution paid to shareholders, but the deduction is limited to taxable income. To the extent that no tax will be payable in future as a result of the qualifying distribution, no deferred tax was raised on items such as the straight-line lease income adjustment and the fair valuation of non- current financial liabilities.
IAS 12 Income taxes (amended) requires the sale rate to be applied, unless rebutted, when calculating deferred tax on the fair value adjustments on investment property. After the conversion to a REIT, capital gains taxation is no longer applicable on the sale of investment property in terms of section 25BB of the Income Tax Act. The deferred tax rate applied to investment property at the sale rate will therefore be 0%. Consequently, no deferred tax was raised on the fair value adjustments on investment property.
Allowances relating to immovable property can no longer be claimed and if a REIT sells immovable property, the allowances claimed in previous years will be recouped. A deferred tax liability was raised in this respect.
The deferred tax liability on the intangible asset relates to the right to manage the property assets.
The deferred tax on the investment in GOZ is based on the presumption that the investment will be realised through sale and capital gains tax will be payable in Australia.
Balance 2013
Rm
Recognised in profit or loss
in 2014Rm
Balance 2014
Rm
Recognised in profit or
loss in 2015 Rm
Balance 2015
Rm
30.2 Movement in deferred tax balance during the yearInvestment in GOZ 979 21 1 000 279 1 279 Acquired through business combinations – – 39 (39) – Amortisation of intangible asset 248 (28) 220 (28) 192 Straight-line lease income adjustment 404 (404) – – – Share-based payments – – – (45) (45)Non-current liabilities – debentures (326) 326 – – – Fair valuation of non-current financial liabilities (257) 257 – – – Investment property – allowances 275 (45) 230 20 250 Tax losses carried forward (41) 8 (33) (11) (44)Other (28) (3) (31) 16 (15)
1 254 132 1 425 192 1 617
2015Rm
2014Rm
31. TRADE AND OTHER PAYABLESAccrued expenses 927 705 Accrued interest 205 122 Tenant deposits 232 178 Property management creditor 97 58 Trade creditors 145 158 Value added tax 51 29 Income received in advance 145 176
1 802 1 426
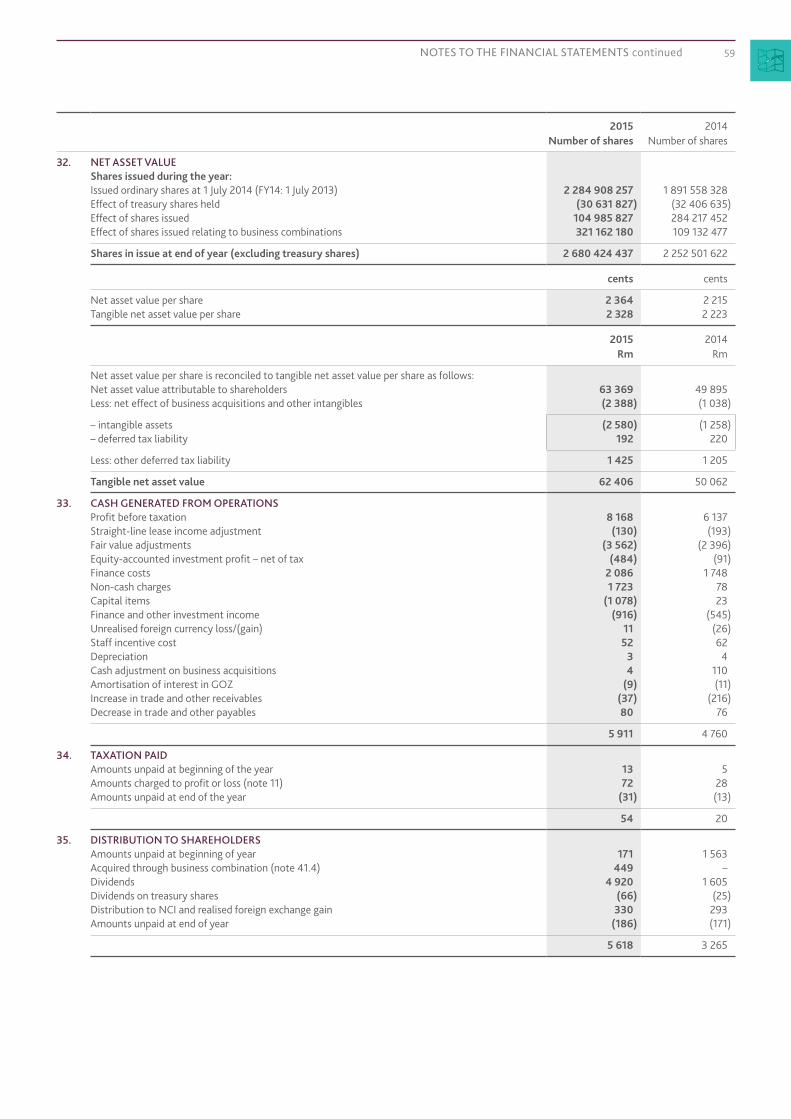
59NOTES TO THE FINANCIAL STATEMENTS continued
2015Number of shares
2014Number of shares
32. NET ASSET VALUEShares issued during the year:Issued ordinary shares at 1 July 2014 (FY14: 1 July 2013) 2 284 908 257 1 891 558 328Effect of treasury shares held (30 631 827) (32 406 635)Effect of shares issued 104 985 827 284 217 452Effect of shares issued relating to business combinations 321 162 180 109 132 477
Shares in issue at end of year (excluding treasury shares) 2 680 424 437 2 252 501 622
cents cents
Net asset value per share 2 364 2 215Tangible net asset value per share 2 328 2 223
2015Rm
2014Rm
Net asset value per share is reconciled to tangible net asset value per share as follows:Net asset value attributable to shareholders 63 369 49 895 Less: net effect of business acquisitions and other intangibles (2 388) (1 038)
– intangible assets (2 580) (1 258)– deferred tax liability 192 220
Less: other deferred tax liability 1 425 1 205
Tangible net asset value 62 406 50 062
33. CASH GENERATED FROM OPERATIONSProfit before taxation 8 168 6 137 Straight-line lease income adjustment (130) (193)Fair value adjustments (3 562) (2 396)Equity-accounted investment profit – net of tax (484) (91)Finance costs 2 086 1 748 Non-cash charges 1 723 78 Capital items (1 078) 23 Finance and other investment income (916) (545)Unrealised foreign currency loss/(gain) 11 (26)Staff incentive cost 52 62 Depreciation 3 4 Cash adjustment on business acquisitions 4 110 Amortisation of interest in GOZ (9) (11)Increase in trade and other receivables (37) (216)Decrease in trade and other payables 80 76
5 911 4 760
34. TAXATION PAIDAmounts unpaid at beginning of the year 13 5 Amounts charged to profit or loss (note 11) 72 28 Amounts unpaid at end of the year (31) (13)
54 20
35. DISTRIBUTION TO SHAREHOLDERSAmounts unpaid at beginning of year 171 1 563 Acquired through business combination (note 41.4) 449 – Dividends 4 920 1 605 Dividends on treasury shares (66) (25)Distribution to NCI and realised foreign exchange gain 330 293 Amounts unpaid at end of year (186) (171)
5 618 3 265
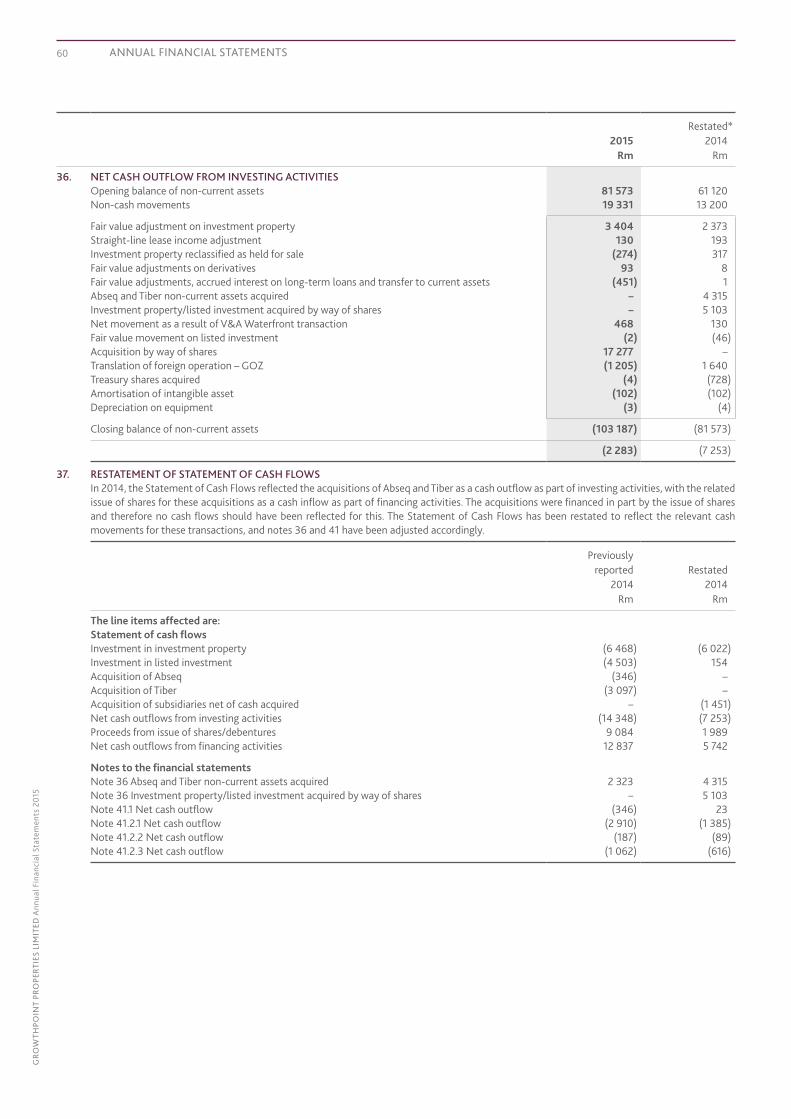
60 ANNUAL FINANCIAL STATEMENTS
GRO
WTH
POIN
T PR
OPE
RTIE
S LI
MIT
ED A
nnua
l Fin
anci
al S
tate
men
ts 2
015
2015Rm
Restated*2014
Rm
36. NET CASH OUTFLOW FROM INVESTING ACTIVITIESOpening balance of non-current assets 81 573 61 120 Non-cash movements 19 331 13 200
Fair value adjustment on investment property 3 404 2 373 Straight-line lease income adjustment 130 193 Investment property reclassified as held for sale (274) 317 Fair value adjustments on derivatives 93 8 Fair value adjustments, accrued interest on long-term loans and transfer to current assets (451) 1 Abseq and Tiber non-current assets acquired – 4 315Investment property/listed investment acquired by way of shares – 5 103Net movement as a result of V&A Waterfront transaction 468 130 Fair value movement on listed investment (2) (46)Acquisition by way of shares 17 277 –Translation of foreign operation – GOZ (1 205) 1 640 Treasury shares acquired (4) (728)Amortisation of intangible asset (102) (102)Depreciation on equipment (3) (4)
Closing balance of non-current assets (103 187) (81 573)
(2 283) (7 253)
37. RESTATEMENT OF STATEMENT OF CASH FLOWSIn 2014, the Statement of Cash Flows reflected the acquisitions of Abseq and Tiber as a cash outflow as part of investing activities, with the related issue of shares for these acquisitions as a cash inflow as part of financing activities. The acquisitions were financed in part by the issue of shares and therefore no cash flows should have been reflected for this. The Statement of Cash Flows has been restated to reflect the relevant cash movements for these transactions, and notes 36 and 41 have been adjusted accordingly.
Previously reported
2014Rm
Restated2014
Rm
The line items affected are:Statement of cash flowsInvestment in investment property (6 468) (6 022) Investment in listed investment (4 503) 154 Acquisition of Abseq (346) – Acquisition of Tiber (3 097) –Acquisition of subsidiaries net of cash acquired – (1 451)Net cash outflows from investing activities (14 348) (7 253) Proceeds from issue of shares/debentures 9 084 1 989 Net cash outflows from financing activities 12 837 5 742
Notes to the financial statementsNote 36 Abseq and Tiber non-current assets acquired 2 323 4 315 Note 36 Investment property/listed investment acquired by way of shares – 5 103 Note 41.1 Net cash outflow (346) 23 Note 41.2.1 Net cash outflow (2 910) (1 385) Note 41.2.2 Net cash outflow (187) (89)Note 41.2.3 Net cash outflow (1 062) (616)
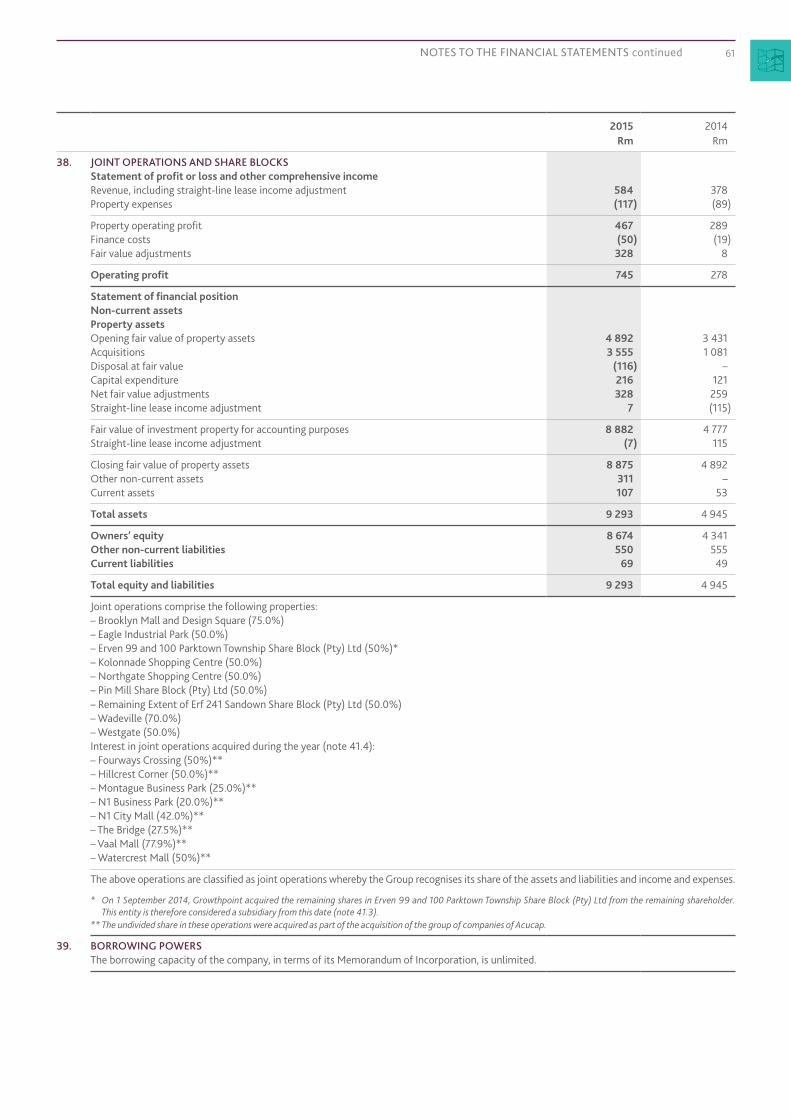
61NOTES TO THE FINANCIAL STATEMENTS continued
2015Rm
2014Rm
38. JOINT OPERATIONS AND SHARE BLOCKSStatement of profit or loss and other comprehensive income Revenue, including straight-line lease income adjustment 584 378 Property expenses (117) (89)
Property operating profit 467 289 Finance costs (50) (19)Fair value adjustments 328 8
Operating profit 745 278
Statement of financial positionNon-current assetsProperty assetsOpening fair value of property assets 4 892 3 431 Acquisitions 3 555 1 081 Disposal at fair value (116) –Capital expenditure 216 121 Net fair value adjustments 328 259 Straight-line lease income adjustment 7 (115)
Fair value of investment property for accounting purposes 8 882 4 777 Straight-line lease income adjustment (7) 115
Closing fair value of property assets 8 875 4 892 Other non-current assets 311 –Current assets 107 53
Total assets 9 293 4 945
Owners’ equity 8 674 4 341 Other non-current liabilities 550 555 Current liabilities 69 49
Total equity and liabilities 9 293 4 945
Joint operations comprise the following properties:– Brooklyn Mall and Design Square (75.0%) – Eagle Industrial Park (50.0%)– Erven 99 and 100 Parktown Township Share Block (Pty) Ltd (50%)*– Kolonnade Shopping Centre (50.0%)– Northgate Shopping Centre (50.0%)– Pin Mill Share Block (Pty) Ltd (50.0%)– Remaining Extent of Erf 241 Sandown Share Block (Pty) Ltd (50.0%)– Wadeville (70.0%)– Westgate (50.0%)Interest in joint operations acquired during the year (note 41.4):– Fourways Crossing (50%)**– Hillcrest Corner (50.0%)**– Montague Business Park (25.0%)**– N1 Business Park (20.0%)**– N1 City Mall (42.0%)**– The Bridge (27.5%)**– Vaal Mall (77.9%)**– Watercrest Mall (50%)**
The above operations are classified as joint operations whereby the Group recognises its share of the assets and liabilities and income and expenses.
* On 1 September 2014, Growthpoint acquired the remaining shares in Erven 99 and 100 Parktown Township Share Block (Pty) Ltd from the remaining shareholder. This entity is therefore considered a subsidiary from this date (note 41.3).
** The undivided share in these operations were acquired as part of the acquisition of the group of companies of Acucap.
39. BORROWING POWERS The borrowing capacity of the company, in terms of its Memorandum of Incorporation, is unlimited.
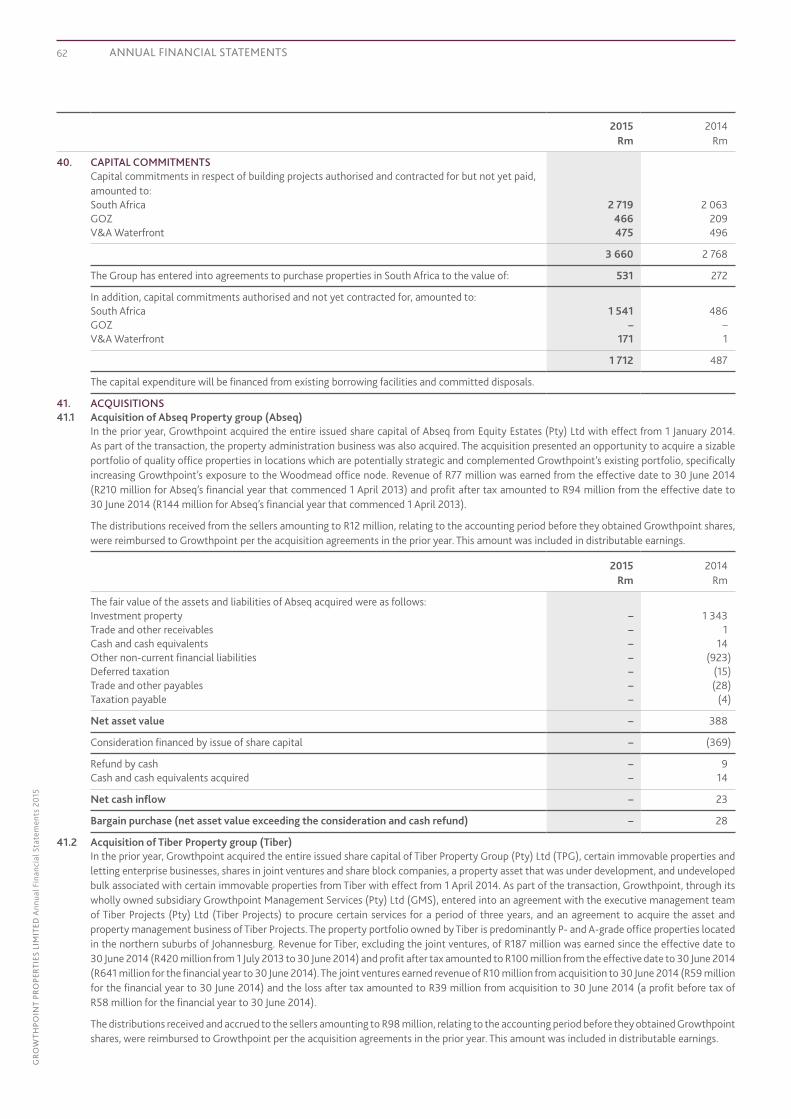
62 ANNUAL FINANCIAL STATEMENTS
GRO
WTH
POIN
T PR
OPE
RTIE
S LI
MIT
ED A
nnua
l Fin
anci
al S
tate
men
ts 2
015
2015Rm
2014Rm
40. CAPITAL COMMITMENTS Capital commitments in respect of building projects authorised and contracted for but not yet paid, amounted to: South Africa 2 719 2 063 GOZ 466 209 V&A Waterfront 475 496
3 660 2 768
The Group has entered into agreements to purchase properties in South Africa to the value of: 531 272
In addition, capital commitments authorised and not yet contracted for, amounted to:South Africa 1 541 486 GOZ – – V&A Waterfront 171 1
1 712 487
The capital expenditure will be financed from existing borrowing facilities and committed disposals.
41. ACQUISITIONS41.1 Acquisition of Abseq Property group (Abseq)
In the prior year, Growthpoint acquired the entire issued share capital of Abseq from Equity Estates (Pty) Ltd with effect from 1 January 2014. As part of the transaction, the property administration business was also acquired. The acquisition presented an opportunity to acquire a sizable portfolio of quality office properties in locations which are potentially strategic and complemented Growthpoint’s existing portfolio, specifically increasing Growthpoint’s exposure to the Woodmead office node. Revenue of R77 million was earned from the effective date to 30 June 2014 (R210 million for Abseq’s financial year that commenced 1 April 2013) and profit after tax amounted to R94 million from the effective date to 30 June 2014 (R144 million for Abseq’s financial year that commenced 1 April 2013).
The distributions received from the sellers amounting to R12 million, relating to the accounting period before they obtained Growthpoint shares, were reimbursed to Growthpoint per the acquisition agreements in the prior year. This amount was included in distributable earnings.
2015Rm
2014Rm
The fair value of the assets and liabilities of Abseq acquired were as follows:Investment property – 1 343Trade and other receivables – 1Cash and cash equivalents – 14Other non-current financial liabilities – (923)Deferred taxation – (15)Trade and other payables – (28)Taxation payable – (4)
Net asset value – 388
Consideration financed by issue of share capital – (369)
Refund by cash – 9Cash and cash equivalents acquired – 14
Net cash inflow – 23
Bargain purchase (net asset value exceeding the consideration and cash refund) – 28
41.2 Acquisition of Tiber Property group (Tiber)In the prior year, Growthpoint acquired the entire issued share capital of Tiber Property Group (Pty) Ltd (TPG), certain immovable properties and letting enterprise businesses, shares in joint ventures and share block companies, a property asset that was under development, and undeveloped bulk associated with certain immovable properties from Tiber with effect from 1 April 2014. As part of the transaction, Growthpoint, through its wholly owned subsidiary Growthpoint Management Services (Pty) Ltd (GMS), entered into an agreement with the executive management team of Tiber Projects (Pty) Ltd (Tiber Projects) to procure certain services for a period of three years, and an agreement to acquire the asset and property management business of Tiber Projects. The property portfolio owned by Tiber is predominantly P- and A-grade office properties located in the northern suburbs of Johannesburg. Revenue for Tiber, excluding the joint ventures, of R187 million was earned since the effective date to 30 June 2014 (R420 million from 1 July 2013 to 30 June 2014) and profit after tax amounted to R100 million from the effective date to 30 June 2014 (R641 million for the financial year to 30 June 2014). The joint ventures earned revenue of R10 million from acquisition to 30 June 2014 (R59 million for the financial year to 30 June 2014) and the loss after tax amounted to R39 million from acquisition to 30 June 2014 (a profit before tax of R58 million for the financial year to 30 June 2014).
The distributions received and accrued to the sellers amounting to R98 million, relating to the accounting period before they obtained Growthpoint shares, were reimbursed to Growthpoint per the acquisition agreements in the prior year. This amount was included in distributable earnings.
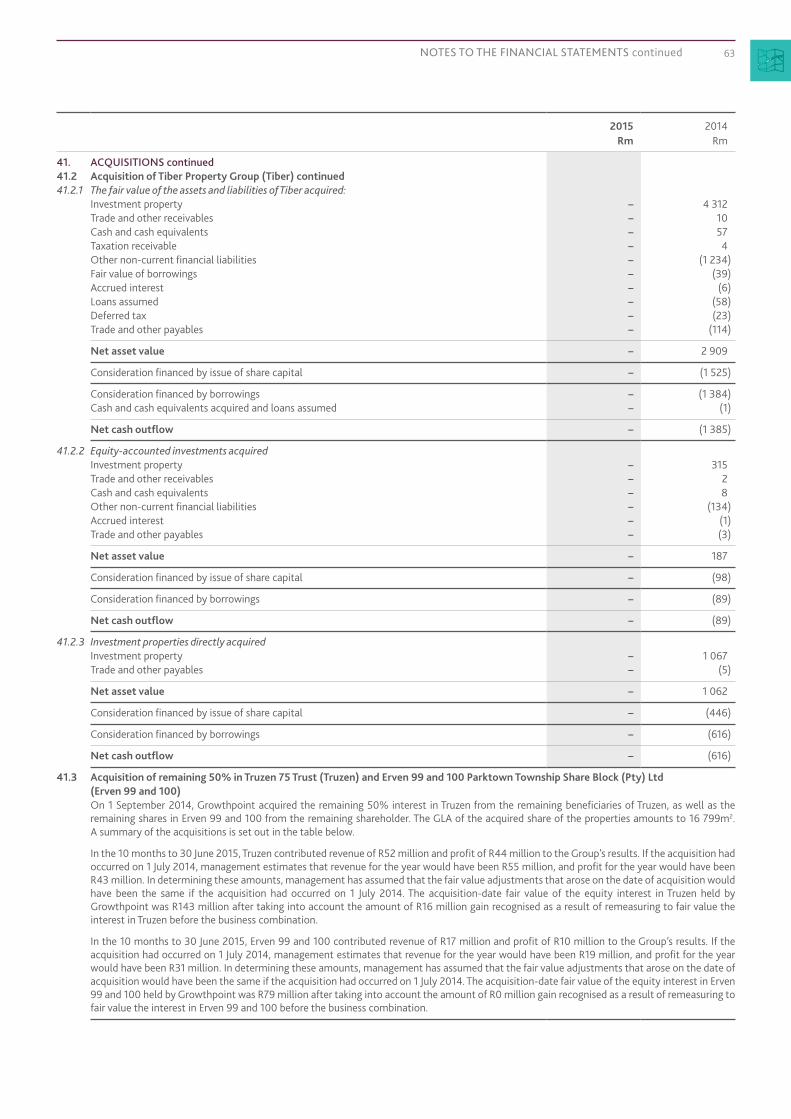
63NOTES TO THE FINANCIAL STATEMENTS continued
2015Rm
2014Rm
41. ACQUISITIONS continued41.2 Acquisition of Tiber Property Group (Tiber) continued41.2.1 The fair value of the assets and liabilities of Tiber acquired:
Investment property – 4 312 Trade and other receivables – 10 Cash and cash equivalents – 57 Taxation receivable – 4 Other non-current financial liabilities – (1 234)Fair value of borrowings – (39)Accrued interest – (6)Loans assumed – (58)Deferred tax – (23)Trade and other payables – (114)
Net asset value – 2 909
Consideration financed by issue of share capital – (1 525)
Consideration financed by borrowings – (1 384)Cash and cash equivalents acquired and loans assumed – (1)
Net cash outflow – (1 385)
41.2.2 Equity-accounted investments acquiredInvestment property – 315 Trade and other receivables – 2 Cash and cash equivalents – 8 Other non-current financial liabilities – (134)Accrued interest – (1)Trade and other payables – (3)
Net asset value – 187
Consideration financed by issue of share capital – (98)
Consideration financed by borrowings – (89)
Net cash outflow – (89)
41.2.3 Investment properties directly acquiredInvestment property – 1 067 Trade and other payables – (5)
Net asset value – 1 062
Consideration financed by issue of share capital – (446)
Consideration financed by borrowings – (616)
Net cash outflow – (616)
41.3 Acquisition of remaining 50% in Truzen 75 Trust (Truzen) and Erven 99 and 100 Parktown Township Share Block (Pty) Ltd (Erven 99 and 100)On 1 September 2014, Growthpoint acquired the remaining 50% interest in Truzen from the remaining beneficiaries of Truzen, as well as the remaining shares in Erven 99 and 100 from the remaining shareholder. The GLA of the acquired share of the properties amounts to 16 799m2. A summary of the acquisitions is set out in the table below.
In the 10 months to 30 June 2015, Truzen contributed revenue of R52 million and profit of R44 million to the Group’s results. If the acquisition had occurred on 1 July 2014, management estimates that revenue for the year would have been R55 million, and profit for the year would have been R43 million. In determining these amounts, management has assumed that the fair value adjustments that arose on the date of acquisition would have been the same if the acquisition had occurred on 1 July 2014. The acquisition-date fair value of the equity interest in Truzen held by Growthpoint was R143 million after taking into account the amount of R16 million gain recognised as a result of remeasuring to fair value the interest in Truzen before the business combination.
In the 10 months to 30 June 2015, Erven 99 and 100 contributed revenue of R17 million and profit of R10 million to the Group’s results. If the acquisition had occurred on 1 July 2014, management estimates that revenue for the year would have been R19 million, and profit for the year would have been R31 million. In determining these amounts, management has assumed that the fair value adjustments that arose on the date of acquisition would have been the same if the acquisition had occurred on 1 July 2014. The acquisition-date fair value of the equity interest in Erven 99 and 100 held by Growthpoint was R79 million after taking into account the amount of R0 million gain recognised as a result of remeasuring to fair value the interest in Erven 99 and 100 before the business combination.
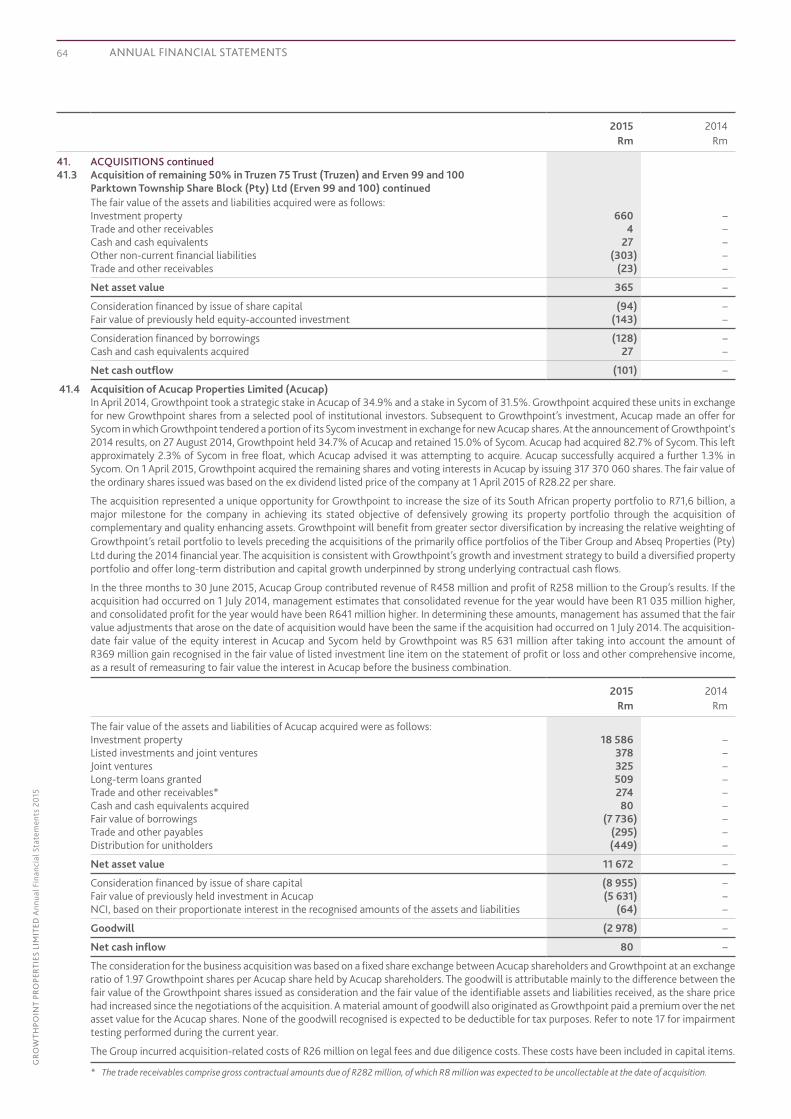
64 ANNUAL FINANCIAL STATEMENTS
GRO
WTH
POIN
T PR
OPE
RTIE
S LI
MIT
ED A
nnua
l Fin
anci
al S
tate
men
ts 2
015
2015Rm
2014Rm
41. ACQUISITIONS continued41.3 Acquisition of remaining 50% in Truzen 75 Trust (Truzen) and Erven 99 and 100
Parktown Township Share Block (Pty) Ltd (Erven 99 and 100) continuedThe fair value of the assets and liabilities acquired were as follows:Investment property 660 – Trade and other receivables 4 – Cash and cash equivalents 27 – Other non-current financial liabilities (303) – Trade and other receivables (23) –
Net asset value 365 –
Consideration financed by issue of share capital (94) – Fair value of previously held equity-accounted investment (143) –
Consideration financed by borrowings (128) – Cash and cash equivalents acquired 27 –
Net cash outflow (101) –
41.4 Acquisition of Acucap Properties Limited (Acucap)In April 2014, Growthpoint took a strategic stake in Acucap of 34.9% and a stake in Sycom of 31.5%. Growthpoint acquired these units in exchange for new Growthpoint shares from a selected pool of institutional investors. Subsequent to Growthpoint’s investment, Acucap made an offer for Sycom in which Growthpoint tendered a portion of its Sycom investment in exchange for new Acucap shares. At the announcement of Growthpoint‘s 2014 results, on 27 August 2014, Growthpoint held 34.7% of Acucap and retained 15.0% of Sycom. Acucap had acquired 82.7% of Sycom. This left approximately 2.3% of Sycom in free float, which Acucap advised it was attempting to acquire. Acucap successfully acquired a further 1.3% in Sycom. On 1 April 2015, Growthpoint acquired the remaining shares and voting interests in Acucap by issuing 317 370 060 shares. The fair value of the ordinary shares issued was based on the ex dividend listed price of the company at 1 April 2015 of R28.22 per share.
The acquisition represented a unique opportunity for Growthpoint to increase the size of its South African property portfolio to R71,6 billion, a major milestone for the company in achieving its stated objective of defensively growing its property portfolio through the acquisition of complementary and quality enhancing assets. Growthpoint will benefit from greater sector diversification by increasing the relative weighting of Growthpoint’s retail portfolio to levels preceding the acquisitions of the primarily office portfolios of the Tiber Group and Abseq Properties (Pty) Ltd during the 2014 financial year. The acquisition is consistent with Growthpoint’s growth and investment strategy to build a diversified property portfolio and offer long-term distribution and capital growth underpinned by strong underlying contractual cash flows.
In the three months to 30 June 2015, Acucap Group contributed revenue of R458 million and profit of R258 million to the Group’s results. If the acquisition had occurred on 1 July 2014, management estimates that consolidated revenue for the year would have been R1 035 million higher, and consolidated profit for the year would have been R641 million higher. In determining these amounts, management has assumed that the fair value adjustments that arose on the date of acquisition would have been the same if the acquisition had occurred on 1 July 2014. The acquisition-date fair value of the equity interest in Acucap and Sycom held by Growthpoint was R5 631 million after taking into account the amount of R369 million gain recognised in the fair value of listed investment line item on the statement of profit or loss and other comprehensive income, as a result of remeasuring to fair value the interest in Acucap before the business combination.
2015Rm
2014Rm
The fair value of the assets and liabilities of Acucap acquired were as follows:Investment property 18 586 – Listed investments and joint ventures 378 – Joint ventures 325 – Long-term loans granted 509 – Trade and other receivables* 274 – Cash and cash equivalents acquired 80 – Fair value of borrowings (7 736) – Trade and other payables (295) – Distribution for unitholders (449) –
Net asset value 11 672 –
Consideration financed by issue of share capital (8 955) – Fair value of previously held investment in Acucap (5 631) –NCI, based on their proportionate interest in the recognised amounts of the assets and liabilities (64) –
Goodwill (2 978) –
Net cash inflow 80 –
The consideration for the business acquisition was based on a fixed share exchange between Acucap shareholders and Growthpoint at an exchange ratio of 1.97 Growthpoint shares per Acucap share held by Acucap shareholders. The goodwill is attributable mainly to the difference between the fair value of the Growthpoint shares issued as consideration and the fair value of the identifiable assets and liabilities received, as the share price had increased since the negotiations of the acquisition. A material amount of goodwill also originated as Growthpoint paid a premium over the net asset value for the Acucap shares. None of the goodwill recognised is expected to be deductible for tax purposes. Refer to note 17 for impairment testing performed during the current year.
The Group incurred acquisition-related costs of R26 million on legal fees and due diligence costs. These costs have been included in capital items.
* The trade receivables comprise gross contractual amounts due of R282 million, of which R8 million was expected to be uncollectable at the date of acquisition.
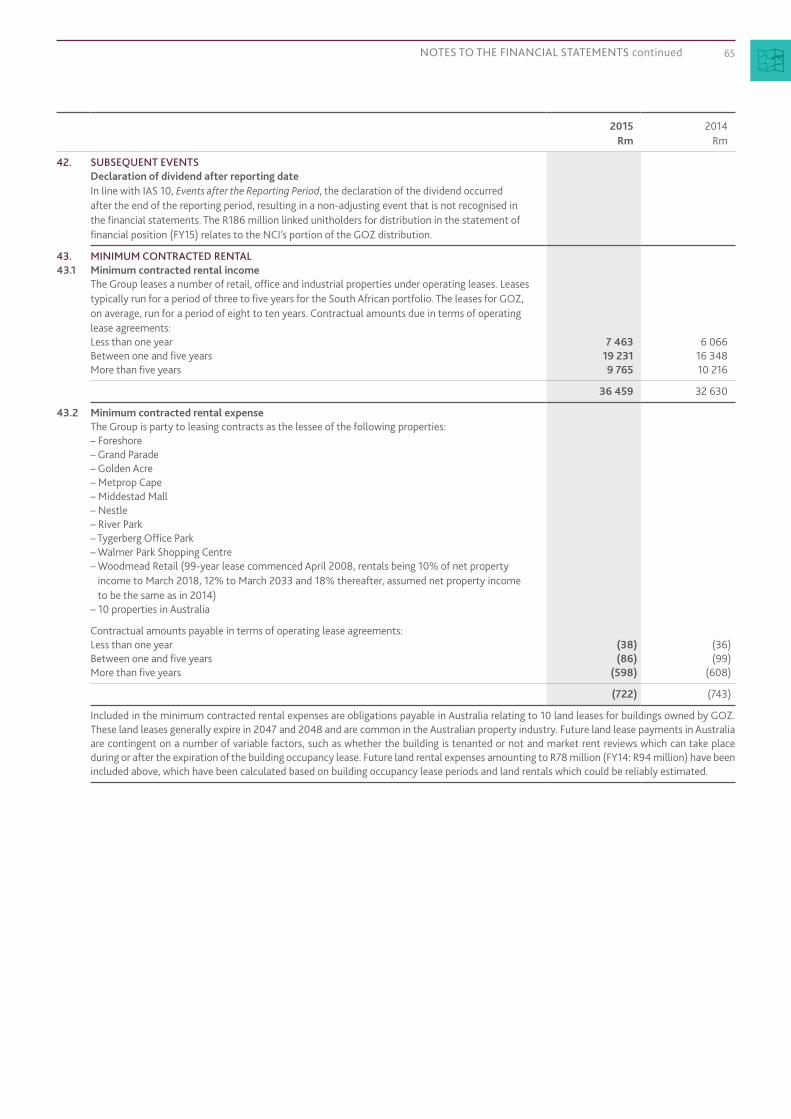
65NOTES TO THE FINANCIAL STATEMENTS continued
2015Rm
2014Rm
42. SUBSEQUENT EVENTSDeclaration of dividend after reporting dateIn line with IAS 10, Events after the Reporting Period, the declaration of the dividend occurred after the end of the reporting period, resulting in a non-adjusting event that is not recognised in the financial statements. The R186 million linked unitholders for distribution in the statement of financial position (FY15) relates to the NCI’s portion of the GOZ distribution.
43. MINIMUM CONTRACTED RENTAL43.1 Minimum contracted rental income
The Group leases a number of retail, office and industrial properties under operating leases. Leases typically run for a period of three to five years for the South African portfolio. The leases for GOZ, on average, run for a period of eight to ten years. Contractual amounts due in terms of operating lease agreements:Less than one year 7 463 6 066 Between one and five years 19 231 16 348 More than five years 9 765 10 216
36 459 32 630
43.2 Minimum contracted rental expense The Group is party to leasing contracts as the lessee of the following properties: – Foreshore– Grand Parade – Golden Acre– Metprop Cape– Middestad Mall– Nestle– River Park– Tygerberg Office Park– Walmer Park Shopping Centre– Woodmead Retail (99-year lease commenced April 2008, rentals being 10% of net property
income to March 2018, 12% to March 2033 and 18% thereafter, assumed net property income to be the same as in 2014)
– 10 properties in Australia
Contractual amounts payable in terms of operating lease agreements:Less than one year (38) (36)Between one and five years (86) (99)More than five years (598) (608)
(722) (743)
Included in the minimum contracted rental expenses are obligations payable in Australia relating to 10 land leases for buildings owned by GOZ. These land leases generally expire in 2047 and 2048 and are common in the Australian property industry. Future land lease payments in Australia are contingent on a number of variable factors, such as whether the building is tenanted or not and market rent reviews which can take place during or after the expiration of the building occupancy lease. Future land rental expenses amounting to R78 million (FY14: R94 million) have been included above, which have been calculated based on building occupancy lease periods and land rentals which could be reliably estimated.
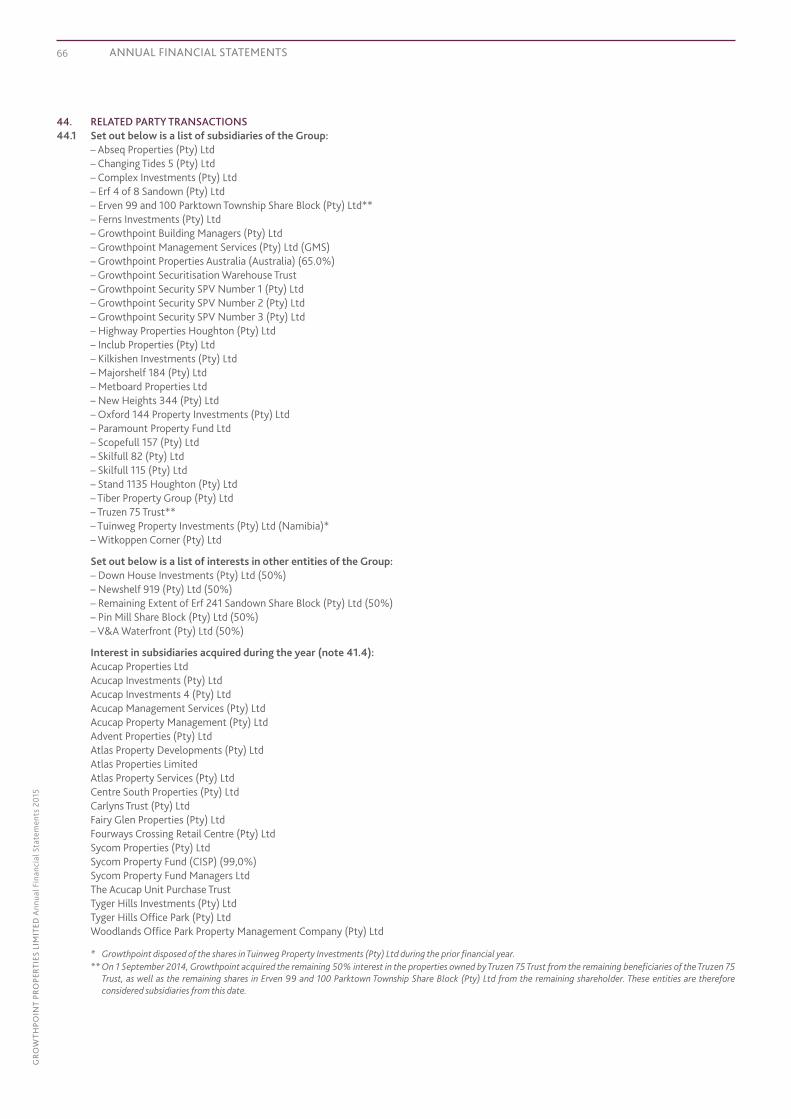
66 ANNUAL FINANCIAL STATEMENTS
GRO
WTH
POIN
T PR
OPE
RTIE
S LI
MIT
ED A
nnua
l Fin
anci
al S
tate
men
ts 2
015
44. RELATED PARTY TRANSACTIONS 44.1 Set out below is a list of subsidiaries of the Group:
– Abseq Properties (Pty) Ltd– Changing Tides 5 (Pty) Ltd– Complex Investments (Pty) Ltd– Erf 4 of 8 Sandown (Pty) Ltd– Erven 99 and 100 Parktown Township Share Block (Pty) Ltd**– Ferns Investments (Pty) Ltd– Growthpoint Building Managers (Pty) Ltd– Growthpoint Management Services (Pty) Ltd (GMS)– Growthpoint Properties Australia (Australia) (65.0%)– Growthpoint Securitisation Warehouse Trust– Growthpoint Security SPV Number 1 (Pty) Ltd– Growthpoint Security SPV Number 2 (Pty) Ltd– Growthpoint Security SPV Number 3 (Pty) Ltd– Highway Properties Houghton (Pty) Ltd– Inclub Properties (Pty) Ltd– Kilkishen Investments (Pty) Ltd– Majorshelf 184 (Pty) Ltd– Metboard Properties Ltd– New Heights 344 (Pty) Ltd– Oxford 144 Property Investments (Pty) Ltd– Paramount Property Fund Ltd– Scopefull 157 (Pty) Ltd– Skilfull 82 (Pty) Ltd– Skilfull 115 (Pty) Ltd– Stand 1135 Houghton (Pty) Ltd– Tiber Property Group (Pty) Ltd– Truzen 75 Trust**– Tuinweg Property Investments (Pty) Ltd (Namibia)*– Witkoppen Corner (Pty) Ltd
Set out below is a list of interests in other entities of the Group:– Down House Investments (Pty) Ltd (50%)– Newshelf 919 (Pty) Ltd (50%)– Remaining Extent of Erf 241 Sandown Share Block (Pty) Ltd (50%)– Pin Mill Share Block (Pty) Ltd (50%)– V&A Waterfront (Pty) Ltd (50%)
Interest in subsidiaries acquired during the year (note 41.4):Acucap Properties LtdAcucap Investments (Pty) LtdAcucap Investments 4 (Pty) LtdAcucap Management Services (Pty) LtdAcucap Property Management (Pty) LtdAdvent Properties (Pty) LtdAtlas Property Developments (Pty) LtdAtlas Properties LimitedAtlas Property Services (Pty) LtdCentre South Properties (Pty) LtdCarlyns Trust (Pty) LtdFairy Glen Properties (Pty) LtdFourways Crossing Retail Centre (Pty) LtdSycom Properties (Pty) LtdSycom Property Fund (CISP) (99,0%)Sycom Property Fund Managers LtdThe Acucap Unit Purchase TrustTyger Hills Investments (Pty) LtdTyger Hills Office Park (Pty) LtdWoodlands Office Park Property Management Company (Pty) Ltd
* Growthpoint disposed of the shares in Tuinweg Property Investments (Pty) Ltd during the prior financial year.** On 1 September 2014, Growthpoint acquired the remaining 50% interest in the properties owned by Truzen 75 Trust from the remaining beneficiaries of the Truzen 75
Trust, as well as the remaining shares in Erven 99 and 100 Parktown Township Share Block (Pty) Ltd from the remaining shareholder. These entities are therefore considered subsidiaries from this date.
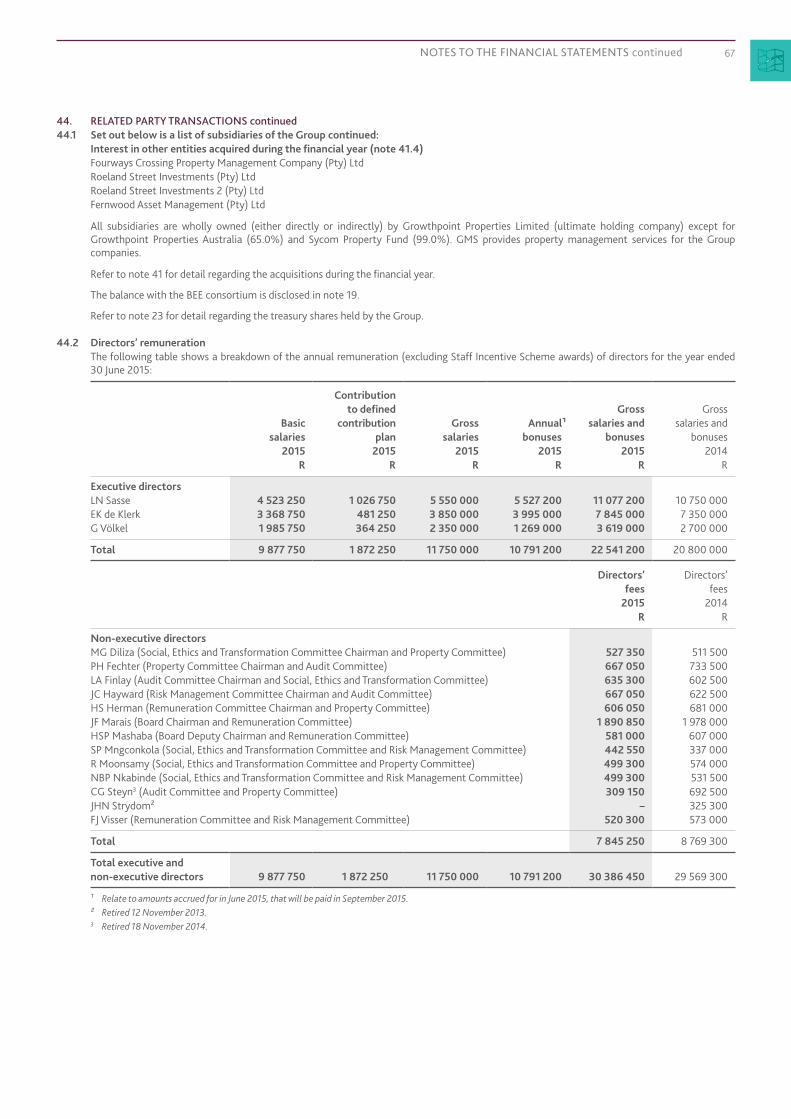
67NOTES TO THE FINANCIAL STATEMENTS continued
44. RELATED PARTY TRANSACTIONS continued44.1 Set out below is a list of subsidiaries of the Group continued:
Interest in other entities acquired during the financial year (note 41.4)Fourways Crossing Property Management Company (Pty) LtdRoeland Street Investments (Pty) LtdRoeland Street Investments 2 (Pty) LtdFernwood Asset Management (Pty) Ltd
All subsidiaries are wholly owned (either directly or indirectly) by Growthpoint Properties Limited (ultimate holding company) except for Growthpoint Properties Australia (65.0%) and Sycom Property Fund (99.0%). GMS provides property management services for the Group companies.
Refer to note 41 for detail regarding the acquisitions during the financial year.
The balance with the BEE consortium is disclosed in note 19.
Refer to note 23 for detail regarding the treasury shares held by the Group.
44.2 Directors’ remuneration The following table shows a breakdown of the annual remuneration (excluding Staff Incentive Scheme awards) of directors for the year ended 30 June 2015:
Basic salaries
2015R
Contribution to defined
contribution plan
2015R
Gross salaries
2015R
Annual¹bonuses
2015R
Gross salaries and
bonuses2015
R
Gross salaries and
bonuses2014
R
Executive directorsLN Sasse 4 523 250 1 026 750 5 550 000 5 527 200 11 077 200 10 750 000 EK de Klerk 3 368 750 481 250 3 850 000 3 995 000 7 845 000 7 350 000 G Völkel 1 985 750 364 250 2 350 000 1 269 000 3 619 000 2 700 000
Total 9 877 750 1 872 250 11 750 000 10 791 200 22 541 200 20 800 000
Directors’ fees
2015R
Directors’ fees
2014R
Non-executive directorsMG Diliza (Social, Ethics and Transformation Committee Chairman and Property Committee) 527 350 511 500 PH Fechter (Property Committee Chairman and Audit Committee) 667 050 733 500 LA Finlay (Audit Committee Chairman and Social, Ethics and Transformation Committee) 635 300 602 500 JC Hayward (Risk Management Committee Chairman and Audit Committee) 667 050 622 500 HS Herman (Remuneration Committee Chairman and Property Committee) 606 050 681 000 JF Marais (Board Chairman and Remuneration Committee) 1 890 850 1 978 000 HSP Mashaba (Board Deputy Chairman and Remuneration Committee) 581 000 607 000 SP Mngconkola (Social, Ethics and Transformation Committee and Risk Management Committee) 442 550 337 000 R Moonsamy (Social, Ethics and Transformation Committee and Property Committee) 499 300 574 000 NBP Nkabinde (Social, Ethics and Transformation Committee and Risk Management Committee) 499 300 531 500 CG Steyn3 (Audit Committee and Property Committee) 309 150 692 500 JHN Strydom² – 325 300 FJ Visser (Remuneration Committee and Risk Management Committee) 520 300 573 000
Total 7 845 250 8 769 300
Total executive and non-executive directors 9 877 750 1 872 250 11 750 000 10 791 200 30 386 450 29 569 300
¹ Relate to amounts accrued for in June 2015, that will be paid in September 2015.² Retired 12 November 2013.3 Retired 18 November 2014.
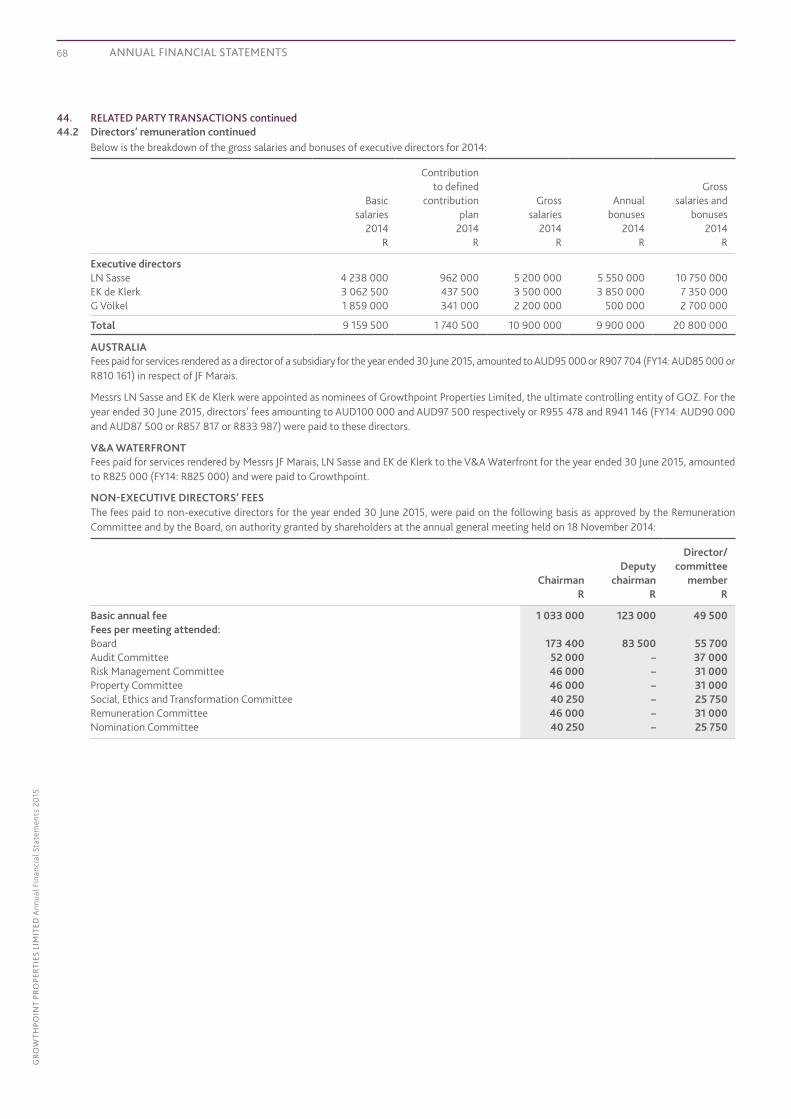
68 ANNUAL FINANCIAL STATEMENTS
GRO
WTH
POIN
T PR
OPE
RTIE
S LI
MIT
ED A
nnua
l Fin
anci
al S
tate
men
ts 2
015
44. RELATED PARTY TRANSACTIONS continued44.2 Directors’ remuneration continued
Below is the breakdown of the gross salaries and bonuses of executive directors for 2014:
Basic salaries
2014 R
Contribution to defined
contribution plan
2014R
Gross salaries
2014R
Annual bonuses
2014R
Gross salaries and
bonuses2014
R
Executive directorsLN Sasse 4 238 000 962 000 5 200 000 5 550 000 10 750 000EK de Klerk 3 062 500 437 500 3 500 000 3 850 000 7 350 000G Völkel 1 859 000 341 000 2 200 000 500 000 2 700 000
Total 9 159 500 1 740 500 10 900 000 9 900 000 20 800 000
AUSTRALIAFees paid for services rendered as a director of a subsidiary for the year ended 30 June 2015, amounted to AUD95 000 or R907 704 (FY14: AUD85 000 or R810 161) in respect of JF Marais.
Messrs LN Sasse and EK de Klerk were appointed as nominees of Growthpoint Properties Limited, the ultimate controlling entity of GOZ. For the year ended 30 June 2015, directors’ fees amounting to AUD100 000 and AUD97 500 respectively or R955 478 and R941 146 (FY14: AUD90 000 and AUD87 500 or R857 817 or R833 987) were paid to these directors.
V&A WATERFRONTFees paid for services rendered by Messrs JF Marais, LN Sasse and EK de Klerk to the V&A Waterfront for the year ended 30 June 2015, amounted to R825 000 (FY14: R825 000) and were paid to Growthpoint.
NON-EXECUTIVE DIRECTORS’ FEESThe fees paid to non-executive directors for the year ended 30 June 2015, were paid on the following basis as approved by the Remuneration Committee and by the Board, on authority granted by shareholders at the annual general meeting held on 18 November 2014:
ChairmanR
Deputy chairman
R
Director/ committee
memberR
Basic annual fee 1 033 000 123 000 49 500Fees per meeting attended:Board 173 400 83 500 55 700Audit Committee 52 000 – 37 000Risk Management Committee 46 000 – 31 000 Property Committee 46 000 – 31 000 Social, Ethics and Transformation Committee 40 250 – 25 750Remuneration Committee 46 000 – 31 000 Nomination Committee 40 250 – 25 750
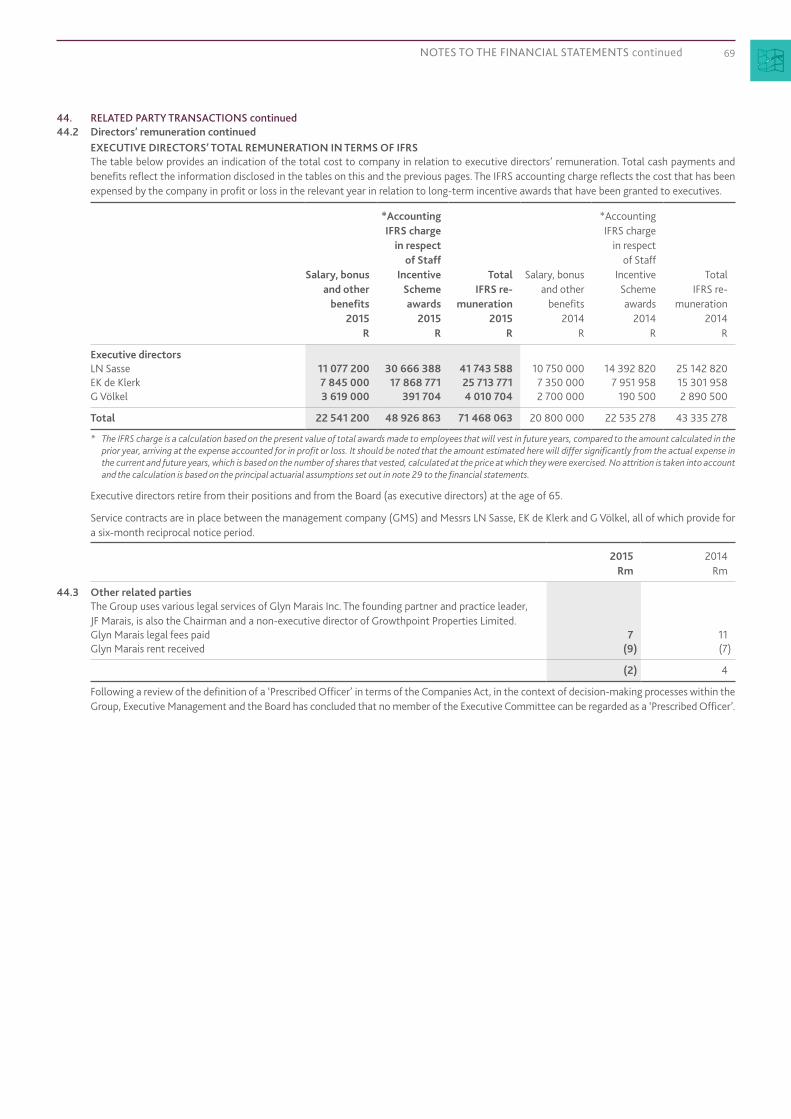
69NOTES TO THE FINANCIAL STATEMENTS continued
44. RELATED PARTY TRANSACTIONS continued44.2 Directors’ remuneration continued
EXECUTIVE DIRECTORS’ TOTAL REMUNERATION IN TERMS OF IFRSThe table below provides an indication of the total cost to company in relation to executive directors’ remuneration. Total cash payments and benefits reflect the information disclosed in the tables on this and the previous pages. The IFRS accounting charge reflects the cost that has been expensed by the company in profit or loss in the relevant year in relation to long-term incentive awards that have been granted to executives.
Salary, bonus and other
benefits 2015
R
*Accounting IFRS charge
in respect of Staff
Incentive Scheme
awards 2015
R
Total IFRS re-
muneration2015
R
Salary, bonusand other
benefits2014
R
*Accounting IFRS charge
in respect of Staff
IncentiveSchemeawards
2014R
Total IFRS re-
muneration2014
R
Executive directorsLN Sasse 11 077 200 30 666 388 41 743 588 10 750 000 14 392 820 25 142 820EK de Klerk 7 845 000 17 868 771 25 713 771 7 350 000 7 951 958 15 301 958G Völkel 3 619 000 391 704 4 010 704 2 700 000 190 500 2 890 500
Total 22 541 200 48 926 863 71 468 063 20 800 000 22 535 278 43 335 278
* The IFRS charge is a calculation based on the present value of total awards made to employees that will vest in future years, compared to the amount calculated in the prior year, arriving at the expense accounted for in profit or loss. It should be noted that the amount estimated here will differ significantly from the actual expense in the current and future years, which is based on the number of shares that vested, calculated at the price at which they were exercised. No attrition is taken into account and the calculation is based on the principal actuarial assumptions set out in note 29 to the financial statements.
Executive directors retire from their positions and from the Board (as executive directors) at the age of 65.
Service contracts are in place between the management company (GMS) and Messrs LN Sasse, EK de Klerk and G Völkel, all of which provide for a six-month reciprocal notice period.
2015Rm
2014Rm
44.3 Other related partiesThe Group uses various legal services of Glyn Marais Inc. The founding partner and practice leader, JF Marais, is also the Chairman and a non-executive director of Growthpoint Properties Limited.Glyn Marais legal fees paid 7 11 Glyn Marais rent received (9) (7)
(2) 4
Following a review of the definition of a ‘Prescribed Officer’ in terms of the Companies Act, in the context of decision-making processes within the Group, Executive Management and the Board has concluded that no member of the Executive Committee can be regarded as a ‘Prescribed Officer’.
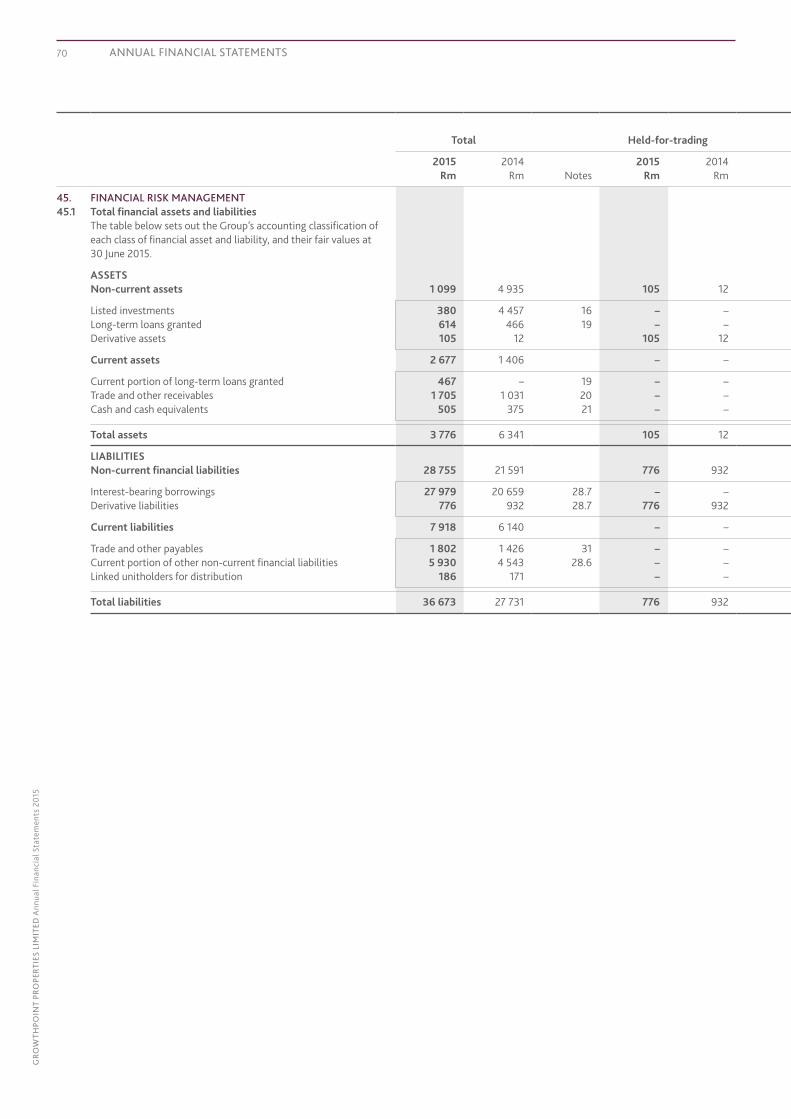
70 ANNUAL FINANCIAL STATEMENTS
GRO
WTH
POIN
T PR
OPE
RTIE
S LI
MIT
ED A
nnua
l Fin
anci
al S
tate
men
ts 2
015
Total Held-for-trading Available-for-saleDesignated at fair value
Non-financialinstruments
Loans and other receivables
Other financial liabilities
2015Rm
2014Rm Notes
2015Rm
2014Rm
2015Rm
2014Rm
2015Rm
2014Rm
2015Rm
2014Rm
2015Rm
2014Rm
2015Rm
2014Rm
45. FINANCIAL RISK MANAGEMENT45.1 Total financial assets and liabilities
The table below sets out the Group’s accounting classification of each class of financial asset and liability, and their fair values at 30 June 2015.
ASSETSNon-current assets 1 099 4 935 105 12 – 4 457 994 466 – – – – – –
Listed investments 380 4 457 16 – – – 4 457 380 – – – – – – – Long-term loans granted 614 466 19 – – – – 614 466 – – – – – – Derivative assets 105 12 105 12 – – – – – – – – – –
Current assets 2 677 1 406 – – – – 467 – 1 668 1 005 542 401 – –
Current portion of long-term loans granted 467 – 19 – – – – 467 – – – – – – –Trade and other receivables 1 705 1 031 20 – – – – – 1 668 1 005 37 26 – – Cash and cash equivalents 505 375 21 – – – – – – – – 505 375 – –
Total assets 3 776 6 341 105 12 – 4 457 1 461 466 1 668 1 005 542 401 – –
LIABILITIESNon-current financial liabilities 28 755 21 591 776 932 – – 27 979 20 659 – – – – – –
Interest-bearing borrowings 27 979 20 659 28.7 – – – – 27 979 20 659 – – – – – –Derivative liabilities 776 932 28.7 776 932 – – – – – – – – – –
Current liabilities 7 918 6 140 – – – – – 4 543 428 383 – – 1 560 1 214
Trade and other payables 1 802 1 426 31 – – – – – – 428 383 – – 1 374 1 043 Current portion of other non-current financial liabilities 5 930 4 543 28.6 – – – – 5 930 4 543 – – – – – – Linked unitholders for distribution 186 171 – – – – – – – – – – 186 171
Total liabilities 36 673 27 731 776 932 – – 33 902 25 202 428 383 – – 1 560 1 214
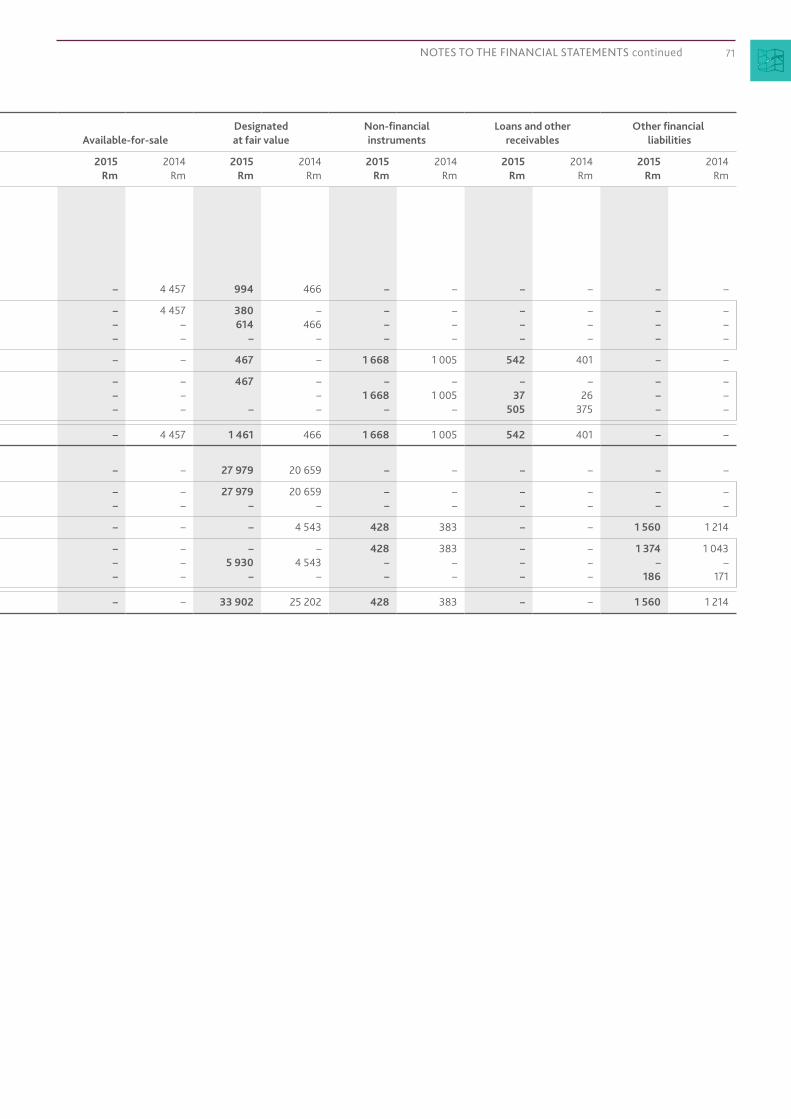
71NOTES TO THE FINANCIAL STATEMENTS continued
Total Held-for-trading Available-for-saleDesignated at fair value
Non-financialinstruments
Loans and other receivables
Other financial liabilities
2015Rm
2014Rm Notes
2015Rm
2014Rm
2015Rm
2014Rm
2015Rm
2014Rm
2015Rm
2014Rm
2015Rm
2014Rm
2015Rm
2014Rm
45. FINANCIAL RISK MANAGEMENT45.1 Total financial assets and liabilities
The table below sets out the Group’s accounting classification of each class of financial asset and liability, and their fair values at 30 June 2015.
ASSETSNon-current assets 1 099 4 935 105 12 – 4 457 994 466 – – – – – –
Listed investments 380 4 457 16 – – – 4 457 380 – – – – – – – Long-term loans granted 614 466 19 – – – – 614 466 – – – – – – Derivative assets 105 12 105 12 – – – – – – – – – –
Current assets 2 677 1 406 – – – – 467 – 1 668 1 005 542 401 – –
Current portion of long-term loans granted 467 – 19 – – – – 467 – – – – – – –Trade and other receivables 1 705 1 031 20 – – – – – 1 668 1 005 37 26 – – Cash and cash equivalents 505 375 21 – – – – – – – – 505 375 – –
Total assets 3 776 6 341 105 12 – 4 457 1 461 466 1 668 1 005 542 401 – –
LIABILITIESNon-current financial liabilities 28 755 21 591 776 932 – – 27 979 20 659 – – – – – –
Interest-bearing borrowings 27 979 20 659 28.7 – – – – 27 979 20 659 – – – – – –Derivative liabilities 776 932 28.7 776 932 – – – – – – – – – –
Current liabilities 7 918 6 140 – – – – – 4 543 428 383 – – 1 560 1 214
Trade and other payables 1 802 1 426 31 – – – – – – 428 383 – – 1 374 1 043 Current portion of other non-current financial liabilities 5 930 4 543 28.6 – – – – 5 930 4 543 – – – – – – Linked unitholders for distribution 186 171 – – – – – – – – – – 186 171
Total liabilities 36 673 27 731 776 932 – – 33 902 25 202 428 383 – – 1 560 1 214
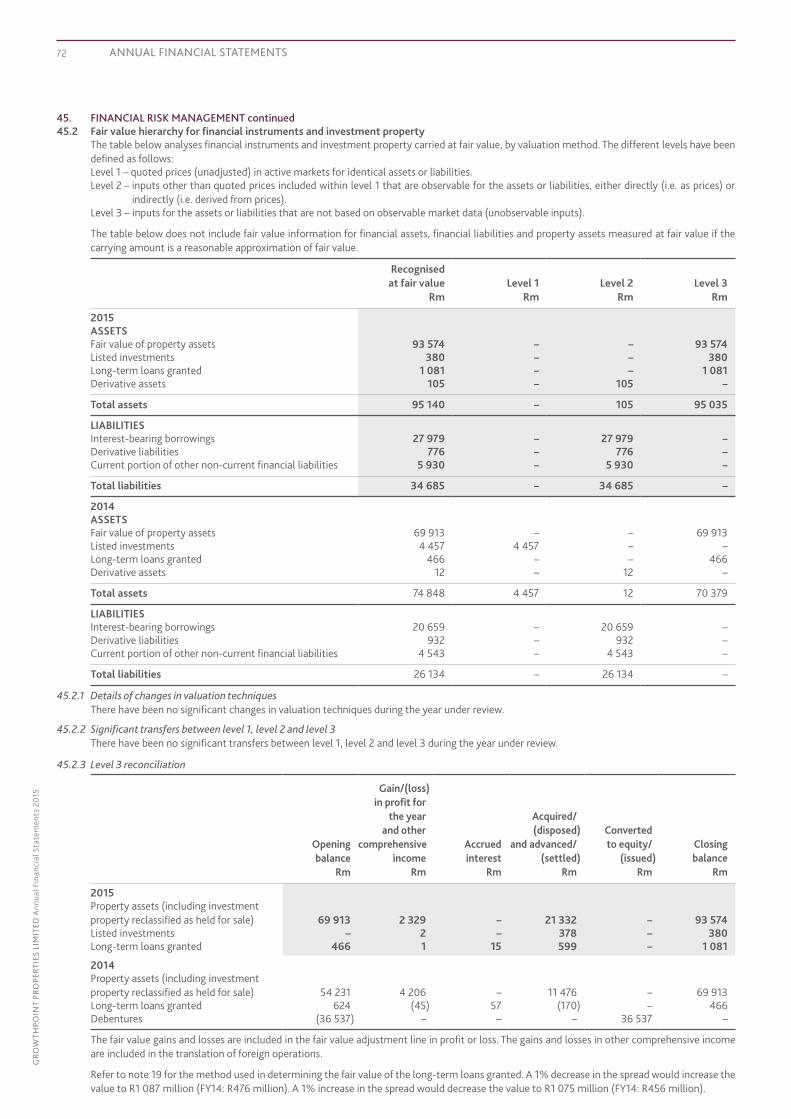
72 ANNUAL FINANCIAL STATEMENTS
GRO
WTH
POIN
T PR
OPE
RTIE
S LI
MIT
ED A
nnua
l Fin
anci
al S
tate
men
ts 2
015
45. FINANCIAL RISK MANAGEMENT continued45.2 Fair value hierarchy for financial instruments and investment property
The table below analyses financial instruments and investment property carried at fair value, by valuation method. The different levels have been defined as follows:Level 1 – quoted prices (unadjusted) in active markets for identical assets or liabilities.Level 2 – inputs other than quoted prices included within level 1 that are observable for the assets or liabilities, either directly (i.e. as prices) or
indirectly (i.e. derived from prices).Level 3 – inputs for the assets or liabilities that are not based on observable market data (unobservable inputs).
The table below does not include fair value information for financial assets, financial liabilities and property assets measured at fair value if the carrying amount is a reasonable approximation of fair value.
Recognised at fair value
RmLevel 1
RmLevel 2
RmLevel 3
Rm
2015ASSETSFair value of property assets 93 574 – – 93 574 Listed investments 380 – – 380Long-term loans granted 1 081 – – 1 081 Derivative assets 105 – 105 –
Total assets 95 140 – 105 95 035
LIABILITIESInterest-bearing borrowings 27 979 – 27 979 –Derivative liabilities 776 – 776 –Current portion of other non-current financial liabilities 5 930 – 5 930 –
Total liabilities 34 685 – 34 685 –
2014ASSETSFair value of property assets 69 913 – – 69 913 Listed investments 4 457 4 457 – – Long-term loans granted 466 – – 466 Derivative assets 12 – 12 –
Total assets 74 848 4 457 12 70 379
LIABILITIESInterest-bearing borrowings 20 659 – 20 659 – Derivative liabilities 932 – 932 – Current portion of other non-current financial liabilities 4 543 – 4 543 –
Total liabilities 26 134 – 26 134 –
45.2.1 Details of changes in valuation techniquesThere have been no significant changes in valuation techniques during the year under review.
45.2.2 Significant transfers between level 1, level 2 and level 3There have been no significant transfers between level 1, level 2 and level 3 during the year under review.
45.2.3 Level 3 reconciliation
Opening balance
Rm
Gain/(loss) in profit for
the year and other
comprehensive income
Rm
Accrued interest
Rm
Acquired/ (disposed)
and advanced/ (settled)
Rm
Converted to equity/
(issued)Rm
Closing balance
Rm
2015Property assets (including investment property reclassified as held for sale) 69 913 2 329 – 21 332 – 93 574 Listed investments – 2 – 378 – 380Long-term loans granted 466 1 15 599 – 1 081
2014Property assets (including investment property reclassified as held for sale) 54 231 4 206 – 11 476 – 69 913 Long-term loans granted 624 (45) 57 (170) – 466 Debentures (36 537) – – – 36 537 –
The fair value gains and losses are included in the fair value adjustment line in profit or loss. The gains and losses in other comprehensive income are included in the translation of foreign operations.
Refer to note 19 for the method used in determining the fair value of the long-term loans granted. A 1% decrease in the spread would increase the value to R1 087 million (FY14: R476 million). A 1% increase in the spread would decrease the value to R1 075 million (FY14: R456 million).
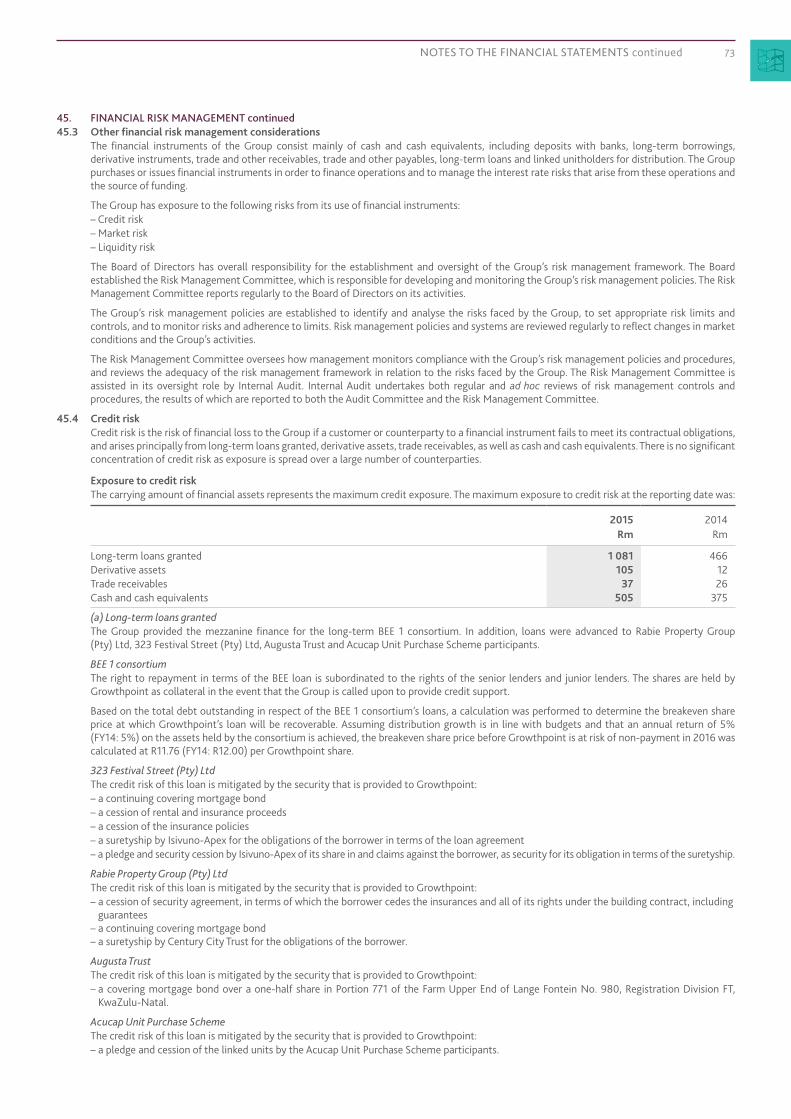
73NOTES TO THE FINANCIAL STATEMENTS continued
45. FINANCIAL RISK MANAGEMENT continued45.3 Other financial risk management considerations
The financial instruments of the Group consist mainly of cash and cash equivalents, including deposits with banks, long-term borrowings, derivative instruments, trade and other receivables, trade and other payables, long-term loans and linked unitholders for distribution. The Group purchases or issues financial instruments in order to finance operations and to manage the interest rate risks that arise from these operations and the source of funding.
The Group has exposure to the following risks from its use of financial instruments:– Credit risk– Market risk – Liquidity risk
The Board of Directors has overall responsibility for the establishment and oversight of the Group’s risk management framework. The Board established the Risk Management Committee, which is responsible for developing and monitoring the Group’s risk management policies. The Risk Management Committee reports regularly to the Board of Directors on its activities.
The Group’s risk management policies are established to identify and analyse the risks faced by the Group, to set appropriate risk limits and controls, and to monitor risks and adherence to limits. Risk management policies and systems are reviewed regularly to reflect changes in market conditions and the Group’s activities.
The Risk Management Committee oversees how management monitors compliance with the Group’s risk management policies and procedures, and reviews the adequacy of the risk management framework in relation to the risks faced by the Group. The Risk Management Committee is assisted in its oversight role by Internal Audit. Internal Audit undertakes both regular and ad hoc reviews of risk management controls and procedures, the results of which are reported to both the Audit Committee and the Risk Management Committee.
45.4 Credit riskCredit risk is the risk of financial loss to the Group if a customer or counterparty to a financial instrument fails to meet its contractual obligations, and arises principally from long-term loans granted, derivative assets, trade receivables, as well as cash and cash equivalents. There is no significant concentration of credit risk as exposure is spread over a large number of counterparties.
Exposure to credit riskThe carrying amount of financial assets represents the maximum credit exposure. The maximum exposure to credit risk at the reporting date was:
2015Rm
2014Rm
Long-term loans granted 1 081 466Derivative assets 105 12Trade receivables 37 26Cash and cash equivalents 505 375
(a) Long-term loans grantedThe Group provided the mezzanine finance for the long-term BEE 1 consortium. In addition, loans were advanced to Rabie Property Group (Pty) Ltd, 323 Festival Street (Pty) Ltd, Augusta Trust and Acucap Unit Purchase Scheme participants.
BEE 1 consortiumThe right to repayment in terms of the BEE loan is subordinated to the rights of the senior lenders and junior lenders. The shares are held by Growthpoint as collateral in the event that the Group is called upon to provide credit support.
Based on the total debt outstanding in respect of the BEE 1 consortium’s loans, a calculation was performed to determine the breakeven share price at which Growthpoint’s loan will be recoverable. Assuming distribution growth is in line with budgets and that an annual return of 5% (FY14: 5%) on the assets held by the consortium is achieved, the breakeven share price before Growthpoint is at risk of non-payment in 2016 was calculated at R11.76 (FY14: R12.00) per Growthpoint share.
323 Festival Street (Pty) LtdThe credit risk of this loan is mitigated by the security that is provided to Growthpoint:– a continuing covering mortgage bond– a cession of rental and insurance proceeds– a cession of the insurance policies– a suretyship by Isivuno-Apex for the obligations of the borrower in terms of the loan agreement– a pledge and security cession by Isivuno-Apex of its share in and claims against the borrower, as security for its obligation in terms of the suretyship.
Rabie Property Group (Pty) LtdThe credit risk of this loan is mitigated by the security that is provided to Growthpoint:– a cession of security agreement, in terms of which the borrower cedes the insurances and all of its rights under the building contract, including
guarantees– a continuing covering mortgage bond– a suretyship by Century City Trust for the obligations of the borrower.
Augusta TrustThe credit risk of this loan is mitigated by the security that is provided to Growthpoint:– a covering mortgage bond over a one-half share in Portion 771 of the Farm Upper End of Lange Fontein No. 980, Registration Division FT,
KwaZulu-Natal.
Acucap Unit Purchase SchemeThe credit risk of this loan is mitigated by the security that is provided to Growthpoint:– a pledge and cession of the linked units by the Acucap Unit Purchase Scheme participants.
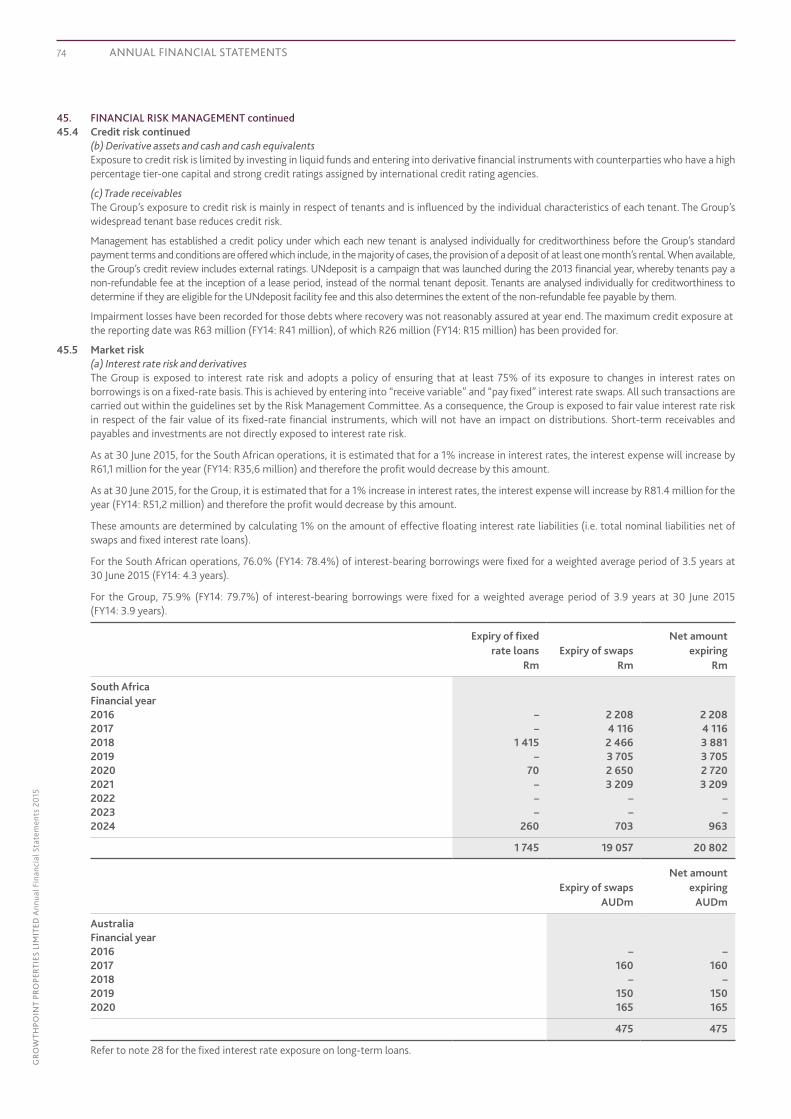
74 ANNUAL FINANCIAL STATEMENTS
GRO
WTH
POIN
T PR
OPE
RTIE
S LI
MIT
ED A
nnua
l Fin
anci
al S
tate
men
ts 2
015
45. FINANCIAL RISK MANAGEMENT continued45.4 Credit risk continued
(b) Derivative assets and cash and cash equivalentsExposure to credit risk is limited by investing in liquid funds and entering into derivative financial instruments with counterparties who have a high percentage tier-one capital and strong credit ratings assigned by international credit rating agencies.
(c) Trade receivablesThe Group’s exposure to credit risk is mainly in respect of tenants and is influenced by the individual characteristics of each tenant. The Group’s widespread tenant base reduces credit risk.
Management has established a credit policy under which each new tenant is analysed individually for creditworthiness before the Group’s standard payment terms and conditions are offered which include, in the majority of cases, the provision of a deposit of at least one month’s rental. When available, the Group’s credit review includes external ratings. UNdeposit is a campaign that was launched during the 2013 financial year, whereby tenants pay a non-refundable fee at the inception of a lease period, instead of the normal tenant deposit. Tenants are analysed individually for creditworthiness to determine if they are eligible for the UNdeposit facility fee and this also determines the extent of the non-refundable fee payable by them.
Impairment losses have been recorded for those debts where recovery was not reasonably assured at year end. The maximum credit exposure at the reporting date was R63 million (FY14: R41 million), of which R26 million (FY14: R15 million) has been provided for.
45.5 Market risk (a) Interest rate risk and derivatives The Group is exposed to interest rate risk and adopts a policy of ensuring that at least 75% of its exposure to changes in interest rates on borrowings is on a fixed-rate basis. This is achieved by entering into “receive variable” and “pay fixed” interest rate swaps. All such transactions are carried out within the guidelines set by the Risk Management Committee. As a consequence, the Group is exposed to fair value interest rate risk in respect of the fair value of its fixed-rate financial instruments, which will not have an impact on distributions. Short-term receivables and payables and investments are not directly exposed to interest rate risk.
As at 30 June 2015, for the South African operations, it is estimated that for a 1% increase in interest rates, the interest expense will increase by R61,1 million for the year (FY14: R35,6 million) and therefore the profit would decrease by this amount.
As at 30 June 2015, for the Group, it is estimated that for a 1% increase in interest rates, the interest expense will increase by R81.4 million for the year (FY14: R51,2 million) and therefore the profit would decrease by this amount.
These amounts are determined by calculating 1% on the amount of effective floating interest rate liabilities (i.e. total nominal liabilities net of swaps and fixed interest rate loans).
For the South African operations, 76.0% (FY14: 78.4%) of interest-bearing borrowings were fixed for a weighted average period of 3.5 years at 30 June 2015 (FY14: 4.3 years).
For the Group, 75.9% (FY14: 79.7%) of interest-bearing borrowings were fixed for a weighted average period of 3.9 years at 30 June 2015 (FY14: 3.9 years).
Expiry of fixed rate loans
RmExpiry of swaps
Rm
Net amount expiring
Rm
South AfricaFinancial year2016 – 2 208 2 208 2017 – 4 116 4 116 2018 1 415 2 466 3 881 2019 – 3 705 3 705 2020 70 2 650 2 720 2021 – 3 209 3 209 2022 – – – 2023 – – – 2024 260 703 963
1 745 19 057 20 802
Expiry of swapsAUDm
Net amount expiring
AUDm
AustraliaFinancial year2016 – – 2017 160 160 2018 – – 2019 150 150 2020 165 165
475 475
Refer to note 28 for the fixed interest rate exposure on long-term loans.
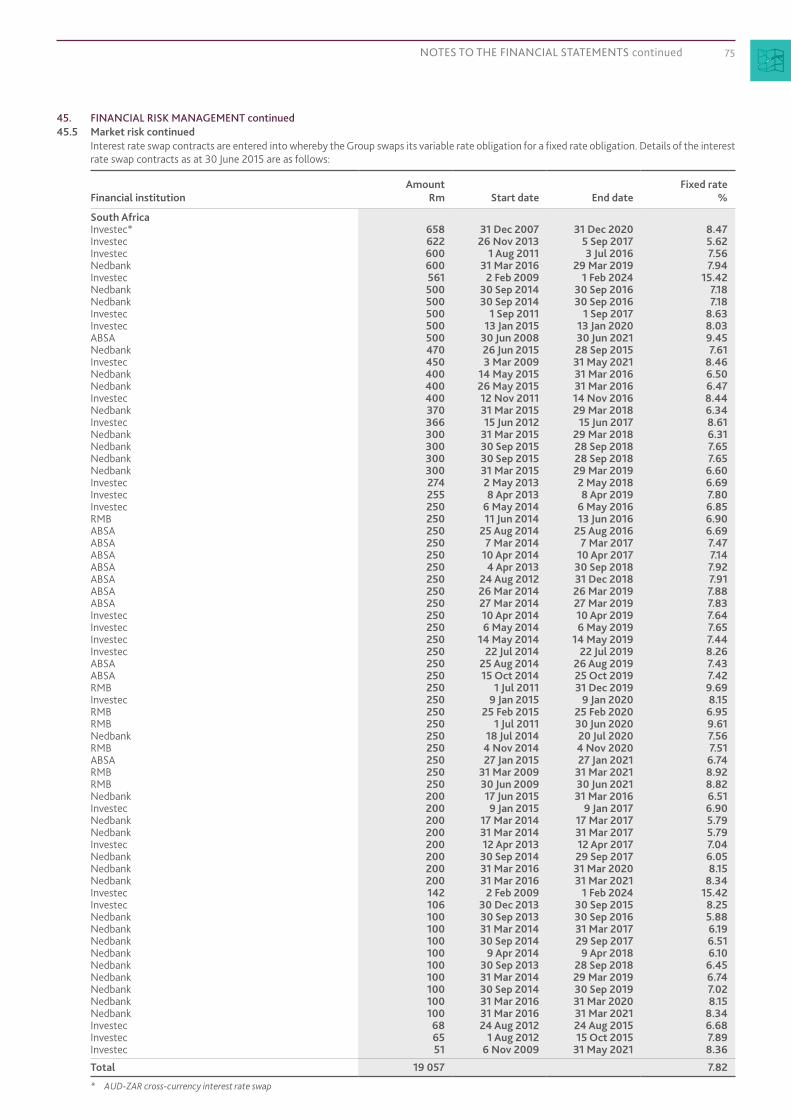
75NOTES TO THE FINANCIAL STATEMENTS continued
45. FINANCIAL RISK MANAGEMENT continued45.5 Market risk continued
Interest rate swap contracts are entered into whereby the Group swaps its variable rate obligation for a fixed rate obligation. Details of the interest rate swap contracts as at 30 June 2015 are as follows:
Financial institutionAmount
Rm Start date End dateFixed rate
%
South AfricaInvestec* 658 31 Dec 2007 31 Dec 2020 8.47Investec 622 26 Nov 2013 5 Sep 2017 5.62Investec 600 1 Aug 2011 3 Jul 2016 7.56Nedbank 600 31 Mar 2016 29 Mar 2019 7.94Investec 561 2 Feb 2009 1 Feb 2024 15.42Nedbank 500 30 Sep 2014 30 Sep 2016 7.18Nedbank 500 30 Sep 2014 30 Sep 2016 7.18Investec 500 1 Sep 2011 1 Sep 2017 8.63Investec 500 13 Jan 2015 13 Jan 2020 8.03ABSA 500 30 Jun 2008 30 Jun 2021 9.45Nedbank 470 26 Jun 2015 28 Sep 2015 7.61Investec 450 3 Mar 2009 31 May 2021 8.46Nedbank 400 14 May 2015 31 Mar 2016 6.50Nedbank 400 26 May 2015 31 Mar 2016 6.47Investec 400 12 Nov 2011 14 Nov 2016 8.44Nedbank 370 31 Mar 2015 29 Mar 2018 6.34Investec 366 15 Jun 2012 15 Jun 2017 8.61Nedbank 300 31 Mar 2015 29 Mar 2018 6.31Nedbank 300 30 Sep 2015 28 Sep 2018 7.65Nedbank 300 30 Sep 2015 28 Sep 2018 7.65Nedbank 300 31 Mar 2015 29 Mar 2019 6.60Investec 274 2 May 2013 2 May 2018 6.69Investec 255 8 Apr 2013 8 Apr 2019 7.80Investec 250 6 May 2014 6 May 2016 6.85RMB 250 11 Jun 2014 13 Jun 2016 6.90ABSA 250 25 Aug 2014 25 Aug 2016 6.69ABSA 250 7 Mar 2014 7 Mar 2017 7.47ABSA 250 10 Apr 2014 10 Apr 2017 7.14ABSA 250 4 Apr 2013 30 Sep 2018 7.92ABSA 250 24 Aug 2012 31 Dec 2018 7.91ABSA 250 26 Mar 2014 26 Mar 2019 7.88ABSA 250 27 Mar 2014 27 Mar 2019 7.83Investec 250 10 Apr 2014 10 Apr 2019 7.64Investec 250 6 May 2014 6 May 2019 7.65Investec 250 14 May 2014 14 May 2019 7.44Investec 250 22 Jul 2014 22 Jul 2019 8.26ABSA 250 25 Aug 2014 26 Aug 2019 7.43ABSA 250 15 Oct 2014 25 Oct 2019 7.42RMB 250 1 Jul 2011 31 Dec 2019 9.69Investec 250 9 Jan 2015 9 Jan 2020 8.15RMB 250 25 Feb 2015 25 Feb 2020 6.95RMB 250 1 Jul 2011 30 Jun 2020 9.61Nedbank 250 18 Jul 2014 20 Jul 2020 7.56RMB 250 4 Nov 2014 4 Nov 2020 7.51ABSA 250 27 Jan 2015 27 Jan 2021 6.74RMB 250 31 Mar 2009 31 Mar 2021 8.92RMB 250 30 Jun 2009 30 Jun 2021 8.82Nedbank 200 17 Jun 2015 31 Mar 2016 6.51Investec 200 9 Jan 2015 9 Jan 2017 6.90Nedbank 200 17 Mar 2014 17 Mar 2017 5.79Nedbank 200 31 Mar 2014 31 Mar 2017 5.79Investec 200 12 Apr 2013 12 Apr 2017 7.04Nedbank 200 30 Sep 2014 29 Sep 2017 6.05Nedbank 200 31 Mar 2016 31 Mar 2020 8.15Nedbank 200 31 Mar 2016 31 Mar 2021 8.34Investec 142 2 Feb 2009 1 Feb 2024 15.42Investec 106 30 Dec 2013 30 Sep 2015 8.25Nedbank 100 30 Sep 2013 30 Sep 2016 5.88Nedbank 100 31 Mar 2014 31 Mar 2017 6.19Nedbank 100 30 Sep 2014 29 Sep 2017 6.51Nedbank 100 9 Apr 2014 9 Apr 2018 6.10Nedbank 100 30 Sep 2013 28 Sep 2018 6.45Nedbank 100 31 Mar 2014 29 Mar 2019 6.74Nedbank 100 30 Sep 2014 30 Sep 2019 7.02Nedbank 100 31 Mar 2016 31 Mar 2020 8.15Nedbank 100 31 Mar 2016 31 Mar 2021 8.34Investec 68 24 Aug 2012 24 Aug 2015 6.68Investec 65 1 Aug 2012 15 Oct 2015 7.89Investec 51 6 Nov 2009 31 May 2021 8.36
Total 19 057 7.82
* AUD-ZAR cross-currency interest rate swap
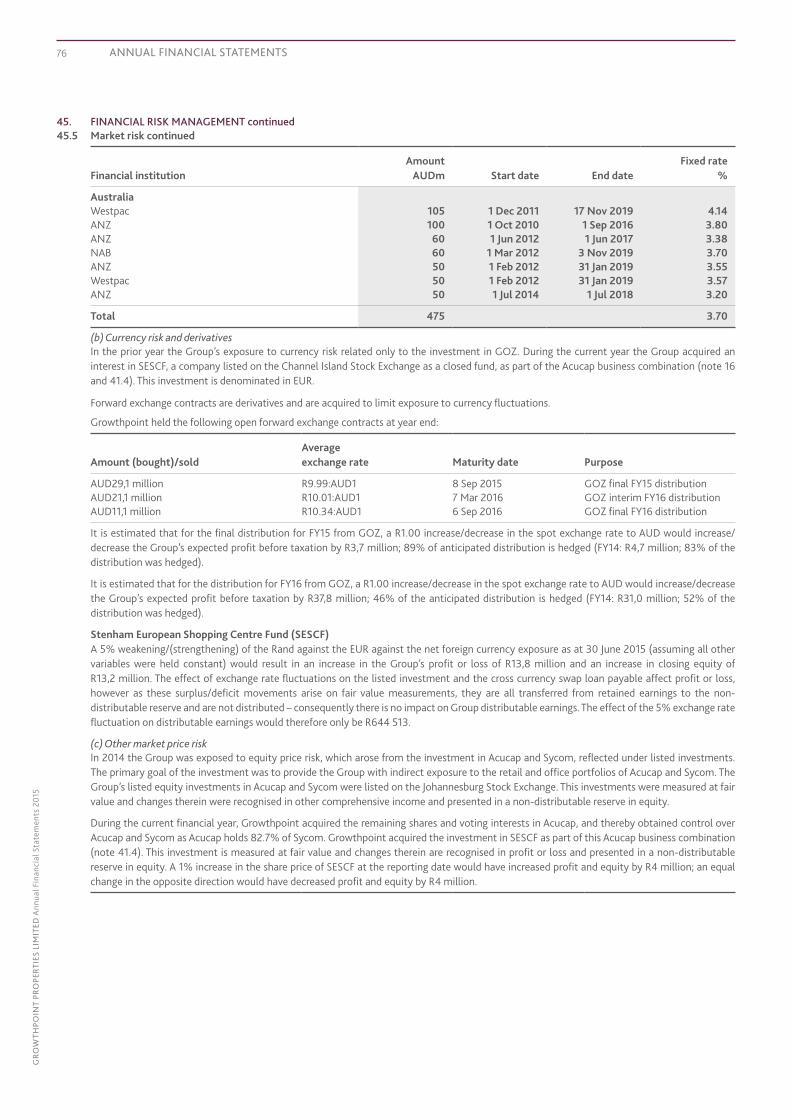
76 ANNUAL FINANCIAL STATEMENTS
GRO
WTH
POIN
T PR
OPE
RTIE
S LI
MIT
ED A
nnua
l Fin
anci
al S
tate
men
ts 2
015
45. FINANCIAL RISK MANAGEMENT continued45.5 Market risk continued
Financial institutionAmount
AUDm Start date End dateFixed rate
%
AustraliaWestpac 105 1 Dec 2011 17 Nov 2019 4.14ANZ 100 1 Oct 2010 1 Sep 2016 3.80ANZ 60 1 Jun 2012 1 Jun 2017 3.38NAB 60 1 Mar 2012 3 Nov 2019 3.70ANZ 50 1 Feb 2012 31 Jan 2019 3.55Westpac 50 1 Feb 2012 31 Jan 2019 3.57ANZ 50 1 Jul 2014 1 Jul 2018 3.20
Total 475 3.70
(b) Currency risk and derivativesIn the prior year the Group’s exposure to currency risk related only to the investment in GOZ. During the current year the Group acquired an interest in SESCF, a company listed on the Channel Island Stock Exchange as a closed fund, as part of the Acucap business combination (note 16 and 41.4). This investment is denominated in EUR.
Forward exchange contracts are derivatives and are acquired to limit exposure to currency fluctuations.
Growthpoint held the following open forward exchange contracts at year end:
Amount (bought)/soldAverage exchange rate Maturity date Purpose
AUD29,1 million R9.99:AUD1 8 Sep 2015 GOZ final FY15 distributionAUD21,1 million R10.01:AUD1 7 Mar 2016 GOZ interim FY16 distributionAUD11,1 million R10.34:AUD1 6 Sep 2016 GOZ final FY16 distribution
It is estimated that for the final distribution for FY15 from GOZ, a R1.00 increase/decrease in the spot exchange rate to AUD would increase/ decrease the Group’s expected profit before taxation by R3,7 million; 89% of anticipated distribution is hedged (FY14: R4,7 million; 83% of the distribution was hedged).
It is estimated that for the distribution for FY16 from GOZ, a R1.00 increase/decrease in the spot exchange rate to AUD would increase/decrease the Group’s expected profit before taxation by R37,8 million; 46% of the anticipated distribution is hedged (FY14: R31,0 million; 52% of the distribution was hedged).
Stenham European Shopping Centre Fund (SESCF)A 5% weakening/(strengthening) of the Rand against the EUR against the net foreign currency exposure as at 30 June 2015 (assuming all other variables were held constant) would result in an increase in the Group’s profit or loss of R13,8 million and an increase in closing equity of R13,2 million. The effect of exchange rate fluctuations on the listed investment and the cross currency swap loan payable affect profit or loss, however as these surplus/deficit movements arise on fair value measurements, they are all transferred from retained earnings to the non-distributable reserve and are not distributed – consequently there is no impact on Group distributable earnings. The effect of the 5% exchange rate fluctuation on distributable earnings would therefore only be R644 513.
(c) Other market price riskIn 2014 the Group was exposed to equity price risk, which arose from the investment in Acucap and Sycom, reflected under listed investments. The primary goal of the investment was to provide the Group with indirect exposure to the retail and office portfolios of Acucap and Sycom. The Group’s listed equity investments in Acucap and Sycom were listed on the Johannesburg Stock Exchange. This investments were measured at fair value and changes therein were recognised in other comprehensive income and presented in a non-distributable reserve in equity.
During the current financial year, Growthpoint acquired the remaining shares and voting interests in Acucap, and thereby obtained control over Acucap and Sycom as Acucap holds 82.7% of Sycom. Growthpoint acquired the investment in SESCF as part of this Acucap business combination (note 41.4). This investment is measured at fair value and changes therein are recognised in profit or loss and presented in a non-distributable reserve in equity. A 1% increase in the share price of SESCF at the reporting date would have increased profit and equity by R4 million; an equal change in the opposite direction would have decreased profit and equity by R4 million.
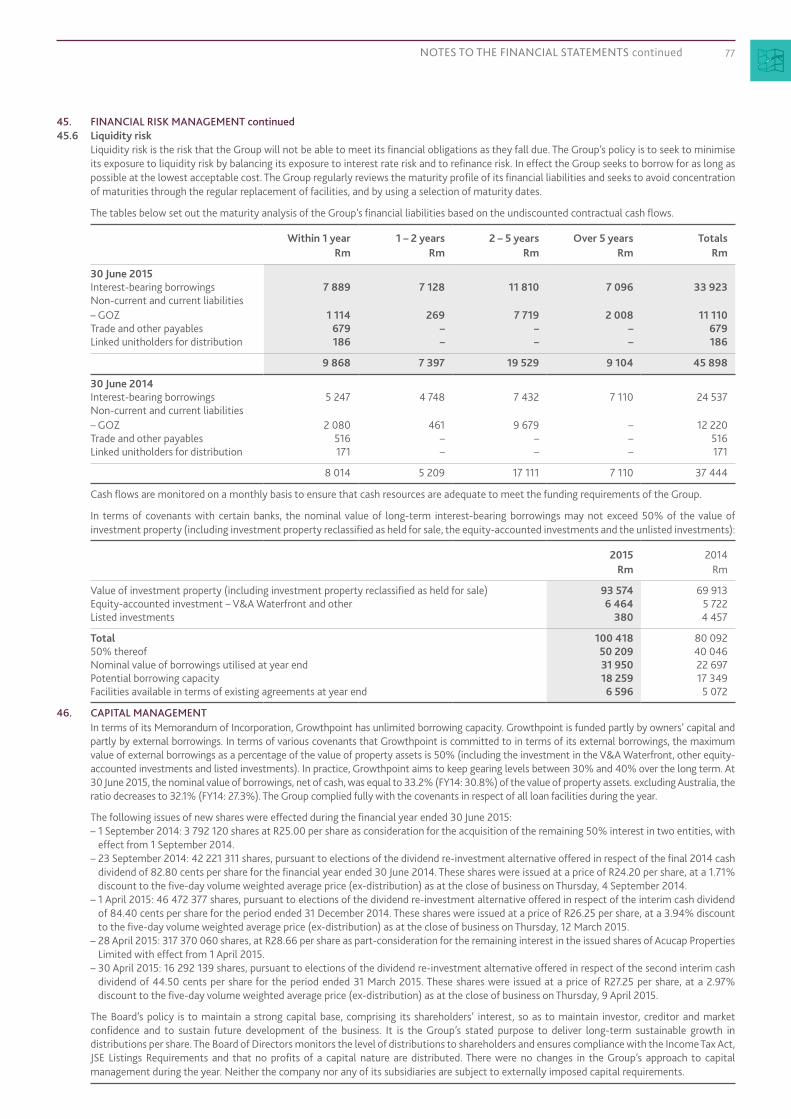
77NOTES TO THE FINANCIAL STATEMENTS continued
45. FINANCIAL RISK MANAGEMENT continued45.6 Liquidity risk
Liquidity risk is the risk that the Group will not be able to meet its financial obligations as they fall due. The Group’s policy is to seek to minimise its exposure to liquidity risk by balancing its exposure to interest rate risk and to refinance risk. In effect the Group seeks to borrow for as long as possible at the lowest acceptable cost. The Group regularly reviews the maturity profile of its financial liabilities and seeks to avoid concentration of maturities through the regular replacement of facilities, and by using a selection of maturity dates.
The tables below set out the maturity analysis of the Group’s financial liabilities based on the undiscounted contractual cash flows.
Within 1 yearRm
1 – 2 yearsRm
2 – 5 years Rm
Over 5 yearsRm
TotalsRm
30 June 2015Interest-bearing borrowings 7 889 7 128 11 810 7 096 33 923Non-current and current liabilities – GOZ 1 114 269 7 719 2 008 11 110Trade and other payables 679 – – – 679 Linked unitholders for distribution 186 – – – 186
9 868 7 397 19 529 9 104 45 898
30 June 2014Interest-bearing borrowings 5 247 4 748 7 432 7 110 24 537Non-current and current liabilities – GOZ 2 080 461 9 679 – 12 220Trade and other payables 516 – – – 516 Linked unitholders for distribution 171 – – – 171
8 014 5 209 17 111 7 110 37 444
Cash flows are monitored on a monthly basis to ensure that cash resources are adequate to meet the funding requirements of the Group.
In terms of covenants with certain banks, the nominal value of long-term interest-bearing borrowings may not exceed 50% of the value of investment property (including investment property reclassified as held for sale, the equity-accounted investments and the unlisted investments):
2015Rm
2014Rm
Value of investment property (including investment property reclassified as held for sale) 93 574 69 913 Equity-accounted investment – V&A Waterfront and other 6 464 5 722 Listed investments 380 4 457
Total 100 418 80 092 50% thereof 50 209 40 046 Nominal value of borrowings utilised at year end 31 950 22 697Potential borrowing capacity 18 259 17 349Facilities available in terms of existing agreements at year end 6 596 5 072
46. CAPITAL MANAGEMENT In terms of its Memorandum of Incorporation, Growthpoint has unlimited borrowing capacity. Growthpoint is funded partly by owners’ capital and
partly by external borrowings. In terms of various covenants that Growthpoint is committed to in terms of its external borrowings, the maximum value of external borrowings as a percentage of the value of property assets is 50% (including the investment in the V&A Waterfront, other equity-accounted investments and listed investments). In practice, Growthpoint aims to keep gearing levels between 30% and 40% over the long term. At 30 June 2015, the nominal value of borrowings, net of cash, was equal to 33.2% (FY14: 30.8%) of the value of property assets. excluding Australia, the ratio decreases to 32.1% (FY14: 27.3%). The Group complied fully with the covenants in respect of all loan facilities during the year.
The following issues of new shares were effected during the financial year ended 30 June 2015: – 1 September 2014: 3 792 120 shares at R25.00 per share as consideration for the acquisition of the remaining 50% interest in two entities, with
effect from 1 September 2014. – 23 September 2014: 42 221 311 shares, pursuant to elections of the dividend re-investment alternative offered in respect of the final 2014 cash
dividend of 82.80 cents per share for the financial year ended 30 June 2014. These shares were issued at a price of R24.20 per share, at a 1.71% discount to the five-day volume weighted average price (ex-distribution) as at the close of business on Thursday, 4 September 2014.
– 1 April 2015: 46 472 377 shares, pursuant to elections of the dividend re-investment alternative offered in respect of the interim cash dividend of 84.40 cents per share for the period ended 31 December 2014. These shares were issued at a price of R26.25 per share, at a 3.94% discount to the five-day volume weighted average price (ex-distribution) as at the close of business on Thursday, 12 March 2015.
– 28 April 2015: 317 370 060 shares, at R28.66 per share as part-consideration for the remaining interest in the issued shares of Acucap Properties Limited with effect from 1 April 2015.
– 30 April 2015: 16 292 139 shares, pursuant to elections of the dividend re-investment alternative offered in respect of the second interim cash dividend of 44.50 cents per share for the period ended 31 March 2015. These shares were issued at a price of R27.25 per share, at a 2.97% discount to the five-day volume weighted average price (ex-distribution) as at the close of business on Thursday, 9 April 2015.
The Board’s policy is to maintain a strong capital base, comprising its shareholders’ interest, so as to maintain investor, creditor and market confidence and to sustain future development of the business. It is the Group’s stated purpose to deliver long-term sustainable growth in distributions per share. The Board of Directors monitors the level of distributions to shareholders and ensures compliance with the Income Tax Act, JSE Listings Requirements and that no profits of a capital nature are distributed. There were no changes in the Group’s approach to capital management during the year. Neither the company nor any of its subsidiaries are subject to externally imposed capital requirements.

sandoWn meWs, sandton
PROPERTY PORTFOLIO
PROPERTY PORTfOLIO SuMMARY 80
PROPERTY PORTfOLIO DETAIL 82
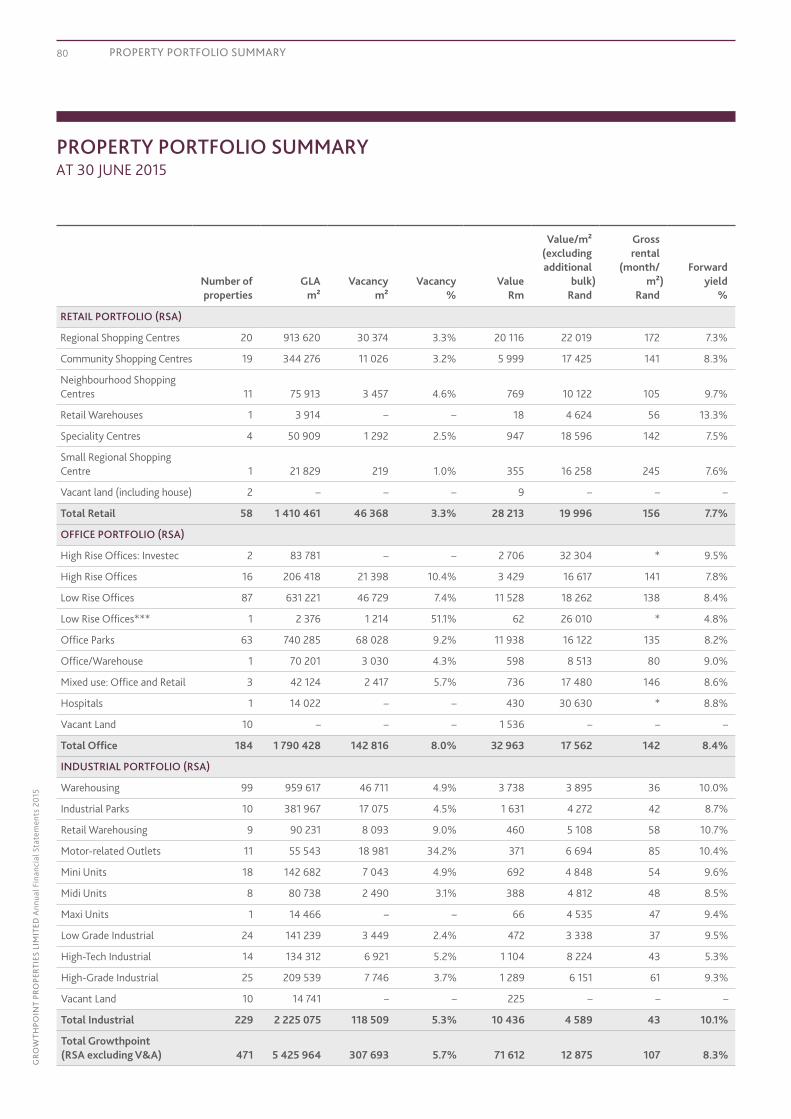
80
GRO
WTH
POIN
T PR
OPE
RTIE
S LI
MIT
ED A
nnua
l Fin
anci
al S
tate
men
ts 2
015
PROPERTY PORTFOLIO SUMMARY
PROPERTY PORTFOLIO SUMMARYAT 30 JUNE 2015
Number of properties
GLAm²
Vacancy m²
Vacancy%
ValueRm
Value/m² (excluding additional
bulk) Rand
Gross rental
(month/m²)
Rand
Forward yield
%
RETAIL PORTFOLIO (RSA)
Regional Shopping Centres 20 913 620 30 374 3.3% 20 116 22 019 172 7.3%
Community Shopping Centres 19 344 276 11 026 3.2% 5 999 17 425 141 8.3%
Neighbourhood Shopping Centres 11 75 913 3 457 4.6% 769 10 122 105 9.7%
Retail Warehouses 1 3 914 – – 18 4 624 56 13.3%
Speciality Centres 4 50 909 1 292 2.5% 947 18 596 142 7.5%
Small Regional Shopping Centre 1 21 829 219 1.0% 355 16 258 245 7.6%
Vacant land (including house) 2 – – – 9 – – –
Total Retail 58 1 410 461 46 368 3.3% 28 213 19 996 156 7.7%
OFFICE PORTFOLIO (RSA)
High Rise Offices: Investec 2 83 781 – – 2 706 32 304 * 9.5%
High Rise Offices 16 206 418 21 398 10.4% 3 429 16 617 141 7.8%
Low Rise Offices 87 631 221 46 729 7.4% 11 528 18 262 138 8.4%
Low Rise Offices*** 1 2 376 1 214 51.1% 62 26 010 * 4.8%
Office Parks 63 740 285 68 028 9.2% 11 938 16 122 135 8.2%
Office/Warehouse 1 70 201 3 030 4.3% 598 8 513 80 9.0%
Mixed use: Office and Retail 3 42 124 2 417 5.7% 736 17 480 146 8.6%
Hospitals 1 14 022 – – 430 30 630 * 8.8%
Vacant Land 10 – – – 1 536 – – –
Total Office 184 1 790 428 142 816 8.0% 32 963 17 562 142 8.4%
INDUSTRIAL PORTFOLIO (RSA)
Warehousing 99 959 617 46 711 4.9% 3 738 3 895 36 10.0%
Industrial Parks 10 381 967 17 075 4.5% 1 631 4 272 42 8.7%
Retail Warehousing 9 90 231 8 093 9.0% 460 5 108 58 10.7%
Motor-related Outlets 11 55 543 18 981 34.2% 371 6 694 85 10.4%
Mini Units 18 142 682 7 043 4.9% 692 4 848 54 9.6%
Midi Units 8 80 738 2 490 3.1% 388 4 812 48 8.5%
Maxi Units 1 14 466 – – 66 4 535 47 9.4%
Low Grade Industrial 24 141 239 3 449 2.4% 472 3 338 37 9.5%
High-Tech Industrial 14 134 312 6 921 5.2% 1 104 8 224 43 5.3%
High-Grade Industrial 25 209 539 7 746 3.7% 1 289 6 151 61 9.3%
Vacant Land 10 14 741 – – 225 – – –
Total Industrial 229 2 225 075 118 509 5.3% 10 436 4 589 43 10.1%
Total Growthpoint (RSA excluding V&A) 471 5 425 964 307 693 5.7% 71 612 12 875 107 8.3%
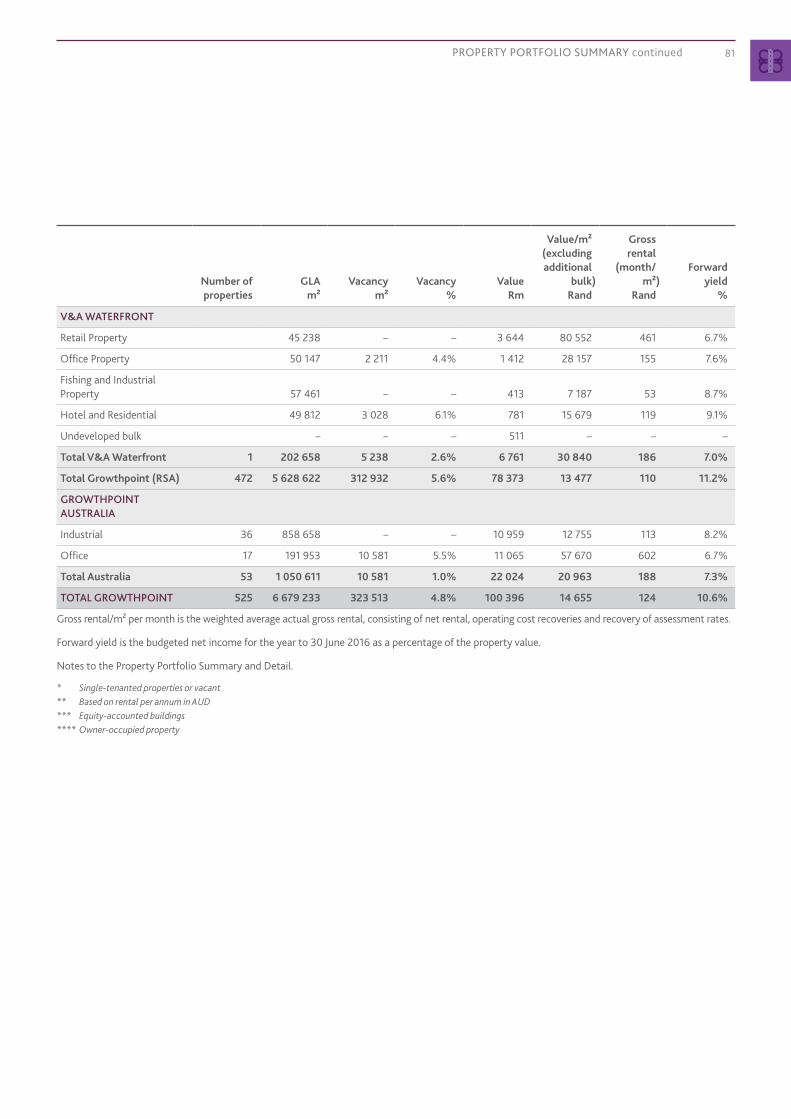
81PROPERTY PORTFOLIO SUMMARY continued
Number of properties
GLAm²
Vacancy m²
Vacancy%
ValueRm
Value/m² (excluding additional
bulk) Rand
Gross rental
(month/m²)
Rand
Forward yield
%
V&A WATERFRONT
Retail Property 45 238 – – 3 644 80 552 461 6.7%
Office Property 50 147 2 211 4.4% 1 412 28 157 155 7.6%
Fishing and Industrial Property 57 461 – – 413 7 187 53 8.7%
Hotel and Residential 49 812 3 028 6.1% 781 15 679 119 9.1%
Undeveloped bulk – – – 511 – – –
Total V&A Waterfront 1 202 658 5 238 2.6% 6 761 30 840 186 7.0%
Total Growthpoint (RSA) 472 5 628 622 312 932 5.6% 78 373 13 477 110 11.2%
GROWTHPOINT AUSTRALIA
Industrial 36 858 658 – – 10 959 12 755 113 8.2%
Office 17 191 953 10 581 5.5% 11 065 57 670 602 6.7%
Total Australia 53 1 050 611 10 581 1.0% 22 024 20 963 188 7.3%
TOTAL GROWTHPOINT 525 6 679 233 323 513 4.8% 100 396 14 655 124 10.6%
Gross rental/m² per month is the weighted average actual gross rental, consisting of net rental, operating cost recoveries and recovery of assessment rates.
Forward yield is the budgeted net income for the year to 30 June 2016 as a percentage of the property value.
Notes to the Property Portfolio Summary and Detail.
* Single-tenanted properties or vacant** Based on rental per annum in AUD*** Equity-accounted buildings**** Owner-occupied property
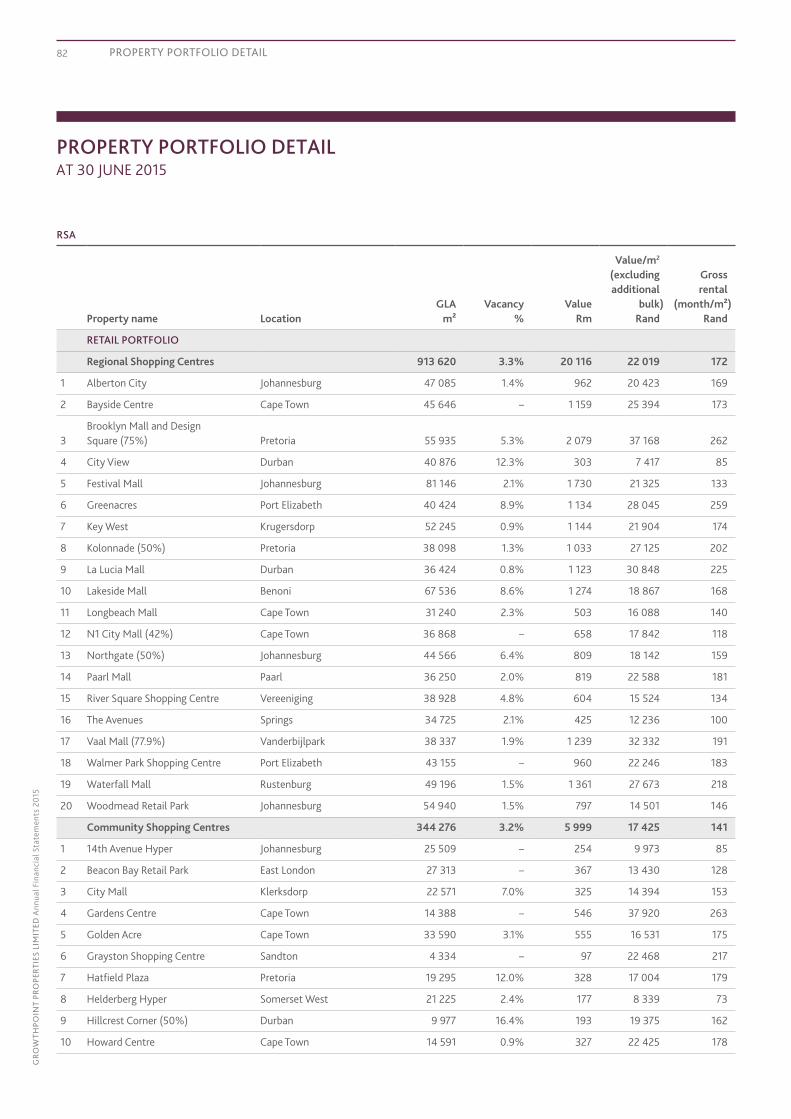
82
GRO
WTH
POIN
T PR
OPE
RTIE
S LI
MIT
ED A
nnua
l Fin
anci
al S
tate
men
ts 2
015
PROPERTY PORTFOLIO DETAIL
PROPERTY PORTFOLIO DETAILAT 30 JUNE 2015
RSA
Property name LocationGLA
m²Vacancy
%Value
Rm
Value/m2 (excluding additional
bulk)Rand
Gross rental
(month/m²)Rand
RETAIL PORTFOLIO
Regional Shopping Centres 913 620 3.3% 20 116 22 019 172
1 Alberton City Johannesburg 47 085 1.4% 962 20 423 169
2 Bayside Centre Cape Town 45 646 – 1 159 25 394 173
3Brooklyn Mall and Design Square (75%) Pretoria 55 935 5.3% 2 079 37 168 262
4 City View Durban 40 876 12.3% 303 7 417 85
5 Festival Mall Johannesburg 81 146 2.1% 1 730 21 325 133
6 Greenacres Port Elizabeth 40 424 8.9% 1 134 28 045 259
7 Key West Krugersdorp 52 245 0.9% 1 144 21 904 174
8 Kolonnade (50%) Pretoria 38 098 1.3% 1 033 27 125 202
9 La Lucia Mall Durban 36 424 0.8% 1 123 30 848 225
10 Lakeside Mall Benoni 67 536 8.6% 1 274 18 867 168
11 Longbeach Mall Cape Town 31 240 2.3% 503 16 088 140
12 N1 City Mall (42%) Cape Town 36 868 – 658 17 842 118
13 Northgate (50%) Johannesburg 44 566 6.4% 809 18 142 159
14 Paarl Mall Paarl 36 250 2.0% 819 22 588 181
15 River Square Shopping Centre Vereeniging 38 928 4.8% 604 15 524 134
16 The Avenues Springs 34 725 2.1% 425 12 236 100
17 Vaal Mall (77.9%) Vanderbijlpark 38 337 1.9% 1 239 32 332 191
18 Walmer Park Shopping Centre Port Elizabeth 43 155 – 960 22 246 183
19 Waterfall Mall Rustenburg 49 196 1.5% 1 361 27 673 218
20 Woodmead Retail Park Johannesburg 54 940 1.5% 797 14 501 146
Community Shopping Centres 344 276 3.2% 5 999 17 425 141
1 14th Avenue Hyper Johannesburg 25 509 – 254 9 973 85
2 Beacon Bay Retail Park East London 27 313 – 367 13 430 128
3 City Mall Klerksdorp 22 571 7.0% 325 14 394 153
4 Gardens Centre Cape Town 14 388 – 546 37 920 263
5 Golden Acre Cape Town 33 590 3.1% 555 16 531 175
6 Grayston Shopping Centre Sandton 4 334 – 97 22 468 217
7 Hatfield Plaza Pretoria 19 295 12.0% 328 17 004 179
8 Helderberg Hyper Somerset West 21 225 2.4% 177 8 339 73
9 Hillcrest Corner (50%) Durban 9 977 16.4% 193 19 375 162
10 Howard Centre Cape Town 14 591 0.9% 327 22 425 178
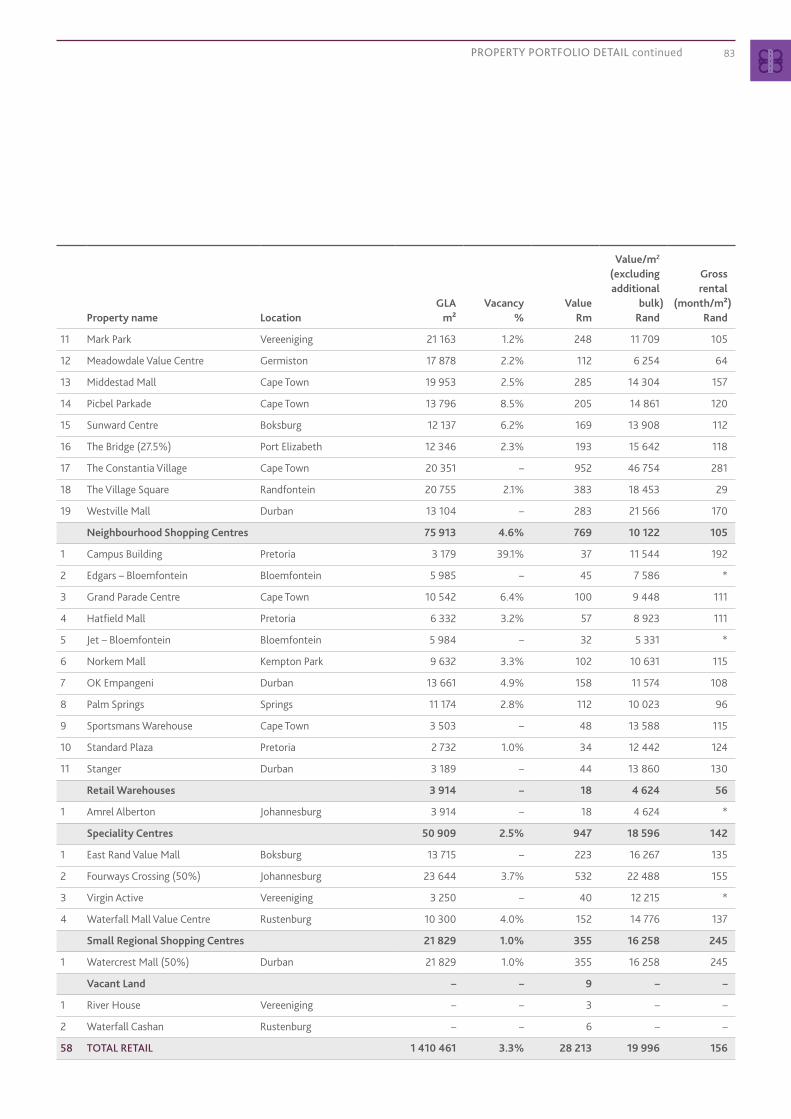
83PROPERTY PORTFOLIO DETAIL continued
Property name LocationGLA
m²Vacancy
%Value
Rm
Value/m2 (excluding additional
bulk)Rand
Gross rental
(month/m²)Rand
11 Mark Park Vereeniging 21 163 1.2% 248 11 709 105
12 Meadowdale Value Centre Germiston 17 878 2.2% 112 6 254 64
13 Middestad Mall Cape Town 19 953 2.5% 285 14 304 157
14 Picbel Parkade Cape Town 13 796 8.5% 205 14 861 120
15 Sunward Centre Boksburg 12 137 6.2% 169 13 908 112
16 The Bridge (27.5%) Port Elizabeth 12 346 2.3% 193 15 642 118
17 The Constantia Village Cape Town 20 351 – 952 46 754 281
18 The Village Square Randfontein 20 755 2.1% 383 18 453 29
19 Westville Mall Durban 13 104 – 283 21 566 170
Neighbourhood Shopping Centres 75 913 4.6% 769 10 122 105
1 Campus Building Pretoria 3 179 39.1% 37 11 544 192
2 Edgars – Bloemfontein Bloemfontein 5 985 – 45 7 586 *
3 Grand Parade Centre Cape Town 10 542 6.4% 100 9 448 111
4 Hatfield Mall Pretoria 6 332 3.2% 57 8 923 111
5 Jet – Bloemfontein Bloemfontein 5 984 – 32 5 331 *
6 Norkem Mall Kempton Park 9 632 3.3% 102 10 631 115
7 OK Empangeni Durban 13 661 4.9% 158 11 574 108
8 Palm Springs Springs 11 174 2.8% 112 10 023 96
9 Sportsmans Warehouse Cape Town 3 503 – 48 13 588 115
10 Standard Plaza Pretoria 2 732 1.0% 34 12 442 124
11 Stanger Durban 3 189 – 44 13 860 130
Retail Warehouses 3 914 – 18 4 624 56
1 Amrel Alberton Johannesburg 3 914 – 18 4 624 *
Speciality Centres 50 909 2.5% 947 18 596 142
1 East Rand Value Mall Boksburg 13 715 – 223 16 267 135
2 Fourways Crossing (50%) Johannesburg 23 644 3.7% 532 22 488 155
3 Virgin Active Vereeniging 3 250 – 40 12 215 *
4 Waterfall Mall Value Centre Rustenburg 10 300 4.0% 152 14 776 137
Small Regional Shopping Centres 21 829 1.0% 355 16 258 245
1 Watercrest Mall (50%) Durban 21 829 1.0% 355 16 258 245
Vacant Land – – 9 – –
1 River House Vereeniging – – 3 – –
2 Waterfall Cashan Rustenburg – – 6 – –
58 TOTAL RETAIL 1 410 461 3.3% 28 213 19 996 156
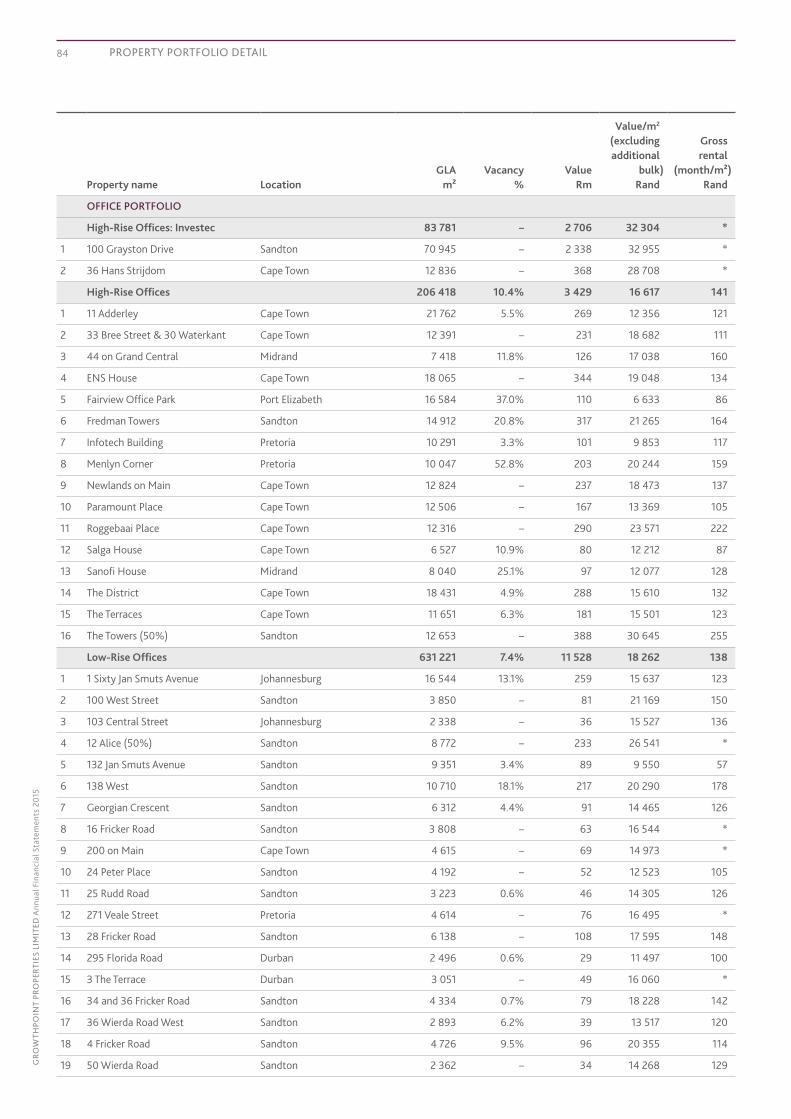
84
GRO
WTH
POIN
T PR
OPE
RTIE
S LI
MIT
ED A
nnua
l Fin
anci
al S
tate
men
ts 2
015
PROPERTY PORTFOLIO DETAIL
Property name LocationGLA
m²Vacancy
%Value
Rm
Value/m2 (excluding additional
bulk)Rand
Gross rental
(month/m²)Rand
OFFICE PORTFOLIO
High-Rise Offices: Investec 83 781 – 2 706 32 304 *
1 100 Grayston Drive Sandton 70 945 – 2 338 32 955 *
2 36 Hans Strijdom Cape Town 12 836 – 368 28 708 *
High-Rise Offices 206 418 10.4% 3 429 16 617 141
1 11 Adderley Cape Town 21 762 5.5% 269 12 356 121
2 33 Bree Street & 30 Waterkant Cape Town 12 391 – 231 18 682 111
3 44 on Grand Central Midrand 7 418 11.8% 126 17 038 160
4 ENS House Cape Town 18 065 – 344 19 048 134
5 Fairview Office Park Port Elizabeth 16 584 37.0% 110 6 633 86
6 Fredman Towers Sandton 14 912 20.8% 317 21 265 164
7 Infotech Building Pretoria 10 291 3.3% 101 9 853 117
8 Menlyn Corner Pretoria 10 047 52.8% 203 20 244 159
9 Newlands on Main Cape Town 12 824 – 237 18 473 137
10 Paramount Place Cape Town 12 506 – 167 13 369 105
11 Roggebaai Place Cape Town 12 316 – 290 23 571 222
12 Salga House Cape Town 6 527 10.9% 80 12 212 87
13 Sanofi House Midrand 8 040 25.1% 97 12 077 128
14 The District Cape Town 18 431 4.9% 288 15 610 132
15 The Terraces Cape Town 11 651 6.3% 181 15 501 123
16 The Towers (50%) Sandton 12 653 – 388 30 645 255
Low-Rise Offices 631 221 7.4% 11 528 18 262 138
1 1 Sixty Jan Smuts Avenue Johannesburg 16 544 13.1% 259 15 637 123
2 100 West Street Sandton 3 850 – 81 21 169 150
3 103 Central Street Johannesburg 2 338 – 36 15 527 136
4 12 Alice (50%) Sandton 8 772 – 233 26 541 *
5 132 Jan Smuts Avenue Sandton 9 351 3.4% 89 9 550 57
6 138 West Sandton 10 710 18.1% 217 20 290 178
7 Georgian Crescent Sandton 6 312 4.4% 91 14 465 126
8 16 Fricker Road Sandton 3 808 – 63 16 544 *
9 200 on Main Cape Town 4 615 – 69 14 973 *
10 24 Peter Place Sandton 4 192 – 52 12 523 105
11 25 Rudd Road Sandton 3 223 0.6% 46 14 305 126
12 271 Veale Street Pretoria 4 614 – 76 16 495 *
13 28 Fricker Road Sandton 6 138 – 108 17 595 148
14 295 Florida Road Durban 2 496 0.6% 29 11 497 100
15 3 The Terrace Durban 3 051 – 49 16 060 *
16 34 and 36 Fricker Road Sandton 4 334 0.7% 79 18 228 142
17 36 Wierda Road West Sandton 2 893 6.2% 39 13 517 120
18 4 Fricker Road Sandton 4 726 9.5% 96 20 355 114
19 50 Wierda Road Sandton 2 362 – 34 14 268 129
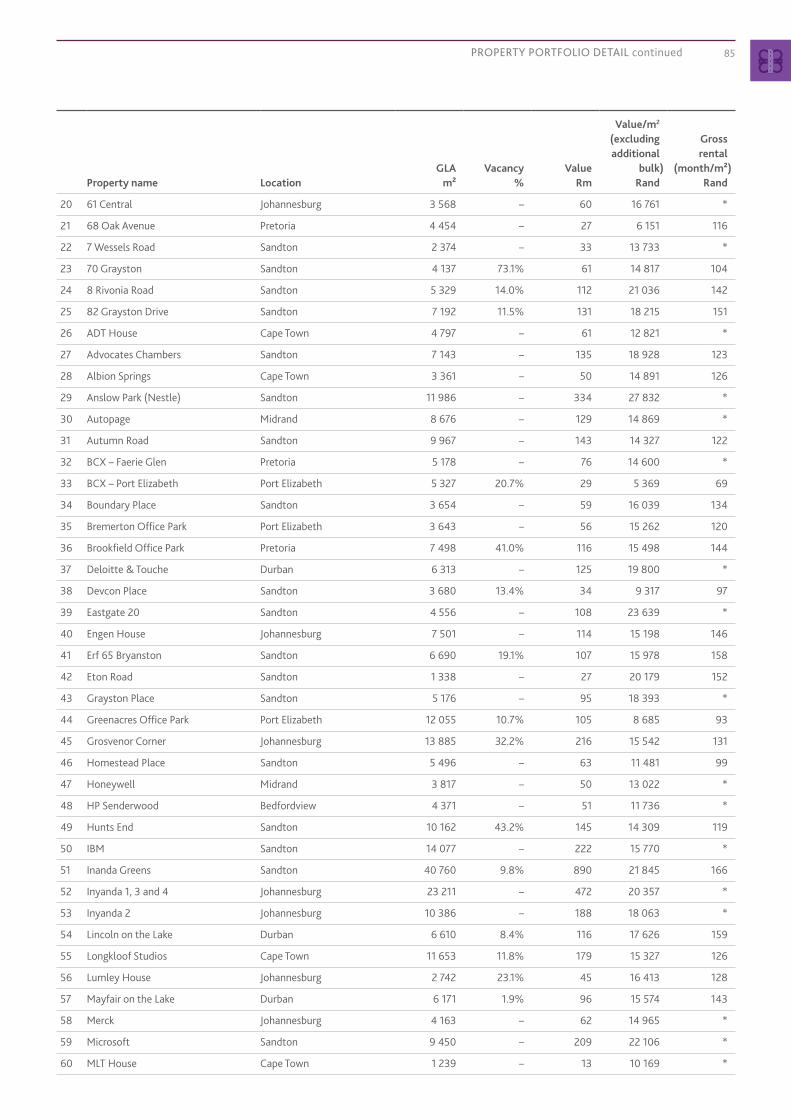
85PROPERTY PORTFOLIO DETAIL continued
Property name LocationGLA
m²Vacancy
%Value
Rm
Value/m2 (excluding additional
bulk)Rand
Gross rental
(month/m²)Rand
20 61 Central Johannesburg 3 568 – 60 16 761 *
21 68 Oak Avenue Pretoria 4 454 – 27 6 151 116
22 7 Wessels Road Sandton 2 374 – 33 13 733 *
23 70 Grayston Sandton 4 137 73.1% 61 14 817 104
24 8 Rivonia Road Sandton 5 329 14.0% 112 21 036 142
25 82 Grayston Drive Sandton 7 192 11.5% 131 18 215 151
26 ADT House Cape Town 4 797 – 61 12 821 *
27 Advocates Chambers Sandton 7 143 – 135 18 928 123
28 Albion Springs Cape Town 3 361 – 50 14 891 126
29 Anslow Park (Nestle) Sandton 11 986 – 334 27 832 *
30 Autopage Midrand 8 676 – 129 14 869 *
31 Autumn Road Sandton 9 967 – 143 14 327 122
32 BCX – Faerie Glen Pretoria 5 178 – 76 14 600 *
33 BCX – Port Elizabeth Port Elizabeth 5 327 20.7% 29 5 369 69
34 Boundary Place Sandton 3 654 – 59 16 039 134
35 Bremerton Office Park Port Elizabeth 3 643 – 56 15 262 120
36 Brookfield Office Park Pretoria 7 498 41.0% 116 15 498 144
37 Deloitte & Touche Durban 6 313 – 125 19 800 *
38 Devcon Place Sandton 3 680 13.4% 34 9 317 97
39 Eastgate 20 Sandton 4 556 – 108 23 639 *
40 Engen House Johannesburg 7 501 – 114 15 198 146
41 Erf 65 Bryanston Sandton 6 690 19.1% 107 15 978 158
42 Eton Road Sandton 1 338 – 27 20 179 152
43 Grayston Place Sandton 5 176 – 95 18 393 *
44 Greenacres Office Park Port Elizabeth 12 055 10.7% 105 8 685 93
45 Grosvenor Corner Johannesburg 13 885 32.2% 216 15 542 131
46 Homestead Place Sandton 5 496 – 63 11 481 99
47 Honeywell Midrand 3 817 – 50 13 022 *
48 HP Senderwood Bedfordview 4 371 – 51 11 736 *
49 Hunts End Sandton 10 162 43.2% 145 14 309 119
50 IBM Sandton 14 077 – 222 15 770 *
51 Inanda Greens Sandton 40 760 9.8% 890 21 845 166
52 Inyanda 1, 3 and 4 Johannesburg 23 211 – 472 20 357 *
53 Inyanda 2 Johannesburg 10 386 – 188 18 063 *
54 Lincoln on the Lake Durban 6 610 8.4% 116 17 626 159
55 Longkloof Studios Cape Town 11 653 11.8% 179 15 327 126
56 Lumley House Johannesburg 2 742 23.1% 45 16 413 128
57 Mayfair on the Lake Durban 6 171 1.9% 96 15 574 143
58 Merck Johannesburg 4 163 – 62 14 965 *
59 Microsoft Sandton 9 450 – 209 22 106 *
60 MLT House Cape Town 1 239 – 13 10 169 *
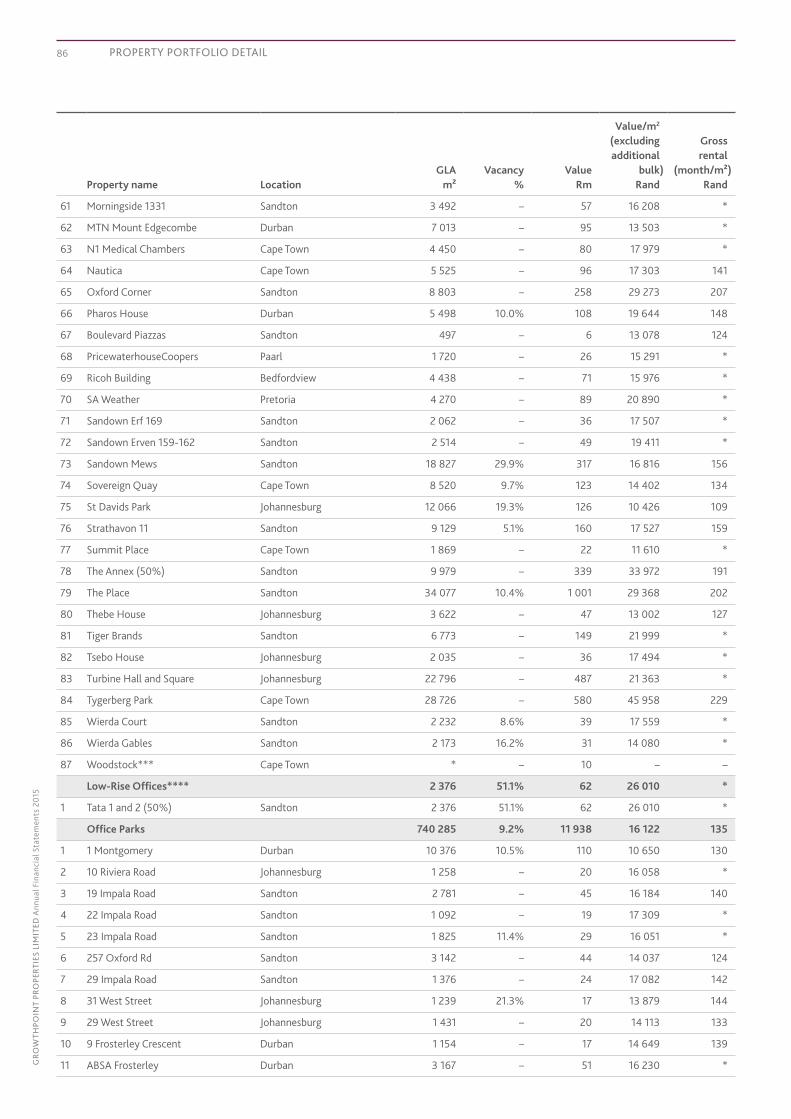
86
GRO
WTH
POIN
T PR
OPE
RTIE
S LI
MIT
ED A
nnua
l Fin
anci
al S
tate
men
ts 2
015
PROPERTY PORTFOLIO DETAIL
Property name LocationGLA
m²Vacancy
%Value
Rm
Value/m2 (excluding additional
bulk)Rand
Gross rental
(month/m²)Rand
61 Morningside 1331 Sandton 3 492 – 57 16 208 *
62 MTN Mount Edgecombe Durban 7 013 – 95 13 503 *
63 N1 Medical Chambers Cape Town 4 450 – 80 17 979 *
64 Nautica Cape Town 5 525 – 96 17 303 141
65 Oxford Corner Sandton 8 803 – 258 29 273 207
66 Pharos House Durban 5 498 10.0% 108 19 644 148
67 Boulevard Piazzas Sandton 497 – 6 13 078 124
68 PricewaterhouseCoopers Paarl 1 720 – 26 15 291 *
69 Ricoh Building Bedfordview 4 438 – 71 15 976 *
70 SA Weather Pretoria 4 270 – 89 20 890 *
71 Sandown Erf 169 Sandton 2 062 – 36 17 507 *
72 Sandown Erven 159-162 Sandton 2 514 – 49 19 411 *
73 Sandown Mews Sandton 18 827 29.9% 317 16 816 156
74 Sovereign Quay Cape Town 8 520 9.7% 123 14 402 134
75 St Davids Park Johannesburg 12 066 19.3% 126 10 426 109
76 Strathavon 11 Sandton 9 129 5.1% 160 17 527 159
77 Summit Place Cape Town 1 869 – 22 11 610 *
78 The Annex (50%) Sandton 9 979 – 339 33 972 191
79 The Place Sandton 34 077 10.4% 1 001 29 368 202
80 Thebe House Johannesburg 3 622 – 47 13 002 127
81 Tiger Brands Sandton 6 773 – 149 21 999 *
82 Tsebo House Johannesburg 2 035 – 36 17 494 *
83 Turbine Hall and Square Johannesburg 22 796 – 487 21 363 *
84 Tygerberg Park Cape Town 28 726 – 580 45 958 229
85 Wierda Court Sandton 2 232 8.6% 39 17 559 *
86 Wierda Gables Sandton 2 173 16.2% 31 14 080 *
87 Woodstock*** Cape Town * – 10 – –
Low-Rise Offices**** 2 376 51.1% 62 26 010 *
1 Tata 1 and 2 (50%) Sandton 2 376 51.1% 62 26 010 *
Office Parks 740 285 9.2% 11 938 16 122 135
1 1 Montgomery Durban 10 376 10.5% 110 10 650 130
2 10 Riviera Road Johannesburg 1 258 – 20 16 058 *
3 19 Impala Road Sandton 2 781 – 45 16 184 140
4 22 Impala Road Sandton 1 092 – 19 17 309 *
5 23 Impala Road Sandton 1 825 11.4% 29 16 051 *
6 257 Oxford Rd Sandton 3 142 – 44 14 037 124
7 29 Impala Road Sandton 1 376 – 24 17 082 142
8 31 West Street Johannesburg 1 239 21.3% 17 13 879 144
9 29 West Street Johannesburg 1 431 – 20 14 113 133
10 9 Frosterley Crescent Durban 1 154 – 17 14 649 139
11 ABSA Frosterley Durban 3 167 – 51 16 230 *
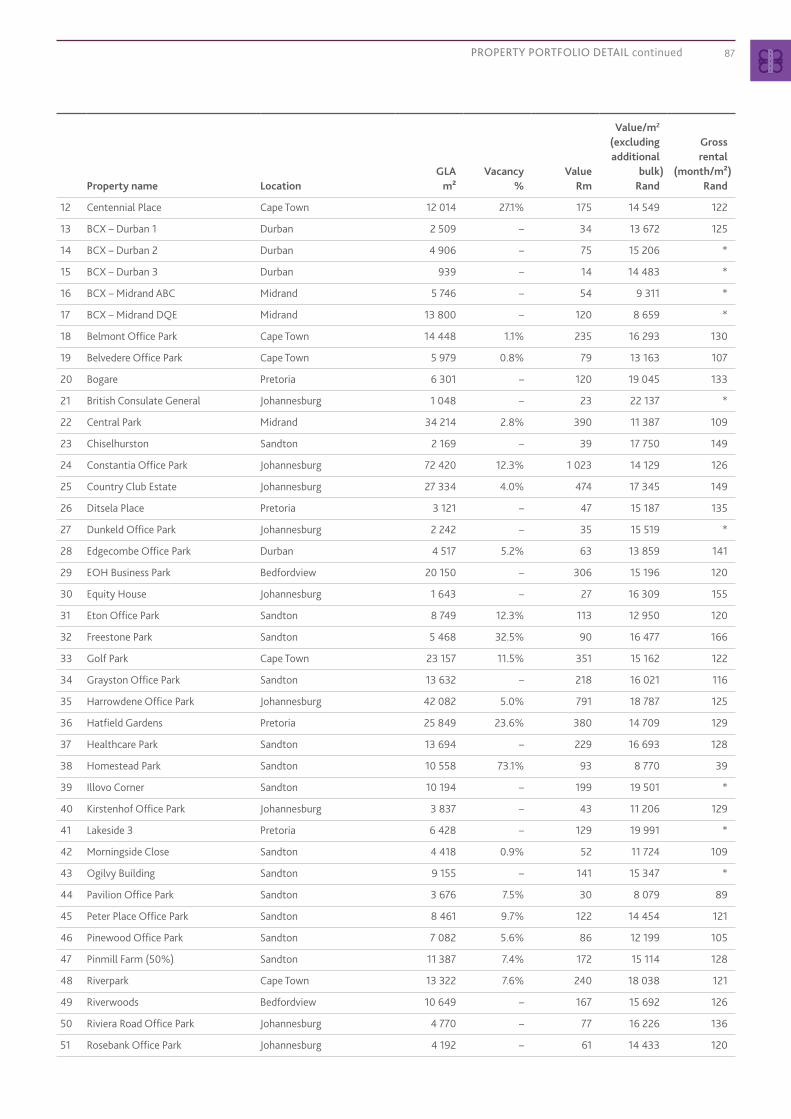
87PROPERTY PORTFOLIO DETAIL continued
Property name LocationGLA
m²Vacancy
%Value
Rm
Value/m2 (excluding additional
bulk)Rand
Gross rental
(month/m²)Rand
12 Centennial Place Cape Town 12 014 27.1% 175 14 549 122
13 BCX – Durban 1 Durban 2 509 – 34 13 672 125
14 BCX – Durban 2 Durban 4 906 – 75 15 206 *
15 BCX – Durban 3 Durban 939 – 14 14 483 *
16 BCX – Midrand ABC Midrand 5 746 – 54 9 311 *
17 BCX – Midrand DQE Midrand 13 800 – 120 8 659 *
18 Belmont Office Park Cape Town 14 448 1.1% 235 16 293 130
19 Belvedere Office Park Cape Town 5 979 0.8% 79 13 163 107
20 Bogare Pretoria 6 301 – 120 19 045 133
21 British Consulate General Johannesburg 1 048 – 23 22 137 *
22 Central Park Midrand 34 214 2.8% 390 11 387 109
23 Chiselhurston Sandton 2 169 – 39 17 750 149
24 Constantia Office Park Johannesburg 72 420 12.3% 1 023 14 129 126
25 Country Club Estate Johannesburg 27 334 4.0% 474 17 345 149
26 Ditsela Place Pretoria 3 121 – 47 15 187 135
27 Dunkeld Office Park Johannesburg 2 242 – 35 15 519 *
28 Edgecombe Office Park Durban 4 517 5.2% 63 13 859 141
29 EOH Business Park Bedfordview 20 150 – 306 15 196 120
30 Equity House Johannesburg 1 643 – 27 16 309 155
31 Eton Office Park Sandton 8 749 12.3% 113 12 950 120
32 Freestone Park Sandton 5 468 32.5% 90 16 477 166
33 Golf Park Cape Town 23 157 11.5% 351 15 162 122
34 Grayston Office Park Sandton 13 632 – 218 16 021 116
35 Harrowdene Office Park Johannesburg 42 082 5.0% 791 18 787 125
36 Hatfield Gardens Pretoria 25 849 23.6% 380 14 709 129
37 Healthcare Park Sandton 13 694 – 229 16 693 128
38 Homestead Park Sandton 10 558 73.1% 93 8 770 39
39 Illovo Corner Sandton 10 194 – 199 19 501 *
40 Kirstenhof Office Park Johannesburg 3 837 – 43 11 206 129
41 Lakeside 3 Pretoria 6 428 – 129 19 991 *
42 Morningside Close Sandton 4 418 0.9% 52 11 724 109
43 Ogilvy Building Sandton 9 155 – 141 15 347 *
44 Pavilion Office Park Sandton 3 676 7.5% 30 8 079 89
45 Peter Place Office Park Sandton 8 461 9.7% 122 14 454 121
46 Pinewood Office Park Sandton 7 082 5.6% 86 12 199 105
47 Pinmill Farm (50%) Sandton 11 387 7.4% 172 15 114 128
48 Riverpark Cape Town 13 322 7.6% 240 18 038 121
49 Riverwoods Bedfordview 10 649 – 167 15 692 126
50 Riviera Road Office Park Johannesburg 4 770 – 77 16 226 136
51 Rosebank Office Park Johannesburg 4 192 – 61 14 433 120
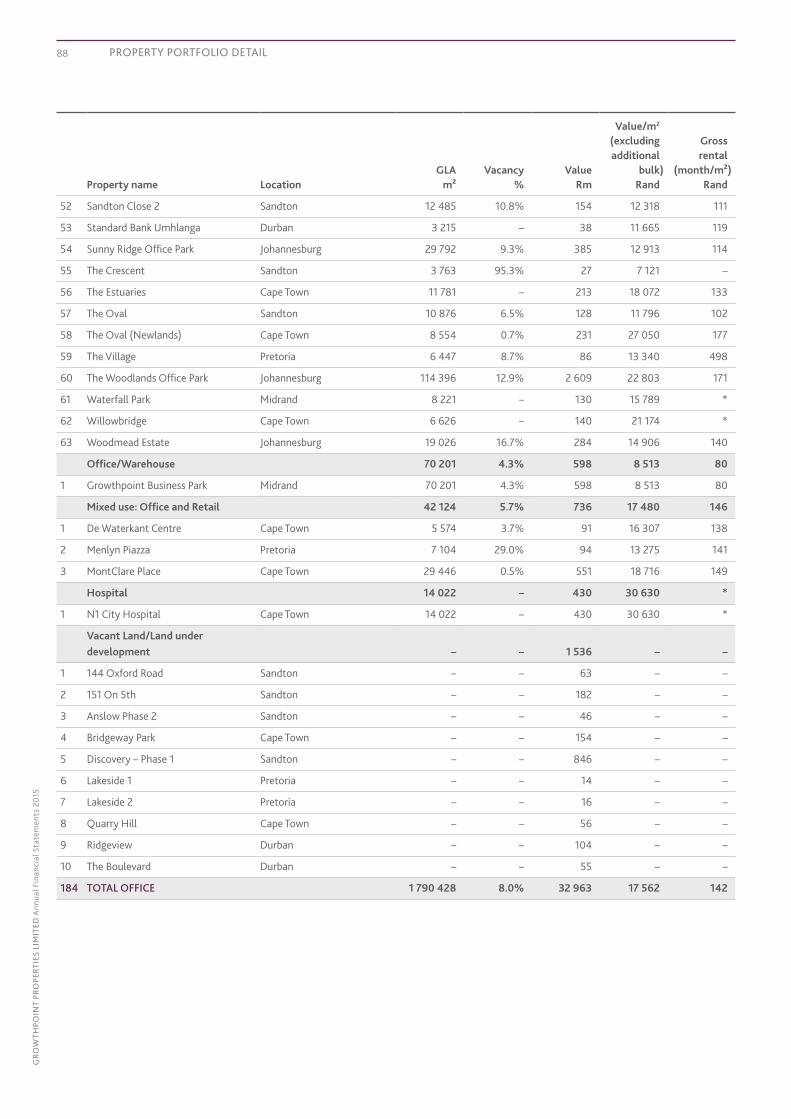
88
GRO
WTH
POIN
T PR
OPE
RTIE
S LI
MIT
ED A
nnua
l Fin
anci
al S
tate
men
ts 2
015
PROPERTY PORTFOLIO DETAIL
Property name LocationGLA
m²Vacancy
%Value
Rm
Value/m2 (excluding additional
bulk)Rand
Gross rental
(month/m²)Rand
52 Sandton Close 2 Sandton 12 485 10.8% 154 12 318 111
53 Standard Bank Umhlanga Durban 3 215 – 38 11 665 119
54 Sunny Ridge Office Park Johannesburg 29 792 9.3% 385 12 913 114
55 The Crescent Sandton 3 763 95.3% 27 7 121 –
56 The Estuaries Cape Town 11 781 – 213 18 072 133
57 The Oval Sandton 10 876 6.5% 128 11 796 102
58 The Oval (Newlands) Cape Town 8 554 0.7% 231 27 050 177
59 The Village Pretoria 6 447 8.7% 86 13 340 498
60 The Woodlands Office Park Johannesburg 114 396 12.9% 2 609 22 803 171
61 Waterfall Park Midrand 8 221 – 130 15 789 *
62 Willowbridge Cape Town 6 626 – 140 21 174 *
63 Woodmead Estate Johannesburg 19 026 16.7% 284 14 906 140
Office/Warehouse 70 201 4.3% 598 8 513 80
1 Growthpoint Business Park Midrand 70 201 4.3% 598 8 513 80
Mixed use: Office and Retail 42 124 5.7% 736 17 480 146
1 De Waterkant Centre Cape Town 5 574 3.7% 91 16 307 138
2 Menlyn Piazza Pretoria 7 104 29.0% 94 13 275 141
3 MontClare Place Cape Town 29 446 0.5% 551 18 716 149
Hospital 14 022 – 430 30 630 *
1 N1 City Hospital Cape Town 14 022 – 430 30 630 *
Vacant Land/Land under development – – 1 536 – –
1 144 Oxford Road Sandton – – 63 – –
2 151 On 5th Sandton – – 182 – –
3 Anslow Phase 2 Sandton – – 46 – –
4 Bridgeway Park Cape Town – – 154 – –
5 Discovery – Phase 1 Sandton – – 846 – –
6 Lakeside 1 Pretoria – – 14 – –
7 Lakeside 2 Pretoria – – 16 – –
8 Quarry Hill Cape Town – – 56 – –
9 Ridgeview Durban – – 104 – –
10 The Boulevard Durban – – 55 – –
184 TOTAL OFFICE 1 790 428 8.0% 32 963 17 562 142
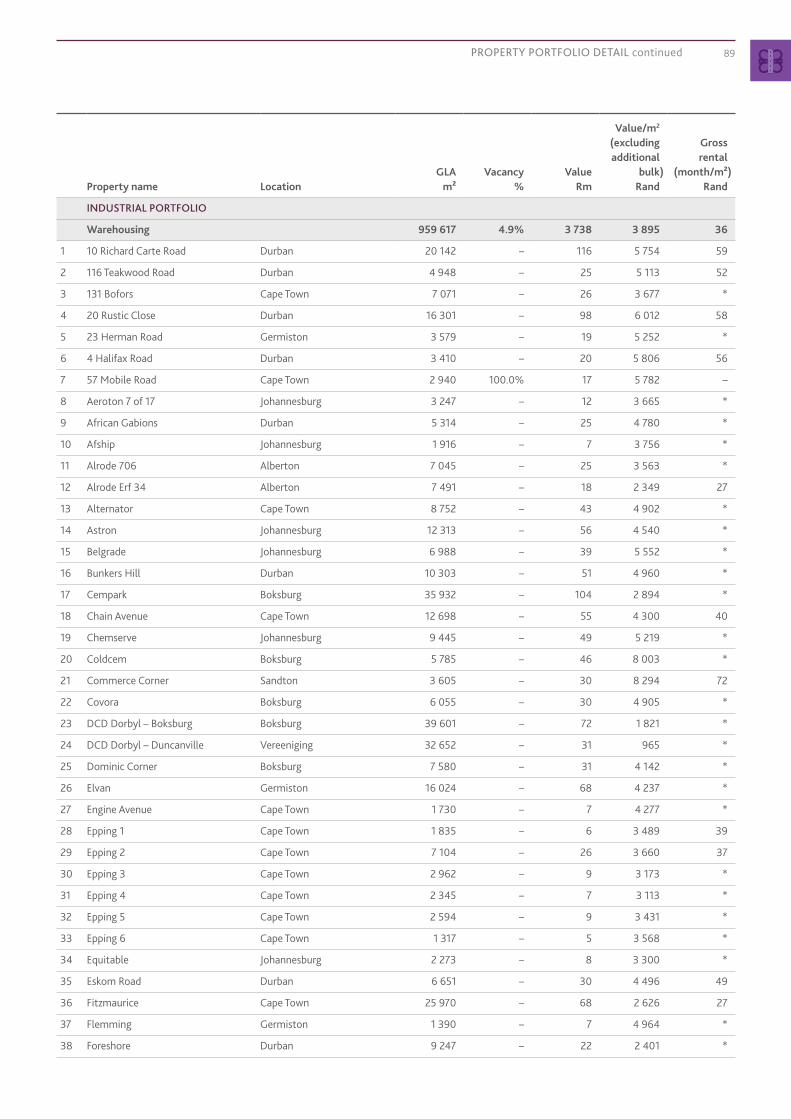
89PROPERTY PORTFOLIO DETAIL continued
Property name LocationGLA
m²Vacancy
%Value
Rm
Value/m2 (excluding additional
bulk)Rand
Gross rental
(month/m²)Rand
INDUSTRIAL PORTFOLIO
Warehousing 959 617 4.9% 3 738 3 895 36
1 10 Richard Carte Road Durban 20 142 – 116 5 754 59
2 116 Teakwood Road Durban 4 948 – 25 5 113 52
3 131 Bofors Cape Town 7 071 – 26 3 677 *
4 20 Rustic Close Durban 16 301 – 98 6 012 58
5 23 Herman Road Germiston 3 579 – 19 5 252 *
6 4 Halifax Road Durban 3 410 – 20 5 806 56
7 57 Mobile Road Cape Town 2 940 100.0% 17 5 782 –
8 Aeroton 7 of 17 Johannesburg 3 247 – 12 3 665 *
9 African Gabions Durban 5 314 – 25 4 780 *
10 Afship Johannesburg 1 916 – 7 3 756 *
11 Alrode 706 Alberton 7 045 – 25 3 563 *
12 Alrode Erf 34 Alberton 7 491 – 18 2 349 27
13 Alternator Cape Town 8 752 – 43 4 902 *
14 Astron Johannesburg 12 313 – 56 4 540 *
15 Belgrade Johannesburg 6 988 – 39 5 552 *
16 Bunkers Hill Durban 10 303 – 51 4 960 *
17 Cempark Boksburg 35 932 – 104 2 894 *
18 Chain Avenue Cape Town 12 698 – 55 4 300 40
19 Chemserve Johannesburg 9 445 – 49 5 219 *
20 Coldcem Boksburg 5 785 – 46 8 003 *
21 Commerce Corner Sandton 3 605 – 30 8 294 72
22 Covora Boksburg 6 055 – 30 4 905 *
23 DCD Dorbyl – Boksburg Boksburg 39 601 – 72 1 821 *
24 DCD Dorbyl – Duncanville Vereeniging 32 652 – 31 965 *
25 Dominic Corner Boksburg 7 580 – 31 4 142 *
26 Elvan Germiston 16 024 – 68 4 237 *
27 Engine Avenue Cape Town 1 730 – 7 4 277 *
28 Epping 1 Cape Town 1 835 – 6 3 489 39
29 Epping 2 Cape Town 7 104 – 26 3 660 37
30 Epping 3 Cape Town 2 962 – 9 3 173 *
31 Epping 4 Cape Town 2 345 – 7 3 113 *
32 Epping 5 Cape Town 2 594 – 9 3 431 *
33 Epping 6 Cape Town 1 317 – 5 3 568 *
34 Equitable Johannesburg 2 273 – 8 3 300 *
35 Eskom Road Durban 6 651 – 30 4 496 49
36 Fitzmaurice Cape Town 25 970 – 68 2 626 27
37 Flemming Germiston 1 390 – 7 4 964 *
38 Foreshore Durban 9 247 – 22 2 401 *
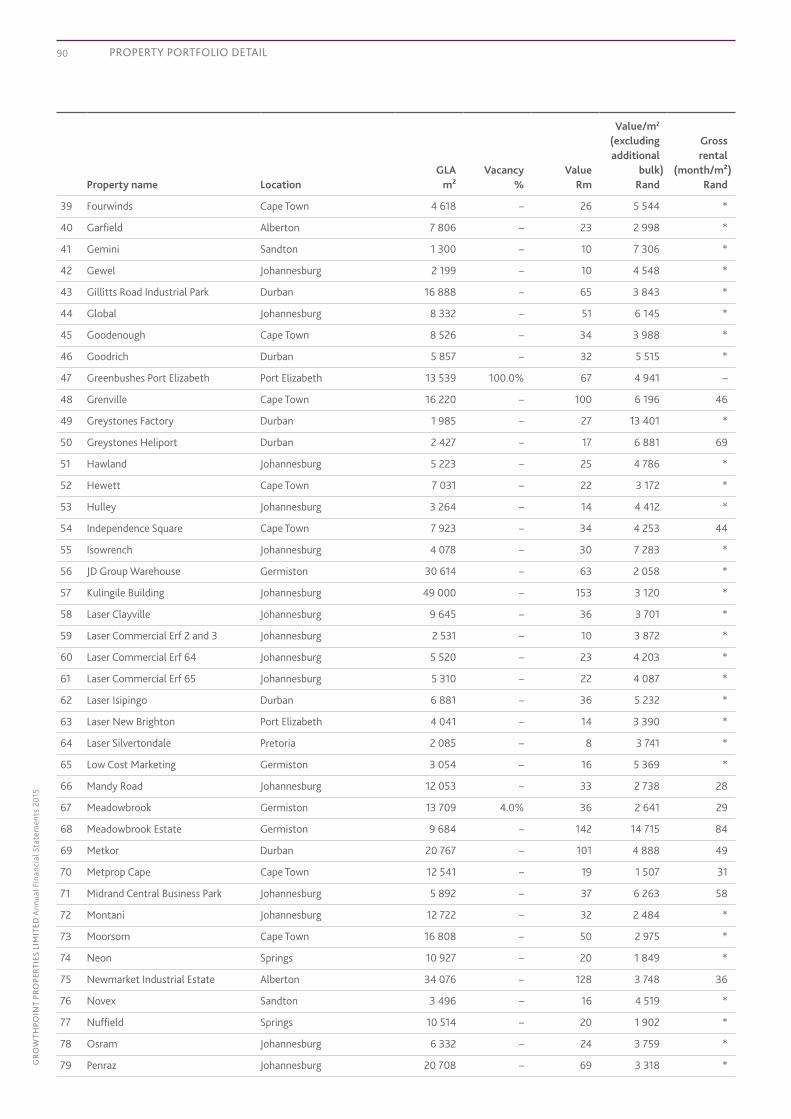
90
GRO
WTH
POIN
T PR
OPE
RTIE
S LI
MIT
ED A
nnua
l Fin
anci
al S
tate
men
ts 2
015
PROPERTY PORTFOLIO DETAIL
Property name LocationGLA
m²Vacancy
%Value
Rm
Value/m2 (excluding additional
bulk)Rand
Gross rental
(month/m²)Rand
39 Fourwinds Cape Town 4 618 – 26 5 544 *
40 Garfield Alberton 7 806 – 23 2 998 *
41 Gemini Sandton 1 300 – 10 7 306 *
42 Gewel Johannesburg 2 199 – 10 4 548 *
43 Gillitts Road Industrial Park Durban 16 888 – 65 3 843 *
44 Global Johannesburg 8 332 – 51 6 145 *
45 Goodenough Cape Town 8 526 – 34 3 988 *
46 Goodrich Durban 5 857 – 32 5 515 *
47 Greenbushes Port Elizabeth Port Elizabeth 13 539 100.0% 67 4 941 –
48 Grenville Cape Town 16 220 – 100 6 196 46
49 Greystones Factory Durban 1 985 – 27 13 401 *
50 Greystones Heliport Durban 2 427 – 17 6 881 69
51 Hawland Johannesburg 5 223 – 25 4 786 *
52 Hewett Cape Town 7 031 – 22 3 172 *
53 Hulley Johannesburg 3 264 – 14 4 412 *
54 Independence Square Cape Town 7 923 – 34 4 253 44
55 Isowrench Johannesburg 4 078 – 30 7 283 *
56 JD Group Warehouse Germiston 30 614 – 63 2 058 *
57 Kulingile Building Johannesburg 49 000 – 153 3 120 *
58 Laser Clayville Johannesburg 9 645 – 36 3 701 *
59 Laser Commercial Erf 2 and 3 Johannesburg 2 531 – 10 3 872 *
60 Laser Commercial Erf 64 Johannesburg 5 520 – 23 4 203 *
61 Laser Commercial Erf 65 Johannesburg 5 310 – 22 4 087 *
62 Laser Isipingo Durban 6 881 – 36 5 232 *
63 Laser New Brighton Port Elizabeth 4 041 – 14 3 390 *
64 Laser Silvertondale Pretoria 2 085 – 8 3 741 *
65 Low Cost Marketing Germiston 3 054 – 16 5 369 *
66 Mandy Road Johannesburg 12 053 – 33 2 738 28
67 Meadowbrook Germiston 13 709 4.0% 36 2 641 29
68 Meadowbrook Estate Germiston 9 684 – 142 14 715 84
69 Metkor Durban 20 767 – 101 4 888 49
70 Metprop Cape Cape Town 12 541 – 19 1 507 31
71 Midrand Central Business Park Johannesburg 5 892 – 37 6 263 58
72 Montani Johannesburg 12 722 – 32 2 484 *
73 Moorsom Cape Town 16 808 – 50 2 975 *
74 Neon Springs 10 927 – 20 1 849 *
75 Newmarket Industrial Estate Alberton 34 076 – 128 3 748 36
76 Novex Sandton 3 496 – 16 4 519 *
77 Nuffield Springs 10 514 – 20 1 902 *
78 Osram Johannesburg 6 332 – 24 3 759 *
79 Penraz Johannesburg 20 708 – 69 3 318 *
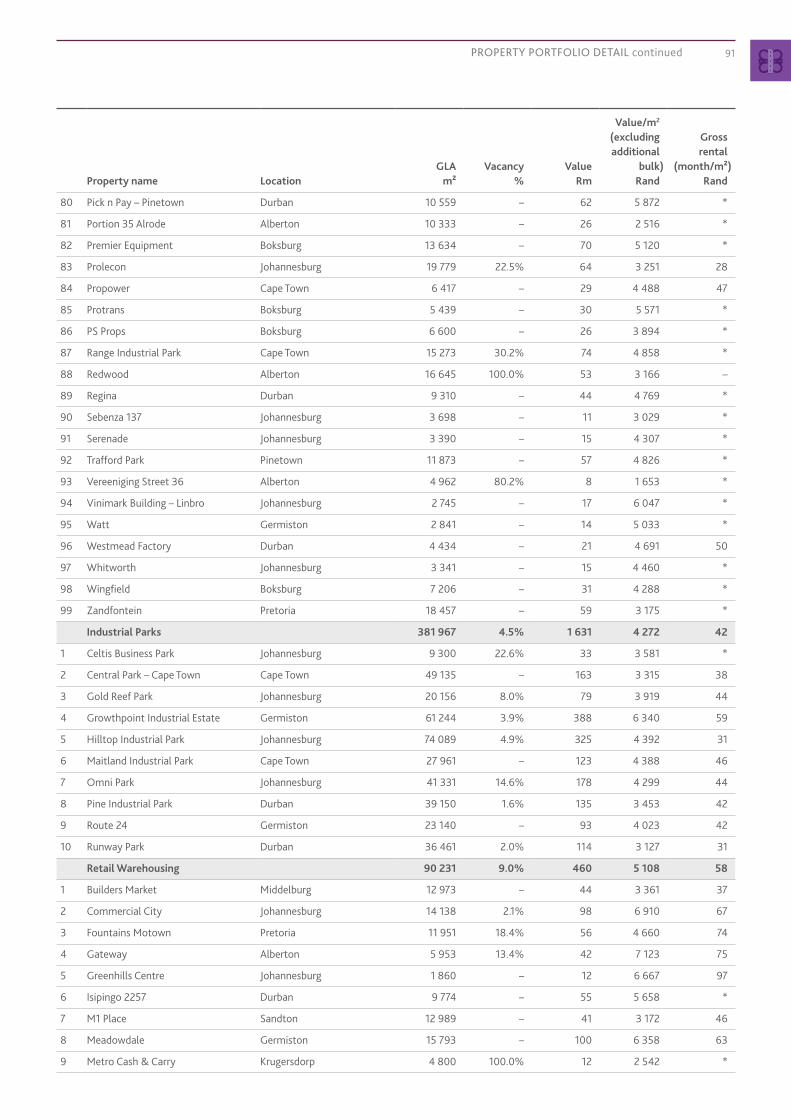
91PROPERTY PORTFOLIO DETAIL continued
Property name LocationGLA
m²Vacancy
%Value
Rm
Value/m2 (excluding additional
bulk)Rand
Gross rental
(month/m²)Rand
80 Pick n Pay – Pinetown Durban 10 559 – 62 5 872 *
81 Portion 35 Alrode Alberton 10 333 – 26 2 516 *
82 Premier Equipment Boksburg 13 634 – 70 5 120 *
83 Prolecon Johannesburg 19 779 22.5% 64 3 251 28
84 Propower Cape Town 6 417 – 29 4 488 47
85 Protrans Boksburg 5 439 – 30 5 571 *
86 PS Props Boksburg 6 600 – 26 3 894 *
87 Range Industrial Park Cape Town 15 273 30.2% 74 4 858 *
88 Redwood Alberton 16 645 100.0% 53 3 166 –
89 Regina Durban 9 310 – 44 4 769 *
90 Sebenza 137 Johannesburg 3 698 – 11 3 029 *
91 Serenade Johannesburg 3 390 – 15 4 307 *
92 Trafford Park Pinetown 11 873 – 57 4 826 *
93 Vereeniging Street 36 Alberton 4 962 80.2% 8 1 653 *
94 Vinimark Building – Linbro Johannesburg 2 745 – 17 6 047 *
95 Watt Germiston 2 841 – 14 5 033 *
96 Westmead Factory Durban 4 434 – 21 4 691 50
97 Whitworth Johannesburg 3 341 – 15 4 460 *
98 Wingfield Boksburg 7 206 – 31 4 288 *
99 Zandfontein Pretoria 18 457 – 59 3 175 *
Industrial Parks 381 967 4.5% 1 631 4 272 42
1 Celtis Business Park Johannesburg 9 300 22.6% 33 3 581 *
2 Central Park – Cape Town Cape Town 49 135 – 163 3 315 38
3 Gold Reef Park Johannesburg 20 156 8.0% 79 3 919 44
4 Growthpoint Industrial Estate Germiston 61 244 3.9% 388 6 340 59
5 Hilltop Industrial Park Johannesburg 74 089 4.9% 325 4 392 31
6 Maitland Industrial Park Cape Town 27 961 – 123 4 388 46
7 Omni Park Johannesburg 41 331 14.6% 178 4 299 44
8 Pine Industrial Park Durban 39 150 1.6% 135 3 453 42
9 Route 24 Germiston 23 140 – 93 4 023 42
10 Runway Park Durban 36 461 2.0% 114 3 127 31
Retail Warehousing 90 231 9.0% 460 5 108 58
1 Builders Market Middelburg 12 973 – 44 3 361 37
2 Commercial City Johannesburg 14 138 2.1% 98 6 910 67
3 Fountains Motown Pretoria 11 951 18.4% 56 4 660 74
4 Gateway Alberton 5 953 13.4% 42 7 123 75
5 Greenhills Centre Johannesburg 1 860 – 12 6 667 97
6 Isipingo 2257 Durban 9 774 – 55 5 658 *
7 M1 Place Sandton 12 989 – 41 3 172 46
8 Meadowdale Germiston 15 793 – 100 6 358 63
9 Metro Cash & Carry Krugersdorp 4 800 100.0% 12 2 542 *
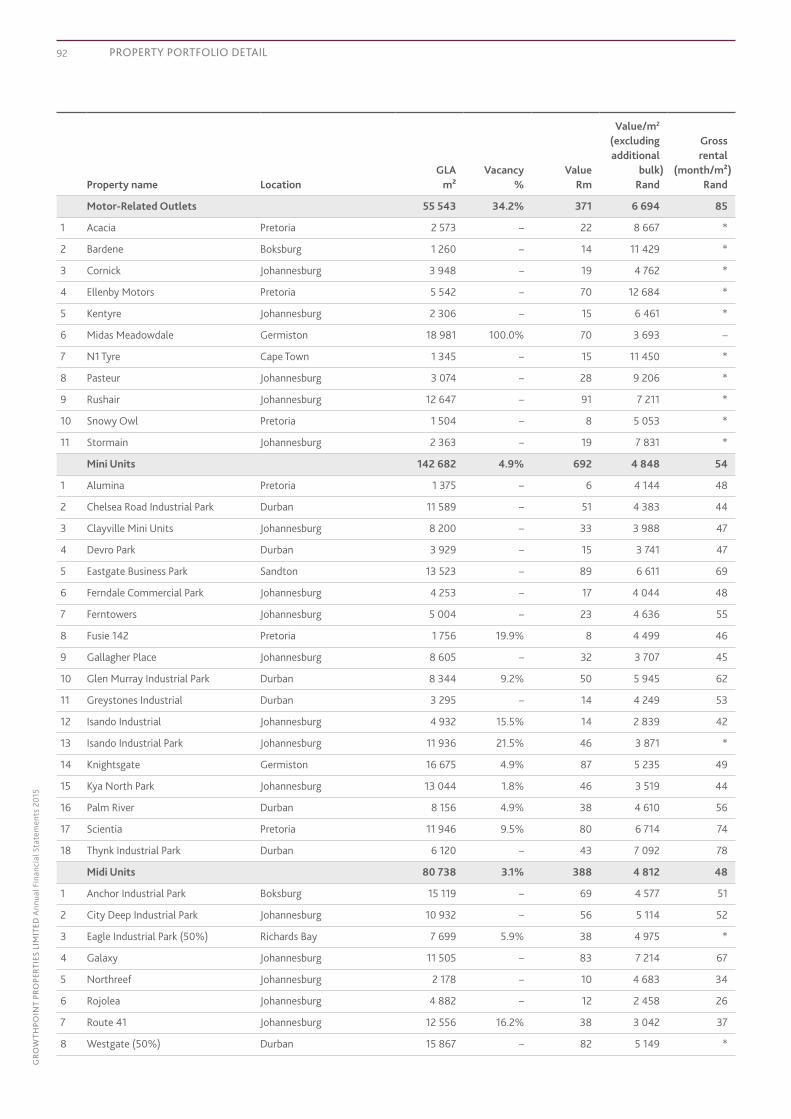
92
GRO
WTH
POIN
T PR
OPE
RTIE
S LI
MIT
ED A
nnua
l Fin
anci
al S
tate
men
ts 2
015
PROPERTY PORTFOLIO DETAIL
Property name LocationGLA
m²Vacancy
%Value
Rm
Value/m2 (excluding additional
bulk)Rand
Gross rental
(month/m²)Rand
Motor-Related Outlets 55 543 34.2% 371 6 694 85
1 Acacia Pretoria 2 573 – 22 8 667 *
2 Bardene Boksburg 1 260 – 14 11 429 *
3 Cornick Johannesburg 3 948 – 19 4 762 *
4 Ellenby Motors Pretoria 5 542 – 70 12 684 *
5 Kentyre Johannesburg 2 306 – 15 6 461 *
6 Midas Meadowdale Germiston 18 981 100.0% 70 3 693 –
7 N1 Tyre Cape Town 1 345 – 15 11 450 *
8 Pasteur Johannesburg 3 074 – 28 9 206 *
9 Rushair Johannesburg 12 647 – 91 7 211 *
10 Snowy Owl Pretoria 1 504 – 8 5 053 *
11 Stormain Johannesburg 2 363 – 19 7 831 *
Mini Units 142 682 4.9% 692 4 848 54
1 Alumina Pretoria 1 375 – 6 4 144 48
2 Chelsea Road Industrial Park Durban 11 589 – 51 4 383 44
3 Clayville Mini Units Johannesburg 8 200 – 33 3 988 47
4 Devro Park Durban 3 929 – 15 3 741 47
5 Eastgate Business Park Sandton 13 523 – 89 6 611 69
6 Ferndale Commercial Park Johannesburg 4 253 – 17 4 044 48
7 Ferntowers Johannesburg 5 004 – 23 4 636 55
8 Fusie 142 Pretoria 1 756 19.9% 8 4 499 46
9 Gallagher Place Johannesburg 8 605 – 32 3 707 45
10 Glen Murray Industrial Park Durban 8 344 9.2% 50 5 945 62
11 Greystones Industrial Durban 3 295 – 14 4 249 53
12 Isando Industrial Johannesburg 4 932 15.5% 14 2 839 42
13 Isando Industrial Park Johannesburg 11 936 21.5% 46 3 871 *
14 Knightsgate Germiston 16 675 4.9% 87 5 235 49
15 Kya North Park Johannesburg 13 044 1.8% 46 3 519 44
16 Palm River Durban 8 156 4.9% 38 4 610 56
17 Scientia Pretoria 11 946 9.5% 80 6 714 74
18 Thynk Industrial Park Durban 6 120 – 43 7 092 78
Midi Units 80 738 3.1% 388 4 812 48
1 Anchor Industrial Park Boksburg 15 119 – 69 4 577 51
2 City Deep Industrial Park Johannesburg 10 932 – 56 5 114 52
3 Eagle Industrial Park (50%) Richards Bay 7 699 5.9% 38 4 975 *
4 Galaxy Johannesburg 11 505 – 83 7 214 67
5 Northreef Johannesburg 2 178 – 10 4 683 34
6 Rojolea Johannesburg 4 882 – 12 2 458 26
7 Route 41 Johannesburg 12 556 16.2% 38 3 042 37
8 Westgate (50%) Durban 15 867 – 82 5 149 *
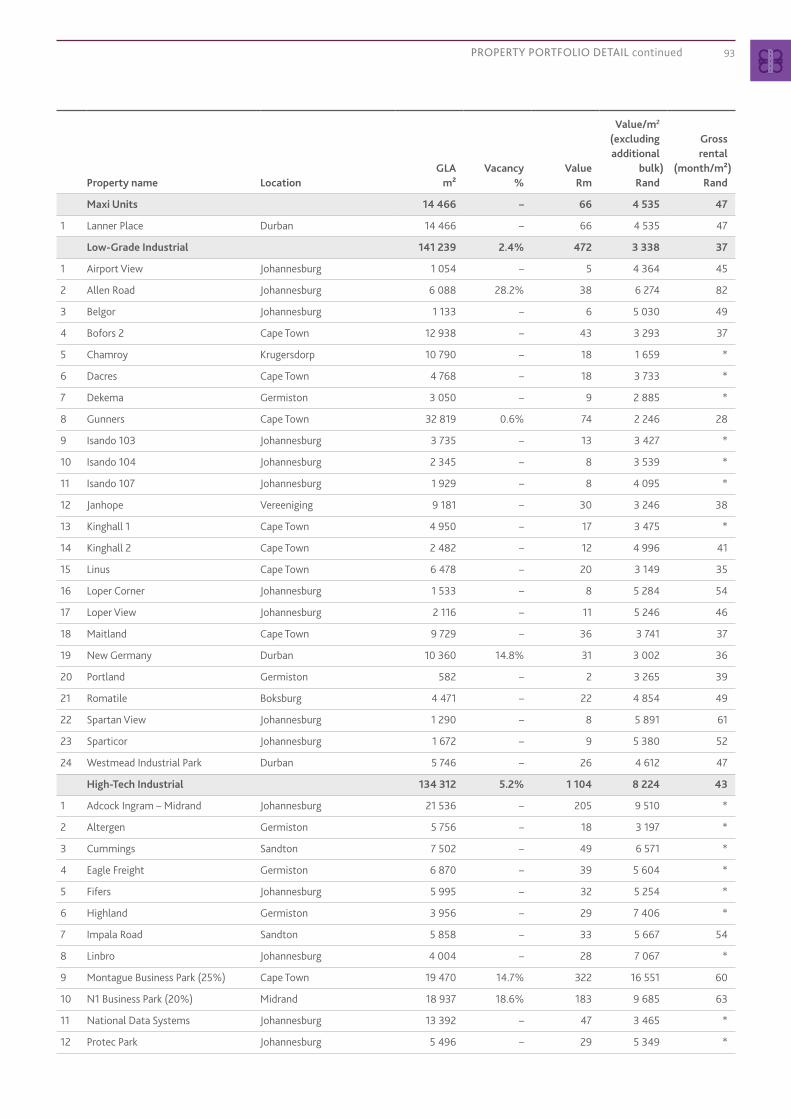
93PROPERTY PORTFOLIO DETAIL continued
Property name LocationGLA
m²Vacancy
%Value
Rm
Value/m2 (excluding additional
bulk)Rand
Gross rental
(month/m²)Rand
Maxi Units 14 466 – 66 4 535 47
1 Lanner Place Durban 14 466 – 66 4 535 47
Low-Grade Industrial 141 239 2.4% 472 3 338 37
1 Airport View Johannesburg 1 054 – 5 4 364 45
2 Allen Road Johannesburg 6 088 28.2% 38 6 274 82
3 Belgor Johannesburg 1 133 – 6 5 030 49
4 Bofors 2 Cape Town 12 938 – 43 3 293 37
5 Chamroy Krugersdorp 10 790 – 18 1 659 *
6 Dacres Cape Town 4 768 – 18 3 733 *
7 Dekema Germiston 3 050 – 9 2 885 *
8 Gunners Cape Town 32 819 0.6% 74 2 246 28
9 Isando 103 Johannesburg 3 735 – 13 3 427 *
10 Isando 104 Johannesburg 2 345 – 8 3 539 *
11 Isando 107 Johannesburg 1 929 – 8 4 095 *
12 Janhope Vereeniging 9 181 – 30 3 246 38
13 Kinghall 1 Cape Town 4 950 – 17 3 475 *
14 Kinghall 2 Cape Town 2 482 – 12 4 996 41
15 Linus Cape Town 6 478 – 20 3 149 35
16 Loper Corner Johannesburg 1 533 – 8 5 284 54
17 Loper View Johannesburg 2 116 – 11 5 246 46
18 Maitland Cape Town 9 729 – 36 3 741 37
19 New Germany Durban 10 360 14.8% 31 3 002 36
20 Portland Germiston 582 – 2 3 265 39
21 Romatile Boksburg 4 471 – 22 4 854 49
22 Spartan View Johannesburg 1 290 – 8 5 891 61
23 Sparticor Johannesburg 1 672 – 9 5 380 52
24 Westmead Industrial Park Durban 5 746 – 26 4 612 47
High-Tech Industrial 134 312 5.2% 1 104 8 224 43
1 Adcock Ingram – Midrand Johannesburg 21 536 – 205 9 510 *
2 Altergen Germiston 5 756 – 18 3 197 *
3 Cummings Sandton 7 502 – 49 6 571 *
4 Eagle Freight Germiston 6 870 – 39 5 604 *
5 Fifers Johannesburg 5 995 – 32 5 254 *
6 Highland Germiston 3 956 – 29 7 406 *
7 Impala Road Sandton 5 858 – 33 5 667 54
8 Linbro Johannesburg 4 004 – 28 7 067 *
9 Montague Business Park (25%) Cape Town 19 470 14.7% 322 16 551 60
10 N1 Business Park (20%) Midrand 18 937 18.6% 183 9 685 63
11 National Data Systems Johannesburg 13 392 – 47 3 465 *
12 Protec Park Johannesburg 5 496 – 29 5 349 *
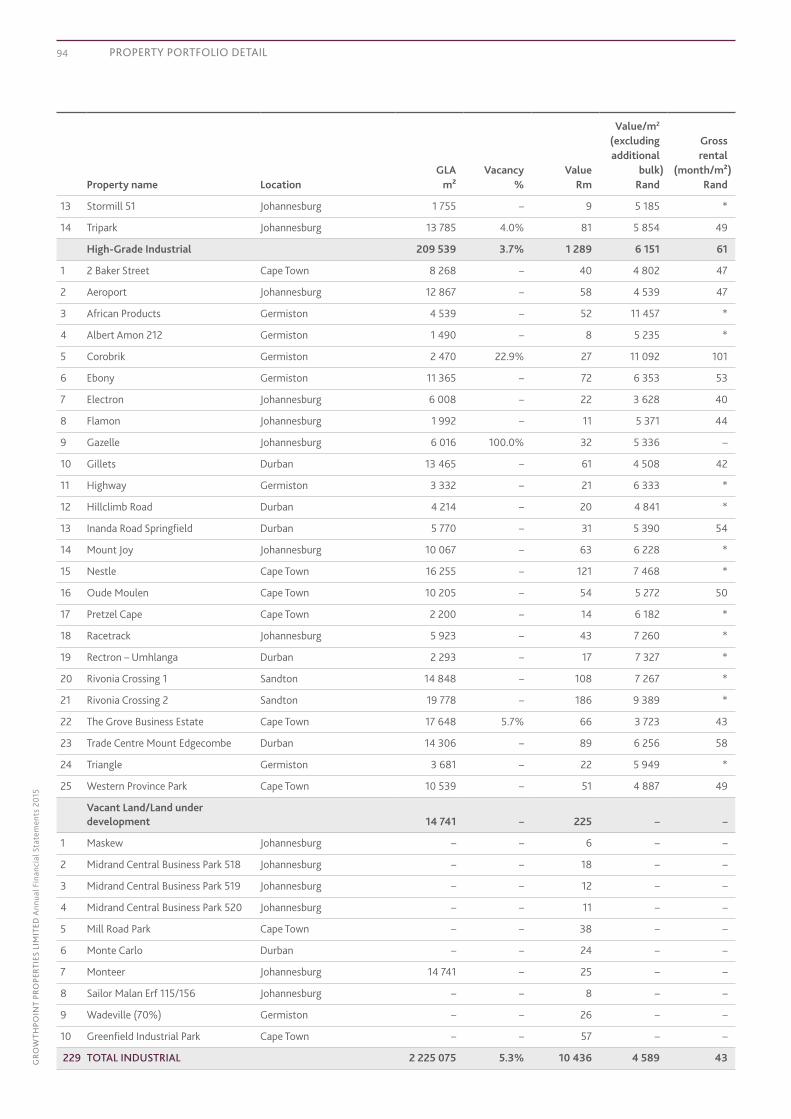
94
GRO
WTH
POIN
T PR
OPE
RTIE
S LI
MIT
ED A
nnua
l Fin
anci
al S
tate
men
ts 2
015
PROPERTY PORTFOLIO DETAIL
Property name LocationGLA
m²Vacancy
%Value
Rm
Value/m2 (excluding additional
bulk)Rand
Gross rental
(month/m²)Rand
13 Stormill 51 Johannesburg 1 755 – 9 5 185 *
14 Tripark Johannesburg 13 785 4.0% 81 5 854 49
High-Grade Industrial 209 539 3.7% 1 289 6 151 61
1 2 Baker Street Cape Town 8 268 – 40 4 802 47
2 Aeroport Johannesburg 12 867 – 58 4 539 47
3 African Products Germiston 4 539 – 52 11 457 *
4 Albert Amon 212 Germiston 1 490 – 8 5 235 *
5 Corobrik Germiston 2 470 22.9% 27 11 092 101
6 Ebony Germiston 11 365 – 72 6 353 53
7 Electron Johannesburg 6 008 – 22 3 628 40
8 Flamon Johannesburg 1 992 – 11 5 371 44
9 Gazelle Johannesburg 6 016 100.0% 32 5 336 –
10 Gillets Durban 13 465 – 61 4 508 42
11 Highway Germiston 3 332 – 21 6 333 *
12 Hillclimb Road Durban 4 214 – 20 4 841 *
13 Inanda Road Springfield Durban 5 770 – 31 5 390 54
14 Mount Joy Johannesburg 10 067 – 63 6 228 *
15 Nestle Cape Town 16 255 – 121 7 468 *
16 Oude Moulen Cape Town 10 205 – 54 5 272 50
17 Pretzel Cape Cape Town 2 200 – 14 6 182 *
18 Racetrack Johannesburg 5 923 – 43 7 260 *
19 Rectron – Umhlanga Durban 2 293 – 17 7 327 *
20 Rivonia Crossing 1 Sandton 14 848 – 108 7 267 *
21 Rivonia Crossing 2 Sandton 19 778 – 186 9 389 *
22 The Grove Business Estate Cape Town 17 648 5.7% 66 3 723 43
23 Trade Centre Mount Edgecombe Durban 14 306 – 89 6 256 58
24 Triangle Germiston 3 681 – 22 5 949 *
25 Western Province Park Cape Town 10 539 – 51 4 887 49
Vacant Land/Land under development 14 741 – 225 – –
1 Maskew Johannesburg – – 6 – –
2 Midrand Central Business Park 518 Johannesburg – – 18 – –
3 Midrand Central Business Park 519 Johannesburg – – 12 – –
4 Midrand Central Business Park 520 Johannesburg – – 11 – –
5 Mill Road Park Cape Town – – 38 – –
6 Monte Carlo Durban – – 24 – –
7 Monteer Johannesburg 14 741 – 25 – –
8 Sailor Malan Erf 115/156 Johannesburg – – 8 – –
9 Wadeville (70%) Germiston – – 26 – –
10 Greenfield Industrial Park Cape Town – – 57 – –
229 TOTAL INDUSTRIAL 2 225 075 5.3% 10 436 4 589 43
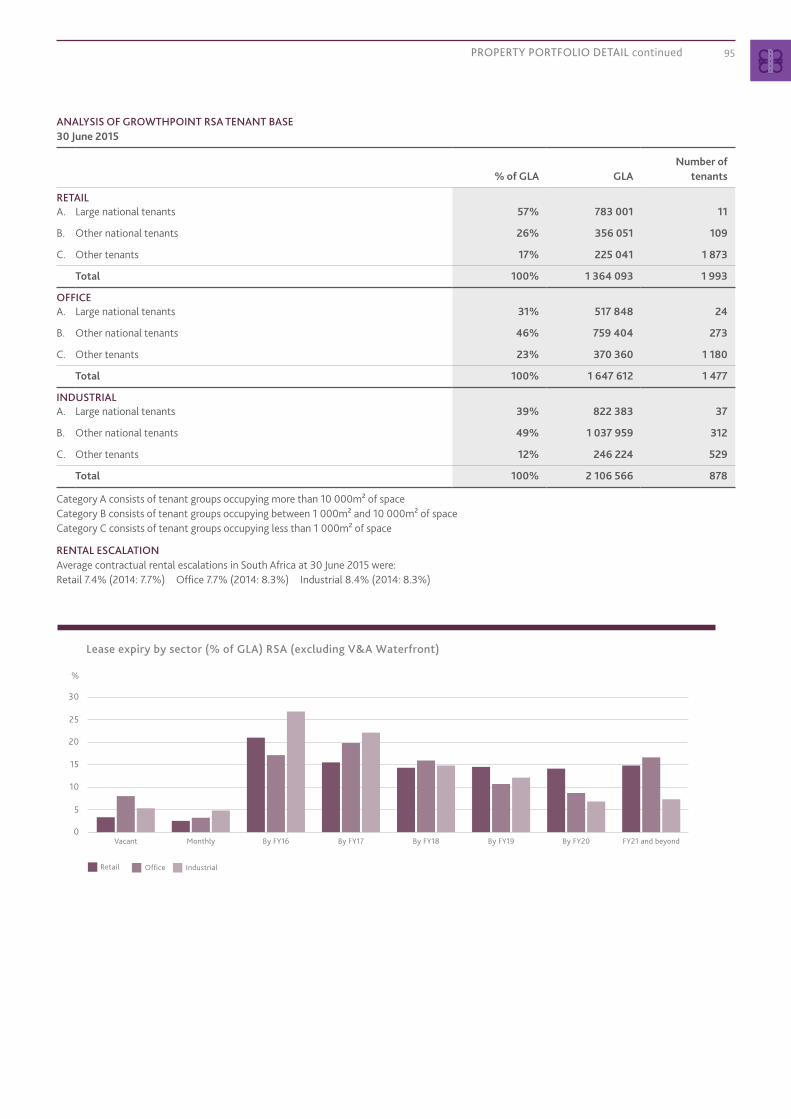
95PROPERTY PORTFOLIO DETAIL continued
ANALYSIS OF GROWTHPOINT RSA TENANT BASE30 June 2015
% of GLA GLANumber of
tenants
RETAILA. Large national tenants 57% 783 001 11
B. Other national tenants 26% 356 051 109
C. Other tenants 17% 225 041 1 873
Total 100% 1 364 093 1 993
OFFICEA. Large national tenants 31% 517 848 24
B. Other national tenants 46% 759 404 273
C. Other tenants 23% 370 360 1 180
Total 100% 1 647 612 1 477
INDUSTRIALA. Large national tenants 39% 822 383 37
B. Other national tenants 49% 1 037 959 312
C. Other tenants 12% 246 224 529
Total 100% 2 106 566 878
Category A consists of tenant groups occupying more than 10 000m² of spaceCategory B consists of tenant groups occupying between 1 000m² and 10 000m² of spaceCategory C consists of tenant groups occupying less than 1 000m² of space
RENTAL ESCALATIONAverage contractual rental escalations in South Africa at 30 June 2015 were:Retail 7.4% (2014: 7.7%) Office 7.7% (2014: 8.3%) Industrial 8.4% (2014: 8.3%)
Lease expiry by sector (% of GLA) RSA (excluding V&A Waterfront)
0
5
10
15
20
25
30
FY21 and beyondBy FY20By FY19By FY18By FY17By FY16MonthlyVacant
Retail Office Industrial
FY15
2 473
%
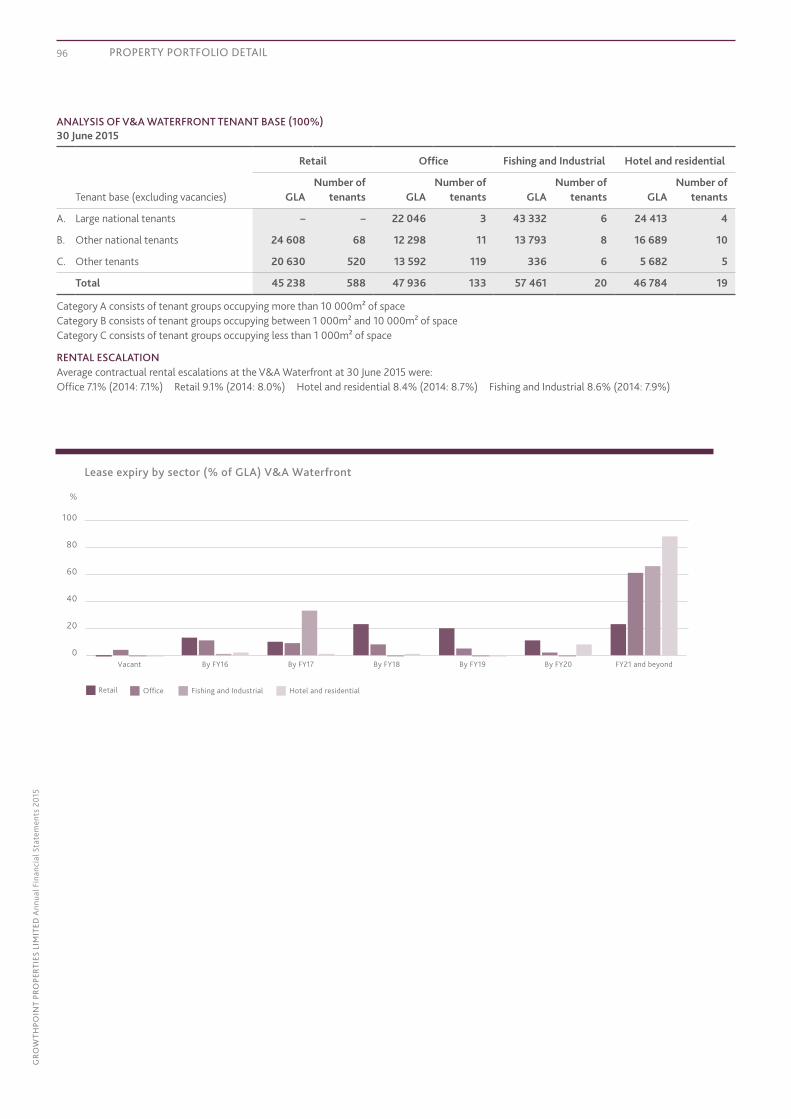
96
GRO
WTH
POIN
T PR
OPE
RTIE
S LI
MIT
ED A
nnua
l Fin
anci
al S
tate
men
ts 2
015
PROPERTY PORTFOLIO DETAIL
ANALYSIS OF V&A WATERFRONT TENANT BASE (100%)30 June 2015
Retail Office Fishing and Industrial Hotel and residential
Tenant base (excluding vacancies) GLANumber of
tenants GLANumber of
tenants GLANumber of
tenants GLANumber of
tenants
A. Large national tenants – – 22 046 3 43 332 6 24 413 4
B. Other national tenants 24 608 68 12 298 11 13 793 8 16 689 10
C. Other tenants 20 630 520 13 592 119 336 6 5 682 5
Total 45 238 588 47 936 133 57 461 20 46 784 19
Category A consists of tenant groups occupying more than 10 000m² of spaceCategory B consists of tenant groups occupying between 1 000m² and 10 000m² of spaceCategory C consists of tenant groups occupying less than 1 000m² of space
RENTAL ESCALATIONAverage contractual rental escalations at the V&A Waterfront at 30 June 2015 were:Office 7.1% (2014: 7.1%) Retail 9.1% (2014: 8.0%) Hotel and residential 8.4% (2014: 8.7%) Fishing and Industrial 8.6% (2014: 7.9%)
Lease expiry by sector (% of GLA) V&A Waterfront
0
20
40
60
80
100
FY21 and beyondBy FY20By FY19By FY18By FY17By FY16Vacant
Retail Office Fishing and Industrial Hotel and residential
FY15
2 473
%
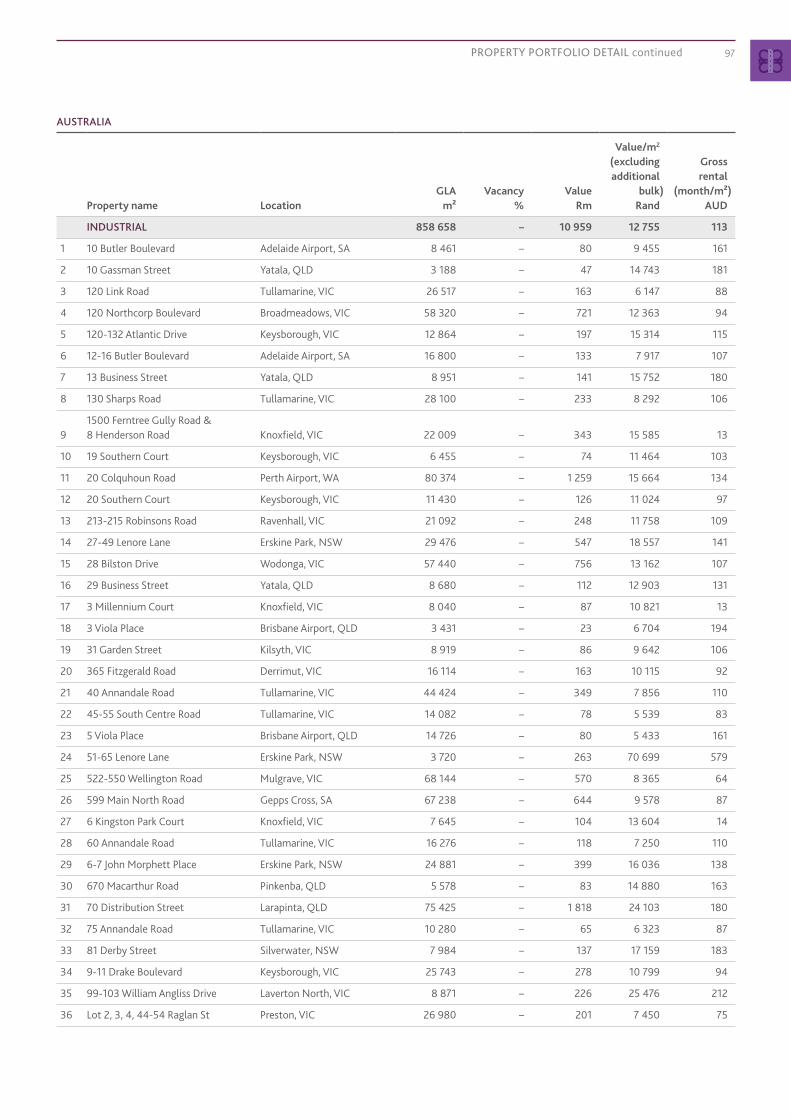
97PROPERTY PORTFOLIO DETAIL continued
AUSTRALIA
Property name LocationGLA
m²Vacancy
%Value
Rm
Value/m2 (excluding additional
bulk)Rand
Gross rental
(month/m²)AUD
INDUSTRIAL 858 658 – 10 959 12 755 113
1 10 Butler Boulevard Adelaide Airport, SA 8 461 – 80 9 455 161
2 10 Gassman Street Yatala, QLD 3 188 – 47 14 743 181
3 120 Link Road Tullamarine, VIC 26 517 – 163 6 147 88
4 120 Northcorp Boulevard Broadmeadows, VIC 58 320 – 721 12 363 94
5 120-132 Atlantic Drive Keysborough, VIC 12 864 – 197 15 314 115
6 12-16 Butler Boulevard Adelaide Airport, SA 16 800 – 133 7 917 107
7 13 Business Street Yatala, QLD 8 951 – 141 15 752 180
8 130 Sharps Road Tullamarine, VIC 28 100 – 233 8 292 106
91500 Ferntree Gully Road & 8 Henderson Road Knoxfield, VIC 22 009 – 343 15 585 13
10 19 Southern Court Keysborough, VIC 6 455 – 74 11 464 103
11 20 Colquhoun Road Perth Airport, WA 80 374 – 1 259 15 664 134
12 20 Southern Court Keysborough, VIC 11 430 – 126 11 024 97
13 213-215 Robinsons Road Ravenhall, VIC 21 092 – 248 11 758 109
14 27-49 Lenore Lane Erskine Park, NSW 29 476 – 547 18 557 141
15 28 Bilston Drive Wodonga, VIC 57 440 – 756 13 162 107
16 29 Business Street Yatala, QLD 8 680 – 112 12 903 131
17 3 Millennium Court Knoxfield, VIC 8 040 – 87 10 821 13
18 3 Viola Place Brisbane Airport, QLD 3 431 – 23 6 704 194
19 31 Garden Street Kilsyth, VIC 8 919 – 86 9 642 106
20 365 Fitzgerald Road Derrimut, VIC 16 114 – 163 10 115 92
21 40 Annandale Road Tullamarine, VIC 44 424 – 349 7 856 110
22 45-55 South Centre Road Tullamarine, VIC 14 082 – 78 5 539 83
23 5 Viola Place Brisbane Airport, QLD 14 726 – 80 5 433 161
24 51-65 Lenore Lane Erskine Park, NSW 3 720 – 263 70 699 579
25 522-550 Wellington Road Mulgrave, VIC 68 144 – 570 8 365 64
26 599 Main North Road Gepps Cross, SA 67 238 – 644 9 578 87
27 6 Kingston Park Court Knoxfield, VIC 7 645 – 104 13 604 14
28 60 Annandale Road Tullamarine, VIC 16 276 – 118 7 250 110
29 6-7 John Morphett Place Erskine Park, NSW 24 881 – 399 16 036 138
30 670 Macarthur Road Pinkenba, QLD 5 578 – 83 14 880 163
31 70 Distribution Street Larapinta, QLD 75 425 – 1 818 24 103 180
32 75 Annandale Road Tullamarine, VIC 10 280 – 65 6 323 87
33 81 Derby Street Silverwater, NSW 7 984 – 137 17 159 183
34 9-11 Drake Boulevard Keysborough, VIC 25 743 – 278 10 799 94
35 99-103 William Angliss Drive Laverton North, VIC 8 871 – 226 25 476 212
36 Lot 2, 3, 4, 44-54 Raglan St Preston, VIC 26 980 – 201 7 450 75
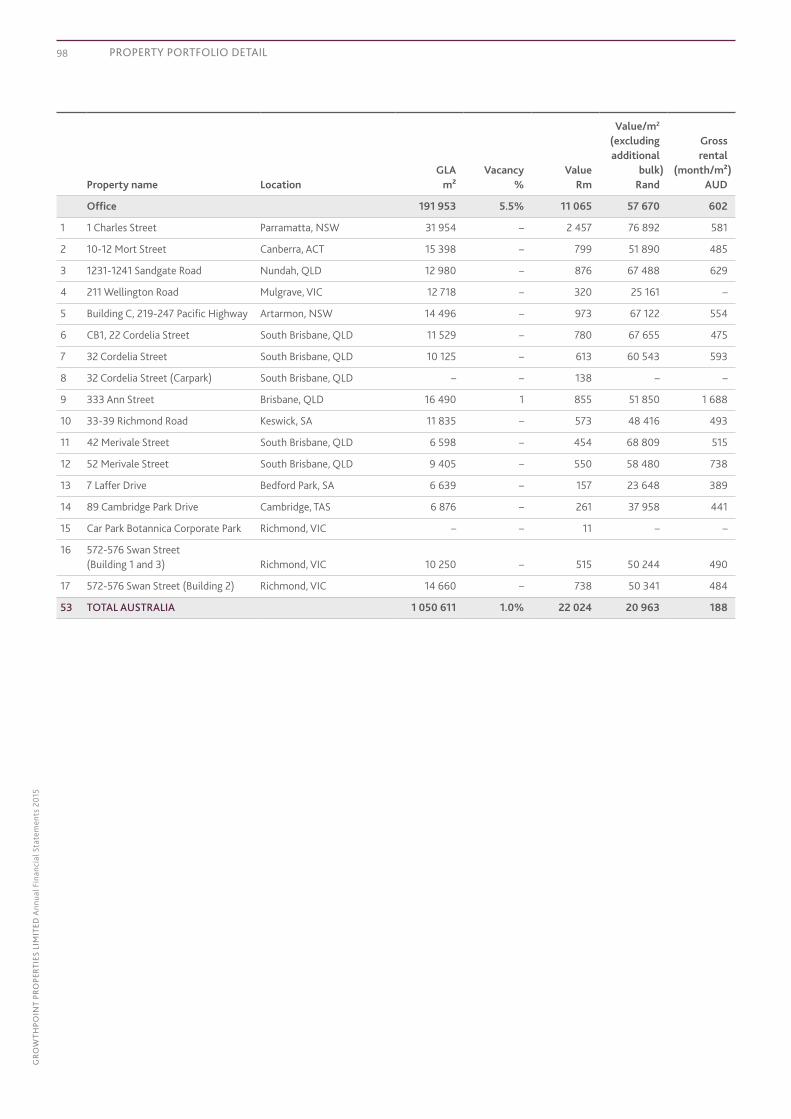
98
GRO
WTH
POIN
T PR
OPE
RTIE
S LI
MIT
ED A
nnua
l Fin
anci
al S
tate
men
ts 2
015
PROPERTY PORTFOLIO DETAIL
Property name LocationGLA
m²Vacancy
%Value
Rm
Value/m2
(excluding additional
bulk)Rand
Gross rental
(month/m²)AUD
Office 191 953 5.5% 11 065 57 670 602
1 1 Charles Street Parramatta, NSW 31 954 – 2 457 76 892 581
2 10-12 Mort Street Canberra, ACT 15 398 – 799 51 890 485
3 1231-1241 Sandgate Road Nundah, QLD 12 980 – 876 67 488 629
4 211 Wellington Road Mulgrave, VIC 12 718 – 320 25 161 –
5 Building C, 219-247 Pacific Highway Artarmon, NSW 14 496 – 973 67 122 554
6 CB1, 22 Cordelia Street South Brisbane, QLD 11 529 – 780 67 655 475
7 32 Cordelia Street South Brisbane, QLD 10 125 – 613 60 543 593
8 32 Cordelia Street (Carpark) South Brisbane, QLD – – 138 – –
9 333 Ann Street Brisbane, QLD 16 490 1 855 51 850 1 688
10 33-39 Richmond Road Keswick, SA 11 835 – 573 48 416 493
11 42 Merivale Street South Brisbane, QLD 6 598 – 454 68 809 515
12 52 Merivale Street South Brisbane, QLD 9 405 – 550 58 480 738
13 7 Laffer Drive Bedford Park, SA 6 639 – 157 23 648 389
14 89 Cambridge Park Drive Cambridge, TAS 6 876 – 261 37 958 441
15 Car Park Botannica Corporate Park Richmond, VIC – – 11 – –
16 572-576 Swan Street (Building 1 and 3) Richmond, VIC 10 250 – 515 50 244 490
17 572-576 Swan Street (Building 2) Richmond, VIC 14 660 – 738 50 341 484
53 TOTAL AUSTRALIA 1 050 611 1.0% 22 024 20 963 188
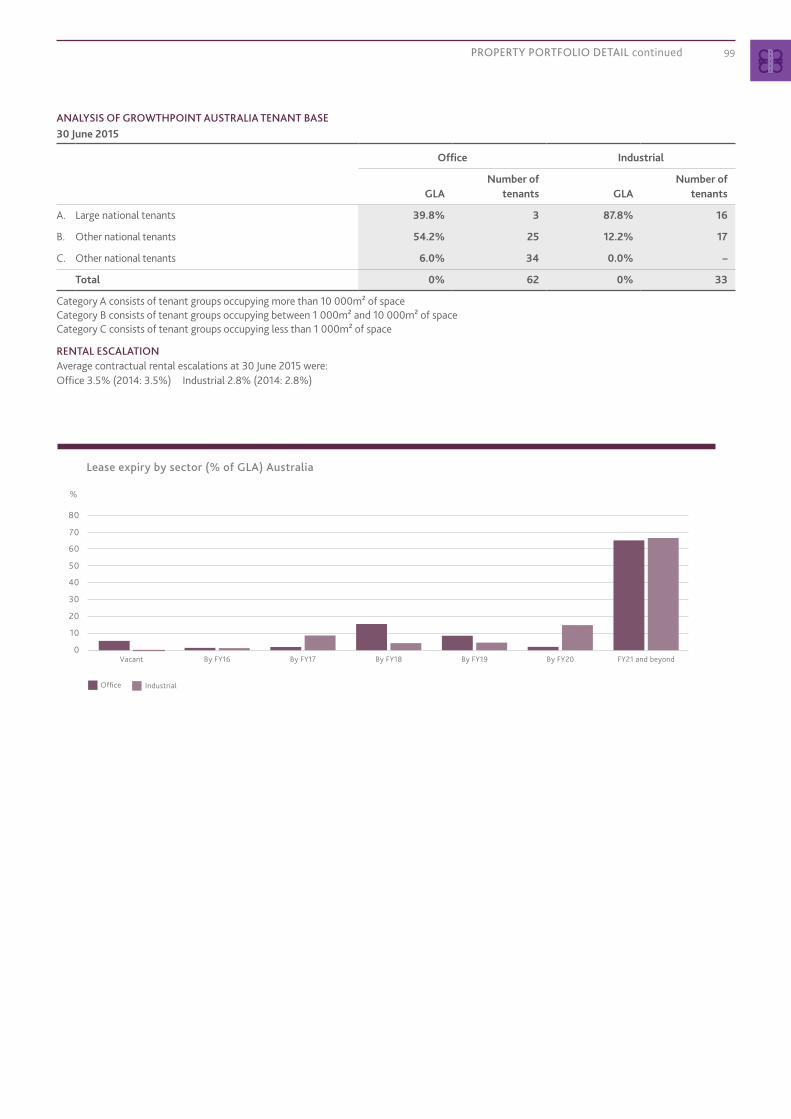
99PROPERTY PORTFOLIO DETAIL continued
ANALYSIS OF GROWTHPOINT AUSTRALIA TENANT BASE30 June 2015
Office Industrial
GLANumber of
tenants GLANumber of
tenants
A. Large national tenants 39.8% 3 87.8% 16
B. Other national tenants 54.2% 25 12.2% 17
C. Other national tenants 6.0% 34 0.0% –
Total 0% 62 0% 33
Category A consists of tenant groups occupying more than 10 000m² of spaceCategory B consists of tenant groups occupying between 1 000m² and 10 000m² of spaceCategory C consists of tenant groups occupying less than 1 000m² of space
RENTAL ESCALATIONAverage contractual rental escalations at 30 June 2015 were:Office 3.5% (2014: 3.5%) Industrial 2.8% (2014: 2.8%)
Lease expiry by sector (% of GLA) Australia
0
10
20
30
40
50
60
70
80
FY21 and beyondBy FY20By FY19By FY18By FY17By FY16Vacant
Office Industrial
FY15
2 473
%

ebony, germiston
penraz, johannesburg
GENERAL INFORMATION
ShAREhOLDERS’ ANALYSIS 102
ShAREhOLDERS’ INfORMATION 106
DIRECTORATE AND ADMINISTRATION 107
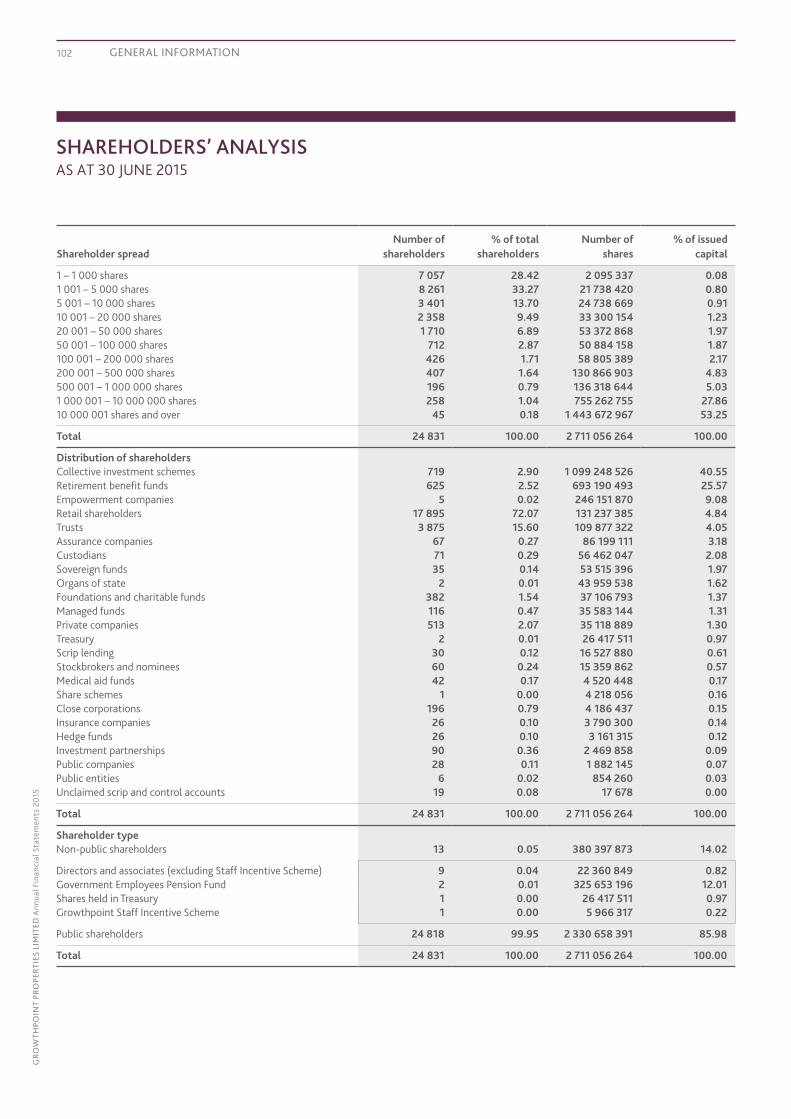
102
GRO
WTH
POIN
T PR
OPE
RTIE
S LI
MIT
ED A
nnua
l Fin
anci
al S
tate
men
ts 2
015
GENERAL INFORMATION
SHAREHOLDERS’ ANALYSISAS AT 30 JUNE 2015
Shareholder spreadNumber of
shareholders% of total
shareholdersNumber of
shares% of issued
capital
1 – 1 000 shares 7 057 28.42 2 095 337 0.081 001 – 5 000 shares 8 261 33.27 21 738 420 0.805 001 – 10 000 shares 3 401 13.70 24 738 669 0.9110 001 – 20 000 shares 2 358 9.49 33 300 154 1.2320 001 – 50 000 shares 1 710 6.89 53 372 868 1.9750 001 – 100 000 shares 712 2.87 50 884 158 1.87100 001 – 200 000 shares 426 1.71 58 805 389 2.17200 001 – 500 000 shares 407 1.64 130 866 903 4.83500 001 – 1 000 000 shares 196 0.79 136 318 644 5.031 000 001 – 10 000 000 shares 258 1.04 755 262 755 27.8610 000 001 shares and over 45 0.18 1 443 672 967 53.25
Total 24 831 100.00 2 711 056 264 100.00
Distribution of shareholdersCollective investment schemes 719 2.90 1 099 248 526 40.55 Retirement benefit funds 625 2.52 693 190 493 25.57 Empowerment companies 5 0.02 246 151 870 9.08 Retail shareholders 17 895 72.07 131 237 385 4.84 Trusts 3 875 15.60 109 877 322 4.05 Assurance companies 67 0.27 86 199 111 3.18 Custodians 71 0.29 56 462 047 2.08 Sovereign funds 35 0.14 53 515 396 1.97 Organs of state 2 0.01 43 959 538 1.62 Foundations and charitable funds 382 1.54 37 106 793 1.37 Managed funds 116 0.47 35 583 144 1.31 Private companies 513 2.07 35 118 889 1.30 Treasury 2 0.01 26 417 511 0.97 Scrip lending 30 0.12 16 527 880 0.61 Stockbrokers and nominees 60 0.24 15 359 862 0.57 Medical aid funds 42 0.17 4 520 448 0.17 Share schemes 1 0.00 4 218 056 0.16 Close corporations 196 0.79 4 186 437 0.15 Insurance companies 26 0.10 3 790 300 0.14 Hedge funds 26 0.10 3 161 315 0.12 Investment partnerships 90 0.36 2 469 858 0.09 Public companies 28 0.11 1 882 145 0.07 Public entities 6 0.02 854 260 0.03 Unclaimed scrip and control accounts 19 0.08 17 678 0.00
Total 24 831 100.00 2 711 056 264 100.00
Shareholder typeNon-public shareholders 13 0.05 380 397 873 14.02
Directors and associates (excluding Staff Incentive Scheme) 9 0.04 22 360 849 0.82Government Employees Pension Fund 2 0.01 325 653 196 12.01Shares held in Treasury 1 0.00 26 417 511 0.97Growthpoint Staff Incentive Scheme 1 0.00 5 966 317 0.22
Public shareholders 24 818 99.95 2 330 658 391 85.98
Total 24 831 100.00 2 711 056 264 100.00
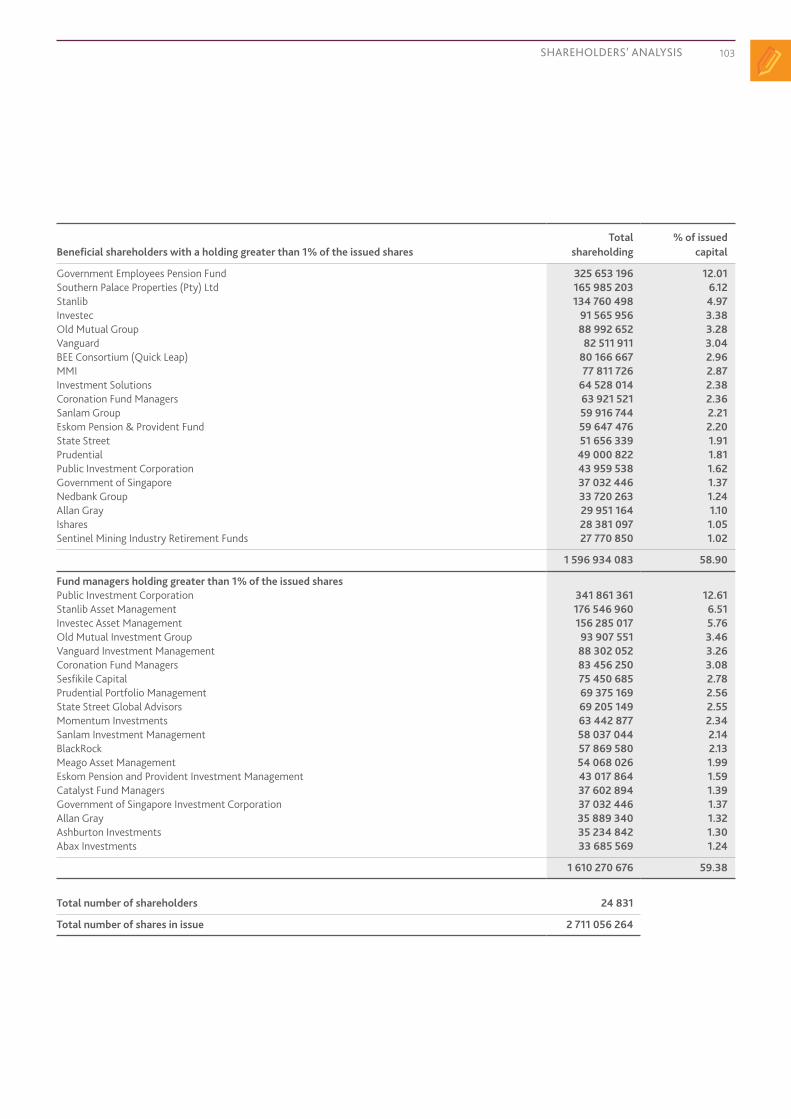
103SHAREHOLDERS’ ANALYSIS
Beneficial shareholders with a holding greater than 1% of the issued sharesTotal
shareholding% of issued
capital
Government Employees Pension Fund 325 653 196 12.01 Southern Palace Properties (Pty) Ltd 165 985 203 6.12 Stanlib 134 760 498 4.97 Investec 91 565 956 3.38 Old Mutual Group 88 992 652 3.28 Vanguard 82 511 911 3.04 BEE Consortium (Quick Leap) 80 166 667 2.96 MMI 77 811 726 2.87 Investment Solutions 64 528 014 2.38 Coronation Fund Managers 63 921 521 2.36 Sanlam Group 59 916 744 2.21 Eskom Pension & Provident Fund 59 647 476 2.20 State Street 51 656 339 1.91 Prudential 49 000 822 1.81 Public Investment Corporation 43 959 538 1.62 Government of Singapore 37 032 446 1.37 Nedbank Group 33 720 263 1.24 Allan Gray 29 951 164 1.10 Ishares 28 381 097 1.05 Sentinel Mining Industry Retirement Funds 27 770 850 1.02
1 596 934 083 58.90
Fund managers holding greater than 1% of the issued sharesPublic Investment Corporation 341 861 361 12.61 Stanlib Asset Management 176 546 960 6.51 Investec Asset Management 156 285 017 5.76 Old Mutual Investment Group 93 907 551 3.46 Vanguard Investment Management 88 302 052 3.26 Coronation Fund Managers 83 456 250 3.08 Sesfikile Capital 75 450 685 2.78 Prudential Portfolio Management 69 375 169 2.56 State Street Global Advisors 69 205 149 2.55 Momentum Investments 63 442 877 2.34 Sanlam Investment Management 58 037 044 2.14 BlackRock 57 869 580 2.13 Meago Asset Management 54 068 026 1.99 Eskom Pension and Provident Investment Management 43 017 864 1.59 Catalyst Fund Managers 37 602 894 1.39 Government of Singapore Investment Corporation 37 032 446 1.37 Allan Gray 35 889 340 1.32 Ashburton Investments 35 234 842 1.30 Abax Investments 33 685 569 1.24
1 610 270 676 59.38
Total number of shareholders 24 831
Total number of shares in issue 2 711 056 264
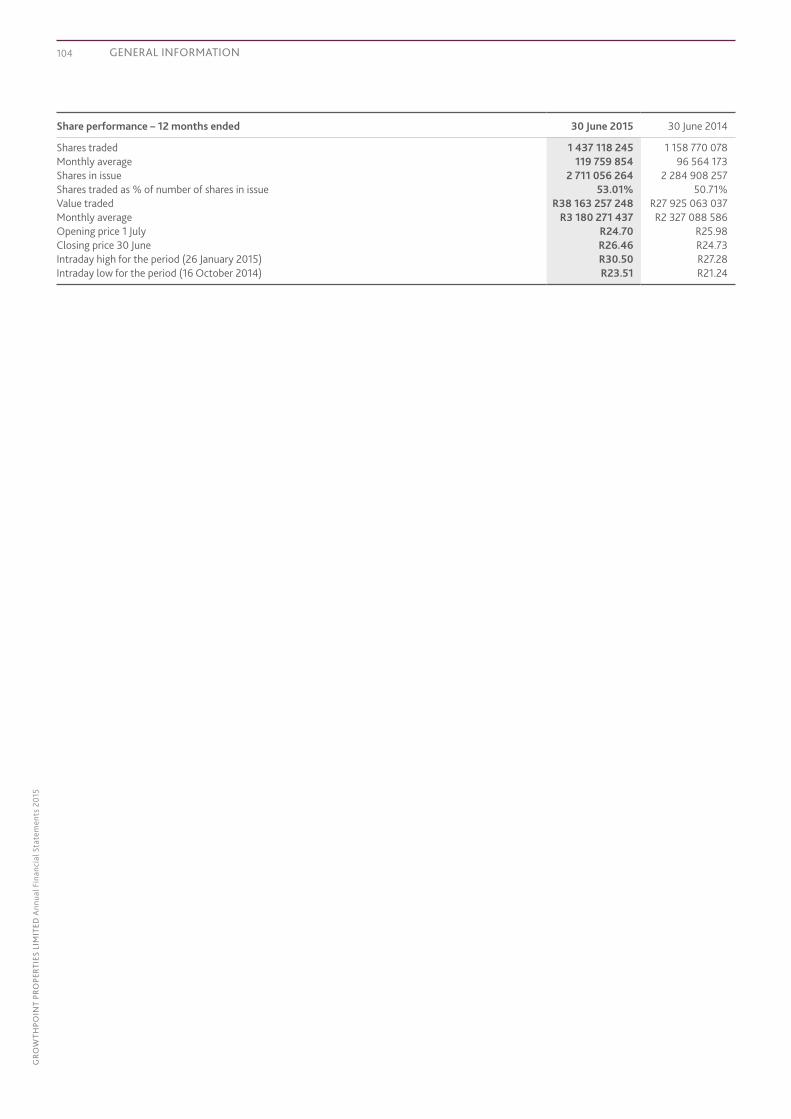
104
GRO
WTH
POIN
T PR
OPE
RTIE
S LI
MIT
ED A
nnua
l Fin
anci
al S
tate
men
ts 2
015
GENERAL INFORMATION
Share performance – 12 months ended 30 June 2015 30 June 2014
Shares traded 1 437 118 245 1 158 770 078 Monthly average 119 759 854 96 564 173 Shares in issue 2 711 056 264 2 284 908 257 Shares traded as % of number of shares in issue 53.01% 50.71%Value traded R38 163 257 248 R27 925 063 037Monthly average R3 180 271 437 R2 327 088 586Opening price 1 July R24.70 R25.98Closing price 30 June R26.46 R24.73Intraday high for the period (26 January 2015) R30.50 R27.28Intraday low for the period (16 October 2014) R23.51 R21.24
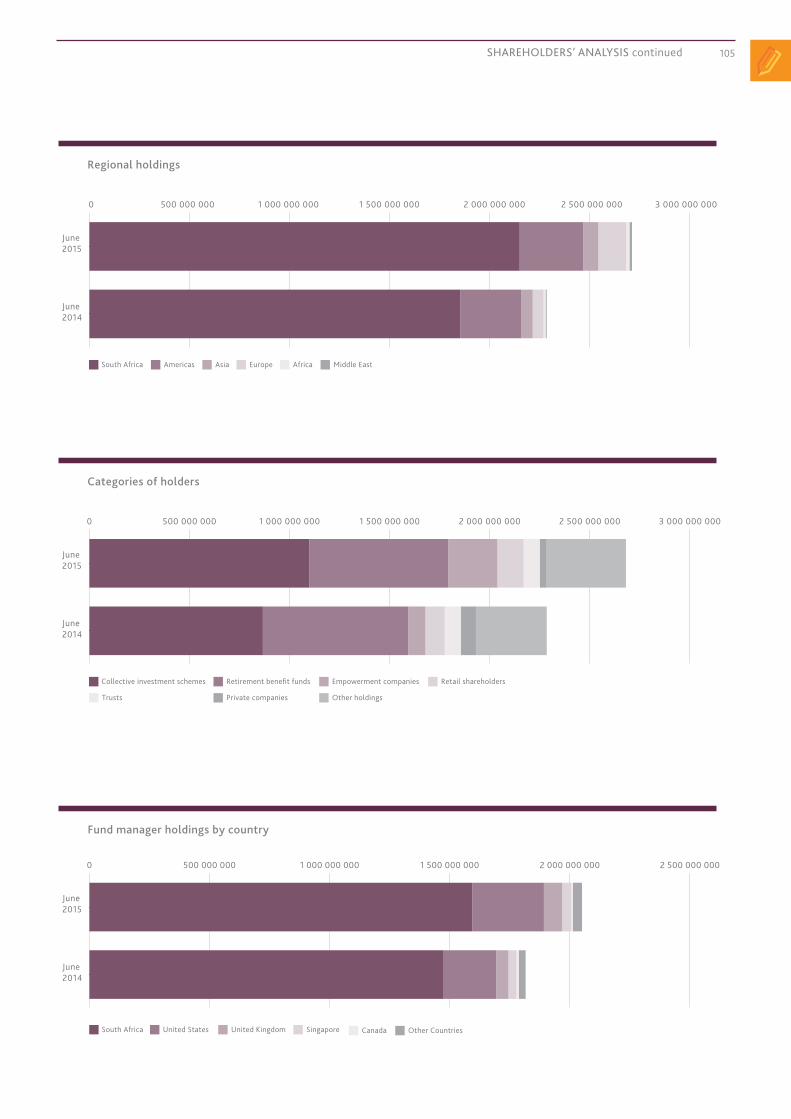
105SHAREHOLDERS’ ANALYSIS continued
Regional holdings
0 500 000 000 1 000 000 000 1 500 000 000 2 000 000 000 2 500 000 000 3 000 000 000
June 2015
June 2014
South Africa Americas Asia Europe Africa Middle East
Categories of holders
0 500 000 000 1 000 000 000 1 500 000 000 2 000 000 000 2 500 000 000 3 000 000 000
June 2015
June 2014
Collective investment schemes Retirement benefit funds Empowerment companies Retail shareholders
Trusts Private companies Other holdings
Fund manager holdings by country
0 500 000 000 1 000 000 000 1 500 000 000 2 000 000 000 2 500 000 000
June 2015
June 2014
South Africa United States United Kingdom Singapore Canada Other Countries
106
GRO
WTH
POIN
T PR
OPE
RTIE
S LI
MIT
ED A
nnua
l Fin
anci
al S
tate
men
ts 2
015
GENERAL INFORMATION
SHAREHOLDERS’ INFORMATION
SHAREHOLDERS’ DIARYFinancial year end 30 JuneAnnual financial statements posted SeptemberAnnual general meeting (09:00) 17 November 2015
Announcement of results and analysts’ presentationsInterim MarchAnnual August
Dividends Declared PaidInterim February MarchFinal August September
Updates and further information posted from time to time can be found on the company’s public website at: http://www.growthpoint.co.za/Pages/ShareholderInformation.aspx
NOTICE OF ANNUAL GENERAL MEETINGThe notice of the company’s annual general meeting to be held on 17 November 2015 is contained in a separate booklet, posted to shareholders, incorporating the company’s summarised audited AFS for FY15 and other information relevant to the annual general meeting. The notice will be also be available on the company’s public web site at: http://www.growthpoint.co.za/Pages/AnnualResults.aspx
107SHAREHOLDERS’ INFORMATION/DIRECTORATE AND ADMINISTRATION
DIRECTORATE AND ADMINISTRATION
Directors Management companyJF Marais (Chairman)0 Growthpoint Management Services (Pty) LtdHSP Mashaba (Deputy Chairman)0 (Registration No 2004/015933/07)EK de Klerk (Managing Director)* The Place, 1 Sandton Drive, Sandown, Sandton, 2196MG Diliza• PO Box 78949, Sandton, 2146PH Fechter0
LA Finlay0 Chairmen’s CommitteeJC Hayward0 JF Marais (Chairman)HS Herman0 MG DilizaSP Mngconkola@ PH FechterR Moonsamy0 LA FinlayNBP Nkabinde0 JC HaywardLN Sasse (Chief Executive Officer)* HS HermanFJ VisserG Völkel (Financial Director)*
Audit Committee0 independent LA Finlay (Chairman)• BEE structure stakeholder PH Fechter@ Related party and major shareholder’s nominee JC Hayward* Executive directors
The Audit Committee members are all independent non-executive directors.AuditorsKPMG Inc Risk Management Committee(Registration No 19999/021543/21) JC Hayward (Chairman)KPMG Crescent SP Mngconkola85 Empire Road, Parktown, 2193 NBP NkabindePrivate Bag 9, Parkview, 2122 FJ Visser
Transfer secretaries The following parties attend or are represented at Audit Computershare Investor Services (Pty) Ltd Committee and/or Risk Management Committee meetings:(Registration No 2004/003647/07)70 Marshall Street, Johannesburg, 2001 D Bouma (Corporate Treasurer)PO Box 61051, Marshalltown, 2107 AL Davis (Chief Information Officer)
EK de Klerk (Managing Director)Sponsor RA Krabbenhöft (Company Secretary)Investec Bank Limited DJ Modise (Head of Human Resources)(Registration No: 1969/004763/06) SA Nizetich (Head of Internal Audit and Risk Management)100 Grayston Drive, Sandown, Sandton, 2196 LN Sasse (Chief Executive Officer)PO Box 785700, Sandton, 2146 FJ Schindehütte (Financial Manager)
G Völkel (Financial Director) Registered officeGrowthpoint Properties Limited By invitation:(Registration No 1987/004988/06) E Binedell (Fund Director – Industrial)The Place, 1 Sandton Drive, Sandown, Sandton, 2196 SA le Roux (Fund Director – Retail)PO Box 78949, Sandton, 2146 RG Pienaar (Fund Director – Office)
Company Secretary The external auditors, KPMG Inc, attend all regular meetingsRA Krabbenhöft of the Audit Committee and ad hoc meetings as required,The Place, 1 Sandton Drive, Sandown, Sandton, 2196 as well as Risk Management Committee meetings.PO Box 78949, Sandton, 2146
108
GRO
WTH
POIN
T PR
OPE
RTIE
S LI
MIT
ED A
nnua
l Fin
anci
al S
tate
men
ts 2
015
GENERAL INFORMATION
Property Committee Nomination CommitteePH Fechter (Chairman) JF Marais (Chairman)MG Diliza MG DilizaHS Herman PH FechterR Moonsamy LA Finlay
JC HaywardThe following members of management attend Property HS HermanCommittee meetings:LN Sasse (Chief Executive Officer) Remuneration CommitteeE Binedell (Fund Director – Industrial) HS Herman (Chairman)K Bourhill (Valuer) JF MaraisEK de Klerk (Managing Director) HSP MashabaRA Krabbenhöft (Company Secretary) FJ VisserSA le Roux (Fund Director – Retail)S Mills (Management Accountant) Standing attendees:S Paul (Assistant Company Secretary) LN Sasse (Chief Executive Officer)RG Pienaar (Fund Director – Office) EK de Klerk (Managing Director)G Völkel (Financial Director) RA Krabbenhöft (Company Secretary)
DJ Modise (Head of Human Resources)Social, Ethics and Transformation Committee PricewaterhouseCoopers Inc. (Independent Advisor to the Committee)MG Diliza (Chairman)LA Finlay Executive Committee of Management (Exco)SP Mngconkola LN Sasse (Chief Executive Officer) (Committee Chairman)R Moonsamy EK de Klerk (Managing Director)NBP Nkabinde E Binedell (Fund Director – Industrial)
D Bouma (Corporate Treasurer) The following members of management attend Transformation AL Davis (Chief Information Officer)Committee meetings: G de Klerk (Regional Head – Durban)EK de Klerk (Managing Director) N Kuzmanich (Head of Marketing)P Engelbrecht (Development Head) SA le Roux (Fund Director – Retail)RA Krabbenhöft (Company Secretary) DJ Modise (Head of Human Resources)DJ Modise (Head of Human Resources) G Muchanya (Deal Manager)S Paul (Assistant Company Secretary) RG Pienaar (Fund Director – Office)F Sibanyoni (National Facilities Head) DS Stoll (Regional Head – Cape Town)SD Theunissen (CSR Manager) SD Theunissen (CSR Manager)G Völkel (Financial Director) L Turner (Head of Investor Relations)
G Völkel (Financial Director)
Standing attendees:RA Krabbenhöft (Company Secretary)S Paul (Assistant Company Secretary)