Embed Size (px)
Citation preview

Investor Presentation
on the
City of Los Angeles2013 Tax and Revenue
Anticipation Notes
presented by
City Administrative Officer
June 2013

1
Disclaimer
This electronic Investor Presentation you are about to view is provided as of June 14, 2013 for a proposed offering by the City of Los Angeles, California(the “City”) of its 2013 Tax and Revenue Anticipation Notes (the “Notes”). If you are viewing this presentation after June 14, 2013, there may havebeen events that occurred subsequent to such date that would have a material adverse effect on the financial information that is presented herein, andneither the City nor De La Rosa & Co. have undertaken any obligation to update this electronic presentation. All market prices, financial data and otherinformation provided herein are not warranted as to completeness or accuracy and are subject to change without notice.
This Investor Presentation is provided for your information and convenience only. Any investment decisions regarding the Notes should only be madeafter a careful review of the complete Preliminary Official Statement. By accessing this presentation, you agree not to duplicate, copy, download,screen capture, electronically store or record this Investor Presentation, nor to produce, publish or distribute this Investor Presentation in any formwhatsoever.
This Investor Presentation does not constitute a recommendation or an offer or solicitation for the purchase or sale of any security or other financialinstrument, including the Notes, or to adopt any investment strategy. Any offer or solicitation with respect to the Notes will be made solely by meansof the Final Official Statement, which describes the actual terms of such Notes. In no event shall De La Rosa & Co. or the City be liable for any use byany party of, for any decision made or action taken by any party in reliance upon, or for any inaccuracies or errors in, or omissions from, theinformation contained herein and such information may not be relied upon by you in evaluating the merits of participating in any transactionmentioned herein. De La Rosa & Co. makes no representations as to the legal, tax, credit or accounting treatment of any transactions mentioned herein,or any other effects such transactions may have on you and your affiliates or any other parties to such transactions and their respective affiliates. Youshould consult with your own advisors as to such matters and the consequences of the purchase and ownership of the Notes. Nothing in thesematerials constitutes a commitment by De La Rosa & Co. or any of their affiliates to enter into any transaction. No assurance can be given that anytransaction mentioned herein could in fact be executed. Past performance is not indicative of future returns, which will vary. Transactions involvingthe Notes may not be suitable for all investors. You should consult with your own advisors as to the suitability of the Notes for your particularcircumstances. Clients should contact their salesperson at, and execute transactions through, an entity of De La Rosa & Co. or other syndicate memberentity qualified in their home jurisdiction unless governing law permits otherwise.
This Investor Presentation contains forecasts, projections, and estimates that are based on current expectations but are not intended as representationsof fact or guarantees of results. If and when included in this Investor Presentation, the words “expects,” “forecasts,” “projects,” “intends,”“anticipates,” “estimates,” and analogous expressions are intended to identify forward looking statements as defined in the Securities Act of 1933, asamended, and any such statements inherently are subject to a variety of risks and uncertainties, which could cause actual results to differ materiallyfrom those contemplated in such forward looking statements. These forward looking statements speak only as of the date of this Investor Presentation.The City disclaims any obligation or undertaking to release publicly any updates or revisions to any forward looking statement contained herein toreflect any change in the City’s expectations with regard thereto or any change in events, conditions, or circumstances on which any such statement isbased.

2
Presentation TeamFinancial Advisor
Doug MontagueMontague DeRose and AssociatesPhone: 805-496-2211Email: [email protected]
Corey McCulloughMontague DeRose and AssociatesPhone: 805-496-2211Email: [email protected]
Senior Managing Underwriter
Holly VocalDe La Rosa & Co.Phone: 415-495-8863Email: [email protected]
City of Los Angeles
Natalie R. BrillChief of Debt ManagementPhone: 213-473-7500Email: [email protected]
Ha T. ToAdministrative AnalystPhone: 213-473-7500Email: [email protected]

3
Executive Summary
The City has entered a new period of growth and fiscal balance.
• Fiscal year 2013-14 is a turning point in the City’s financial position. Established a “new normal” of a lower workforce Solid set-aside fund balance of $343.5 million
$261 million Reserve Fund (5.37% of General Fund Revenues -highest in 10 years)
$61.5 million Budget Stabilization Fund $21 million Unappropriated Balance
Positive increase of City revenues, including property and sales taxes, over 3% for the past year
Continued implementation of a strategic plan including a Five Guiding Principles approach
Rate of growth in pension and OPEB have been mitigated Adopted new tiers for new sworn and civilian hires Increased employee contribution towards retirement health benefits
from 0% to 2% (sworn) or 4% (civilian) No Fiscal Emergency Resolution, no furloughs, no layoffs under the 2013-
14 Adopted Budget Met Capital Improvement Expenditure Policy (“CIEP”) of 1% 2013-14 Adopted Budget creates a roadmap to budget surplus by 2017-18 Several economic indicators, such as in employment, taxable sales and
home values, are showing growth

4
Economy Shows Signs of Improvement
Economic indicators show signs of recovery.
• The City’s economy is recovering.
• Important tourism and trade industries are performing strongly.
• Taxable sales have increased 19.4% from their recession-era lows in 2009.
• Average annual wages in the City grew 2.9% from 2011 to 2012.
• Home prices in the City trended upward throughout 2012 and reached four-year highs in the first quarter of 2013.
• Foreclosures in the City fell by 54.5% from the first quarter of 2012 to the first quarter of 2013.
• For the first quarter of 2013, retail vacancy rates were at their lowest point in four years.
• Vacancy rates for industrial properties have dropped from 8.7% in the first quarter of 2012 to 7.3% in the first quarter of 2013.

5
• The City’s unemployment rate is currently below its 2010 high.
As of March 2013, the City’s unemployment rate was 11.0%, down 3.7 percentage points from its July 2010 peak of 14.7% and 1.4% below the same time last year.
• Private sector employment in the City grew 4.2% year over year from December 2011 to December 2012.
Large increases were seen in the insurance, information services, and professional, scientific and technical sectors.
0.0%
2.0%
4.0%
6.0%
8.0%
10.0%
12.0%
14.0%
16.0%
-
200,000
400,000
600,000
800,000
1,000,000
1,200,000
1,400,000
1,600,000
1,800,000
2,000,000
2007 2008 2009 2010 2011 2012
Total Employment Unemployment Rate
Employment is Stabilizing
Employment is improving.
City of Los Angeles Employment
Source: California Employment Development Department, Labor Market Information for the State and County; U.S. Bureau of Labor, Department of Labor Statistics for the U.S.

6
Housing Market is Showing Positive Trends
Assessed valuation in the City has begun to recover.
Median home prices are increasing.
• There is significant “stored value” in secured property as a result of Proposition 13, which cushions the impact of declining home values.
• For the first quarter of 2013, median home price in the City was 29.6% higher than the first quarter of 2012.
City of L.A. Net Assessed Valuation
Year of Levy Total ($ in millions) Average Annual Growth Assessed Value Per Capita ($000s)
2008 $411,085 7.87% $109
2009 $410,711 (0.09%) $109
2010 $401,233 (2.31%) $106
2011 $406,399 1.29% $107
2012 $416,497 2.48% $108
Source: DataQuick Information Systems
Source: City of Los Angeles, Office of the City Administrative Officer
City of L.A. Median Home Price
$0
$100,000
$200,000
$300,000
$400,000
$500,000
$600,000
1994199519961997199819992000200120022003200420052006200720082009201020112012

7
• In 2012, the total number of overnight visitors to the City was a record 27.9 million, a 3.3% increase over the previous year.
Domestic overnight and international visitation increased by 3.9% and 1.2%, respectively, in 2012.
• Spending by domestic visitors totaled $10.3 billion, while spending by international visitors totaled $5.4 billion.
• To meet rising visitor demand, 8 new hotels are in construction and 10 new hotels are in the final planning stages.
The Tourism Industry is Booming
Both domestic and international tourist visits reached record highs again in 2012.
2012 total visitor spending reached $15.7 billion, the highest level since 2000.
Los Angeles Hotel Rooms Sold - 2012 Los Angeles Visitor Spending ($ in billions)
Source: Los Angeles Tourism & Convention Board
-2.00%
-1.00%
0.00%
1.00%
2.00%
3.00%
4.00%
5.00%
6.00%
7.00%
8.00%
9.00%
1,000,000
1,500,000
2,000,000
2,500,000
3,000,000
3,500,000
4,000,000
Hotel Rooms Sold % Change from Previous Year
$-
$2.0
$4.0
$6.0
$8.0
$10.0
$12.0
$14.0
$16.0
$18.0
2000 2001 2002 2003 2004 2005 2006 2007 2008 2009 2010 2011 2012
Source: Los Angeles Tourism & Convention Board
8
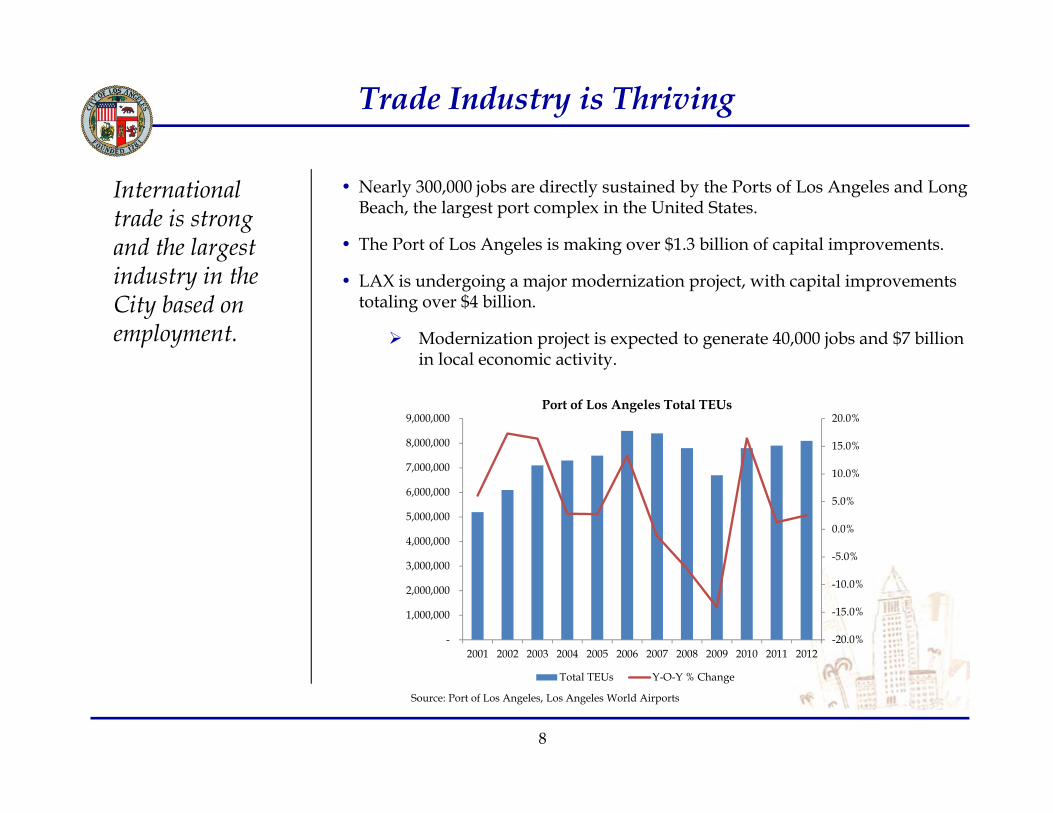
Trade Industry is Thriving
International trade is strong and the largest industry in the City based on employment.
• Nearly 300,000 jobs are directly sustained by the Ports of Los Angeles and Long Beach, the largest port complex in the United States.
• The Port of Los Angeles is making over $1.3 billion of capital improvements.
• LAX is undergoing a major modernization project, with capital improvements totaling over $4 billion.
Modernization project is expected to generate 40,000 jobs and $7 billion in local economic activity.
Port of Los Angeles Total TEUs
Source: Port of Los Angeles, Los Angeles World Airports
-20.0%
-15.0%
-10.0%
-5.0%
0.0%
5.0%
10.0%
15.0%
20.0%
-
1,000,000
2,000,000
3,000,000
4,000,000
5,000,000
6,000,000
7,000,000
8,000,000
9,000,000
2001 2002 2003 2004 2005 2006 2007 2008 2009 2010 2011 2012
Total TEUs Y-O-Y % Change

9
Budget Guiding Principles in Action
IResponsible Fiscal
Management
IIFocus on Core
Services
IIIAlternative
Service Delivery Models
IVSustainable Workforce
VProtect,
Maximize & Enhance Revenue
• Reserve Fund at 5.37%
• Budget Stabilization Fund at $61.5 million
• Budgeted 1% of General Fund revenues for capital improvements
• Partially mitigated accrued police overtime liability
• Responsible use of one-time revenues
• Maintenance of effort for street repairs set at 800 miles for 2013-14 and 735 miles thereafter
• Restoration of fire services linked to deployment plan
• Police hiring at 10,000 officers maintained
• Restored library services
• Approved formation of an Economic Development Department and completed consolidation of Office of Public Safety into LAPD
• Convention Center private operator identified, Council approval pending
• Economic Development non-profit implementation in progress to attract and retain businesses in the City
• New marketing program adopted between Zoo and GLAZA
• New private parking contractors identified, Council approval pending
• Contained staff growth to 0.2% from 2012-13 levels
• Tier II for civilian employees begins on July 1, 2013
• Minimized service impacts and avoided furloughs or layoffs through the pursuit of labor concessions
• Assumes no future salary increases through 2018 and assumes employee contributions of 10% of medical premiums
• Identify 71% ongoing and 29% one-time solutions to balance budget
• Enhancements to collection efforts
• Improved transportation grant accounting provided additional $42 million one-time revenue
• Review of 900 special funds to ensure proper General Fund cost reimbursement
• Alternative financing methods for major infrastructure projects

10
2013-14 Adopted Budget Solutions
2013-14 Adopted Budget Solutions(in $ millions)
Ongoing One-Time TotalRevenue $113.19 $133.08 $246.28 Pension Savings $55.61 - $55.61 Department Efficiencies and/or Reductions $14.95 $1.65 $16.60 Funding Realignment and Adjustments $15.10 $2.73 $17.83 Service Investments/Purchases ($45.64) ($75.17) ($120.81)Total $153.22 $62.29 $215.51
2013-14 Adopted Budget Solutions
$216
$0
$50
$100
$150
$200
$250
$300
$350
$400
Previously Projected Deficit Budget Solutions
$Mill
ions
Other Changes $18Efficiencies and Reductions $17
One-Time Revenue $133
Pension Savings$56
Economy-Driven Revenues
$113
• Leading into 2013-14, the City reduced the previously projected $1 billion budget gap by 80%
• The 2013-14 Budget addresses deferred liabilities and investments to City services and infrastructure.
• In addition to closing the $216 million budget gap, the City is increasing the budget for new services and facilities by $121 million.
Source: City of Los Angeles, Office of the City Administrative Officer
Source: City of Los Angeles, Office of the City Administrative Officer

11
Major General Fund Revenues Stabilized
• The City has experienced gains in several areas in fiscal year 2013. The expected gains are:
Property Tax: 5.4%
Utility Users’ Tax: 1.7%
Business Tax: 3.1%
Sales Tax: 4.9%
Transient Occupancy Tax: 8.7%
Documentary Transfer Tax: 41.0%
Parking Users’ Tax: 6.1%
Major General Fund revenues have exceeded 2012-13 Budget.
The City is projecting conservative revenue growth of 3% annually.
-4.8%
0.8%1.9%
7.0%
3.3%
1.5
2.0
2.5
3.0
3.5
4.0
-10%
-5%
0%
5%
10%
15%
90 91 92 93 94 95 96 97 98 99 00 01 02 03 04 05 06 07 08 09 10 11 12 13 14 15 16 17 18
$ Bi
llion
s
% C
hang
e fr
om Y
ear A
go
Fiscal Year Ending
Seven General Fund Taxes
% change -- Left Scale 7 General Fund Taxes ($Billions) -- Right Scale Pre-recession Level
Property (includes VLF and ex-CRA receipts), Utility, Business, Sales, Hotel, Documentary and Parking Taxes
EstimatesActuals
Source: City of Los Angeles, Office of the City Administrative Officer

12
2013-14 Adopted Budget Reflects Conservative Revenue Projections
Source: City of Los Angeles, Office of the City Administrative Officer
Sources of General Fund Revenue for Fiscal Year 2013-14
Variance % Variance2012-13 2013-14 from 2012-13 from 2012-13Revised Adopted Revised Revised
$ in thousands Estimate Budget Estimate Estimate
Property Tax $1,517,326 $1,549,568 $32,242 2.1%Redirection of ex-CRA Tax Increment Monies 49,837 55,434 $5,597 11.2%Utility Users' Tax 625,300 641,598 16,298 2.6%Business Tax 453,439 470,728 17,289 3.8%Sales Tax 339,221 352,790 13,569 4.0%Transient Occupancy Tax 164,939 174,423 9,484 5.8%Documentary Transfer Tax 145,551 160,106 14,555 10.0%Parking Users' Tax 91,728 94,947 3,219 3.5%Licenses, Permits, Fees and Fines 736,518 832,712 96,194 13.1%Residential Development Tax 2,100 2,100 0 0.0%All Other 507,377 532,486 25,109 4.9%Subtotal General Fund $4,633,336 $4,866,892 $233,556 5.0%
Transfer from Reserve Fund - - - -Total General Fund $4,633,336 $4,866,892 $233,556 5.0%
13
$4,879
$5,014
$5,156
$5,285
$4,550
$4,867
$5,120
$5,216
$5,341 $5,368
$4,400
$4,500
$4,600
$4,700
$4,800
$4,900
$5,000
$5,100
$5,200
$5,300
$5,400
2012-13 2013-14 2014-15 2015-16 2016-17 2017-18
Mill
ions
Fiscal Year
Revenues (Alternative) Expenditures (Alternative)
($242)
($201)
($184)
($83)
$4,879
$5,014
$5,156
$5,285
$4,550
$4,867
$5,032
$5,127
$5,252 $5,279
$4,500
$4,600
$4,700
$4,800
$4,900
$5,000
$5,100
$5,200
$5,300
2012-13 2013-14 2014-15 2015-16 2016-17 2017-18
Mil
lion
s
Fiscal Year
Revenues (Proposed) Expenditures (Proposed)
($153)
($112)
($96)
$6
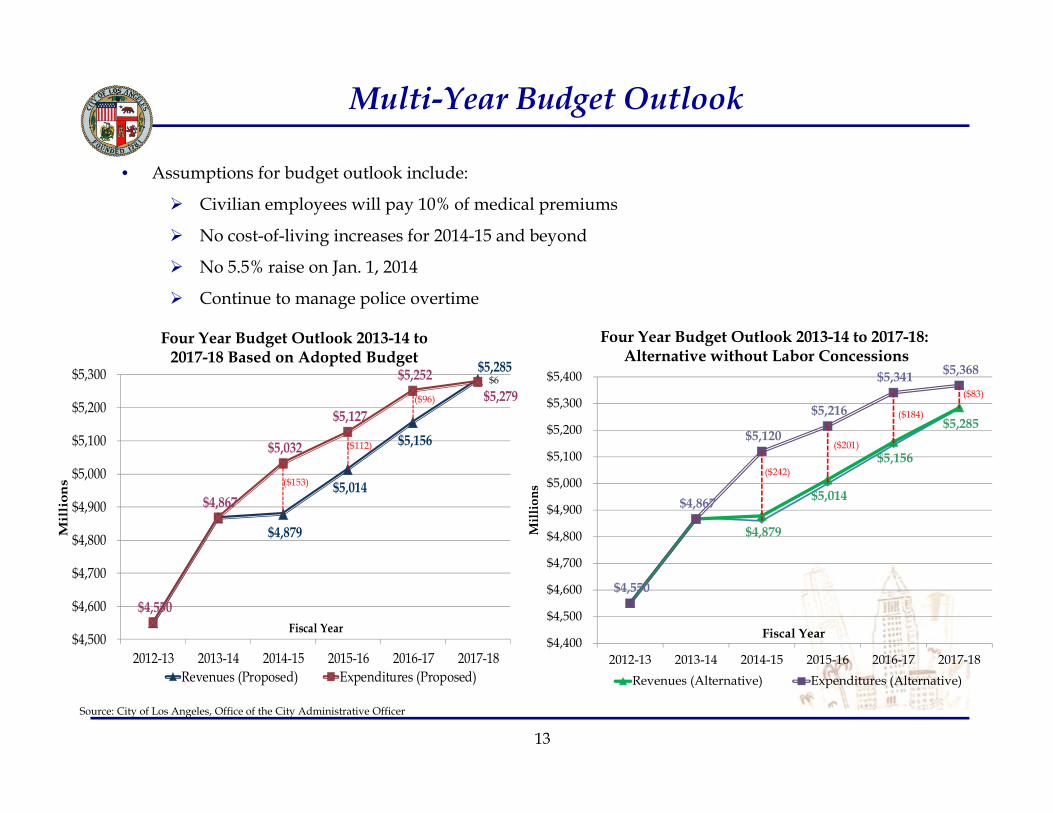
Multi-Year Budget Outlook
Source: City of Los Angeles, Office of the City Administrative Officer
• Assumptions for budget outlook include:
Civilian employees will pay 10% of medical premiums
No cost-of-living increases for 2014-15 and beyond
No 5.5% raise on Jan. 1, 2014
Continue to manage police overtime
Four Year Budget Outlook 2013-14 to 2017-18 Based on Adopted Budget
Four Year Budget Outlook 2013-14 to 2017-18:Alternative without Labor Concessions

14
Record High Reserve Balances
The City’s Reserve Fund is projected to be $343.5 million.
• The City maintains a cash Reserve Fund for contingencies and emergencies.
• The City has met its Charter mandate for a 2.75% emergency reserve.
• This year, the City met its policy goal of 5% of General Fund revenues.
• Set-aside fund balance of $343.5 million includes:
$261 million Reserve Fund (5.37% of General Fund Revenues -highest in 10 years)
$61.5 million Budget Stabilization Fund
$21 million Unappropriated Balance
Source: City of Los Angeles, Office of the City Administrative Officer
Reserve Fund Balance($ in millions)
$186.7 $192.3 $189.5
$121.7
$177.7$211.0
$343.5
0
0.01
0.02
0.03
0.04
0.05
0.06
0.07
0.08
$0
$50
$100
$150
$200
$250
$300
$350
$400
2007-08 2008-09 2009-10 2010-11 2011-12 2012-13 2013-14
Perc
ent (
%)
Emergency reserve Contigency reserveBudget Stabilization Fund UB Reserve for Economic UncertaintiesTotal Reserve Balances as % of GF revenues

15
Pensions and Benefits – Estimated Contributions
Future City pension contributions are growing at a reduced rate.
Strong investment returns are keeping funded ratios over 70%.
0%
25%
50%
75%
100%
2005-06 2006-07 2007-08 2008-09 2009-10 2010-11 2011-12
Fire and Police Pension Plan L.A. City Employees' Retirement System
Pension Systems Funded Ratio
0%
25%
50%
75%
100%
2005-06 2006-07 2007-08 2008-09 2009-10 2010-11 2011-12
Fire and Police Pension Plan L.A. City Employees' Retirement System
Other Post-Employment Benefits Funded Ratio
Estimated Future City Contributions to Pensions($ in millions)
$411 $382 $424 $468 $486
$537 $617$670
$745 $789
$342 $368 $403 $444 $469
$506$576
$648$688 $726
$0
$200
$400
$600
$800
$1,000
$1,200
$1,400
LA City Employees' Retirement Fund Fire And Police Pension Fund1LACERS New Contribution Amount FPPS New Contribution Amount
Source: City of Los Angeles, Office of the City Administrative Officer
$948$848
$999$944
$1,094$1,051
$1,213$1,132
$1,275$1,195

16
13,758
13,799
13,807
13,805
13,832
13,944
14,244
14,253 14,012
13,740 13,677
13,647 13,706
21,701
22,080
22,167
21,610
22,324
22,723
22,929
22,718
21,852
19,225
18,597
18,169 18,187
-
5,000
10,000
15,000
20,000
25,000
30,000
35,000
40,000
2001-02 2002-03 2003-04 2004-05 2005-06 2006-07 2007-08 2008-09 2009-10 2010-11 2011-12 2012-13 2013-14
Authorized City Staffing(Not Including Proprietary Departments)
Police (Sworn and Civilian) Others
35,459 35,879 35,974 35,415 36,156 36,667 37,173 36,971 35,86432,965 32,274 31,816 31,893
Authorized City Staffing
The civilian workforce has been maintained near its lowest point in more than three decades. (14%)
Source: City of Los Angeles, Office of the City Administrative Officer
• Staffing has been maintained at its current level which is down 14% from its peak in 2007-08.

17
2013 TRAN Issuance Overview
The TRAN issuance is conservatively structured.
• The City expects to issue approximately $1.3 billion of fixed rate TRANs.
TRANs are being issued to provide cash flow management for the City’s General Fund and prepay the City’s annual contributions to its two pension systems in July 2013.
The TRANs have been rated MIG 1/SP-1+/F1+ from Moody’s, Standard & Poor’s and Fitch, respectively.
• The TRANs are being structured with early set-aside dates for repayment of principal and interest.
• The expected set-aside dates and associated maturity dates are as follows:
Set-Aside Date Set-AsidePercentage
Maturity Date* Principal Percentage
January 22, 2014 20% February 27, 2014 20%
February 27, 2014 20%
March 27, 2014 20% May 1, 2014 40%
April 24, 2014 20%
May 22, 2014 20% June 26, 2014 40%
*Preliminary, subject to change.

18
Cash Flow ProjectionsCITY OF LOS ANGELES
GENERAL FUND CASH FLOWFISCAL YEAR 2013-14
(In Thousands)
PAYROLL PERIOD ENDING July 24 August 21 September 18 October 30 November 27 December 25 January 22 February 27* March 19 April 30 May 28 June 30 Total
BEGINNING CASH BALANCE 289,600$ 487,070$ 250,996$ 265,951$ 50,078$ 25,392$ 348,900$ 310,806$ 206,597$ 195,730$ 95,491$ 131,692$
RECEIPTS
Property Taxes 38,511 -- 49,343 -- 29,212 389,051 376,239 68,817 -- 312,904 322,386 18,539 1,605,002 Utility Users Tax 13,859 46,842 47,239 67,422 59,926 55,834 49,750 60,139 32,961 74,631 50,049 82,946 641,598 Licenses, Permits, Fees and Fines 6,753 32,083 93,475 58,075 40,592 72,528 41,186 95,589 35,130 97,615 64,010 195,676 832,712 Sales Tax 23,496 -- 29,881 56,482 29,458 -- 60,679 32,668 -- 53,765 31,398 34,963 352,790 Business Tax 1,365 9,320 4,660 6,120 5,084 3,530 5,225 36,410 140,866 220,865 19,770 17,513 470,728 Expenditure Transfers and Reimbursements 29,469 69,200 87,039 91,645 67,085 103,122 45,292 98,528 58,566 122,840 71,122 178,770 1,022,678 Other Revenues 6,938 62,472 58,584 86,641 59,673 52,905 13,577 77,470 23,228 91,705 58,182 119,687 711,062 Borrowing from Other Funds -- -- -- -- 20,000 -- -- -- -- -- -- -- 20,000 Transfer from Proprietary Funds -- -- -- -- -- -- -- 151,800 -- 50,600 25,300 25,300 253,000 2013 TRANs Proceeds 1,343,715 -- -- -- -- -- -- -- -- -- -- -- 1,343,715
Total Receipts 1,464,106 219,917 370,221 366,385 311,030 676,970 591,948 621,421 290,751 1,024,925 642,217 673,394 7,253,285
DISBURSEMENTS
Salaries 219,913 233,226 222,626 334,939 222,626 222,626 236,843 229,060 229,060 342,590 229,060 229,060 2,951,629 Allocations to Other Funds -- 42,296 20,656 48,423 1,478 18,470 18,932 47,869 -- 53,687 3,786 52,237 307,834 Services, Equipment and Supplies 27,265 65,289 74,926 94,936 70,348 63,541 57,255 68,571 53,866 97,248 67,344 107,005 847,594 Other Disbursements 1,019,458 115,180 37,058 103,960 41,264 28,825 47,708 110,829 18,692 93,037 36,525 109,773 1,762,309 Repayment of Borrowings from Other Funds -- -- -- -- -- 20,000 -- -- -- -- -- -- 20,000 2013 TRANs Debt Service Fund -- -- -- -- -- -- 269,304 269,301 -- 538,602 269,301 -- 1,346,508
Total Disbursements 1,266,636 455,991 355,266 582,258 335,716 353,462 630,042 725,630 301,618 1,125,164 606,016 498,075 7,235,875
SURPLUS/DEFICIT 197,470 (236,074) 14,955 (215,873) (24,686) 323,508 (38,094) (104,209) (10,867) (100,239) 36,201 175,319
ENDING CASH BALANCE 487,070$ 250,996$ 265,951$ 50,078$ 25,392$ 348,900$ 310,806$ 206,597$ 195,730$ 95,491$ 131,692$ 307,011$
AVAILABLE/BORROWABLE RESOURCESReserve Fund 226,086$ 228,256$ 227,733$ 227,883$ 208,128$ 228,283$ 228,515$ 232,425$ 227,043$ 227,136$ 228,064$ 228,993$ Other Borrowable Funds 525,009 547,306 554,892 568,491 579,543 598,306 610,341 622,656 624,847 617,791 -- -- Total Borrowable Funds 751,095$ 775,562$ 782,625$ 796,374$ 787,671$ 826,589$ 838,856$ 855,081$ 851,890$ 844,927$ 228,064$ 228,993$
*Period includes February 27 maturity date.

19
Cash Management Program Overview
The City’s cash management program provides strong security for the TRAN.
• General Fund disbursements tend to remain level throughout the year, while General Fund receipts remain uneven.
TRANs are issued each year to manage cash flows.
• Security structures for the TRAN include:
First claim on unrestricted revenues
Early set-aside payments, structured at least 30 days prior to maturity
Significant borrowable resources are available for additional coverage.
Payroll PeriodEnding
Set-AsidePayment
Dates
Set Aside Payment
Total GeneralFund
ReceiptsCoverage
January 22 January 22 $269,304,338 $591,948,000 2.20x
March 19 February 27 $269,300,990 $638,828,000 2.37x
April 30 March 27 & April 24 $538,601,980 $1,024,925,000 1.90x
May 28* May 22 $269,300,990 $642,217,000 2.38x
Total $1,346,508,298
Monthly Cash Balances and Borrowable Resources($ in thousands)
* Through April 28, both Reserve Fund and Special Funds in the range of $751 million to $855 million are available to borrow with City Council approval. Pursuant to City Charter only Reserve Fund monies are available for borrowing after April 28.
$0
$200,000
$400,000
$600,000
$800,000$1,000,000
Jul-1
3A
ug-1
3Se
p-13
Oct
-13
Nov
-13
Dec
-13
Jan-
14Fe
b-14
Mar
-14
Apr
-14
May
-14
Jun-
14
Total Borrowable Funds2012-13 Ending Cash Balances2013-14 Projected Ending Cash Balances
Source: City of Los Angeles, Office of the City Controller

20
Financing Schedule
Event Date
Received ratings and Posted POS June 14
Institutional Pricing June 26
Closing July 11
JUNES M T W T F S
12 3 4 5 6 7 89 10 11 12 13 14 1516 17 18 19 20 21 2223 24 25 26 27 28 2930
JULYS M T W T F S
1 2 3 4 5 67 8 9 10 11 12 13
14 15 16 17 18 19 2021 22 23 24 25 26 2728 29 30 31
21
Credit Strengths
• The City’s budget is based on conservative revenue assumptions.
• The City addresses budget gaps primarily through ongoing solutions.
• The 2013-14 Budget provides flexibility for uncertainties.
• Set-aside fund balance of $343.5 million includes:
$261 million Reserve Fund
$61.5 million Budget Stabilization Fund
$21 million Unappropriated Balance
• The underlying economics of the Los Angeles region set the stage for a strong economic recovery.
• Estimated cash flows are strong and provide adequate coverage for the TRANs.
• The City has never failed to meet its TRAN set-aside payment dates.