Embed Size (px)
Citation preview
Crop water use, also referred to as evapotranspiration (ET), is the water used by a crop for growth and cooling. Crop water use, or crop water requirement, is the total amount of water needed for evapotranspiration from planting to harvest for a given crop in a specific climate, when adequate soil water is maintained by rainfall and/or irrigation so it does not limit plant growth and crop yield. Only a small fraction of the water a plant takes in is used for growth, often only about 1 percent; the majority of water is needed to allow the plant to cool itself. The movement of water into the plant is important, since this water carries essential nutrients needed by the plant for growth processes.
Evapotranspiration is the combination of two words: evapo-ration and transpiration. Evapora-tion refers to the water that moves from a wetted soil or leaf surface directly to the atmosphere, while transpiration refers to the water that the plant to be used in the growth process or released into the atmosphere. The term evapotrans-piration was coined since the two processes can occur simultaneously and are difficult to measure sepa-rately.
Both evaporation and transpi-ration processes require energy or heat. This heat energy comes from the sun (solar radiation) or from advective heat, which is heat moved by air masses. Since this is a phys-ical process, it can be predicted for a known crop using weather infor-mation. The common procedure for estimating the crop water use for a specific crop is to input weather data into an equation developed to predict the water use for a reference crop. The reference crop is often
either grass or alfalfa of a specific height. The reference crop ET is often designated ETo for grass or ETr for alfalfa. The reference crop ET is then modified to the actual crop water use using a crop coef-ficient (Kco), which is unique for each crop species. The Kco’s vary by crop and by the stage of growth of the specific crop. This process is more fully discussed in K-State Research and Extension publica-tion MF2389, What is ET?.
Crop Water Use Fluctuations
Since crop water use is an energy-driven process, crop water use has a diurnal (daytime) cycle. The most commonly reported crop water use is the daily (total) crop water use. Daily use can have significant variation driven by the weather conditions, such as a hot and windy day versus cool and cloudy day.
Seasonal crop water use varies for a given crop based on the summation of the growing season conditions. During drought, refer-ence crop ET rates are higher because the daily weather condi-tions are hotter and with clear skies, allowing more solar radiation to reach the crop leaf surface as contrasted with cooler and cloudy days. During drought, crop water use may be suppressed if the plants are stressed due to lack of adequate soil water from the lack of precipi-tation events and no irrigation.
Diurnal/Nocturnal Crop Water Use
The processes occurring inter-nally in the plant are photosynthesis and respiration. Photosynthesis is unique to plants because chloro-plasts in the plant cells give them
Agricultural Crop Water UseDanny H. Rogers Professor, Extension Irrigation Engineer,Biological and Agricultural Engineering
Jonathan AguilarAssistant Professor, Water Resources Engineer, Southwest Research Extension Center
Isaya KisekkaAssistant Professor, Irrigation Research Engineer, Southwest Research Extension Center
Philip L. BarnesAssociate Professor, Water Quality,Biological and Agricultural Engineering
Freddie R. LammProfessor, Irrigation Research Engineer,Northwest Research and Extension Center
Kansas State University Agricultural Experiment Station and Cooperative Extension Service
2 K-State Research and Extension — Agricultural Crop Water Use
the ability to capture light energy and produce sugar (energy) when carbon dioxide and water are available. Photosynthesis allows plants to convert light energy into a form that can be used to fuel plant growth. This growth process is called respiration, which is the metabolizing (burning of fuel) of sugar for plant growth and other life processes. Both plants and animals respire. Plants release oxygen during photosynthesis but require oxygen to complete respiration. Photosyn-thesis can only occur in the presence of light, while respiration can occur whether dark or light.
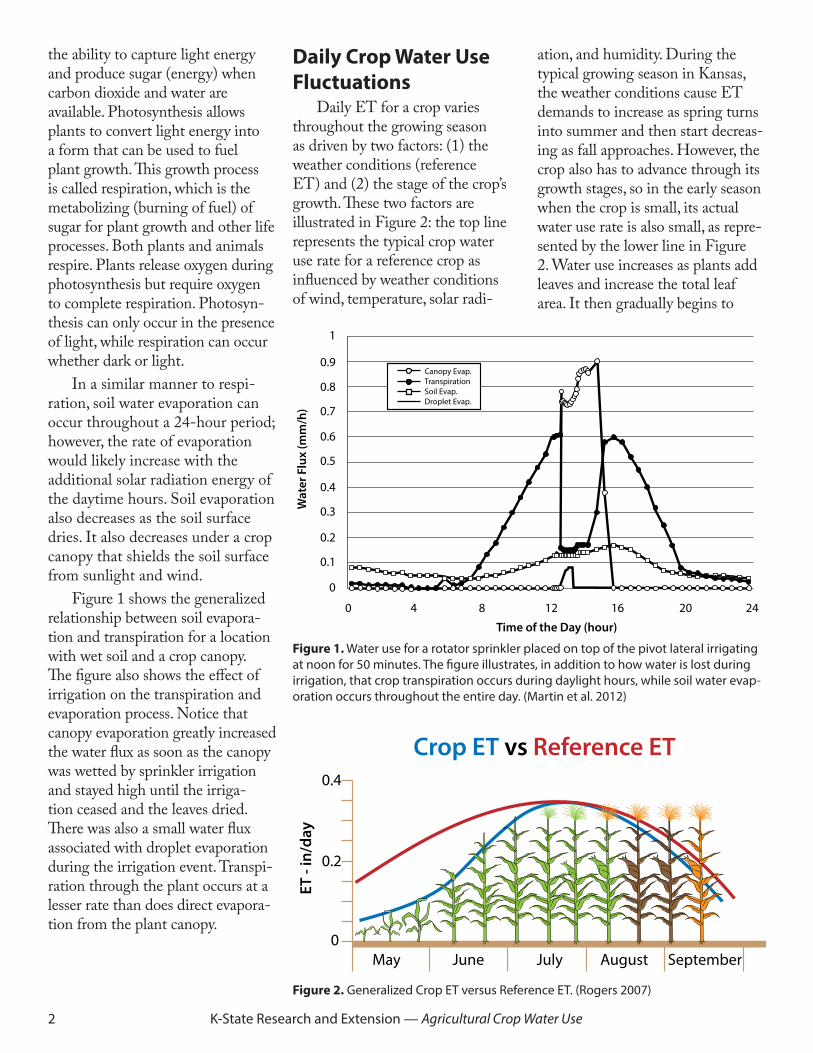
In a similar manner to respi-ration, soil water evaporation can occur throughout a 24-hour period; however, the rate of evaporation would likely increase with the additional solar radiation energy of the daytime hours. Soil evaporation also decreases as the soil surface dries. It also decreases under a crop canopy that shields the soil surface from sunlight and wind.
Figure 1 shows the generalized relationship between soil evapora-tion and transpiration for a location with wet soil and a crop canopy. The figure also shows the effect of irrigation on the transpiration and evaporation process. Notice that canopy evaporation greatly increased the water flux as soon as the canopy was wetted by sprinkler irrigation and stayed high until the irriga-tion ceased and the leaves dried. There was also a small water flux associated with droplet evaporation during the irrigation event. Transpi-ration through the plant occurs at a lesser rate than does direct evapora-tion from the plant canopy.
Daily Crop Water Use Fluctuations
Daily ET for a crop varies throughout the growing season as driven by two factors: (1) the weather conditions (reference ET) and (2) the stage of the crop’s growth. These two factors are illustrated in Figure 2: the top line represents the typical crop water use rate for a reference crop as influenced by weather conditions of wind, temperature, solar radi-
ation, and humidity. During the typical growing season in Kansas, the weather conditions cause ET demands to increase as spring turns into summer and then start decreas-ing as fall approaches. However, the crop also has to advance through its growth stages, so in the early season when the crop is small, its actual water use rate is also small, as repre-sented by the lower line in Figure 2. Water use increases as plants add leaves and increase the total leaf area. It then gradually begins to
Canopy Evap.TranspirationSoil Evap.Droplet Evap.
0.9
1
0.8
0.7
0.6
0.5
0.4
0.3
0.2
0.1
0
0 4
Time of the Day (hour)
Wat
er F
lux
(mm
/h)
8 12 16 20 24
Crop ET vs Reference ET
0
0.2
0.4
May June July August September
ET -
in/d
ay
Figure 2. Generalized Crop ET versus Reference ET. (Rogers 2007)
Figure 1. Water use for a rotator sprinkler placed on top of the pivot lateral irrigating at noon for 50 minutes. The figure illustrates, in addition to how water is lost during irrigation, that crop transpiration occurs during daylight hours, while soil water evap-oration occurs throughout the entire day. (Martin et al. 2012)
K-State Research and Extension — Agricultural Crop Water Use 3
decrease once the plant completes it reproductive life and begins to lose green leaf area.
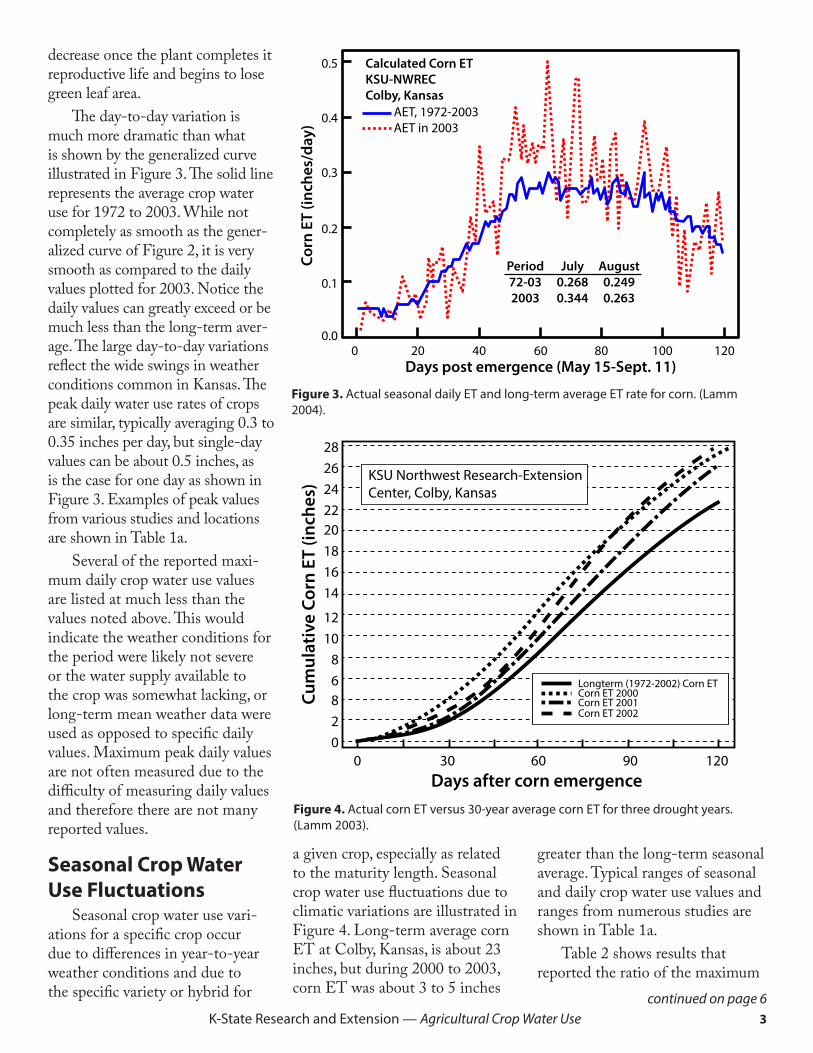
The day-to-day variation is much more dramatic than what is shown by the generalized curve illustrated in Figure 3. The solid line represents the average crop water use for 1972 to 2003. While not completely as smooth as the gener-alized curve of Figure 2, it is very smooth as compared to the daily values plotted for 2003. Notice the daily values can greatly exceed or be much less than the long-term aver-age. The large day-to-day variations reflect the wide swings in weather conditions common in Kansas. The peak daily water use rates of crops are similar, typically averaging 0.3 to 0.35 inches per day, but single-day values can be about 0.5 inches, as is the case for one day as shown in Figure 3. Examples of peak values from various studies and locations are shown in Table 1a.
Several of the reported maxi-mum daily crop water use values are listed at much less than the values noted above. This would indicate the weather conditions for the period were likely not severe or the water supply available to the crop was somewhat lacking, or long-term mean weather data were used as opposed to specific daily values. Maximum peak daily values are not often measured due to the difficulty of measuring daily values and therefore there are not many reported values.
Seasonal Crop Water Use Fluctuations
Seasonal crop water use vari-ations for a specific crop occur due to differences in year-to-year weather conditions and due to the specific variety or hybrid for
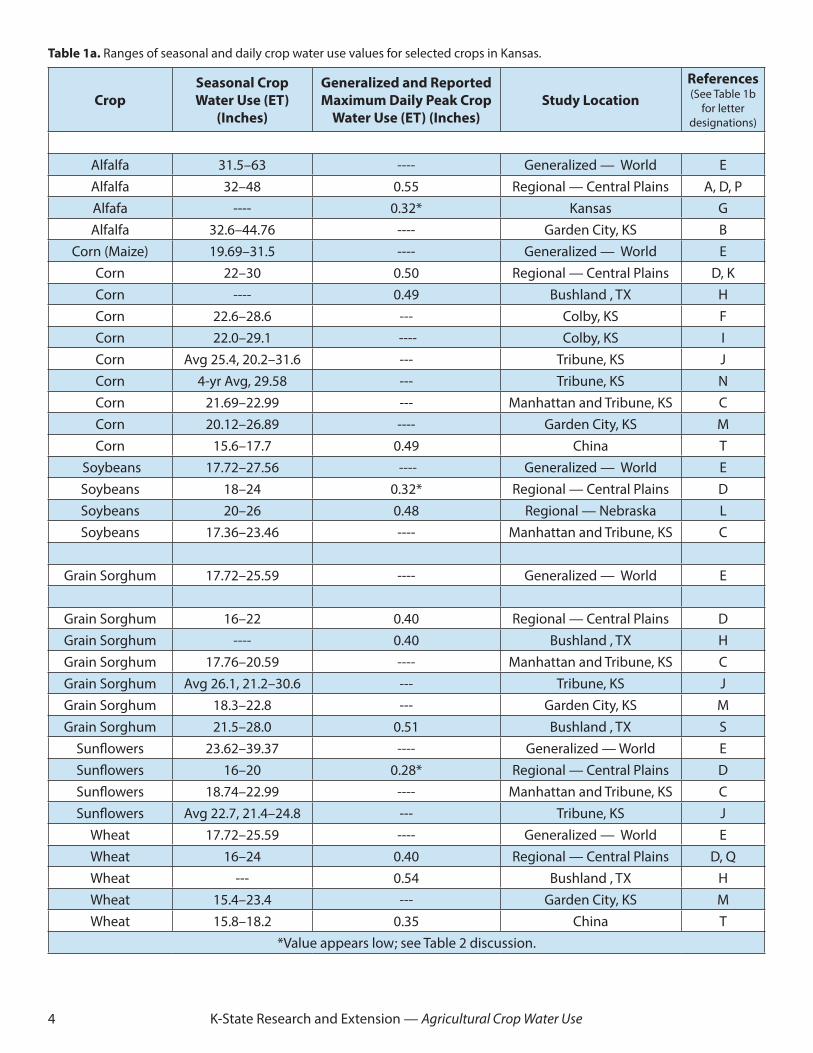
a given crop, especially as related to the maturity length. Seasonal crop water use fluctuations due to climatic variations are illustrated in Figure 4. Long-term average corn ET at Colby, Kansas, is about 23 inches, but during 2000 to 2003, corn ET was about 3 to 5 inches
greater than the long-term seasonal average. Typical ranges of seasonal and daily crop water use values and ranges from numerous studies are shown in Table 1a.
Table 2 shows results that reported the ratio of the maximum
0.00 20 40 60 80 100 120
0.1
0.2
0.3
0.4
0.5
Cor
n ET
(inc
hes/
day)
Days post emergence (May 15-Sept. 11)
Calculated Corn ET KSU-NWREC Colby, Kansas
AET, 1972-2003AET in 2003
Period July August 72-03 0.268 0.249 2003 0.344 0.263
2826242220181614
1210
86820
0 30 60 90 120
Cum
ulat
ive
Corn
ET
(inch
es)
Longterm (1972-2002) Corn ETCorn ET 2000Corn ET 2001Corn ET 2002
Days after corn emergence
KSU Northwest Research-Extension Center, Colby, Kansas
Figure 3. Actual seasonal daily ET and long-term average ET rate for corn. (Lamm 2004).
Figure 4. Actual corn ET versus 30-year average corn ET for three drought years. (Lamm 2003).
continued on page 6
4 K-State Research and Extension — Agricultural Crop Water Use
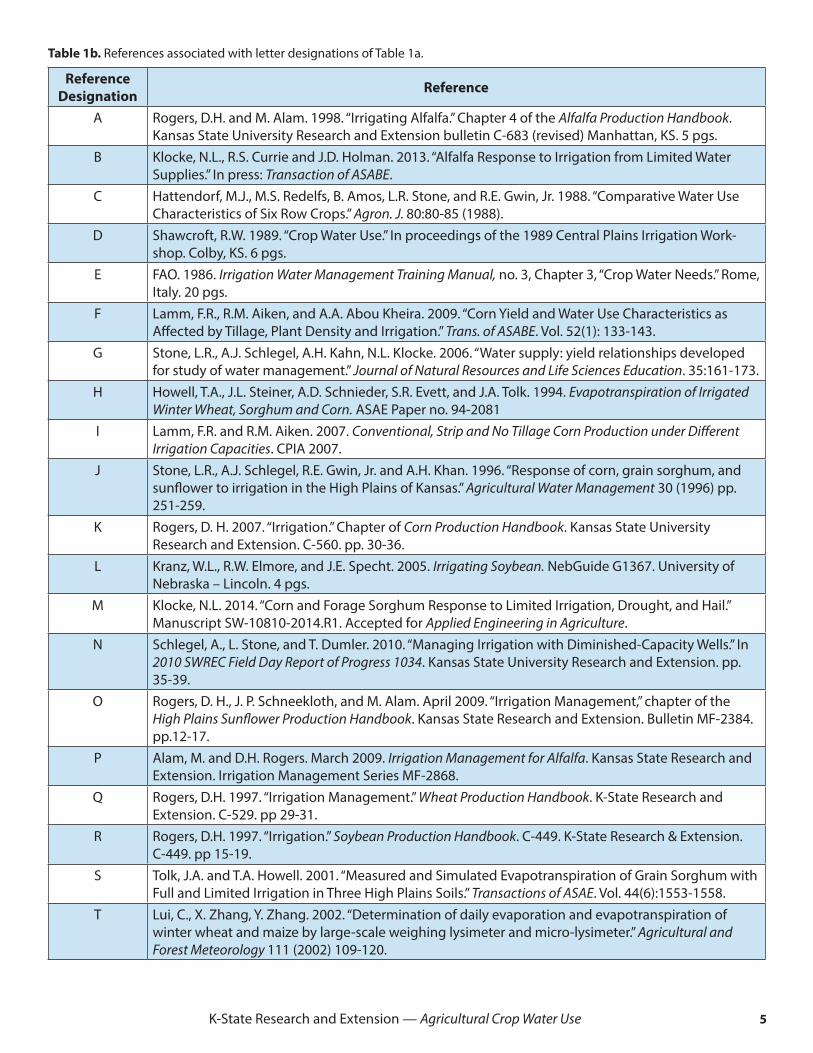
Table 1a. Ranges of seasonal and daily crop water use values for selected crops in Kansas.
CropSeasonal Crop Water Use (ET)
(Inches)
Generalized and Reported Maximum Daily Peak Crop
Water Use (ET) (Inches)Study Location
References(See Table 1b
for letter designations)
Alfalfa 31.5–63 ---- Generalized — World EAlfalfa 32–48 0.55 Regional — Central Plains A, D, PAlfafa ---- 0.32* Kansas GAlfalfa 32.6–44.76 ---- Garden City, KS B
Corn (Maize) 19.69–31.5 ---- Generalized — World ECorn 22–30 0.50 Regional — Central Plains D, KCorn ---- 0.49 Bushland , TX HCorn 22.6–28.6 --- Colby, KS FCorn 22.0–29.1 ---- Colby, KS ICorn Avg 25.4, 20.2–31.6 --- Tribune, KS JCorn 4-yr Avg, 29.58 --- Tribune, KS NCorn 21.69–22.99 --- Manhattan and Tribune, KS CCorn 20.12–26.89 ---- Garden City, KS MCorn 15.6–17.7 0.49 China T
Soybeans 17.72–27.56 ---- Generalized — World ESoybeans 18–24 0.32* Regional — Central Plains DSoybeans 20–26 0.48 Regional — Nebraska LSoybeans 17.36–23.46 ---- Manhattan and Tribune, KS C
Grain Sorghum 17.72–25.59 ---- Generalized — World E
Grain Sorghum 16–22 0.40 Regional — Central Plains DGrain Sorghum ---- 0.40 Bushland , TX HGrain Sorghum 17.76–20.59 ---- Manhattan and Tribune, KS CGrain Sorghum Avg 26.1, 21.2–30.6 --- Tribune, KS JGrain Sorghum 18.3–22.8 --- Garden City, KS MGrain Sorghum 21.5–28.0 0.51 Bushland , TX S
Sunflowers 23.62–39.37 ---- Generalized — World ESunflowers 16–20 0.28* Regional — Central Plains DSunflowers 18.74–22.99 ---- Manhattan and Tribune, KS CSunflowers Avg 22.7, 21.4–24.8 --- Tribune, KS J
Wheat 17.72–25.59 ---- Generalized — World EWheat 16–24 0.40 Regional — Central Plains D, QWheat --- 0.54 Bushland , TX HWheat 15.4–23.4 --- Garden City, KS MWheat 15.8–18.2 0.35 China T
*Value appears low; see Table 2 discussion.
K-State Research and Extension — Agricultural Crop Water Use 5
Table 1b. References associated with letter designations of Table 1a.
Reference Designation Reference
A Rogers, D.H. and M. Alam. 1998. “Irrigating Alfalfa.” Chapter 4 of the Alfalfa Production Handbook. Kansas State University Research and Extension bulletin C-683 (revised) Manhattan, KS. 5 pgs.
B Klocke, N.L., R.S. Currie and J.D. Holman. 2013. “Alfalfa Response to Irrigation from Limited Water Supplies.” In press: Transaction of ASABE.
C Hattendorf, M.J., M.S. Redelfs, B. Amos, L.R. Stone, and R.E. Gwin, Jr. 1988. “Comparative Water Use Characteristics of Six Row Crops.” Agron. J. 80:80-85 (1988).
D Shawcroft, R.W. 1989. “Crop Water Use.” In proceedings of the 1989 Central Plains Irrigation Work-shop. Colby, KS. 6 pgs.
E FAO. 1986. Irrigation Water Management Training Manual, no. 3, Chapter 3, “Crop Water Needs.” Rome, Italy. 20 pgs.
F Lamm, F.R., R.M. Aiken, and A.A. Abou Kheira. 2009. “Corn Yield and Water Use Characteristics as Affected by Tillage, Plant Density and Irrigation.” Trans. of ASABE. Vol. 52(1): 133-143.
G Stone, L.R., A.J. Schlegel, A.H. Kahn, N.L. Klocke. 2006. “Water supply: yield relationships developed for study of water management.” Journal of Natural Resources and Life Sciences Education. 35:161-173.
H Howell, T.A., J.L. Steiner, A.D. Schnieder, S.R. Evett, and J.A. Tolk. 1994. Evapotranspiration of Irrigated Winter Wheat, Sorghum and Corn. ASAE Paper no. 94-2081
I Lamm, F.R. and R.M. Aiken. 2007. Conventional, Strip and No Tillage Corn Production under Different Irrigation Capacities. CPIA 2007.
J Stone, L.R., A.J. Schlegel, R.E. Gwin, Jr. and A.H. Khan. 1996. “Response of corn, grain sorghum, and sunflower to irrigation in the High Plains of Kansas.” Agricultural Water Management 30 (1996) pp. 251-259.
K Rogers, D. H. 2007. “Irrigation.” Chapter of Corn Production Handbook. Kansas State University Research and Extension. C-560. pp. 30-36.
L Kranz, W.L., R.W. Elmore, and J.E. Specht. 2005. Irrigating Soybean. NebGuide G1367. University of Nebraska – Lincoln. 4 pgs.
M Klocke, N.L. 2014. “Corn and Forage Sorghum Response to Limited Irrigation, Drought, and Hail.” Manuscript SW-10810-2014.R1. Accepted for Applied Engineering in Agriculture.
N Schlegel, A., L. Stone, and T. Dumler. 2010. “Managing Irrigation with Diminished-Capacity Wells.” In 2010 SWREC Field Day Report of Progress 1034. Kansas State University Research and Extension. pp. 35-39.
O Rogers, D. H., J. P. Schneekloth, and M. Alam. April 2009. “Irrigation Management,” chapter of the High Plains Sunflower Production Handbook. Kansas State Research and Extension. Bulletin MF-2384. pp.12-17.
P Alam, M. and D.H. Rogers. March 2009. Irrigation Management for Alfalfa. Kansas State Research and Extension. Irrigation Management Series MF-2868.
Q Rogers, D.H. 1997. “Irrigation Management.” Wheat Production Handbook. K-State Research and Extension. C-529. pp 29-31.
R Rogers, D.H. 1997. “Irrigation.” Soybean Production Handbook. C-449. K-State Research & Extension. C-449. pp 15-19.
S Tolk, J.A. and T.A. Howell. 2001. “Measured and Simulated Evapotranspiration of Grain Sorghum with Full and Limited Irrigation in Three High Plains Soils.” Transactions of ASAE. Vol. 44(6):1553-1558.
T Lui, C., X. Zhang, Y. Zhang. 2002. “Determination of daily evaporation and evapotranspiration of winter wheat and maize by large-scale weighing lysimeter and micro-lysimeter.” Agricultural and Forest Meteorology 111 (2002) 109-120.
6 K-State Research and Extension — Agricultural Crop Water Use
value of crop ET to a reference ET value. In this study, sunflowers had the largest ratio, indicating that crop had the largest daily peak water use rate. Table 2 also reported seasonal water use amounts, which are discussed in the next section.
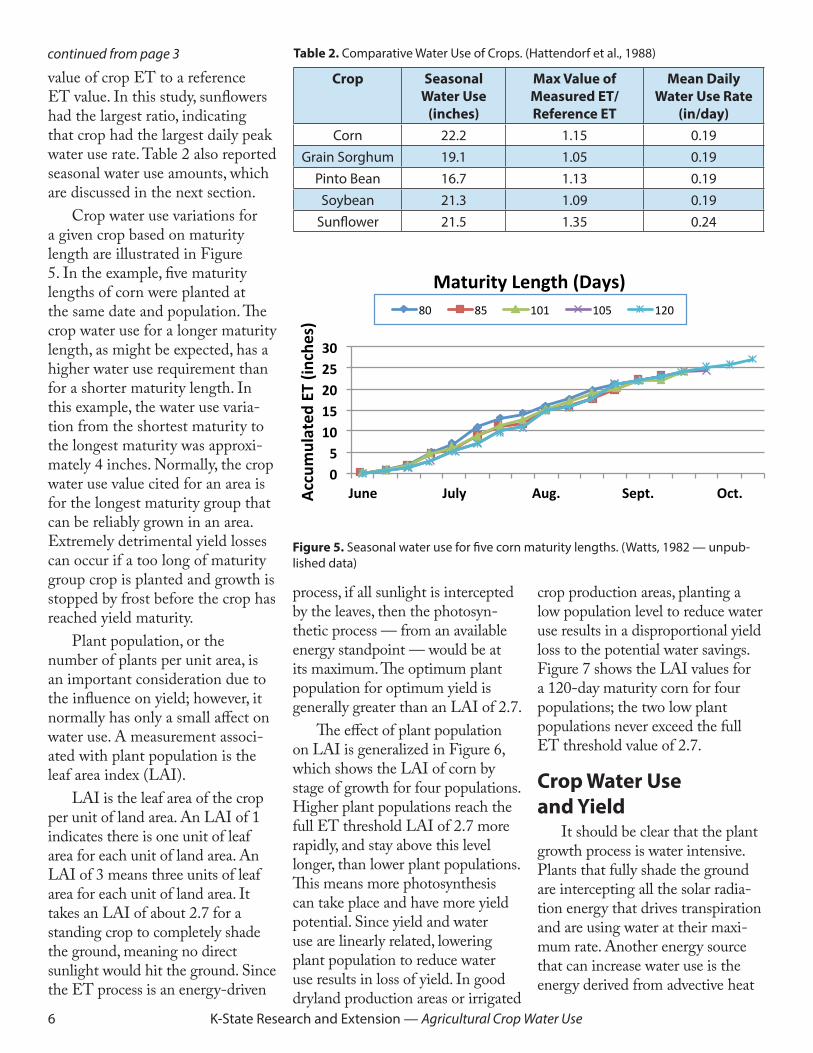
Crop water use variations for a given crop based on maturity length are illustrated in Figure 5. In the example, five maturity lengths of corn were planted at the same date and population. The crop water use for a longer maturity length, as might be expected, has a higher water use requirement than for a shorter maturity length. In this example, the water use varia-tion from the shortest maturity to the longest maturity was approxi-mately 4 inches. Normally, the crop water use value cited for an area is for the longest maturity group that can be reliably grown in an area. Extremely detrimental yield losses can occur if a too long of maturity group crop is planted and growth is stopped by frost before the crop has reached yield maturity.
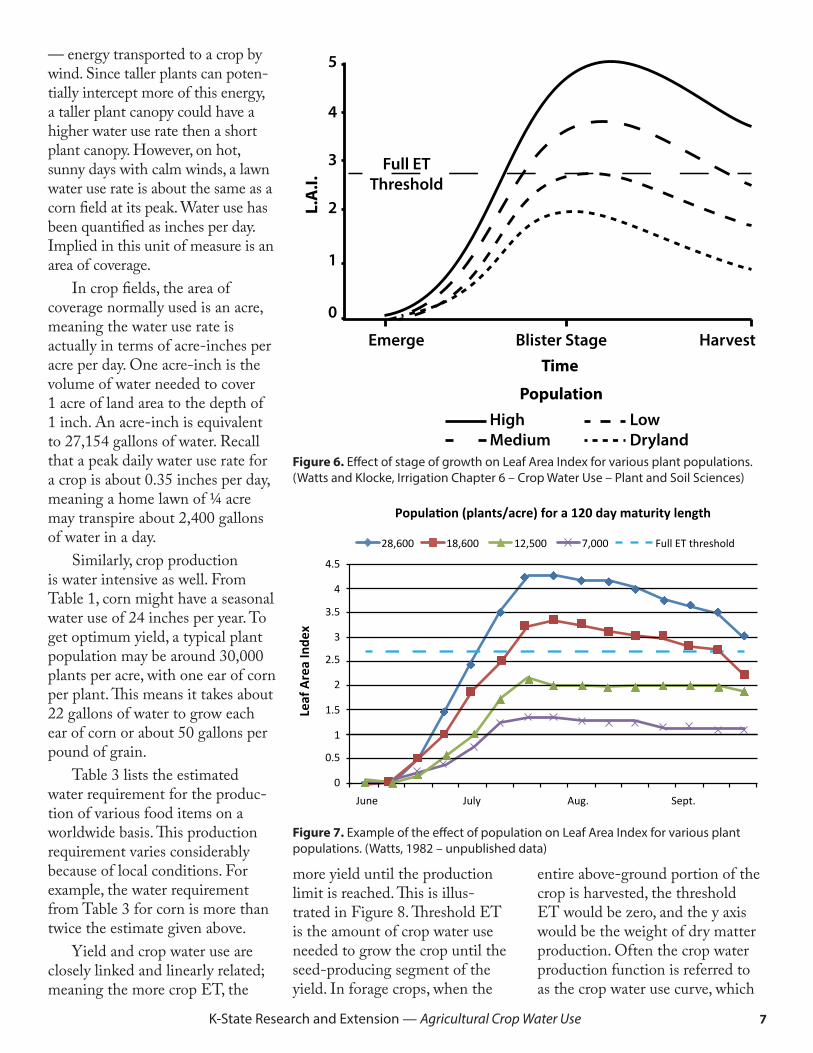
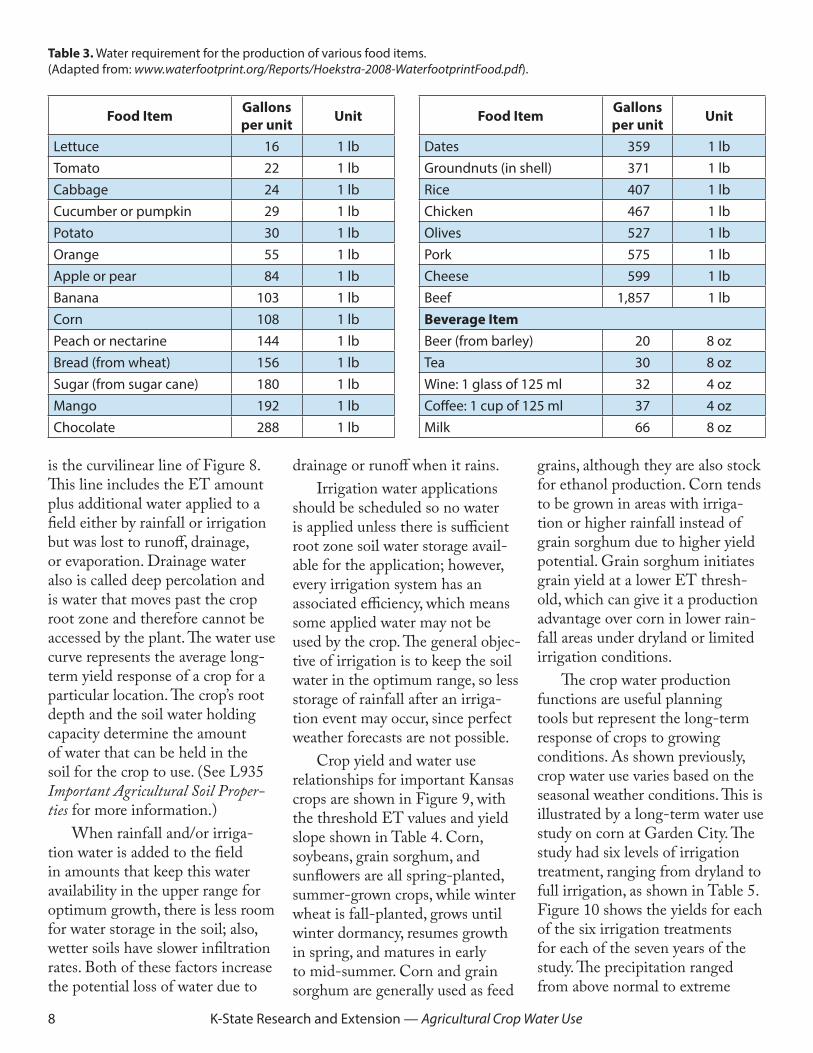
Plant population, or the number of plants per unit area, is an important consideration due to the influence on yield; however, it normally has only a small affect on water use. A measurement associ-ated with plant population is the leaf area index (LAI).
LAI is the leaf area of the crop per unit of land area. An LAI of 1 indicates there is one unit of leaf area for each unit of land area. An LAI of 3 means three units of leaf area for each unit of land area. It takes an LAI of about 2.7 for a standing crop to completely shade the ground, meaning no direct sunlight would hit the ground. Since the ET process is an energy-driven
process, if all sunlight is intercepted by the leaves, then the photosyn-thetic process — from an available energy standpoint — would be at its maximum. The optimum plant population for optimum yield is generally greater than an LAI of 2.7.
The effect of plant population on LAI is generalized in Figure 6, which shows the LAI of corn by stage of growth for four populations. Higher plant populations reach the full ET threshold LAI of 2.7 more rapidly, and stay above this level longer, than lower plant populations. This means more photosynthesis can take place and have more yield potential. Since yield and water use are linearly related, lowering plant population to reduce water use results in loss of yield. In good dryland production areas or irrigated
crop production areas, planting a low population level to reduce water use results in a disproportional yield loss to the potential water savings. Figure 7 shows the LAI values for a 120-day maturity corn for four populations; the two low plant populations never exceed the full ET threshold value of 2.7.
Crop Water Use and Yield
It should be clear that the plant growth process is water intensive. Plants that fully shade the ground are intercepting all the solar radia-tion energy that drives transpiration and are using water at their maxi-mum rate. Another energy source that can increase water use is the energy derived from advective heat
Table 2. Comparative Water Use of Crops. (Hattendorf et al., 1988)
Crop Seasonal Water Use
(inches)
Max Value of Measured ET/ Reference ET
Mean Daily Water Use Rate
(in/day)Corn 22.2 1.15 0.19
Grain Sorghum 19.1 1.05 0.19Pinto Bean 16.7 1.13 0.19
Soybean 21.3 1.09 0.19Sunflower 21.5 1.35 0.24
05
1015202530
June July Aug. Sept. Oct.Accu
mul
ated
ET
(inch
es)
Maturity Length (Days)80 85 101 105 120
Figure 5. Seasonal water use for five corn maturity lengths. (Watts, 1982 — unpub-lished data)
continued from page 3
K-State Research and Extension — Agricultural Crop Water Use 7
— energy transported to a crop by wind. Since taller plants can poten-tially intercept more of this energy, a taller plant canopy could have a higher water use rate then a short plant canopy. However, on hot, sunny days with calm winds, a lawn water use rate is about the same as a corn field at its peak. Water use has been quantified as inches per day. Implied in this unit of measure is an area of coverage.
In crop fields, the area of coverage normally used is an acre, meaning the water use rate is actually in terms of acre-inches per acre per day. One acre-inch is the volume of water needed to cover 1 acre of land area to the depth of 1 inch. An acre-inch is equivalent to 27,154 gallons of water. Recall that a peak daily water use rate for a crop is about 0.35 inches per day, meaning a home lawn of ¼ acre may transpire about 2,400 gallons of water in a day.
Similarly, crop production is water intensive as well. From Table 1, corn might have a seasonal water use of 24 inches per year. To get optimum yield, a typical plant population may be around 30,000 plants per acre, with one ear of corn per plant. This means it takes about 22 gallons of water to grow each ear of corn or about 50 gallons per pound of grain.
Table 3 lists the estimated water requirement for the produc-tion of various food items on a worldwide basis. This production requirement varies considerably because of local conditions. For example, the water requirement from Table 3 for corn is more than twice the estimate given above.
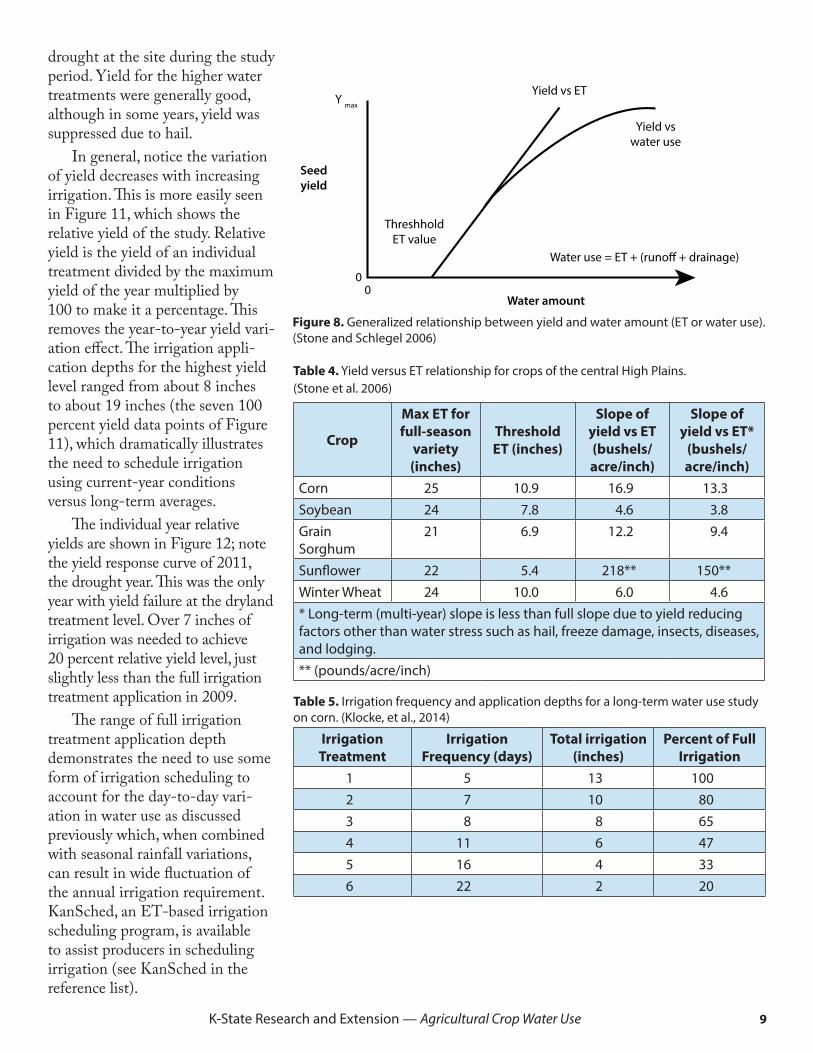
Yield and crop water use are closely linked and linearly related; meaning the more crop ET, the
entire above-ground portion of the crop is harvested, the threshold ET would be zero, and the y axis would be the weight of dry matter production. Often the crop water production function is referred to as the crop water use curve, which
Emerge
5
4
3
2
1
0
HighMedium
LowDryland
Blister StageTime
Full ETThreshold
Population
Harvest
L.A
.I.
0
0.5
1
1.5
2
2.5
3
3.5
4
4.5
June July Aug. Sept.
Population (plants/acre) for a 120 day maturity length
28,600 18,600 12,500 7,000 Full ET threshold
Leaf
Are
a In
dex
Figure 6. Effect of stage of growth on Leaf Area Index for various plant populations. (Watts and Klocke, Irrigation Chapter 6 – Crop Water Use – Plant and Soil Sciences)
Figure 7. Example of the effect of population on Leaf Area Index for various plant populations. (Watts, 1982 – unpublished data)
more yield until the production limit is reached. This is illus-trated in Figure 8. Threshold ET is the amount of crop water use needed to grow the crop until the seed-producing segment of the yield. In forage crops, when the
8 K-State Research and Extension — Agricultural Crop Water Use
is the curvilinear line of Figure 8. This line includes the ET amount plus additional water applied to a field either by rainfall or irrigation but was lost to runoff, drainage, or evaporation. Drainage water also is called deep percolation and is water that moves past the crop root zone and therefore cannot be accessed by the plant. The water use curve represents the average long-term yield response of a crop for a particular location. The crop’s root depth and the soil water holding capacity determine the amount of water that can be held in the soil for the crop to use. (See L935 Important Agricultural Soil Proper-ties for more information.)
When rainfall and/or irriga-tion water is added to the field in amounts that keep this water availability in the upper range for optimum growth, there is less room for water storage in the soil; also, wetter soils have slower infiltration rates. Both of these factors increase the potential loss of water due to
Food Item Gallons per unit Unit
Lettuce 16 1 lbTomato 22 1 lbCabbage 24 1 lbCucumber or pumpkin 29 1 lbPotato 30 1 lbOrange 55 1 lbApple or pear 84 1 lbBanana 103 1 lbCorn 108 1 lbPeach or nectarine 144 1 lbBread (from wheat) 156 1 lbSugar (from sugar cane) 180 1 lbMango 192 1 lbChocolate 288 1 lb
Food Item Gallons per unit Unit
Dates 359 1 lbGroundnuts (in shell) 371 1 lbRice 407 1 lbChicken 467 1 lbOlives 527 1 lbPork 575 1 lbCheese 599 1 lbBeef 1,857 1 lbBeverage ItemBeer (from barley) 20 8 ozTea 30 8 ozWine: 1 glass of 125 ml 32 4 ozCoffee: 1 cup of 125 ml 37 4 ozMilk 66 8 oz
drainage or runoff when it rains. Irrigation water applications
should be scheduled so no water is applied unless there is sufficient root zone soil water storage avail-able for the application; however, every irrigation system has an associated efficiency, which means some applied water may not be used by the crop. The general objec-tive of irrigation is to keep the soil water in the optimum range, so less storage of rainfall after an irriga-tion event may occur, since perfect weather forecasts are not possible.
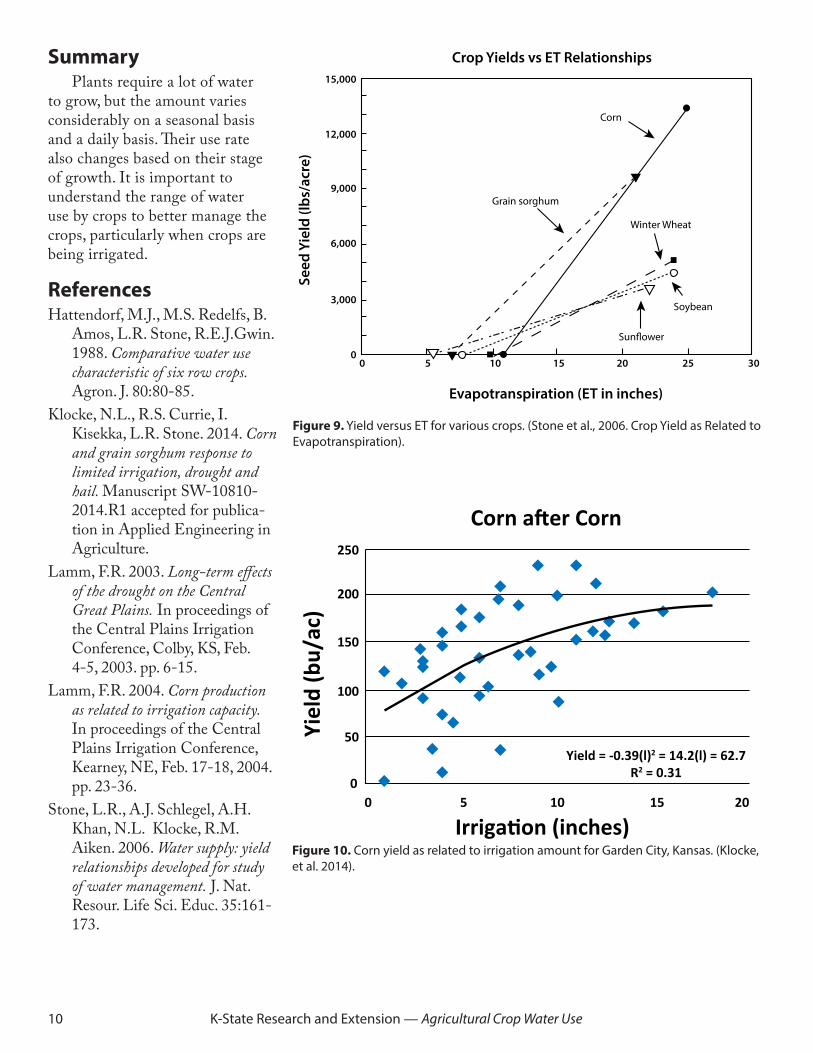
Crop yield and water use relationships for important Kansas crops are shown in Figure 9, with the threshold ET values and yield slope shown in Table 4. Corn, soybeans, grain sorghum, and sunflowers are all spring-planted, summer-grown crops, while winter wheat is fall-planted, grows until winter dormancy, resumes growth in spring, and matures in early to mid-summer. Corn and grain sorghum are generally used as feed
grains, although they are also stock for ethanol production. Corn tends to be grown in areas with irriga-tion or higher rainfall instead of grain sorghum due to higher yield potential. Grain sorghum initiates grain yield at a lower ET thresh-old, which can give it a production advantage over corn in lower rain-fall areas under dryland or limited irrigation conditions.
The crop water production functions are useful planning tools but represent the long-term response of crops to growing conditions. As shown previously, crop water use varies based on the seasonal weather conditions. This is illustrated by a long-term water use study on corn at Garden City. The study had six levels of irrigation treatment, ranging from dryland to full irrigation, as shown in Table 5. Figure 10 shows the yields for each of the six irrigation treatments for each of the seven years of the study. The precipitation ranged from above normal to extreme
Table 3. Water requirement for the production of various food items. (Adapted from: www.waterfootprint.org/Reports/Hoekstra-2008-WaterfootprintFood.pdf).
K-State Research and Extension — Agricultural Crop Water Use 9
Seed yield
Water amount
Yield vswater use
Yield vs ET
Threshhold ET value
00
Water use = ET + (runo� + drainage)
Y max
Figure 8. Generalized relationship between yield and water amount (ET or water use). (Stone and Schlegel 2006)
Table 4. Yield versus ET relationship for crops of the central High Plains. (Stone et al. 2006)
Crop
Max ET for full-season
variety (inches)
Threshold ET (inches)
Slope of yield vs ET (bushels/acre/inch)
Slope of yield vs ET*
(bushels/acre/inch)
Corn 25 10.9 16.9 13.3Soybean 24 7.8 4.6 3.8Grain Sorghum
21 6.9 12.2 9.4
Sunflower 22 5.4 218** 150**Winter Wheat 24 10.0 6.0 4.6* Long-term (multi-year) slope is less than full slope due to yield reducing factors other than water stress such as hail, freeze damage, insects, diseases, and lodging. ** (pounds/acre/inch)
drought at the site during the study period. Yield for the higher water treatments were generally good, although in some years, yield was suppressed due to hail.
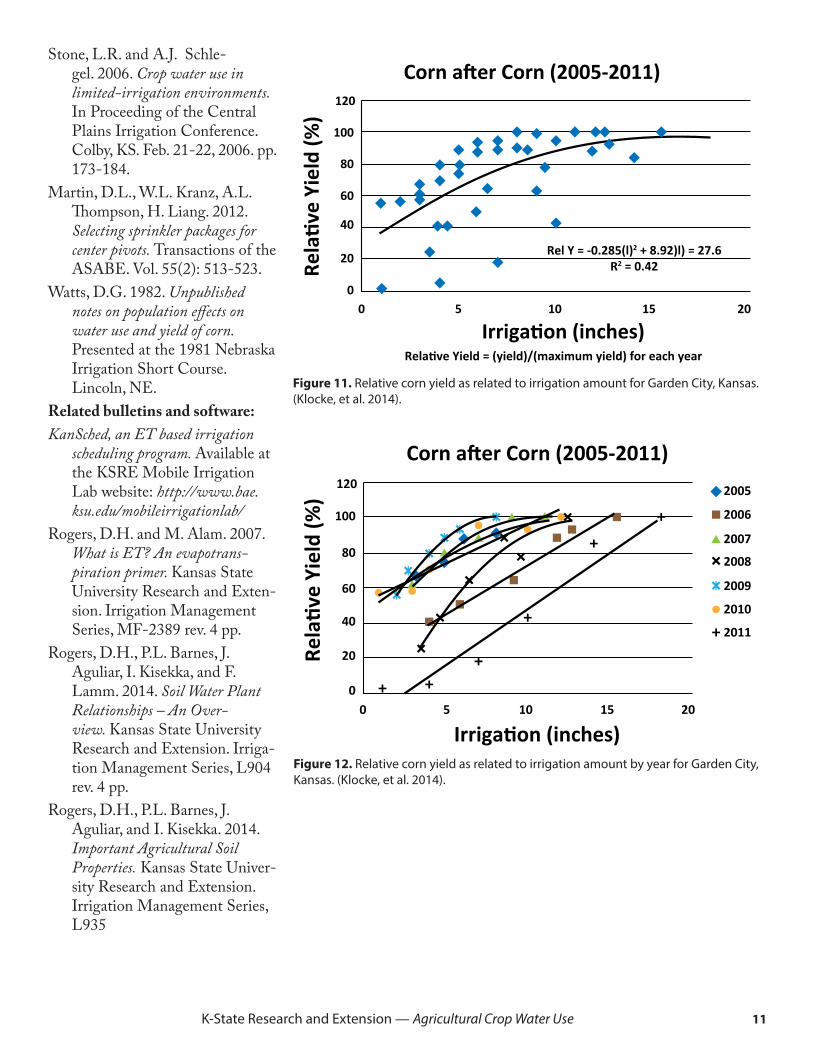
In general, notice the variation of yield decreases with increasing irrigation. This is more easily seen in Figure 11, which shows the relative yield of the study. Relative yield is the yield of an individual treatment divided by the maximum yield of the year multiplied by 100 to make it a percentage. This removes the year-to-year yield vari-ation effect. The irrigation appli-cation depths for the highest yield level ranged from about 8 inches to about 19 inches (the seven 100 percent yield data points of Figure 11), which dramatically illustrates the need to schedule irrigation using current-year conditions versus long-term averages.
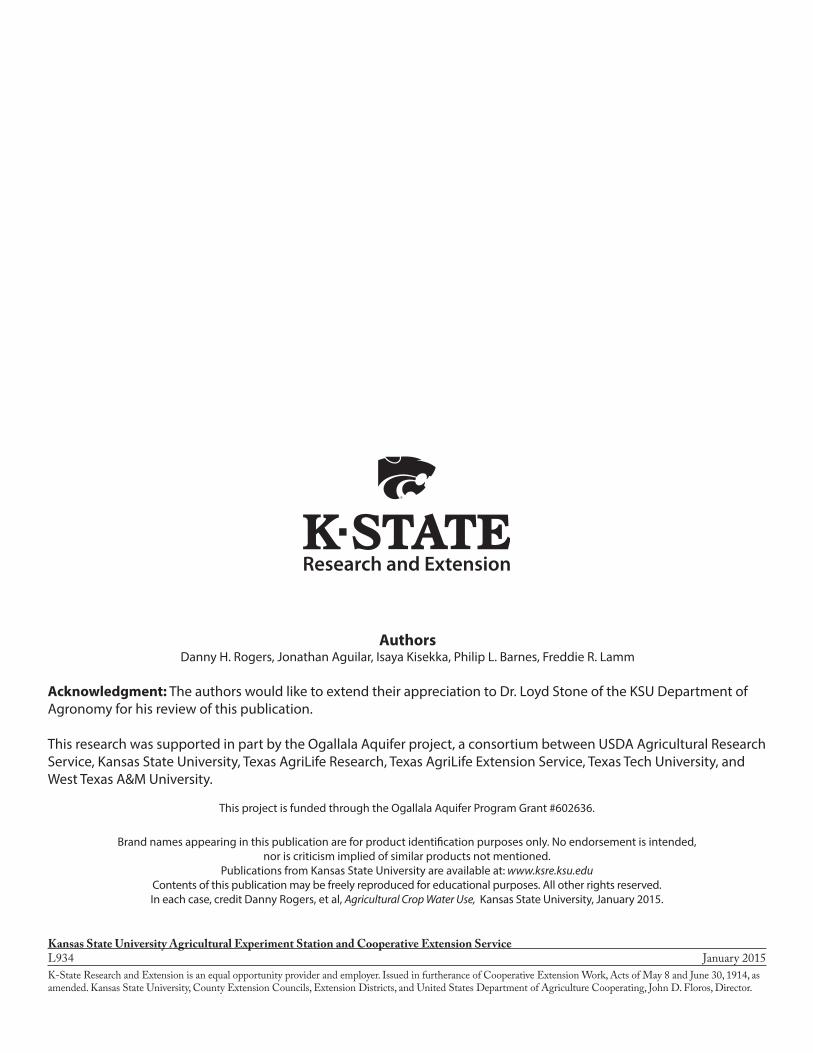
The individual year relative yields are shown in Figure 12; note the yield response curve of 2011, the drought year. This was the only year with yield failure at the dryland treatment level. Over 7 inches of irrigation was needed to achieve 20 percent relative yield level, just slightly less than the full irrigation treatment application in 2009.
The range of full irrigation treatment application depth demonstrates the need to use some form of irrigation scheduling to account for the day-to-day vari-ation in water use as discussed previously which, when combined with seasonal rainfall variations, can result in wide fluctuation of the annual irrigation requirement. KanSched, an ET-based irrigation scheduling program, is available to assist producers in scheduling irrigation (see KanSched in the reference list).
Table 5. Irrigation frequency and application depths for a long-term water use study on corn. (Klocke, et al., 2014)
Irrigation Treatment
Irrigation Frequency (days)
Total irrigation (inches)
Percent of Full Irrigation
1 5 13 1002 7 10 803 8 8 654 11 6 475 16 4 33
6 22 2 20
10 K-State Research and Extension — Agricultural Crop Water Use
Figure 9. Yield versus ET for various crops. (Stone et al., 2006. Crop Yield as Related to Evapotranspiration).
Crop Yields vs ET Relationships
Evapotranspiration (ET in inches)
15,000
Grain sorghum
Corn
Winter Wheat
Soybean
Sun�ower
12,000
9,000
6,000
3,000
00 5 10 15 20 25 30
Seed
Yie
ld (l
bs/a
cre)
Figure 10. Corn yield as related to irrigation amount for Garden City, Kansas. (Klocke, et al. 2014).
Yiel
d (b
u/ac
)
Corn after Corn
Irrigation (inches)
250
200
150
100
50
02015
Yield = -0.39(l)2 = 14.2(l) = 62.7R2 = 0.31
1050
Summary Plants require a lot of water
to grow, but the amount varies considerably on a seasonal basis and a daily basis. Their use rate also changes based on their stage of growth. It is important to understand the range of water use by crops to better manage the crops, particularly when crops are being irrigated.
ReferencesHattendorf, M.J., M.S. Redelfs, B.
Amos, L.R. Stone, R.E.J.Gwin. 1988. Comparative water use characteristic of six row crops. Agron. J. 80:80-85.
Klocke, N.L., R.S. Currie, I. Kisekka, L.R. Stone. 2014. Corn and grain sorghum response to limited irrigation, drought and hail. Manuscript SW-10810-2014.R1 accepted for publica-tion in Applied Engineering in Agriculture.
Lamm, F.R. 2003. Long-term effects of the drought on the Central Great Plains. In proceedings of the Central Plains Irrigation Conference, Colby, KS, Feb. 4-5, 2003. pp. 6-15.
Lamm, F.R. 2004. Corn production as related to irrigation capacity. In proceedings of the Central Plains Irrigation Conference, Kearney, NE, Feb. 17-18, 2004. pp. 23-36.
Stone, L.R., A.J. Schlegel, A.H. Khan, N.L. Klocke, R.M. Aiken. 2006. Water supply: yield relationships developed for study of water management. J. Nat. Resour. Life Sci. Educ. 35:161-173.
K-State Research and Extension — Agricultural Crop Water Use 11
Figure 11. Relative corn yield as related to irrigation amount for Garden City, Kansas. (Klocke, et al. 2014).
Figure 12. Relative corn yield as related to irrigation amount by year for Garden City, Kansas. (Klocke, et al. 2014).
Rela
tive
Yiel
d (%
)
Corn after Corn (2005-2011)
Irrigation (inches)
120
100
80
60
40
20
00 5
Rel Y = -0.285(l)2 + 8.92)l) = 27.6R2 = 0.42
Relative Yield = (yield)/(maximum yield) for each year
10 15 20Re
lativ
e Yi
eld
(%)
Corn after Corn (2005-2011)
Irrigation (inches)
120
100
80
60
40
20
020
2005
2006
2007
2008
2009
2010
2011
151050
Relative Yield = (yield)/(maxmium yield) for each year
Stone, L.R. and A.J. Schle-gel. 2006. Crop water use in limited-irrigation environments. In Proceeding of the Central Plains Irrigation Conference. Colby, KS. Feb. 21-22, 2006. pp. 173-184.
Martin, D.L., W.L. Kranz, A.L. Thompson, H. Liang. 2012. Selecting sprinkler packages for center pivots. Transactions of the ASABE. Vol. 55(2): 513-523.
Watts, D.G. 1982. Unpublished notes on population effects on water use and yield of corn. Presented at the 1981 Nebraska Irrigation Short Course. Lincoln, NE.
Related bulletins and software:KanSched, an ET based irrigation
scheduling program. Available at the KSRE Mobile Irrigation Lab website: http://www.bae.ksu.edu/mobileirrigationlab/
Rogers, D.H. and M. Alam. 2007. What is ET? An evapotrans-piration primer. Kansas State University Research and Exten-sion. Irrigation Management Series, MF-2389 rev. 4 pp.
Rogers, D.H., P.L. Barnes, J. Aguliar, I. Kisekka, and F. Lamm. 2014. Soil Water Plant Relationships – An Over-view. Kansas State University Research and Extension. Irriga-tion Management Series, L904 rev. 4 pp.
Rogers, D.H., P.L. Barnes, J. Aguliar, and I. Kisekka. 2014. Important Agricultural Soil Properties. Kansas State Univer-sity Research and Extension. Irrigation Management Series, L935
Brand names appearing in this publication are for product identification purposes only. No endorsement is intended, nor is criticism implied of similar products not mentioned.
Publications from Kansas State University are available at: www.ksre.ksu.eduContents of this publication may be freely reproduced for educational purposes. All other rights reserved. In each case, credit Danny Rogers, et al, Agricultural Crop Water Use, Kansas State University, January 2015.
Kansas State University Agricultural Experiment Station and Cooperative Extension ServiceL934 January 2015K-State Research and Extension is an equal opportunity provider and employer. Issued in furtherance of Cooperative Extension Work, Acts of May 8 and June 30, 1914, as amended. Kansas State University, County Extension Councils, Extension Districts, and United States Department of Agriculture Cooperating, John D. Floros, Director.
Authors Danny H. Rogers, Jonathan Aguilar, Isaya Kisekka, Philip L. Barnes, Freddie R. Lamm
This project is funded through the Ogallala Aquifer Program Grant #602636.
Acknowledgment: The authors would like to extend their appreciation to Dr. Loyd Stone of the KSU Department of Agronomy for his review of this publication.
This research was supported in part by the Ogallala Aquifer project, a consortium between USDA Agricultural Research Service, Kansas State University, Texas AgriLife Research, Texas AgriLife Extension Service, Texas Tech University, and West Texas A&M University.