Embed Size (px)
Citation preview
L5: Infrared Astronomy
NORDFORSK summer schoolNordic Optical Telescope
30.06.2006Anlaug Amanda Djupvik
Outline of lecture● The IR sky ●
● IR instrumentation and detectors●
● IR observing techniques●
● Preparing observations with NOTCam●
● Data reduction
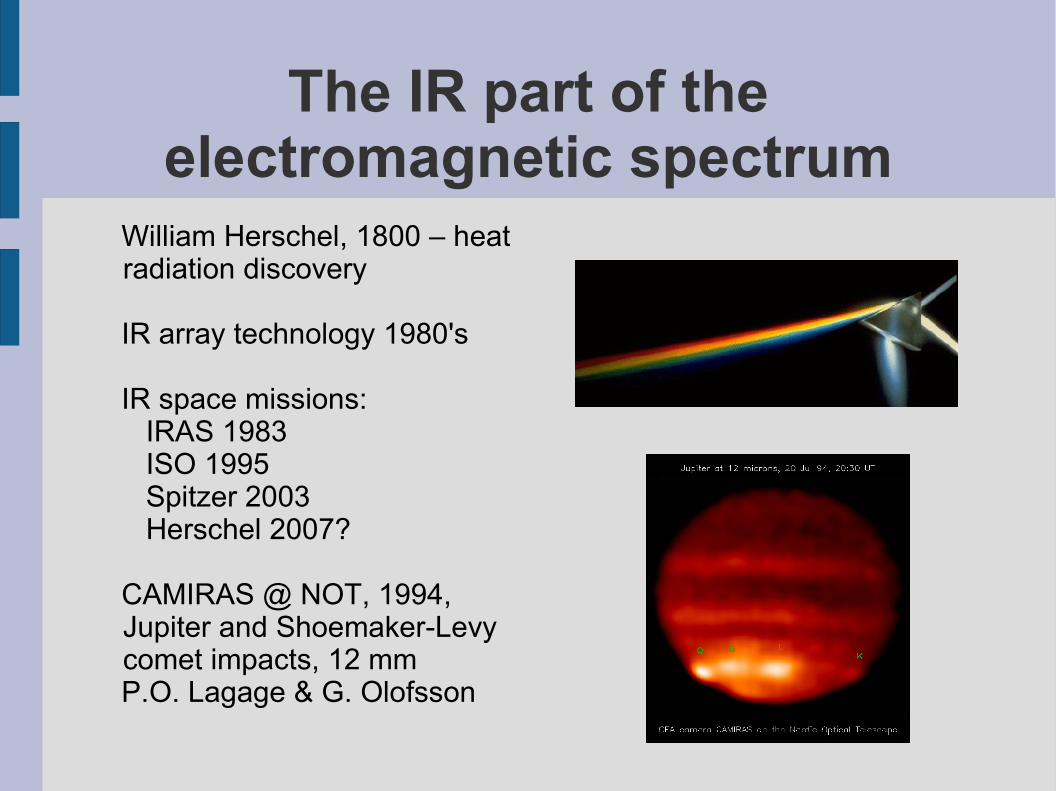
The IR part of the electromagnetic spectrum
William Herschel, 1800 – heat radiation discovery
IR array technology 1980's
IR space missions: IRAS 1983 ISO 1995 Spitzer 2003 Herschel 2007?
CAMIRAS @ NOT, 1994, Jupiter and Shoemaker-Levy comet impacts, 12 mm
P.O. Lagage & G. Olofsson
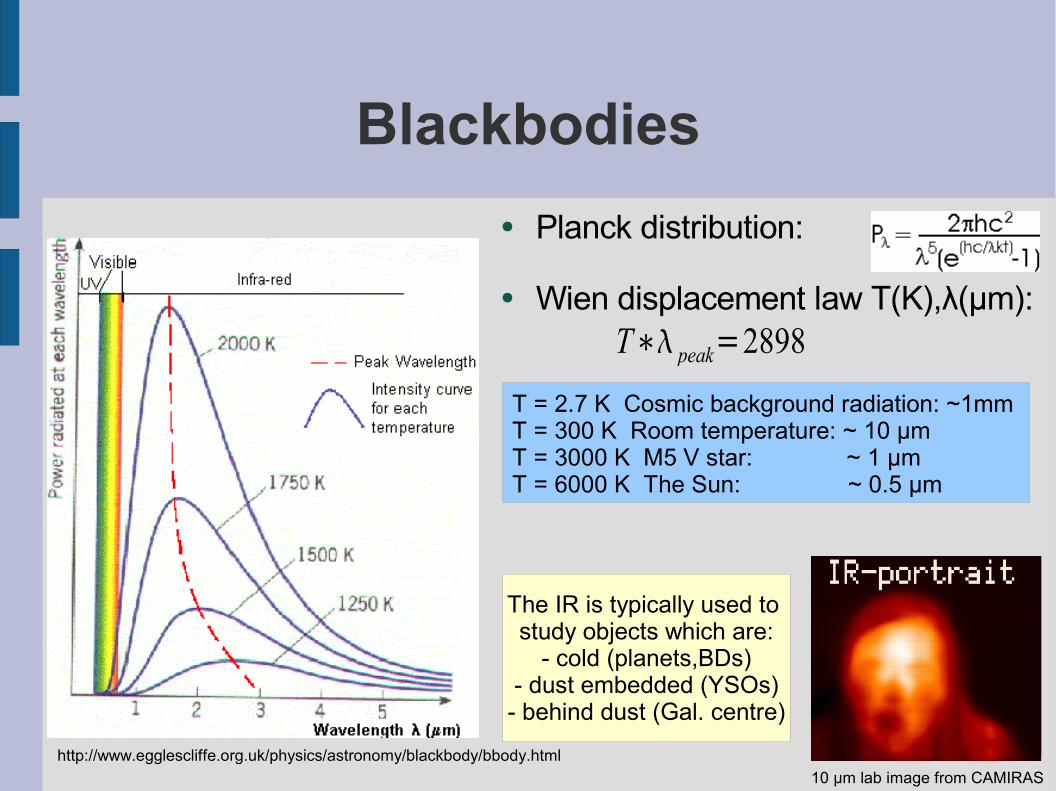
Blackbodies● Planck distribution:
● Wien displacement law T(K),λ(μm):
T∗ peak=2898T = 2.7 K Cosmic background radiation: ~1mmT = 300 K Room temperature: ~ 10 μmT = 3000 K M5 V star: ~ 1 μmT = 6000 K The Sun: ~ 0.5 μm
10 μm lab image from CAMIRAS
The IR is typically used to study objects which are:
- cold (planets,BDs)- dust embedded (YSOs)
- behind dust (Gal. centre)
http://www.egglescliffe.org.uk/physics/astronomy/blackbody/bbody.html
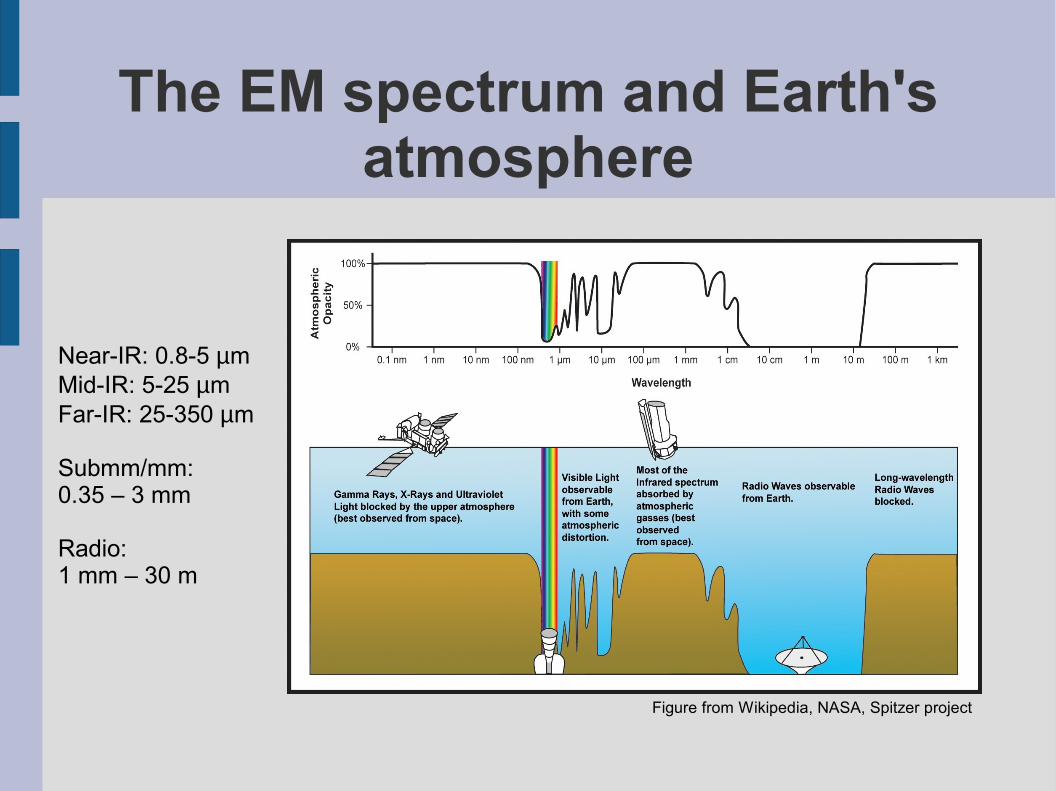
The EM spectrum and Earth's atmosphere
Near-IR: 0.8-5 µmMid-IR: 5-25 µmFar-IR: 25-350 µm
Submm/mm:0.35 – 3 mm
Radio:1 mm – 30 m
Figure from Wikipedia, NASA, Spitzer project
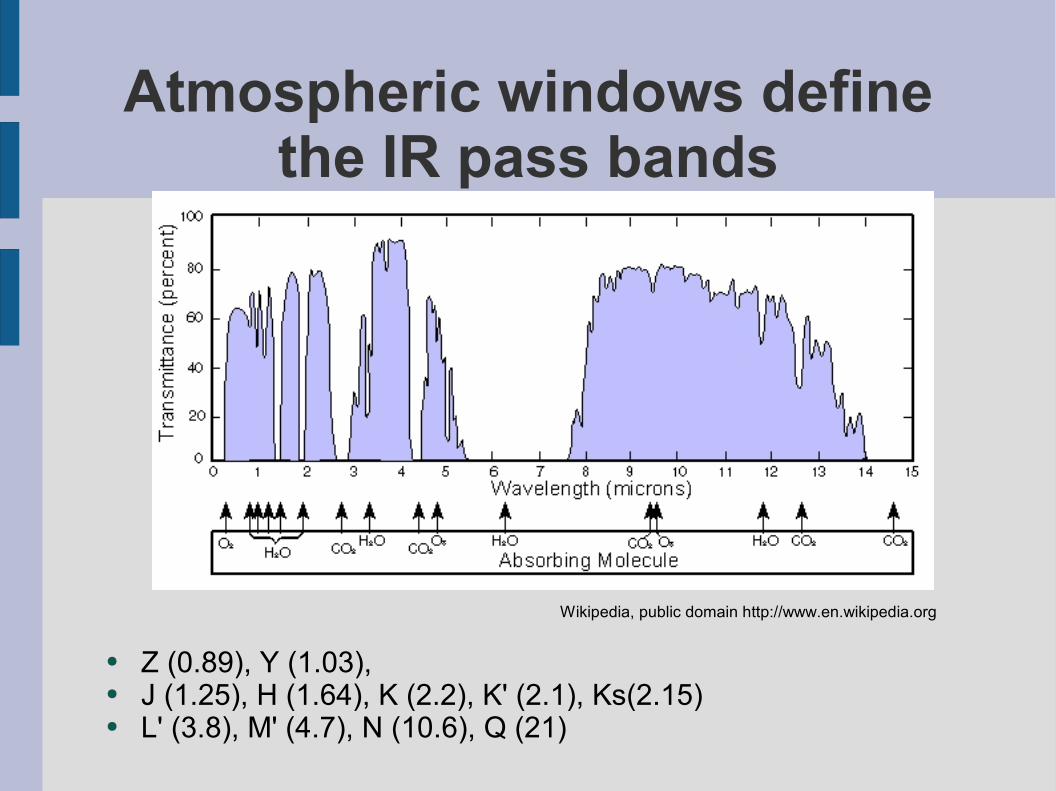
Atmospheric windows define the IR pass bands
● Z (0.89), Y (1.03),● J (1.25), H (1.64), K (2.2), K' (2.1), Ks(2.15)● L' (3.8), M' (4.7), N (10.6), Q (21)
Wikipedia, public domain http://www.en.wikipedia.org
Atmospheric extinction● extinction = absorption + scattering
● d << λ : Rayleigh scattering ~ ● d ~ λ : Mie scattering (aerosols: sea salt, dust)
● many atomic & molecular line transitions > absorption
– gases in our atmosphere: N2, O2, Ar, CO2, Ne, He, CH4, Kr, H2, N2O, CO, H2O, O3
– absorption dominated by: H2O and CO2– Water vapor column density, expressed as
“precipitable water in mm”, varies from 1-15 mm
−4 (molecules)
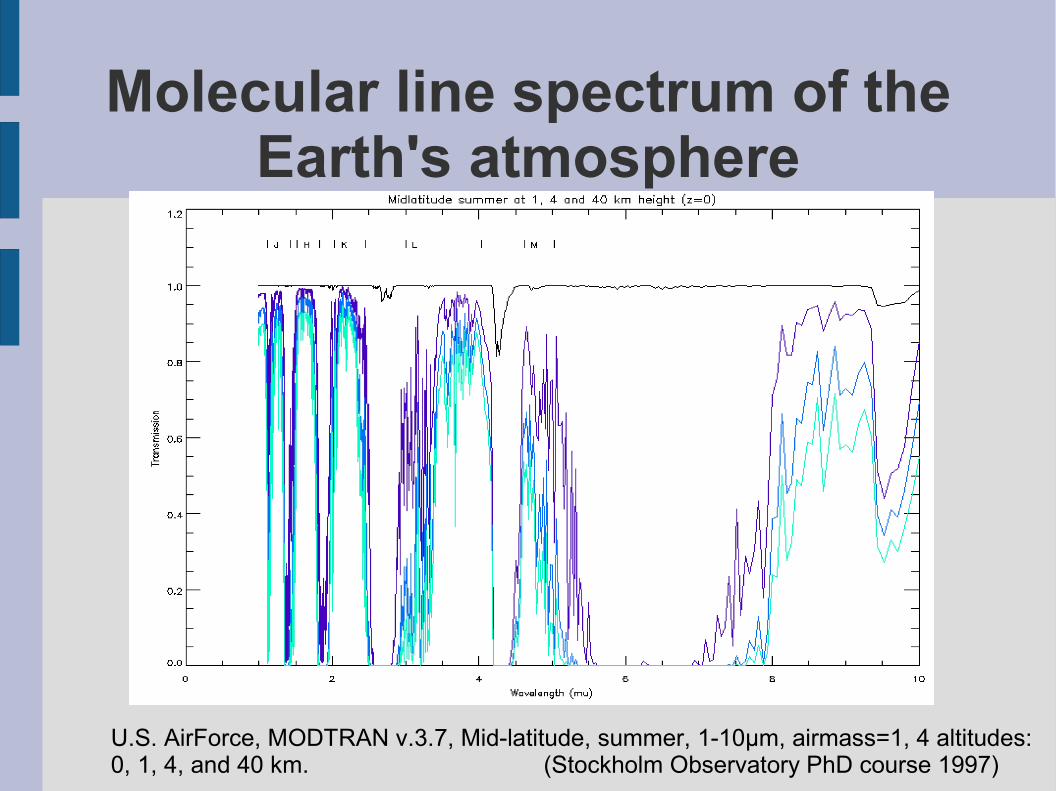
Molecular line spectrum of the Earth's atmosphere
U.S. AirForce, MODTRAN v.3.7, Mid-latitude, summer, 1-10µm, airmass=1, 4 altitudes:0, 1, 4, and 40 km. (Stockholm Observatory PhD course 1997)
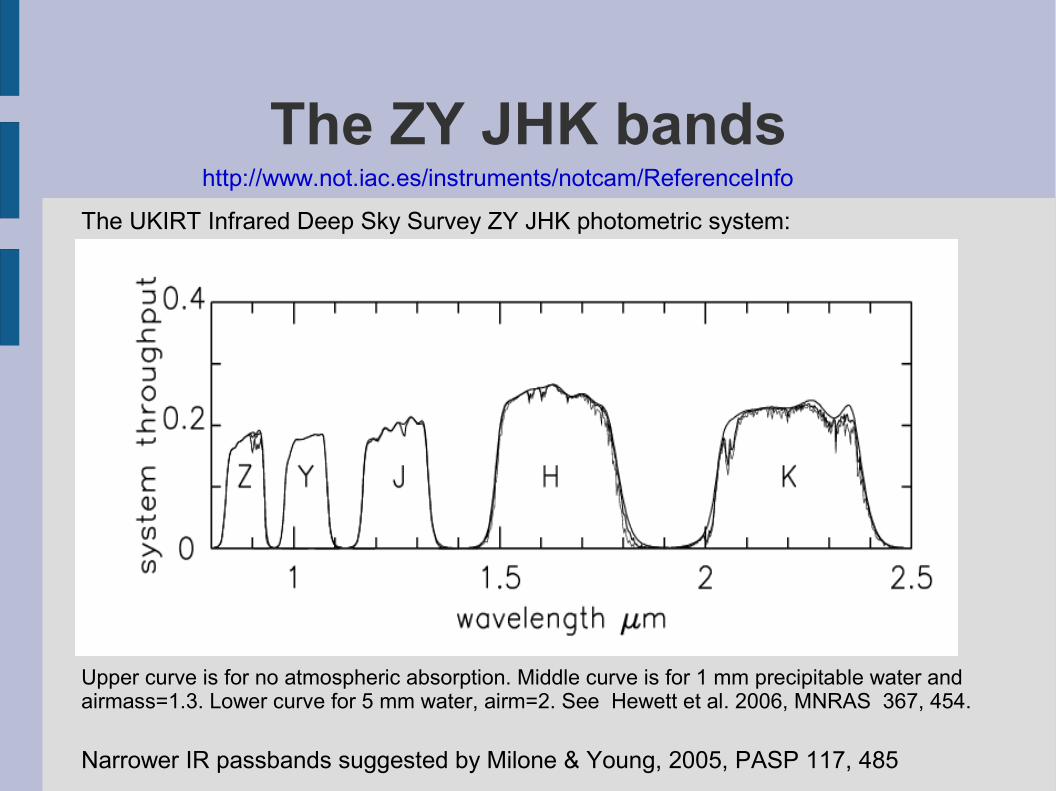
The ZY JHK bandsThe UKIRT Infrared Deep Sky Survey ZY JHK photometric system:
Narrower IR passbands suggested by Milone & Young, 2005, PASP 117, 485
Upper curve is for no atmospheric absorption. Middle curve is for 1 mm precipitable water andairmass=1.3. Lower curve for 5 mm water, airm=2. See Hewett et al. 2006, MNRAS 367, 454.
http://www.not.iac.es/instruments/notcam/ReferenceInfo
Terrestrial background radiation at night time
● at λ > 2.3 µm thermal radiationthermal radiation dominates (telescope and atmosphere) terrestrial sources @ 300K λ ∼ 10 µm
● Scattered light from moon, dominates for Z and Y bands
● Airglow: OH lines, H + O3 -> OH + O2 alt=85-100km, varies 10-50% over 5-15 min, -dominates J and H band background -lines blend together for R < 600
● Sky (mag/sq “): J=15.5, H=13.8, Ks=12.9
Good IR observing sites – dry, cold and “high up”
● Cooled telescopes in space, balloons
● Dome C, Antartica (T=-60C,alt=2800m, water vapor from 0.1 to 0.3 mm !)
● Atacama desert (ALMA): < 1.6 mm for 75% of time and < 1 mm for 50%
● Hawaii (UKIRT, JCMT, Keck): < 1.7 mm for 25% of time, < 2.9 mm for 50%
● La Palma, GTC site testing: < 3 mm for 39% of nights, < 1 mm for 10%
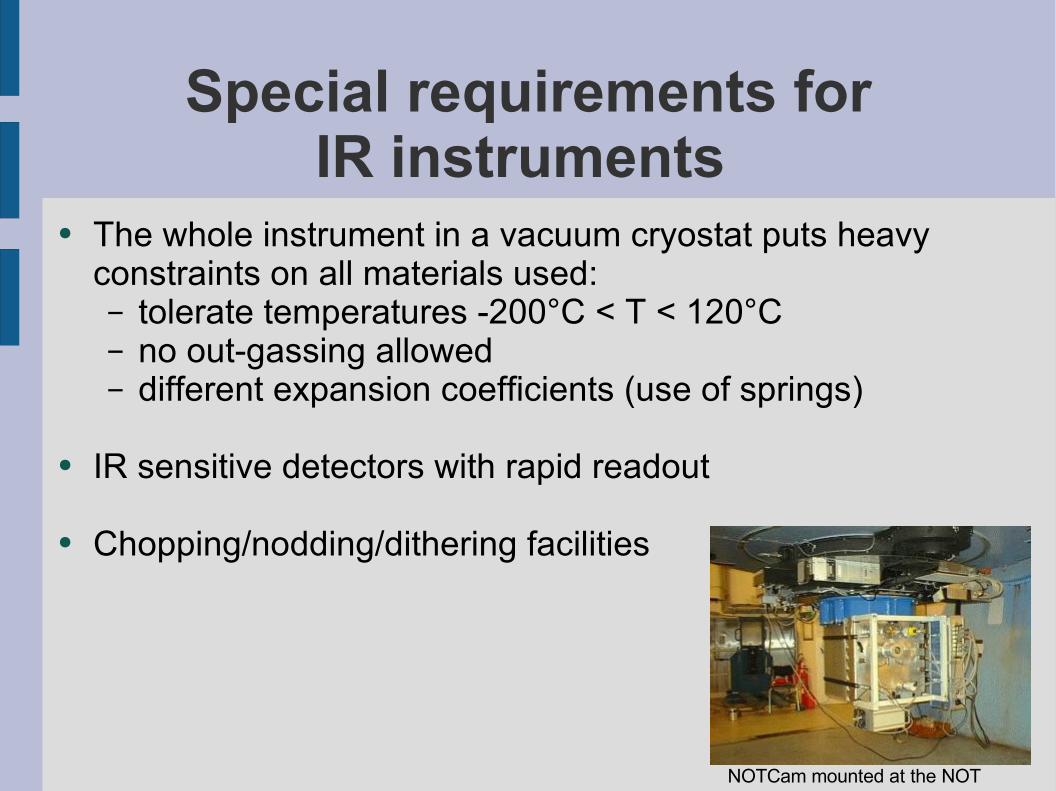
Special requirements forIR instruments
● The whole instrument in a vacuum cryostat puts heavy constraints on all materials used: – tolerate temperatures -200°C < T < 120°C – no out-gassing allowed – different expansion coefficients (use of springs)
● IR sensitive detectors with rapid readout
● Chopping/nodding/dithering facilities
NOTCam mounted at the NOT
NOTCam● SWIR: 1-2.5 µm● 1024 x1024 x 18µm pix HgCdTe array, QE ~ 60%● Cameras: WF (4.1'x4.1'), HR (82”x82”), pupil imager ●
● It has a shutter operating at -200°C● Two filter wheels: 30 filters mounted● Grism wheel: grism + focus pyramid● Stop wheel: aperture stops, hartmann masks● Aperture wheel: pinholes, slits, masks● Cooling with a 16 litre LN2 tank + PTR (-199°C = 74K)● Minimum thermal cycle time: ~ 10 days
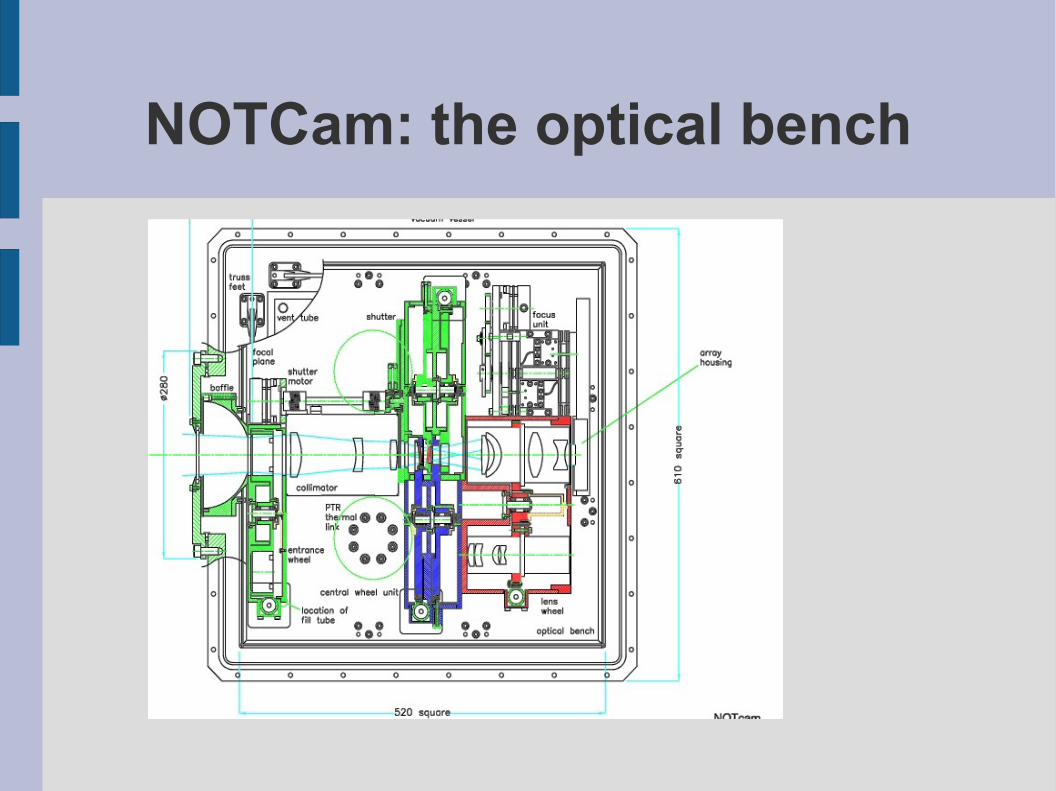
NOTCam: the optical bench
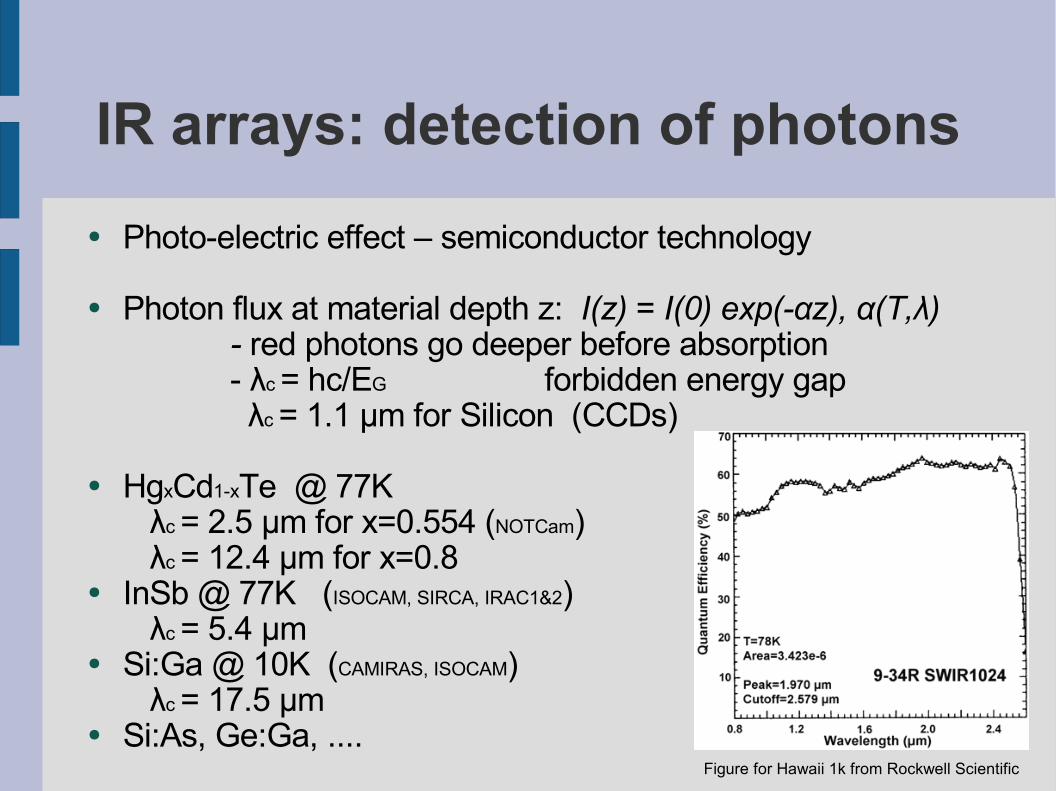
IR arrays: detection of photons● Photo-electric effect – semiconductor technology
● Photon flux at material depth z: I(z) = I(0) exp(-αz), α(T,λ)
- red photons go deeper before absorption - λc = hc/EG forbidden energy gap λc = 1.1 μm for Silicon (CCDs)
● HgxCd1-xTe @ 77K λc = 2.5 μm for x=0.554 (NOTCam) λc = 12.4 μm for x=0.8
● InSb @ 77K (ISOCAM, SIRCA, IRAC1&2) λc = 5.4 μm
● Si:Ga @ 10K (CAMIRAS, ISOCAM) λc = 17.5 μm
● Si:As, Ge:Ga, ....Figure for Hawaii 1k from Rockwell Scientific
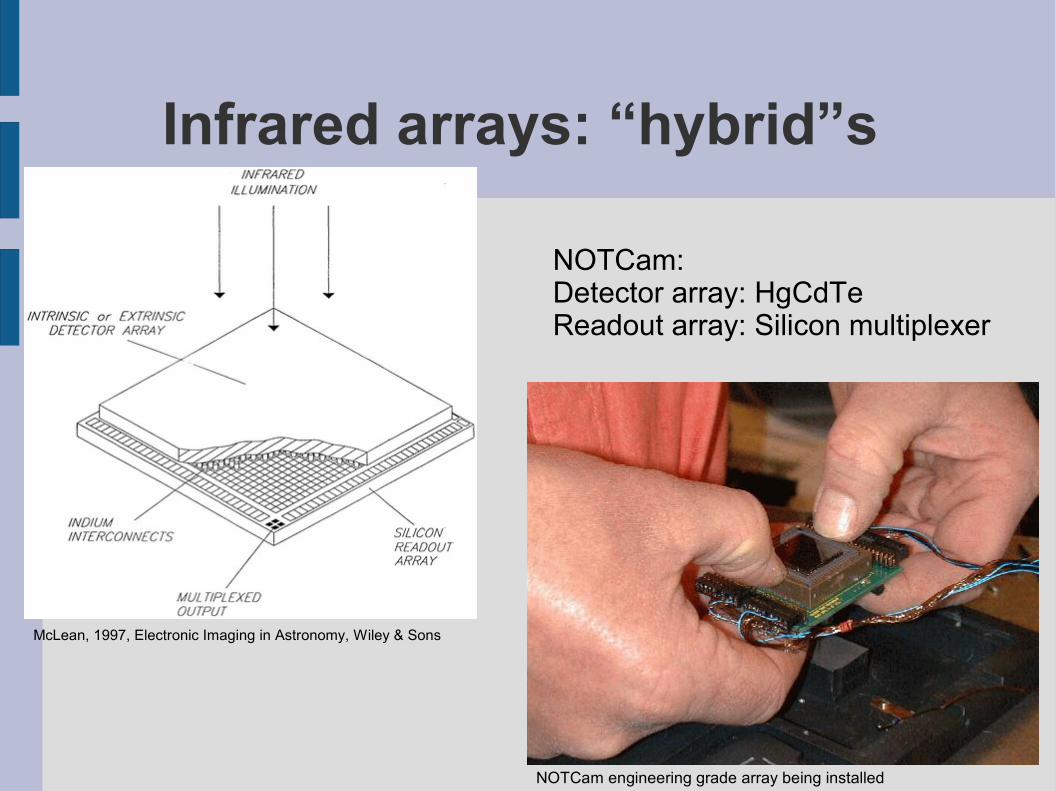
Infrared arrays: “hybrid”s
McLean, 1997, Electronic Imaging in Astronomy, Wiley & Sons
NOTCam engineering grade array being installed
NOTCam:Detector array: HgCdTeReadout array: Silicon multiplexer
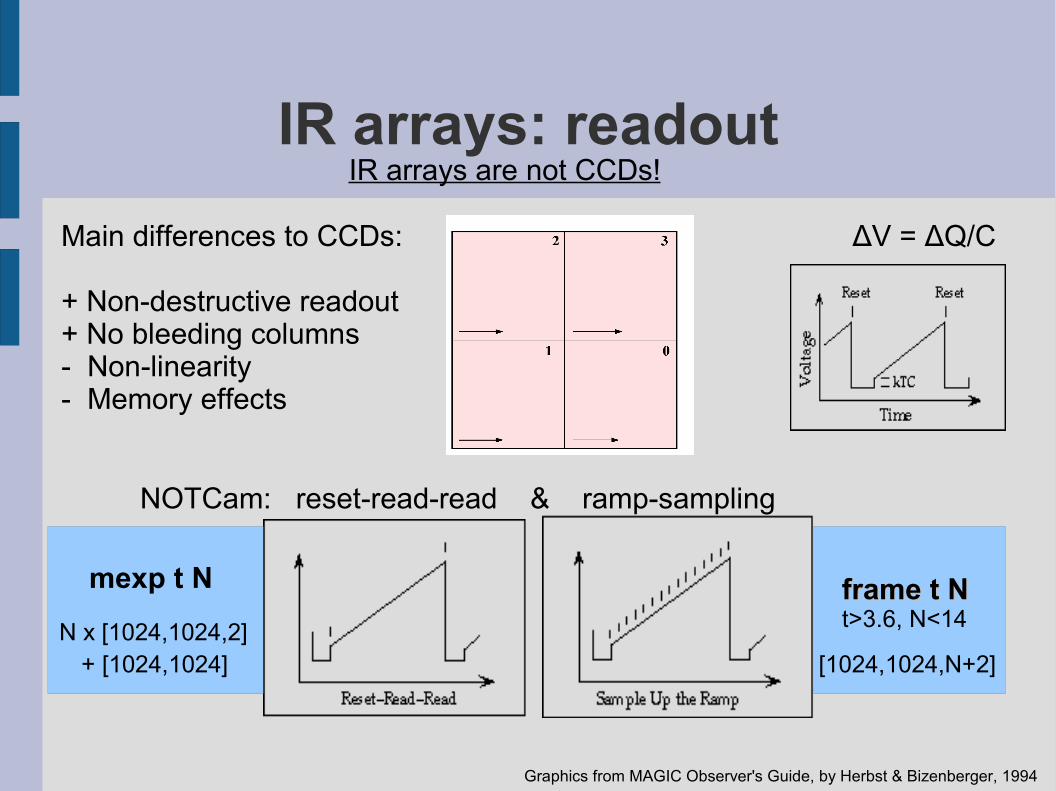
IR arrays: readout
ΔV = ΔQ/C
IR arrays are not CCDs!
Main differences to CCDs:
+ Non-destructive readout+ No bleeding columns- Non-linearity- Memory effects
Graphics from MAGIC Observer's Guide, by Herbst & Bizenberger, 1994
NOTCam: reset-read-read & ramp-sampling
frame t Nframe t Nt>3.6, N<14
mexp t N
[1024,1024,N+2]N x [1024,1024,2]
+ [1024,1024]
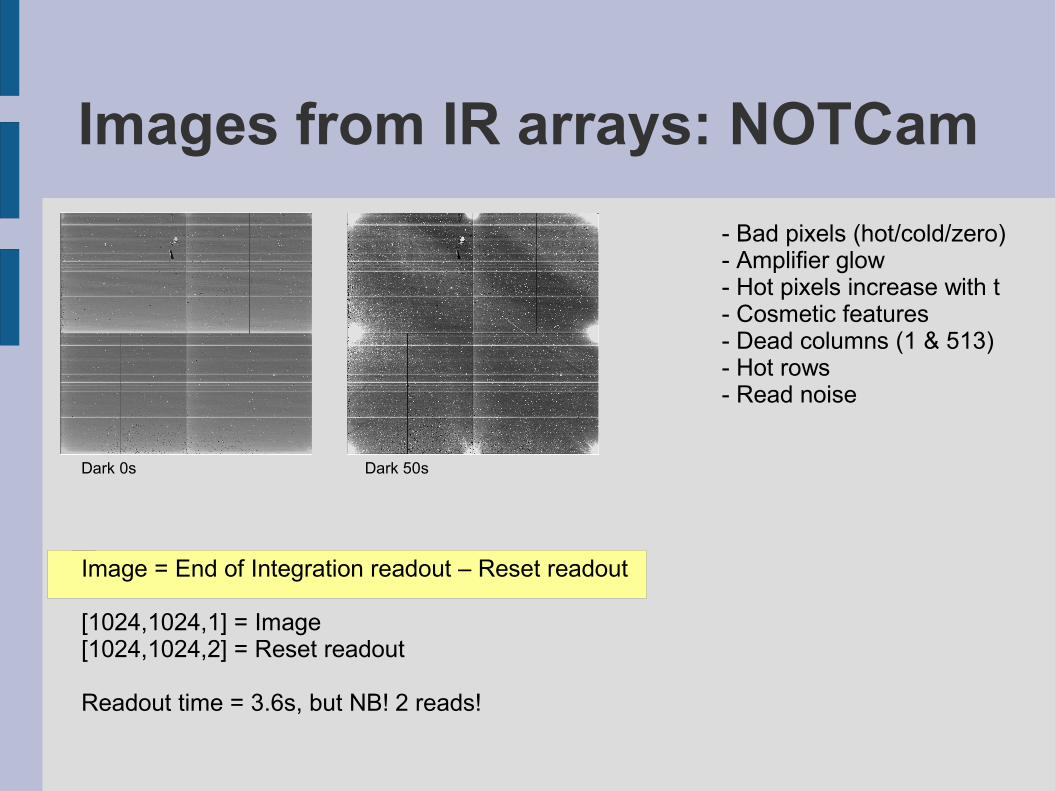
Images from IR arrays: NOTCam
Dark 0s Dark 50s
Image = End of Integration readout – Reset readout
[1024,1024,1] = Image[1024,1024,2] = Reset readout
Readout time = 3.6s, but NB! 2 reads!
- Bad pixels (hot/cold/zero)- Amplifier glow- Hot pixels increase with t- Cosmetic features- Dead columns (1 & 513)- Hot rows- Read noise
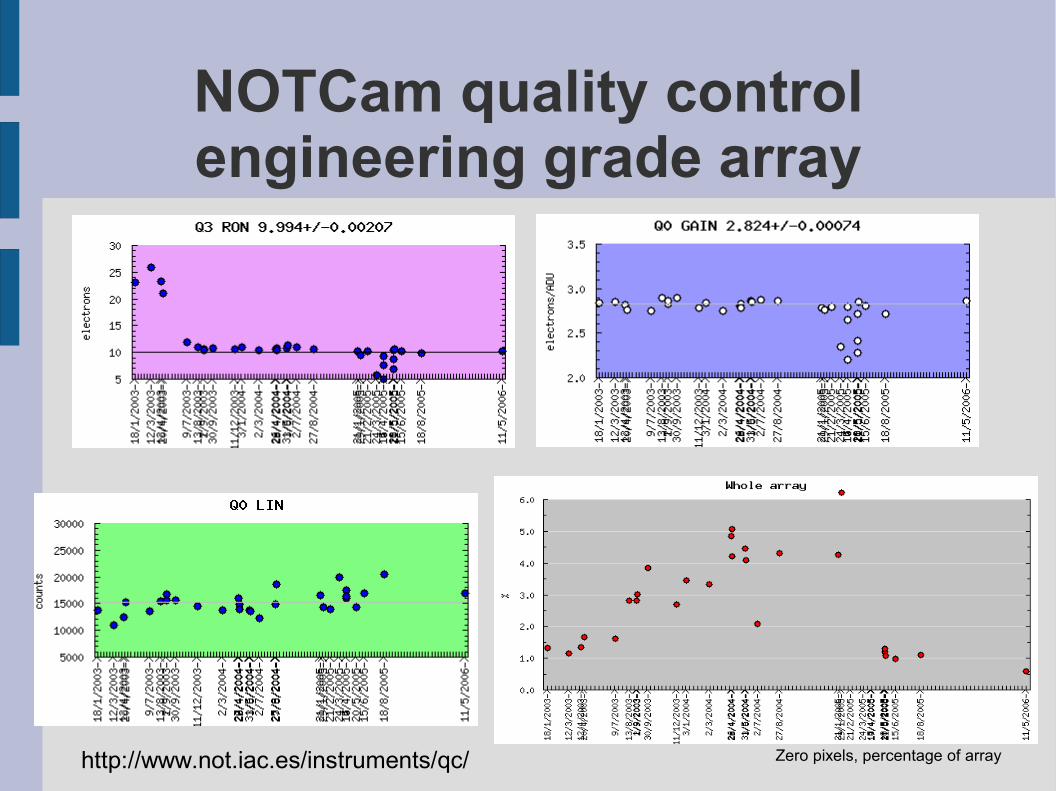
NOTCam quality controlengineering grade array
http://www.not.iac.es/instruments/qc/ Zero pixels, percentage of array
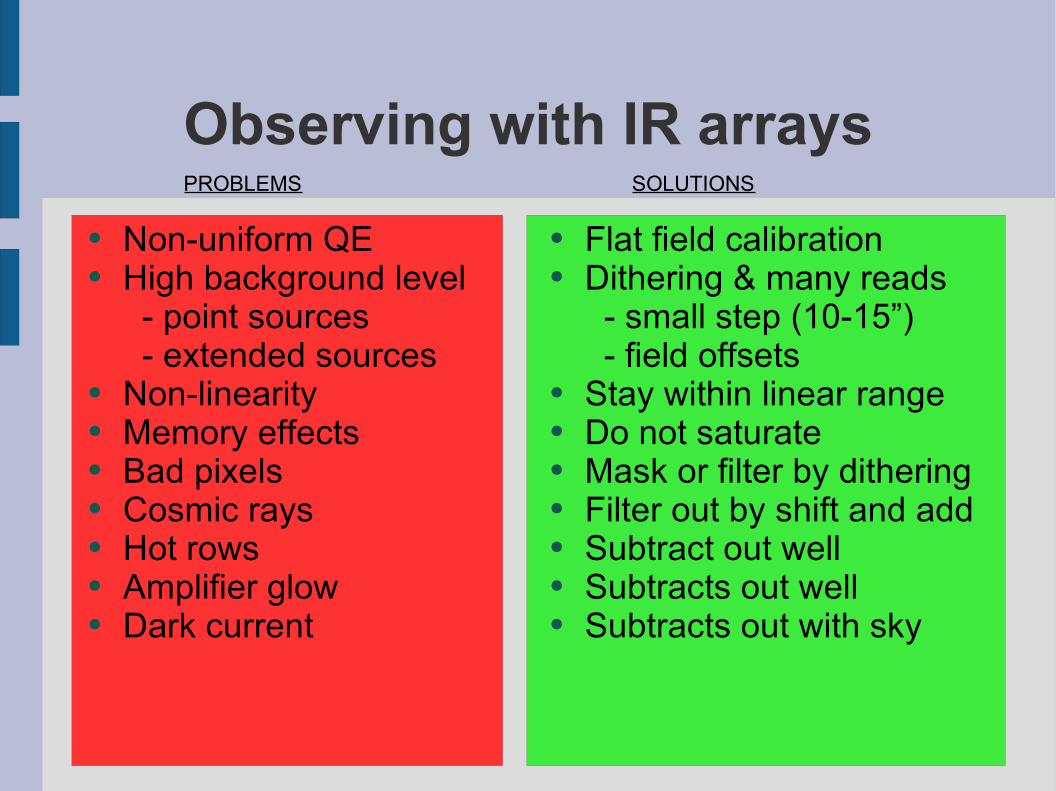
Observing with IR arrays● Non-uniform QE● High background level
- point sources - extended sources
● Non-linearity● Memory effects● Bad pixels● Cosmic rays● Hot rows● Amplifier glow● Dark current
● Flat field calibration● Dithering & many reads
- small step (10-15”) - field offsets
● Stay within linear range● Do not saturate● Mask or filter by dithering● Filter out by shift and add● Subtract out well● Subtracts out well● Subtracts out with sky
PROBLEMS SOLUTIONS
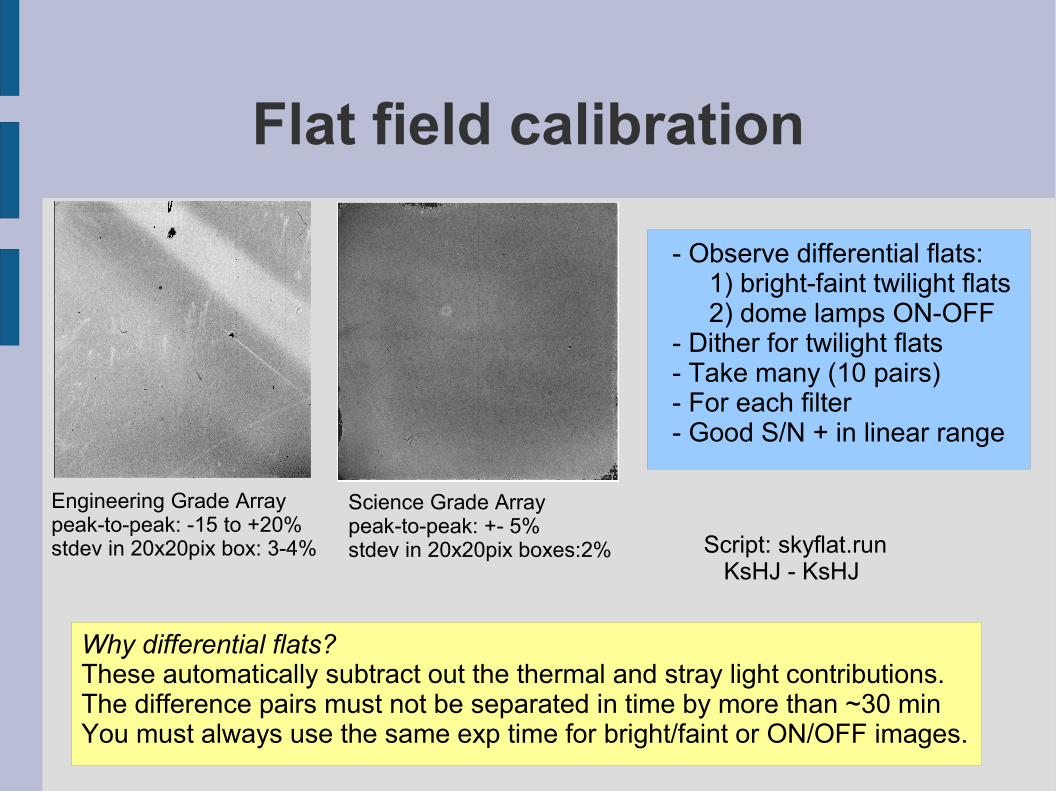
Flat field calibration
Engineering Grade Arraypeak-to-peak: -15 to +20%stdev in 20x20pix box: 3-4%
Science Grade Arraypeak-to-peak: +- 5%stdev in 20x20pix boxes:2%
- Observe differential flats: 1) bright-faint twilight flats 2) dome lamps ON-OFF- Dither for twilight flats- Take many (10 pairs)- For each filter- Good S/N + in linear range
Why differential flats? These automatically subtract out the thermal and stray light contributions.The difference pairs must not be separated in time by more than ~30 min You must always use the same exp time for bright/faint or ON/OFF images.
Script: skyflat.run KsHJ - KsHJ
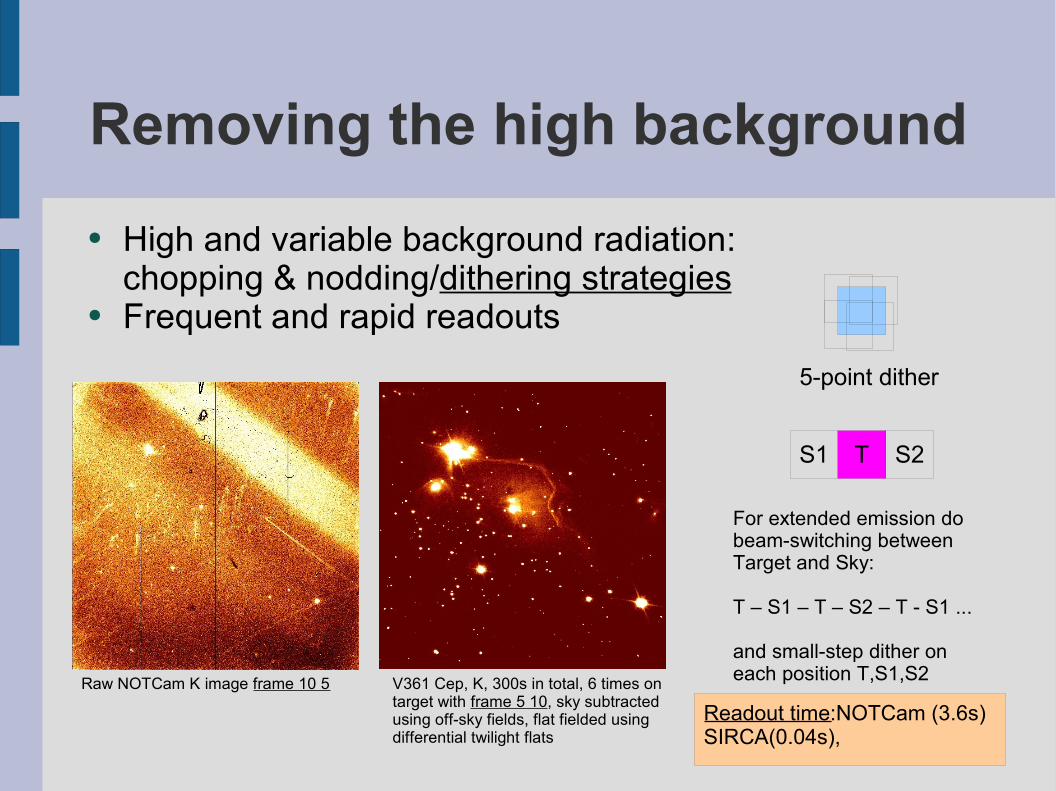
Removing the high background● High and variable background radiation:
chopping & nodding/dithering strategies ● Frequent and rapid readouts
Raw NOTCam K image frame 10 5 V361 Cep, K, 300s in total, 6 times ontarget with frame 5 10, sky subtractedusing off-sky fields, flat fielded usingdifferential twilight flats
5-point dither
T S2S1
For extended emission dobeam-switching betweenTarget and Sky:
T – S1 – T – S2 – T - S1 ...
and small-step dither on each position T,S1,S2
Readout time:NOTCam (3.6s)SIRCA(0.04s),
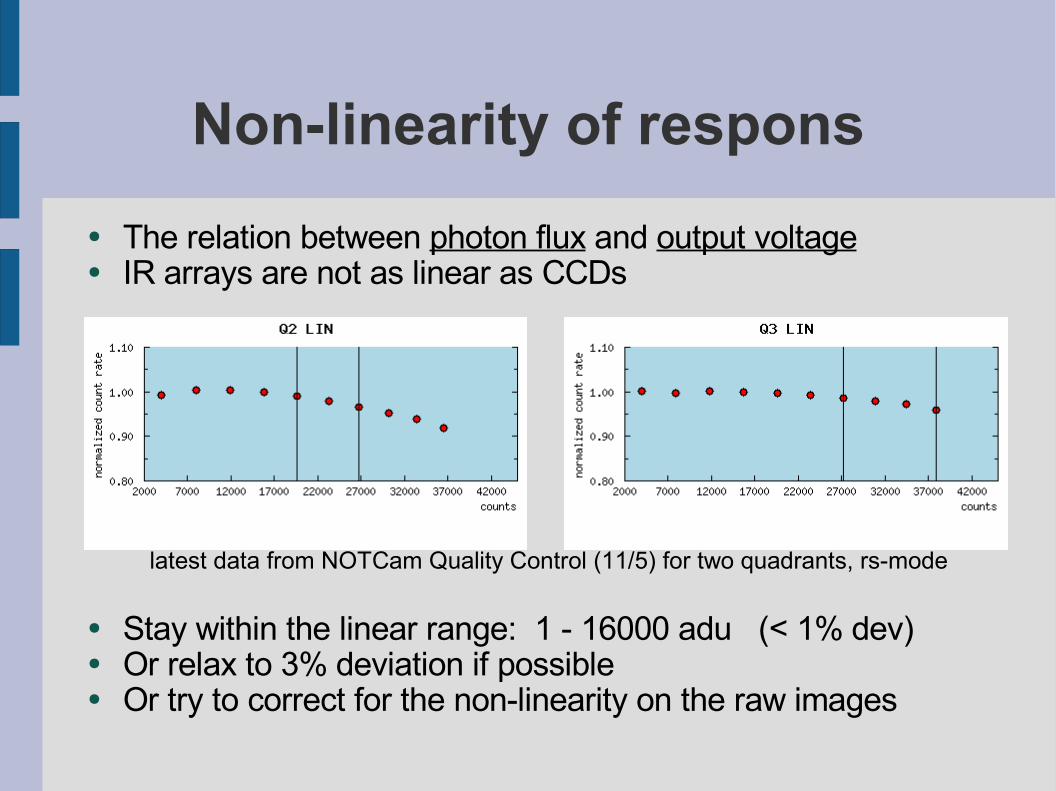
Non-linearity of respons● The relation between photon flux and output voltage● IR arrays are not as linear as CCDs
latest data from NOTCam Quality Control (11/5) for two quadrants, rs-mode
● Stay within the linear range: 1 - 16000 adu (< 1% dev)● Or relax to 3% deviation if possible● Or try to correct for the non-linearity on the raw images
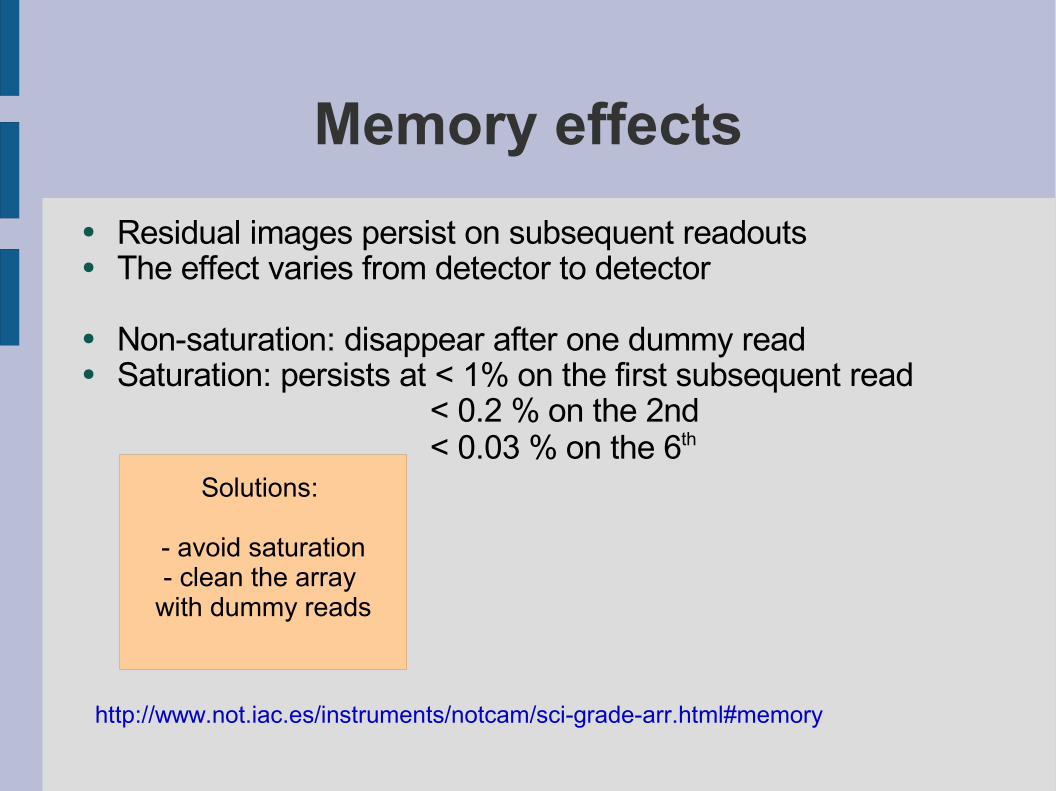
Memory effects● Residual images persist on subsequent readouts ● The effect varies from detector to detector
● Non-saturation: disappear after one dummy read● Saturation: persists at < 1% on the first subsequent read
< 0.2 % on the 2nd < 0.03 % on the 6th
Solutions:
- avoid saturation- clean the array
with dummy reads
http://www.not.iac.es/instruments/notcam/sci-grade-arr.html#memory
Dark current● Dark current is accumulation of electrons in the pixels in the
total absence of light● IR arrays are cooled much more than CCDs since the band
gap is smaller than for Silicon● < 4 electrons/minute/pixel usual for Hawaii 1k SWIR device
● NOTCam : strange dark behaviour (electronic configuration)● We recommend: no particular dark subtraction● The dark is automatically subtracted out with the sky
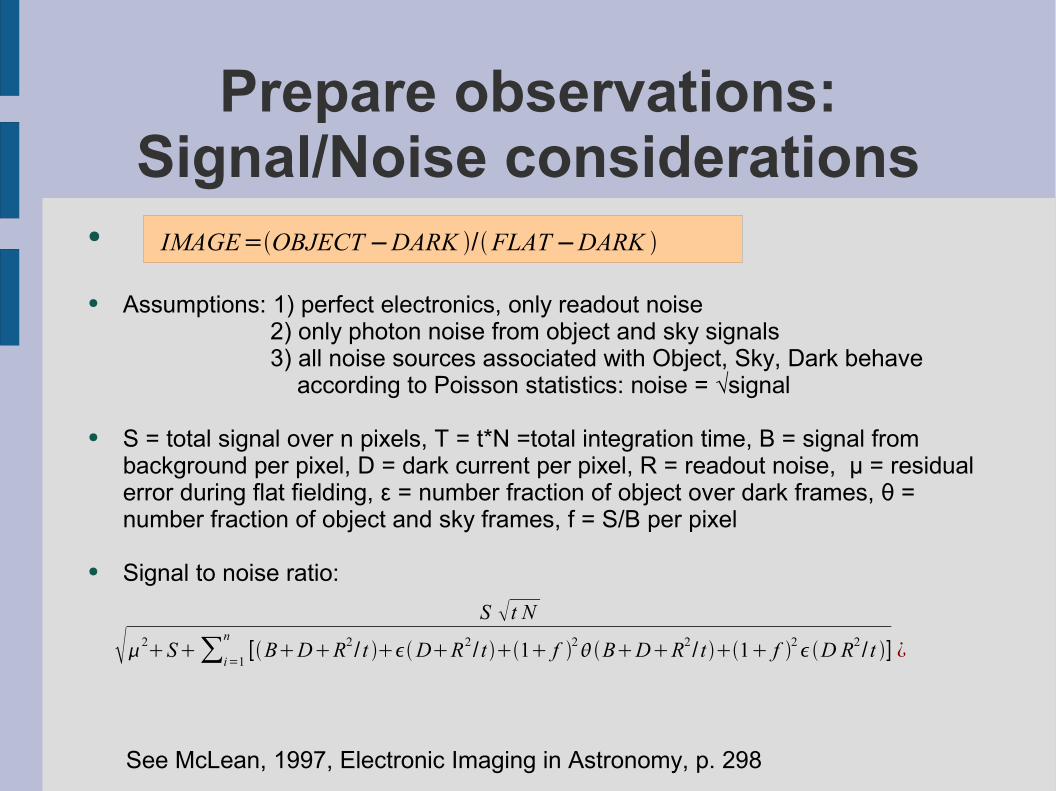
Prepare observations: Signal/Noise considerations
●
● Assumptions: 1) perfect electronics, only readout noise 2) only photon noise from object and sky signals 3) all noise sources associated with Object, Sky, Dark behave according to Poisson statistics: noise = √signal
● S = total signal over n pixels, T = t*N =total integration time, B = signal from background per pixel, D = dark current per pixel, R = readout noise, µ = residual error during flat fielding, ε = number fraction of object over dark frames, θ = number fraction of object and sky frames, f = S/B per pixel
● Signal to noise ratio:
IMAGE=OBJECT−DARK /FLAT−DARK
S t N
2S∑i=1
n[BDR2/ t DR2/ t 1 f 2BDR2/ t 1 f 2D R2/ t ] ¿
See McLean, 1997, Electronic Imaging in Astronomy, p. 298
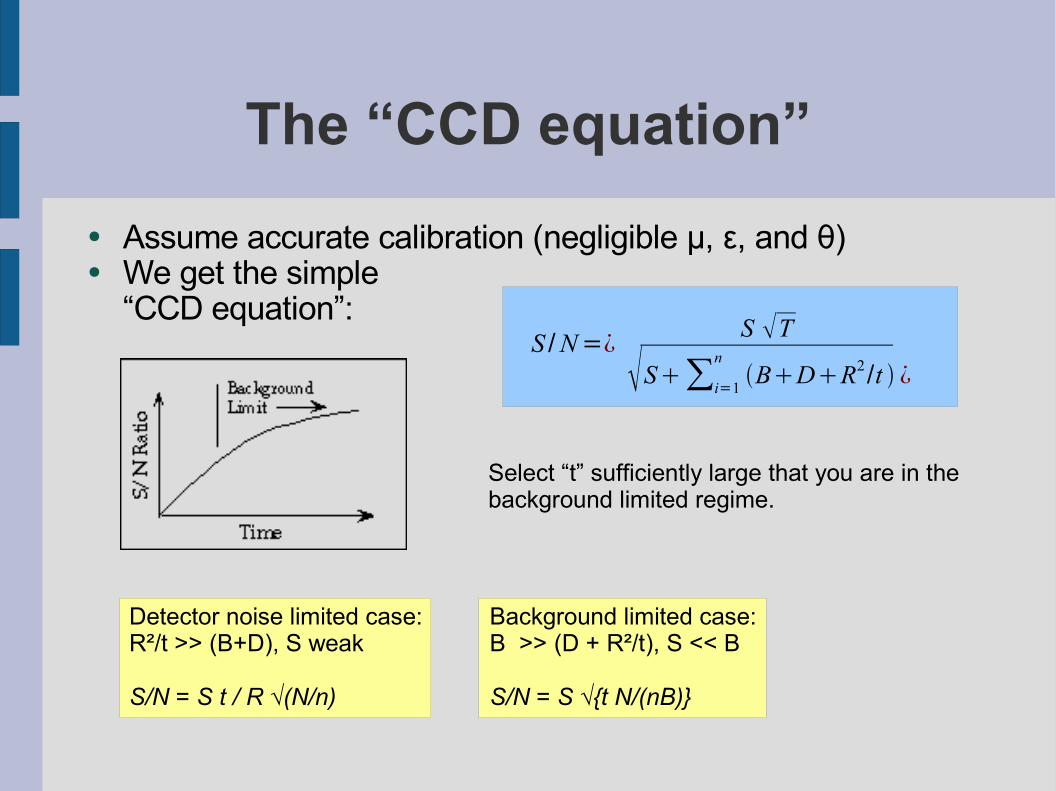
The “CCD equation”● Assume accurate calibration (negligible µ, ε, and θ)● We get the simple
“CCD equation”: S T
S∑i=1
nBDR2/t ¿
S /N=¿
Background limited case:B >> (D + R²/t), S << B
S/N = S √{t N/(nB)}
Detector noise limited case:R²/t >> (B+D), S weak
S/N = S t / R √(N/n)
Select “t” sufficiently large that you are in thebackground limited regime.
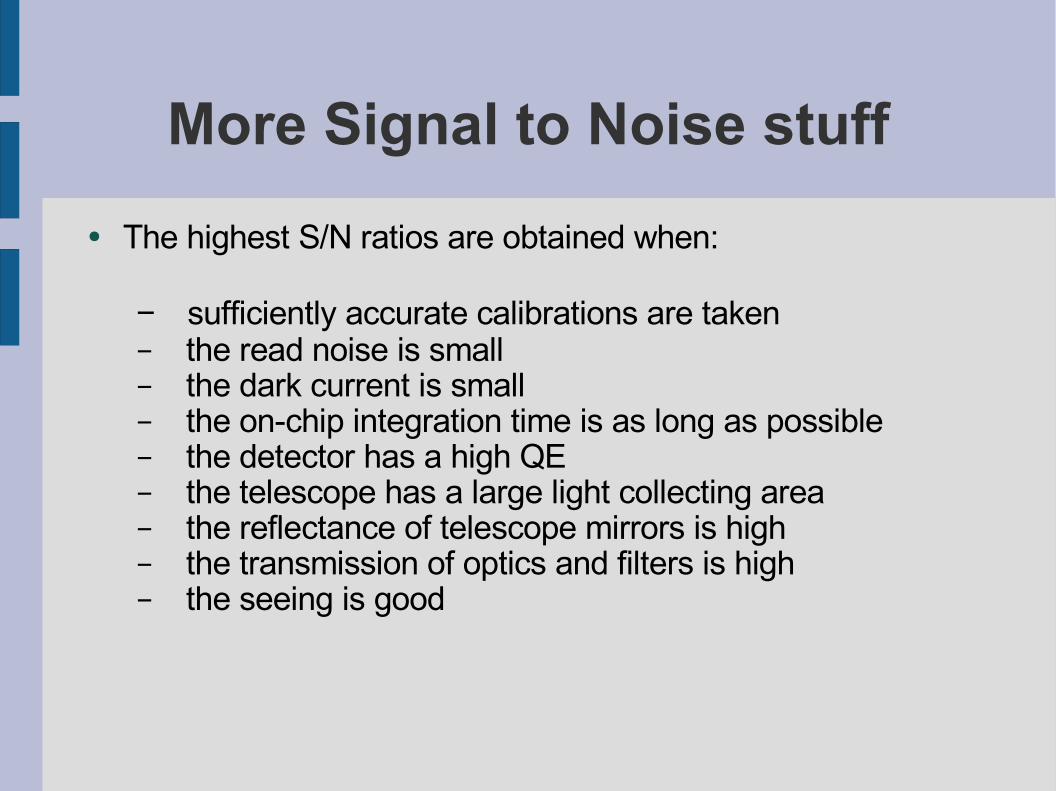
More Signal to Noise stuff● The highest S/N ratios are obtained when:
– sufficiently accurate calibrations are taken – the read noise is small– the dark current is small – the on-chip integration time is as long as possible – the detector has a high QE – the telescope has a large light collecting area– the reflectance of telescope mirrors is high – the transmission of optics and filters is high– the seeing is good
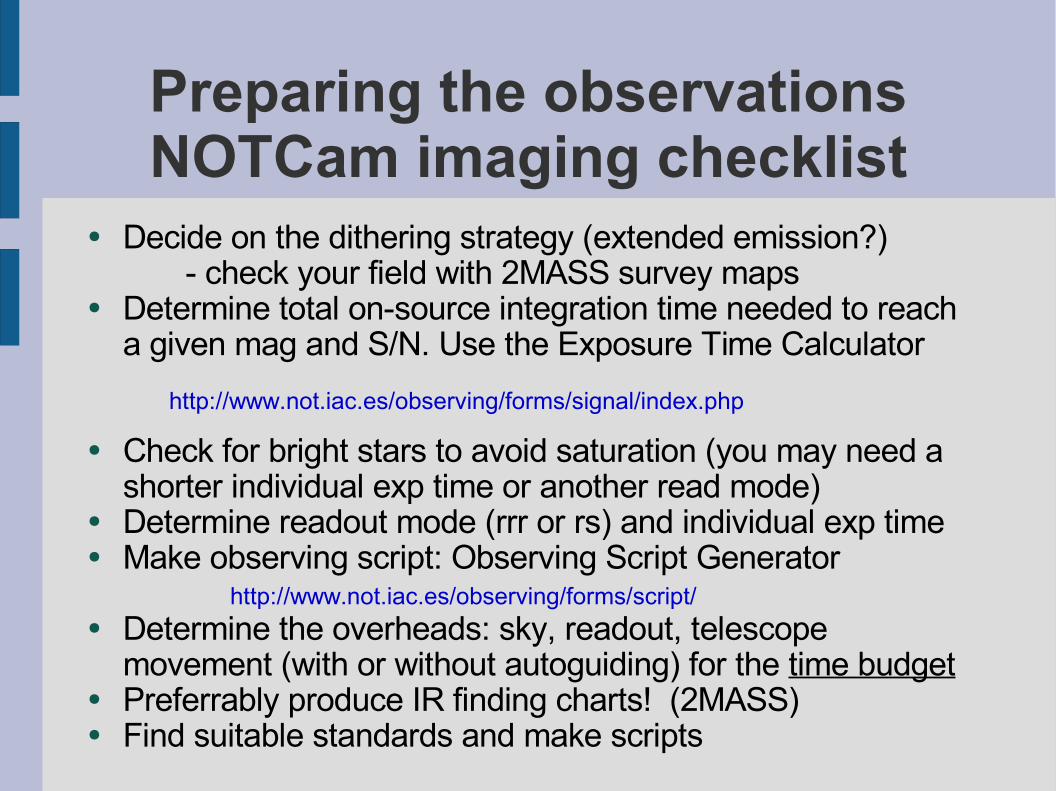
Preparing the observationsNOTCam imaging checklist
● Decide on the dithering strategy (extended emission?) - check your field with 2MASS survey maps
● Determine total on-source integration time needed to reach a given mag and S/N. Use the Exposure Time Calculator
● Check for bright stars to avoid saturation (you may need a shorter individual exp time or another read mode)
● Determine readout mode (rrr or rs) and individual exp time● Make observing script: Observing Script Generator
http://www.not.iac.es/observing/forms/script/● Determine the overheads: sky, readout, telescope
movement (with or without autoguiding) for the time budget● Preferrably produce IR finding charts! (2MASS)● Find suitable standards and make scripts
http://www.not.iac.es/observing/forms/signal/index.php
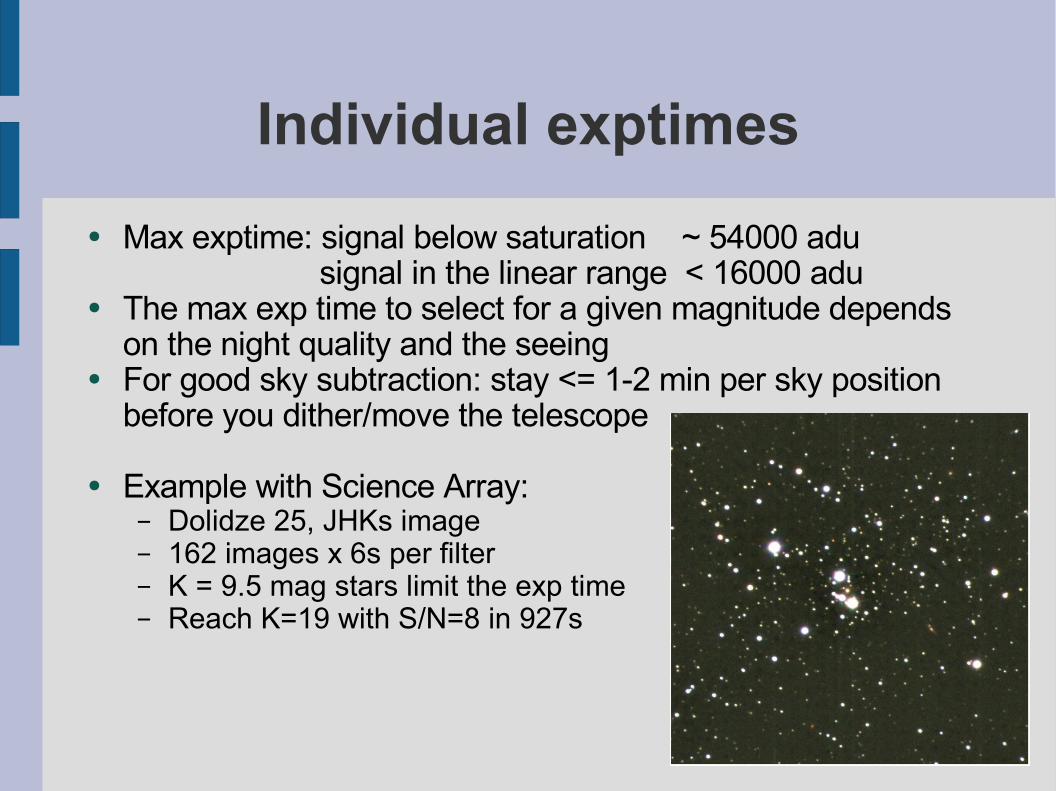
Individual exptimes● Max exptime: signal below saturation ~ 54000 adu
signal in the linear range < 16000 adu ● The max exp time to select for a given magnitude depends
on the night quality and the seeing ● For good sky subtraction: stay <= 1-2 min per sky position
before you dither/move the telescope
● Example with Science Array:– Dolidze 25, JHKs image– 162 images x 6s per filter – K = 9.5 mag stars limit the exp time – Reach K=19 with S/N=8 in 927s
An observing script example
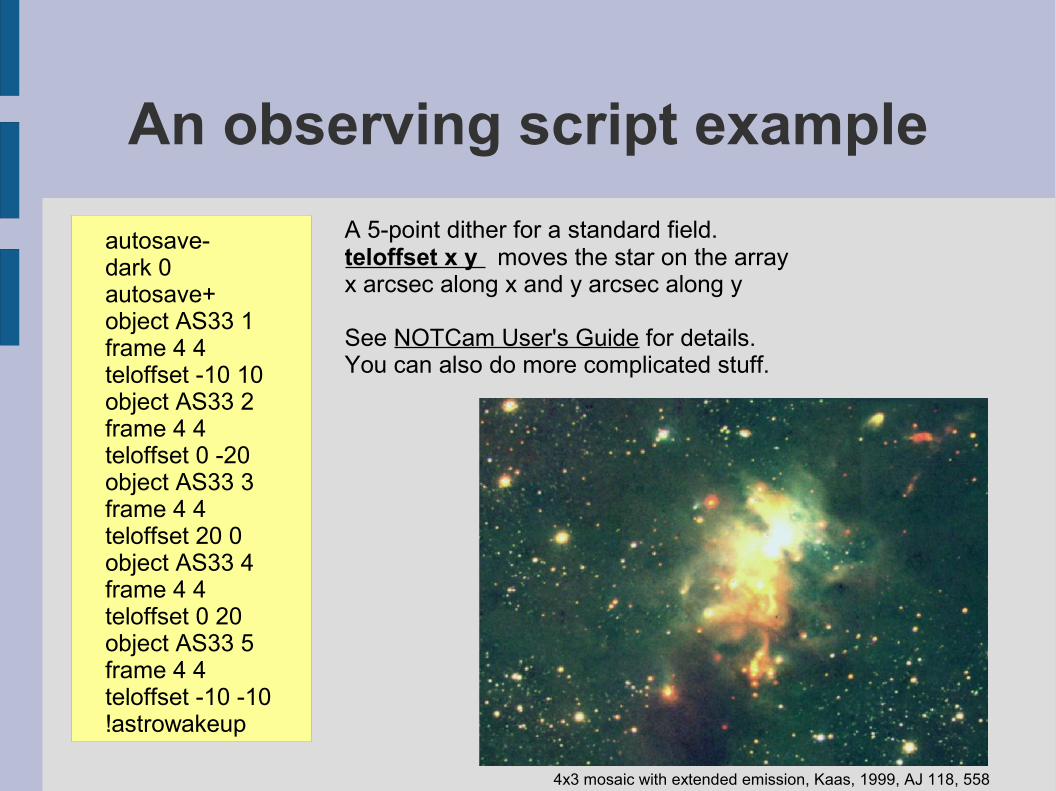
autosave-dark 0autosave+object AS33 1frame 4 4teloffset -10 10object AS33 2frame 4 4teloffset 0 -20object AS33 3frame 4 4teloffset 20 0object AS33 4frame 4 4teloffset 0 20object AS33 5frame 4 4teloffset -10 -10!astrowakeup
A 5-point dither for a standard field.teloffset x y moves the star on the arrayx arcsec along x and y arcsec along y
See NOTCam User's Guide for details.You can also do more complicated stuff.
4x3 mosaic with extended emission, Kaas, 1999, AJ 118, 558
Preparing the observations: NOTCam spectroscopy
● IR finding charts ● Dither along slit in an ABBA pattern (abba.run)
● Determine integration time (no Exptime Calculator)
● Find telluric standard (e.g. A0 stars) close to target
(rule of thumb: observe it at every 0.2 change in airmass)
● Plan time for calibration spectra at each pointing NOTCam: close mirror cover (2x50s) to use baffle lamps (argon + xenon + halogen)
● Read NOTCam Spectroscopy web page
Data reduction: flat fields
● Make a master flat for each filter and each night ● 20 bright and faint flats are pairwise subtracted● 10 difference images (which are dithered on the sky) are
median combined with additive scaling● Spatial 3x3 pixel box filtering applied● Normalized● IRAF script mkflat.cl
> mkflat imagelist flatname filter camera
● The resulting masterflat is displayed on your DS9● Check it.
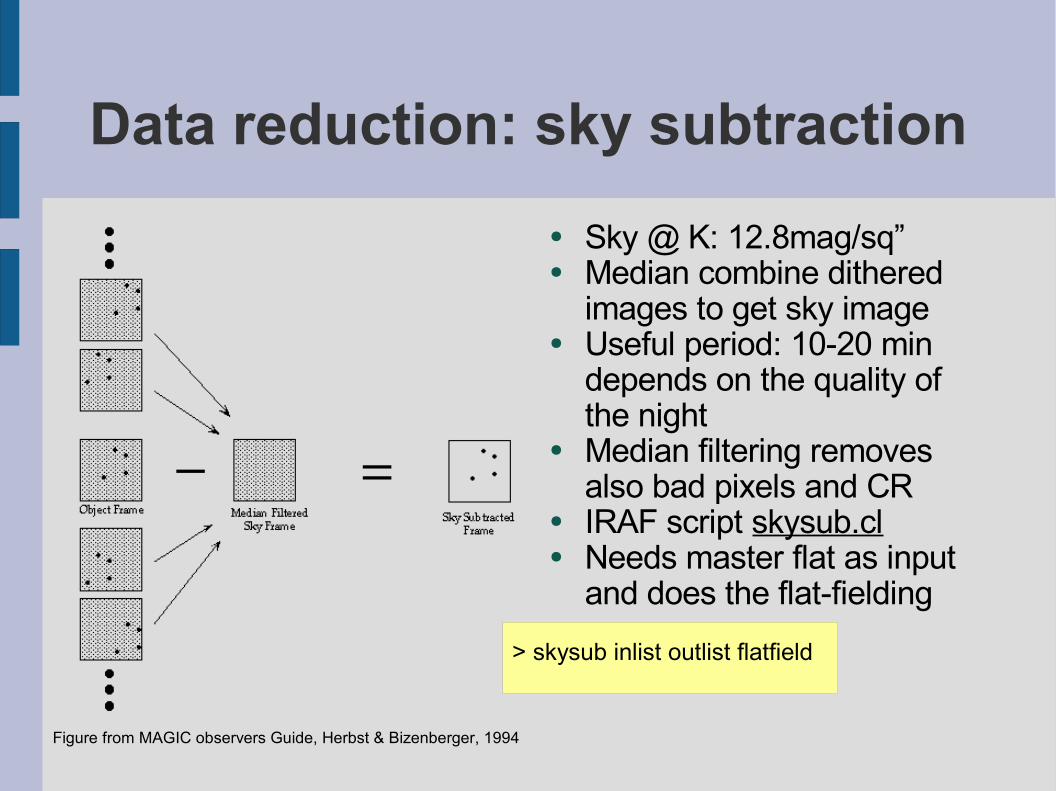
Data reduction: sky subtraction
Figure from MAGIC observers Guide, Herbst & Bizenberger, 1994
● Sky @ K: 12.8mag/sq”● Median combine dithered
images to get sky image● Useful period: 10-20 min
depends on the quality of the night
● Median filtering removes also bad pixels and CR
● IRAF script skysub.cl● Needs master flat as input
and does the flat-fielding
> skysub inlist outlist flatfield
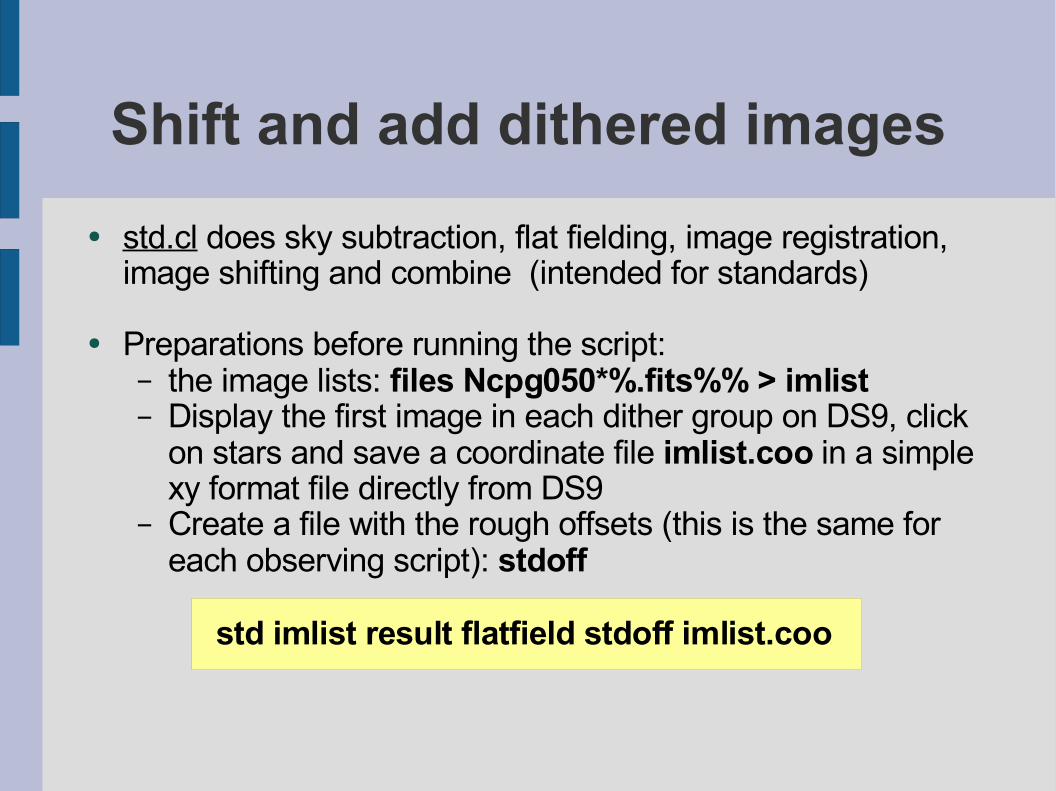
Shift and add dithered images● std.cl does sky subtraction, flat fielding, image registration,
image shifting and combine (intended for standards)
● Preparations before running the script:– the image lists: files Ncpg050*%.fits%% > imlist– Display the first image in each dither group on DS9, click
on stars and save a coordinate file imlist.coo in a simple xy format file directly from DS9
– Create a file with the rough offsets (this is the same for each observing script): stdoff
std imlist result flatfield stdoff imlist.coo
Summary● Always prepare the observations and make a time plan● Take sufficient calibration images● Use the twilight to do JHKs differential skyflats● Accurate photometry requires extinction determination: a
sufficient number of standard stars observed over a range in airmass
● Take notes of what you do during the night● Don't underestimate the time it takes to reduce IR data
For further reading● I.S. Glass: Handbook of Infrared Astronomy, 1999● Ian S. McLean: Electronic Imaging in Astronomy, 1997
● http://www.not.iac.es/instruments/notcam