Embed Size (px)
Citation preview
Rt' N\ l
Vanuatu: Issues and Optionsin the Energy Sector
June1t ;G8,
Report of the joint UNDP/Worid Bank Energy Sector Assessment ProgramThis document has a restricted distribution. its contents may not be disclosedwithout authorization from the Government, the UNDP or the WVorld Bank.
Pub
lic D
iscl
osur
e A
utho
rized
Pub
lic D
iscl
osur
e A
utho
rized
Pub
lic D
iscl
osur
e A
utho
rized
Pub
lic D
iscl
osur
e A
utho
rized
Pub
lic D
iscl
osur
e A
utho
rized
Pub
lic D
iscl
osur
e A
utho
rized
Pub
lic D
iscl
osur
e A
utho
rized
Pub
lic D
iscl
osur
e A
utho
rized
JOIN'T UNDIP/WJRLD BANK ENERGY SECTOR ASSESSMENT PROGRAMREPORTS ALREADY ISSUED
r.de- e s - .^. X z .--~.> r : C
"ar ;:-; e.._r :- ':C-9A
.se-y.- wa-~~~~~~~.- 9*'- 3J~-
-.. ,a .- 3 A V>
\Sr; . . =, .. a v 1.H..
C. .,
R~~~~~~~~~~~~~~
_ C' - 5, . .
FOR OFFICIAL USE ONLY
Report No. 5577-VA
VANUATU
ISSUES AND OPTIONS IN THE ENERGY SECTOR
JUNE 1985
This is one of a series of reports of the Joint UNDP/World Bank EnergySector Assessment Program. Finance for this work has been provided, inpart, by the UNDP Energy Account, and the work has been carried out bythe World Bank. This report has a restricted distribution. Its contentsmay not be disclosed without authorization from the Government, the UNDPor the World Bank.
ABSTRACT
Vanuatu has an open economy -- its trade accounting for about802 of GDP. However, because the export sector is very dependent on justa few agricultural products, the economy is vulnerable to widefluctuations in the world prices of essential imports such as petroleumproducts. Although Vanuatu has a diverse indigenous energy resource baseconsisting of hydropower, geothermal reserves and substantial naturalforest, rapid development of this potential has been hampered by in-adequate inventories and a shortage of skilled manpower. The result iscontinued overdependence on imported petroleum products for commercialenergy needs. This report reviews the energy sector of Vanuatu andrecommends: (a) development of a regional least-cost strategy forprocuring petroleum products; (b) institutional modification in the powersector to establish guidelines for development, generation anddistribution of power; Cc) analysis of the economic costs of public powersupply; (d) acceleration of hydropower development investigations; and(e) continued encouragement of economic use of indigenous energyresources in power generation and agroindustries.
ABBRESATIONS
ADB Asian Development BankADO Automotive Diesel OilCES Compagnie d'Electricite de SantoCHOGRM Commonwealth Heads of Government Regional MeetingEDF European Development FundEEC European Economic CommunityESCAP Economic and Social Committee for Asia and the PacificGOV Government of VanuatuMLERWS Ministry of Lands, Energy and Rural Water SupplyORSTOM Office de la Recherche Scientifique et Technique
Outre-MerSPC South Pacific CommissionSPEC South Pacific Bureau for Economic Co-operationUNELCO-Vanuatu Union Electrique du VanuatuUNPEDP United Nations Pacific Energy Development ProgrammeWFPS Wood Fired Power Station
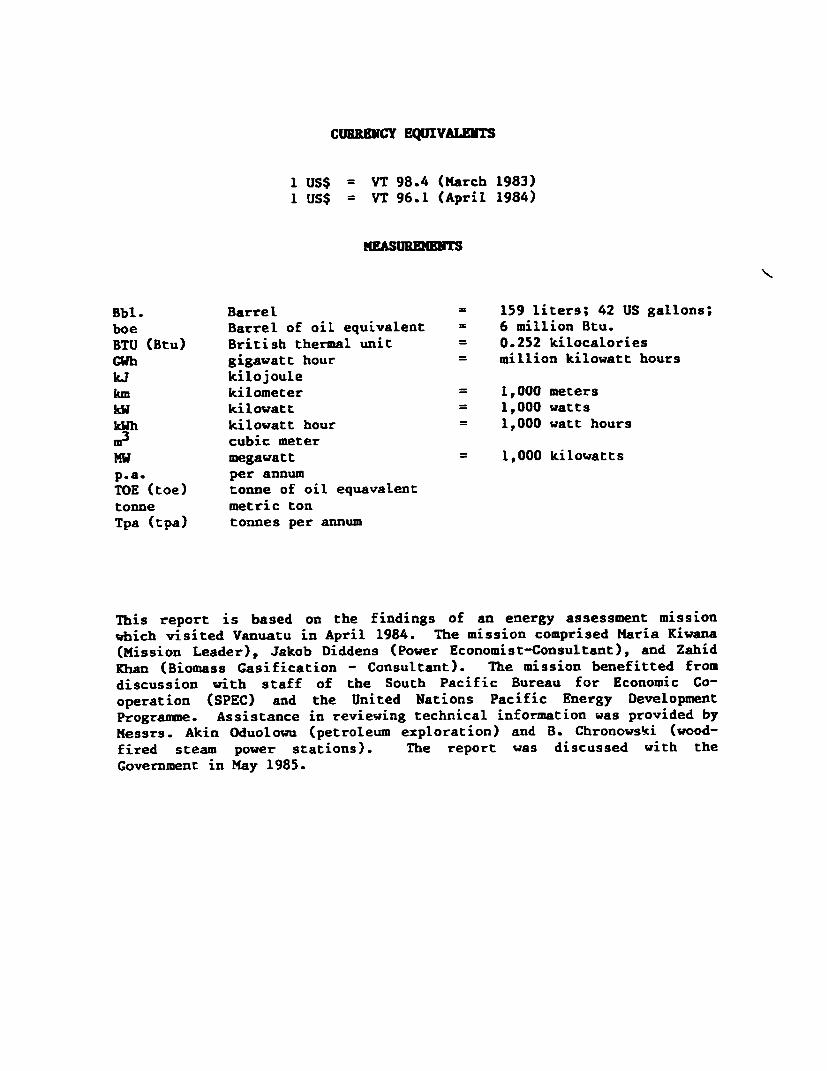
CURRENCY EQUIVALETS
1 US$ = VT 98.4 (March 1983)1 US$ = VT 96.1 (April 1984)
IIIASURENENTS
Bbl. Barrel = 159 liters; 42 US gallons;boe Barrel of oil equivalent = 6 million Btu.BTU (Btu) British thermal unit = 0.252 kilocaloriesGWh gigawatt hour = million kilowatt hourskJ kilojoulekm kilometer = 1,000 meterskW kilowatt = 1,000 wattskWh kilowatt hour = 1,000 watt hoursm3 cubic meterSW megawatt = 1,000 kilowattsp.a. per annumTOE (toe) tonne of oil equavalenttonne metric tonTpa (tpa) tonnes per annum
This report is based on the findings of an energy assessment missionwhich visited Vanuatu in April 1984. The mission comprised Maria Kiwana(Mission Leader), Jakob Diddens (Power Economist-Consultant), and ZahidKhan (Biomass Gasification - Consultant). The mission benefitted fromdiscussion with staff of the South Pacific Bureau for Economic Co-operation (SPEC) and the United Nations Pacific Energy DevelopmentProgramme. Assistance in reviewing technical information was provided byMessrs. Akin Oduolowu (petroleum exploration) and B. Chronowski (wood-fired steam power stations). The report was discussed with theGovernment in May 1985.
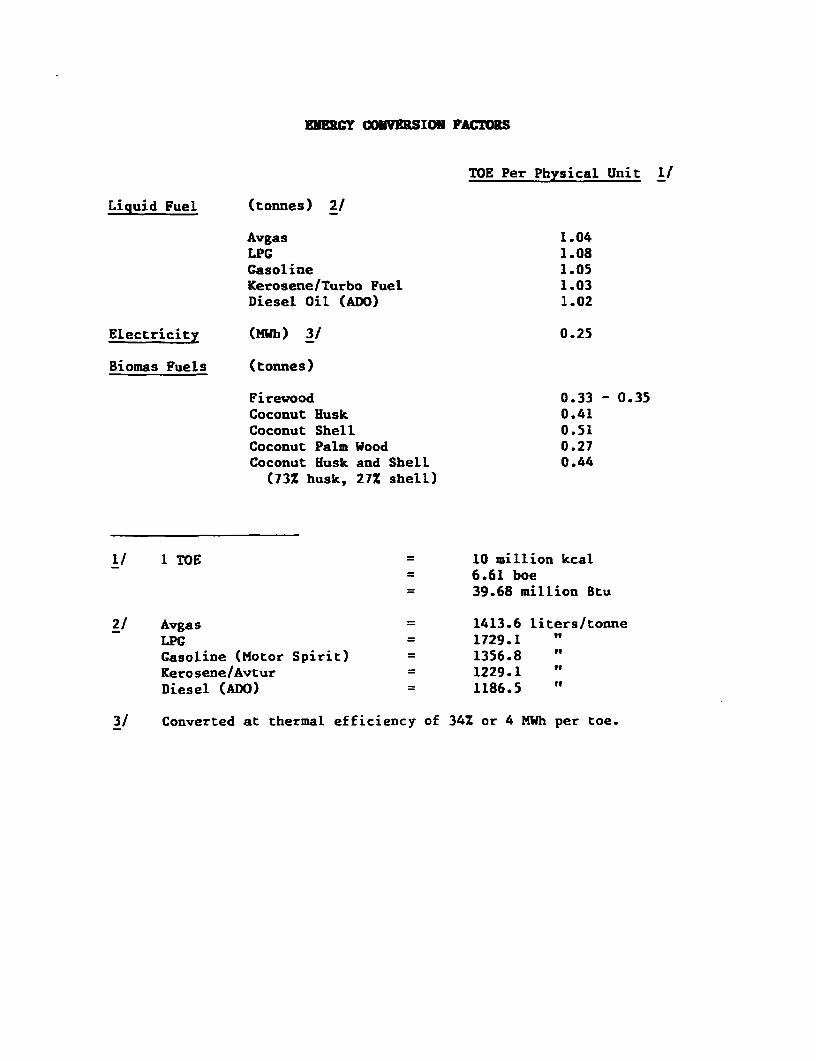
ENERCY CONVERSION FACTORS
TOE Per Physical Unit 1/
Liquid Fuel (tonnes) 2/
Avgas 1.04LPG 1.08Gasoline 1.05Kerosene/Turbo Fuel 1.03Diesel Oil (ADO) 1.02
Electricity (MWh) 3/ 0.25
Biomas Fuels (tonnes)
Firewood 0.33 - 0.35Coconut Husk 0.41Coconut Shell 0.51Coconut Palm Wood 0.27Coconut Husk and Shell 0.44(73% husk, 27% shell)
1/ 1 TOE = 10 million kcal= 6.61 boe= 39.68 million Btu
2/ Avgas = 1413.6 liters/tonneLPG = 1729.1 "
Gasoline (Motor Spirit) = 1356.8 "
Kerosene/Avtur = 1229.1 "
Diesel (ADO) = 1186.5 "
3/ Converted at thermal efficiency of 34% or 4 MWh per toe.
TABLE OF CONTENTS
Page
SUHMARY OF FINDINGS AND RECOMMENDATIONS ........................... i
I. ENERGY AND THE ECONOMY .. 1Country Background .. 1.................. Petroleum Import Bill .. 3Energy Balance ............ ................... .......... . 4Energy Balance Projections . . 6
II. ENERGY SECTOR OVERVIEW .. 7
Energy Resources .. 7Petroleum Sector .. 8Historical Demand .. 8Petroleum Demand Projections . . 9Pricing . . 10
Electricity Sector .. 12Supply . . 12Urban Power Supply .. 13Rural Power Supply .................................... 13Demand .. 13Power Demand Forecasts .. 14
Traditional Energy .. 16Demand . . 16Supply . . 17Biomass Supply and Demand Projections . . 18
III. ISSUES AND OPTIONS .. 21Introduction .. 21Petroleum Supply Arrangements ........................... 21Power Sector Administration .. 23
Background .. 23Concession Agreement .. 24
Electricity Tariffs .. 25Power System Expansion .. 28Introduction .. 28Wood-Fired Power Generation . . 28Hydropower Development .. 31Hydro Development Studies ............................. 32
Other Renewable Energy Options . . 34Biomass Gasification .. 34Photovoltaics ......................................... 36Ethanol ............................................... 37Coconut Oil ........................................... 37Charcoal Production .. 38
Hydrocarbon ExpLoration .. 38
IV. ENERGY INSTITUTIONS AND TECHNICAL ASSISTANCE .............. 40Energy Planning and Administration ...................... 40Implications for External Assistance .................... 40
ANNEXES
1. Energy Balance Projections, 1990 ............................ 422. Energy Balance Projections, 1995 ............................ 433. Petroleum Retail Price Trends, 1981-84 ...................... 444. Growth of Demand and Demand Forecast by UNELCO-Vanuatu ...... 455. Revised Load Forecast for Port Villa ........................ 466. UNELCO-Vanuatu - Power Tariff, 1984 ......................... 477. Vanuatu Geological Data ..................................... 488. fLERWS Organization Chart ................................... 499. Current and Proposed Technical Assistance ................... 5010. Priority Action Programme .52
TABLES
1. Priority Action Programme Summary ........................... viii1.1 Components of GDP, 1980-83 .. 21.2 Main Domestic Export Categories .. 21.3 Domestic Import Categories, 1983 .. 31.4 Petroleum Product Import Bill, 1980-83 .. 41.5 Energy Balance, 1983 .. 52.1 Petroleum Product Imports, 1980-83 ... 82.2 Sectoral Consumption of Petroleum, 1983 .. 92.3 Petroleum Product Demand Projections, 1983-95 .. 102.4 Petroleum Product Pricing Structure, February 1984 .. 112.5 Public Power Supply Statistics, 1983 .. 122.6 Public Electric Power Generation, 1978-83 .. 132.7 Port Vila System - UNELCO-Vanuatu Demand
Forecasts, 1983-90 .. 142.8 Revised Demand Forecast for Port Vila, 1993-95 .............. 152.9 Power Demand Forecast for Luganville, 1983-95 ............... 162.10 Biomass Energy Balance Projections, 1983-95 ................. 193.1 Petroleum Import Costs, February 1984 ....................... 223.2 Port Vila System: Estimated Economic Cost
of Generation, 1983 ....................................... 263.3 UNELCO-Vanuatu Tariff Structure, 1984 .273.4 Power Generation Costs .313.5 Rainfall Data, 1951-83 .32
MAPS
IBRD No. 18654: Efate and TannaIBRD No. 18655: Espiritu Santo and Malakula
SUMKARY OF FINDINGS AND RECOMMENDATIONS
Introduction
1. Vanuatu is made up of 80 widely scattered islands with apopulation of 124,000 in mid-1983. Owing to the lack of essentialinfrastructure such as transportation and communication, over 80% of thepeople live in small, dispersed rural settlements and depend mostly onsubsistence agriculture for their living. As a result electric energydemand has been concentrated mainly in the two urban centers of Port Vila(Efate Island) and Luganville (Santo Island), and the transport sectorplays a vital role in the collection and distribution of commodities,with consequent emphasis on gasoline and automotive diesel oil (ADO).Fuelwood demand (80% of primary energy demand) is adequately satisfieddue to the dispersed population pattern and substantial natural vegeta-tion. Unlike some other Pacific Island countries, Vanuatu has hydropowerpotential, geothermal reserves and the possibility of offshore hydro-carbons in addition to its substantial fuelwood resources. However, thisenergy base is still largely unquantified and Vanuatu will continue torely on imports of petroleum products to meet most of its commercialenergy requirements in the medium term.
2. The main issues for the immediate future concern: (a) minimi-zing petroleum product import costs; (b) modifying the institutional set-up of the electricity sector to ensure the operation of the electricitysystems incorporates national economic efficiency criteria as well as thefinancial interests of the power utilities; (c) accelerating hydro powerdevelopment investigations; (d) increasing the economic use of indigenousenergy resources for power generation and agro-industrial process heatrequirements. Little needs to be done in the area of demand managementsince Vanuatu is already receiving external assistance in this area. Inthe long-term, Vanuatu may require further assistance in evaluating anddeveloping its indigenous hydrocarbon and geothermal potential.
Country Background
3. Vanuatu's economic performance has exhibited steady growth overthe last three years. Between 1981 and 1983, growth averaged 2-3% peryear. This growth can be attributed mainly to increased agriculturalproduction/exports and tourism. The major economic tasks facing thecountry are: (a) the gradual phasing-out of British and French budgetarysupport grants; and (b) further integration of the dualistic economywhich is strikingly divided between a small modern expatriate-dominatedsector and a large rural-based ni-Vanuatu sector. In view of theseconstraints, the Government (GOV) has widened its revenue base andcontained government expenditure while at the same time emphasizing thelong-term expansion of the agricultural sector and the encouragement of
- ii -
private investment. The mission has used an assumed GDP growth rate of3% p.a. beyond 1985 as a basis for its energy demand projections (paras.1. 1-1 .8).
Petroleum
4. Vanuatu is totally dependent on imports for its petroleumrequirements. Although the petroleum import bill is not yet critical,GOV is concerned about the potential impact of future petroleum priceincreases on Vanuatu's volatile export earnings e.g., the petroleum billhas ranged between 30X-60Z of domestic exports as a result of fluctuatingworld prices for agricultural products (para. 1.9).
5. GOV has already ensured that the full cost of petroleum importsis passed on to the final consumer. Further, petroleum displacementopportunities are mainly confined to the power sector (30% of totalpetroleum demand). Therefore, the other major cost minimizing possibi-lity is in the procurement and supply logistics area. Vanuatu's internalpetroleum requirements are relatively modest (17.07 megalitres in1983). However, if Vanuatu were to pool its requirements with those ofother Pacific Island countries, the combined import package shouldprovide sufficient incentive for an established major oil company toquote lower f.o.b. and freight rates. Therefore, the mission recommendsa regional technical assistance mission visit Vanuatu, Fiji, Papua NewGuinea, Solomon Islands, Tonga and Western Samoa, which altogetheraccount for over 95% of the South Pacific Island petroleum demand (about1,160 megaliters in 1981). The objective would be an economic andtechnical evaluation of a possible regional petroleum supply arrangement(para. 3.5-3.10).
Electricity
6. The public electric power supply system is entirely based onautomotive diesel oil (ADO) and consists of two urban power systemsaround Port Vila (6.3 MW) and Luganville (1.1 KW), and three small ruralsystems (combined capacity 0.24 MW) at local government centers on Tannaand Malakula. The rural systems are operated by the Public WorksDepartment. The Port Vila system is operated by UNELCO-Vanuatu, aprivate foreign-owned utility; and the Luganville system is operated byCompagnie d'Electricite de Santo (C.E.S.), a UNELCO-Vanuatu subsidiary(paras. 2.14-2.19).
Sector Administration
7. Under the Port Vila Concession Agreement, UNELCO-Vanuatu -- atechnically competent foreign-owned firm -- is allowed to generate,distribute and charge for public electricity. Due to lack of financial
- Iii -
monitoring, GOV is unable to determine the realistic cost of publicelectricity supply. It is important that GOV be able to play an activerole in monitoring the utility's operations and to develop a long-termstrategy to deal with the power sector. Therefore, GOV and UNELCO-Vanuatu should agree upon a strategy to formulate: (a) a financialreporting provision; and (b) guidelines for future generation anddistribution of power -- as distinct from routine operational policy(paras. 3.9-3.12). The mission recommends that GOV and UNELCO-Vanuaturequest technical assistance for this purpose.
Power Tariffs
8. Little information was available concerning the presenteconomic cost of power supply and only very broad observations could bemade about the current power tariff structure and levels. In order toensure that decisions about future system expansion reflect economicefficiency criteria as well as social objectives and the financialviability of the power utility, the mission recommends that GOV andUNELCO-Vanuatu undertake a joint analysis of the economic costs of powersupply on the Port Vila system (paras. 3.13-3.18). This analysis shouldbe a component of the proposal discussed in para. 7 above.
Power System Expansion
9. Indigenous energy resources for near-term displacement of die-sel in power generation include biomass and hydro. Pending the develop-ment of Vanuatu's hydro resources, COV is considering the possibility ofintroducing wood-fired generation capacity on the Port Vila system in aneffort to reduce dependence on imported diesel. A feasibility study isbeing prepared by UNELCO-Vanuatu in partnership with Heilbonn GmbH, aWest German supplier of wood-fired power stations (WFPS).
10. Wood-fired Power Station (WFPS). A preliminary missionevaluation, based on existing studies, concluded that a WFPS couldgenerate electricity for between USrl0.0/kWh-USC17.0/kWh as compared toan estimated economic cost of US¢11.0/kWh for ADO. This indicates thatany upward change in WFPS cost assumptions concerning delivered fuelwoodcosts, operation and maintenance requirements or capital investment costscould result in wood-fired generation that is more costly than ADOgeneration. Several factors must be considered if any reduction inelectricity generation costs is to be realized. First, since a WFPScosts more per unit of installed capacity than an equivalent ADO plant,its economic and financial viability will depend on minimizing capitaloutlay and operating costs. Second, the delivered cost of fuelwood, animportant variable, will depend on whether there is sufficient nativeforest or other relatively low-cost biomass such as senile coconutstemwood within the WPFS vicinity; or if a dedicated fuelwood plantationwould have to be established. Third, the institutional arrangements for:(a) ownership and operation of the WFPS, (b) tariff structure, and(c) revenue sharing between the power utility and GOV would have to bedefined before any contractual agreements are made. Therefore, the
- iv -
mission recommends that GOV request technical assistance to review theforthcoming WFPS feasibility study. In particular, sensitivity analysesshould be carried out concerning expected capital costs; operating andmaintenance costs; and reliability and deLivered costs of voodfuel overthe entire project life. It would then be possible to determine theexpected economic cost of wood-fired power production compared to othersources of power production (paras. 3.21-3.30).
11. The mission recommends that GOV should not enter into anyinvestment decisions until the WFPS feasibility study has been reviewedand evaluated within the context of a proposed least-cost power systemdevelopment strategy that would also examine the relative costs andbenefits of accelerated hydropower development and the possibility of amixed thermal-hydro system (Table 1).
12. Hydropower. A program of hydrological surveys initiated in1981 indicated that the flows an the main rivers on Efate and Santomeasured over relatively short periods of a month or so are characterizedby a flat minimum discharge volume (sufficient for power generation)interrupted by short peaks. 1983 was a very dry year and there isreasonable confidence that the 1983 flows are representative of long termminimum flows. These are important parameters since there is likely tobe only limited scope for constructing significant storage reservoirs.The mission supports the proposed continuation of the hydrologicalstudies and recommends acceleration of further studies of hydroelectricopportunities recently identified on Efate and Santo, with particularattention to optimal development sizing in view of likely demand (paras.3.31-3.35).
Other Renewables
13. Although there seems to be no present shortage of fuelwood fordomestic cooking purposes, GOV wishes to carry out a detailed fuelwoodsupply/demand survey (including both domestic and agro-processing sec-tors) aimed at identifying localized areas of shortage and assessing thepotential demand for charcoal production and improved cooking stoves.Since there is the near-term prospect of wood-fired steam powergeneration on Efate and a current proposal to supply charcoal to Efateresidents, the mission recommends that the first phase of the fuelwoodsurvey concentrate on the fuelwood demand mix on Efate (paras. 2.26;3.45). The second phase could then examine the other islands where thereis a good prospect that the Forestry Department's Local Supply Plantationprogram (LSP) will adequately cover any need for fuelwood plantations(para. 2.30).
14. There are several other activities (both proposed and ongoing)in the renewables sector. The mission reviewed these activities against
v
the background of Vanuatu's relative lack of skilled manpower and anti-cipated benefits of each project. The significant ones are:
(a) Hot-air Generators. In 1981, GOV initiated the use ofwoodfueled hot-air generators for copra drying and in 1983 15Zof copra production was dried by means of this method. Themajor advantages of this technique are improved fuel efficiency(70Z-85X, as compared to 10% for the open-fire method) andimproved quality of the finished copra product, thus fetching apremium of about US$20/ton copra at the producer's level. Themission supports the continuation of this program which isbeing financed by external aid donors. In the same context,the mission advises that the centralized cocoa-dryingfacilities at a proposed cocoa plantation on Malakula Islandshould incorporate a wood-fired hot-air generator instead ofthe oil-fired boiler currently envisaged (paras. 3.36-3.37).
(b) Power Gasification. As part of the regional EEC-financpdenergy programme, Vanuatu is to receive a 50 KW wood-firedgasifier/generator and a 75 kVA charcoal-fired gasifier/genera-tor. 1/ In view of Vanuatu's widely dispersed population, themission supports these pilot projects, which will continue in-vestigating the viability of gasifier systems for ruralelectrification as an alternative to ADO-fired generation.However, proper project mAnagemant, extensive performancemonitoring, and detailed record-keeping will be essential(paras. 3.38-3.40).
(c) Solar Energy. A rural lighting pilot project funded by theSouth Pacific Commission (SPC) and based on a photovoltaicsystem is to be established in Vanuatu. The mission recommendsthat GOV monitor and evaluate the results of this project andothers elsewhere in the Pacific before deciding on extensiveuse of public funds to finance photovoltaic lighting on a largescale (para. 3.41).
(d) Ethanol. A low-technology pilot scheme to produce ethanol fromcassava on Tanna as a substitute for petroleum fuels inindustry and/or an additive to petroleum in transport is at astandstill due to lack of qualified operating personnel.Activities elsewhere have indicated that ethanol productionfrom cassava is unlikely to be economic; therefore the missionrecommends that GOV should not reactivate this project (paras.3.42-3.43).
1/ The pilot projects have now been combined into one projectconsisting of a 25 kVA wood-fired gasifier/generator.
- vi -
Energy Resource Evaluation
Geothermal
15. A geothermal resource has been identified on Efate withinreasonable distance of the main demand centre (Port Vila). Of a three-phase investigation program, the first phase consisting of a geologicaland geochemistry survey has been completed. New Zealand has committedfunds for the second phase, which entails geophysical surveys and somedrilling for shallow heat flow measurements; if the results so warrant, athird phase of deep-well drilling (200 metres) will be implemented. 2/Although preliminary economic evaluation indicates that geothermal energycould be comparable to hydro-generation, this option cannot be includedin Vanuatu's overall energy planning policy until the whole program hasbeen completed (within 4-5 years); and can therefore only be viewed as along-Eerm option (para. 2.3).
Hydrocarbons
16. Evaluation of offshore geophysical surveys carried out in theCentral Basin of Vanuatu in the last two decades indicates that certainsediment thicknesses and structures within the basin are promising areasfor potential hydrocarbon resources. The Malakula offshore areas inparticular are considered worthy of future exploration. A furtheroffshore geophysical survey is to be undertaken in the central basin ofVanuatu; seafloor sampling will also be carried out. These will furtherdelineate significant structures and correlate seismic stratigraphicunits with seafloor lithologies. At that time, it will be possible toevaluate the need for preparing a comprehensive data package aimed at theoil industry which has already expressed interest in the ongoing surveys(paras. 3.46-3.50).
Implications for External Assistance
17. A certain amount of technical assistance activity is alreadytaking place in Vanuatu, as shown in Annex 9. However, the mission con-siders that the following areas warrant immediate and detailed atten-tion: (a) least-cost petroleum supply st-&.Ategy; (b) electricity sectoradministration; (c) review of potential wood-fired steam generation;(d) acceleration of the hydropower development program; and (e) thecontinued encouragement of more energy-efficient methods for crop-dryingpurposes. Medium to long-term technical assistance needs are for energyresource data collection and there is already some indication that these
2/ Due to improved survey techniques, no shallow drilling will berequired in the second phase.
- vii -
needs will be met by some of Vanuatu's major aid donors (Table 1; Annex10). At present, the major energy investment requirement appears to bebetween US$5.0-US$8 million for a 3 MW wood-fired power station.Investment needs for other capital projects such as potential expansionof petroleum storage facilities and introduction of hydropower generationcan be defined once the recommended technical assistance activities arecompleted.
18. It is expected that the main functions of the incoming ADB-funded Energy Advisor to the Ministry of Lands, Energv and Water Supply(MLERWS), which is responsible for energy policy and planning, will be:(a) coordination between MLEWS and the various implementing agencies inthe energy subsectors; and (b) the preparation of an appropriate energypolicy and development program for Vanuatu. This should includesupervision of the recommended technical assistance activities. Themission also recommends that local counterparts be recruited to betrained by the Energy Advisor in coordinating and monitoring developmentsin the energy sector (paras. 4.1-4.5).
- viii -
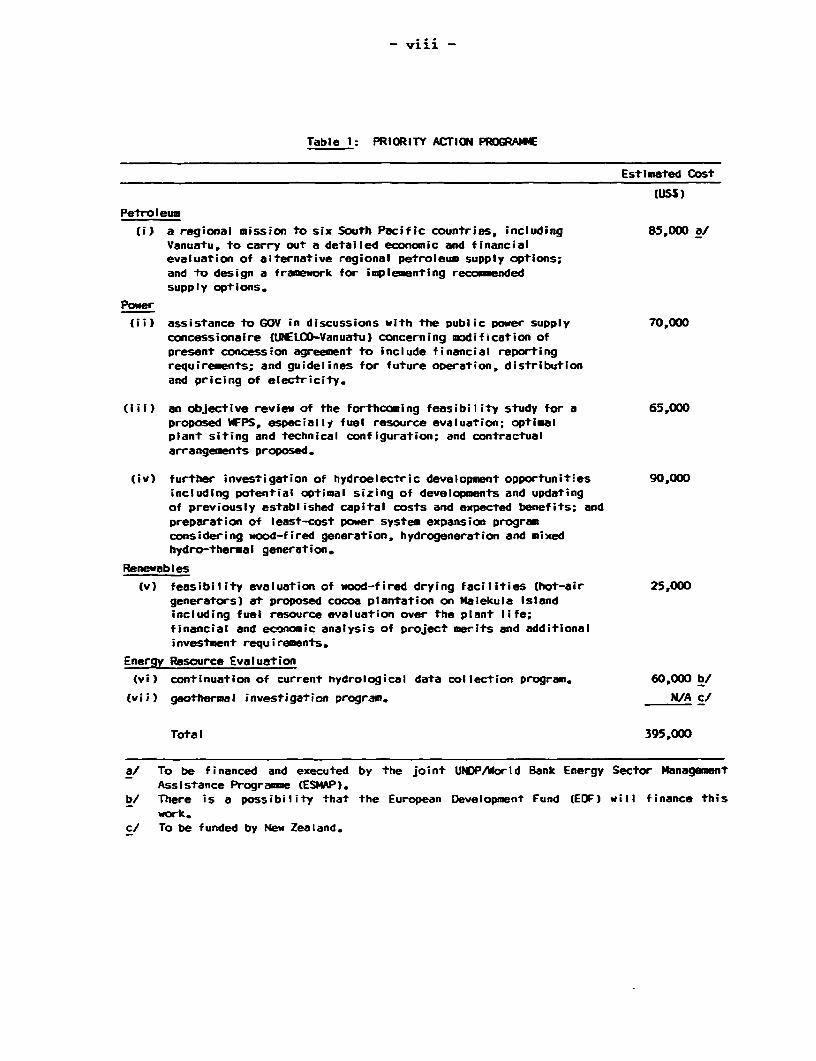
Table 1: PRIORITY ACTION PROGRAMME
Estimated Cost
CUSS)
Petroleum
(i) a regional mission to six South Pacific countries, including 85,000 aJ
Vanuatu, to carry out a detailed economic and financial
evaluation of alternative regional petroleum supply options;
and to design a framework for impl ementing recommended
supply options.
Power
(ii) assistance to GOV in discussions with the public power supply 70,000
concessionaire (UtELCO-Vanuatu) concerning modification of
present concession agreement to include financial reportingrequirements; and guidelines for future oDeration, distribution
and pricing of electricity.
(iii) an objective review of the forthcoming feasibility study for a 65,000
proposed WFPS, especially fuel resource evaluation; optimalplant siting and technical configuration; and contractual
arrangements proposed.
(iv) further investigation of hydroelectric development opportunities 90,000
including potential optimal sizing of developments and updating
of previously established capital costs and expected benefits; and
preparation of least-cost power system expansion programconsidering wood-fired generation, hydrogeneration and mixedhydro-thermal generation.
Renewables
(v) feasibility evaluation of wood-fired drying facilities (hot-air 25,000
generators) at proposed cocoa plantation on Malekula Islandincluding fuel resource evaluation over the plant life;
financial and economic analysis of project merits and additional
investment requirements.
Energy Resource Evaluation
(vi) continuation of current hydrological data collection program. 60,000 b/
(vii) geothermal investigation program. N/A c/
Total 395,000
a/ To be financed and executed by the joint UNDP/World Bank Energy Sector Management
Assistance Programne (ESMAP).b/ There is a possibility that the European Development Fund (E0F) will finance this
work.
c/ To be funded by New Zealand.
I. ENERGY AND THE ECONOMY
Country Background
1.1 The Republic of Vanuatu consists of 80 islands, geographicallyscattered in The Pacific Ocean, between Fiji and the Solomon Islands,with a land area of about 12,200 km It attained independence from thejoint British-French Conlominium in 1980. 3/ The largest islands ireEspiritu Santo (4,010 km ); Malakula (2,053 km2); and Efate (923 km ).The mid-1983 population was estimated at 124,000 and growing at about2.52 p.a. Most of the people (85%) live in scattered coastal settlementsaveraging about 50 inhabitants. The urban centres are the capital, PortVila on Efate, and Luganville on Santo, with 16,000 and 5,000 inhabitantsrespectively.
1.2 The economy is dualistic with a large subsistence agriculturalsector (80% of the work force), and a small modern sector which is domi-nated by agroprocessing industries and the public sector, as shown inTable 1.1. The modern sector also encompasses trading, shipping, tour-ism, banking (including an offshore Finance Center) and manufacturing; itaccounts for much of foreign exchange earnings and government revenue.
1.3 Pre-independence disturbances in 1980 disrupted the domesticeconomy; however, economic performance improved steadily between 1981-83,with estimated real GDP growth of about 3% p.a. in 1983. This reflects amarked increase in the production and exports of copra and expansion ofthe construction, tourism and manufacturing sectors.
1.4 In the absence of official national accounts, 1983 GDP isroughly estimated at VT 8.4 billion. This translates into per capita GDPof about US$650; however, the rural per capital income (excludingexpatriate income) is reckoned to be less than US$250. Table 1.1illustrates the dualism of the Vanuatu economy, where a small modernsector including Goverrment services provides a substantial proportion(80%) of GDP.
3/ The Condominium governed Vanuatu from 1906-1980 when it was known asthe New Hebrides.
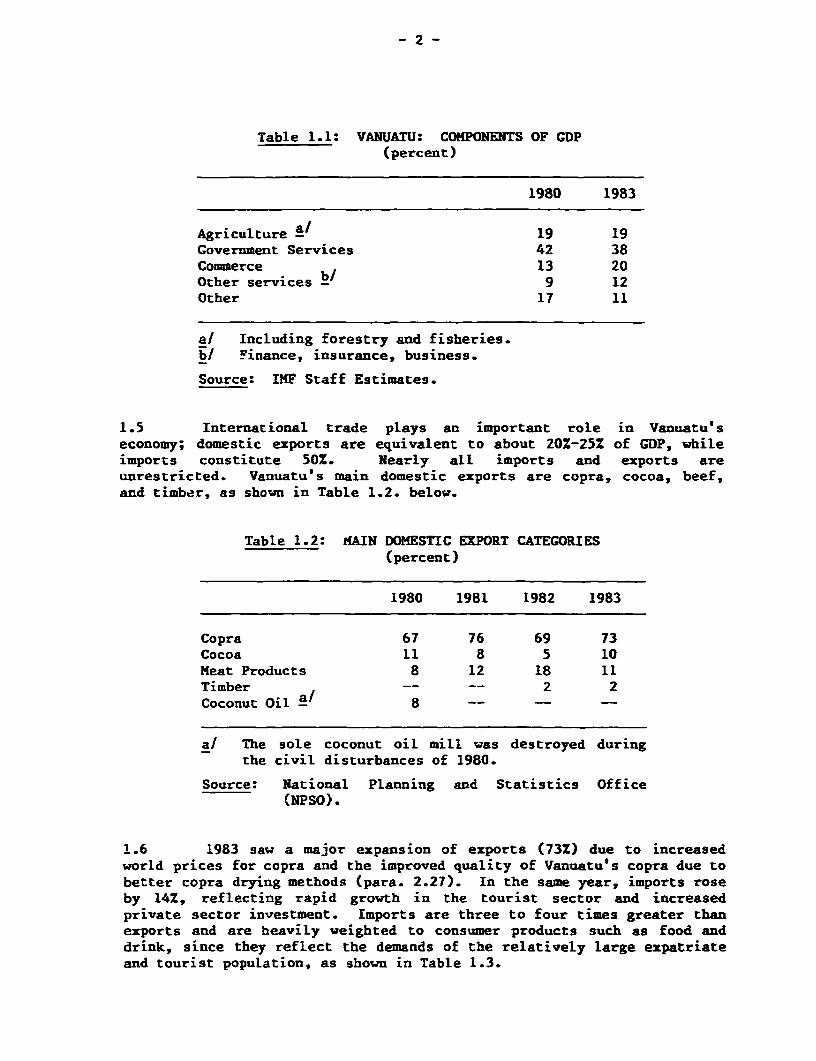
Table 1.1: VANUATU: COMPONENTS OF GDP(percent)
1980 1983
Agriculture -/ 19 19Government Services 42 38Commerce 13 20Other services -/ 9 12Other 17 11
a/ Including forestry and fisheries.h/ Finance, insurance, business.
Source: IMF Staff Estimates.
1.5 International trade plays an important role in Vanuatu'seconomy; domestic exports are equivalent to about 20Z-25Z of GDP, whileimports constitute 50%. Nearly all imports and exports areunrestricted. Vanuatu's main domestic exports are copra, cocoa, beef,and timber, as shown in Table 1.2. below.
Table 1.2: HAIN DOMESTIC EXPORT CATEGORIES(percent)
1980 1981 1982 1983
Copra 67 76 69 73Cocoa 11 8 5 10Meat Products 8 12 18 11Timber -- -- 2 2Coconut Oil a 8 -- -- --
a/ The sole coconut oil mill was destroyed duringthe civil disturbances of 1980.
Source: National Planning and Statistics Office(NPSO).
1.6 1983 saw a major expansion of exports (73%) due to increasedworld prices for copra and the improved quality of Vanuatu's copra due tobetter copra drying methods (para. 2.27). In the same year, imports roseby 14%, reflecting rapid growth in the tourist sector and increasedprivate sector investment. Imports are three to four times greater thanexports and are heavily weighted to consumer products such as food anddrink, since they reflect the demands of the relatively large expatriateand tourist population, as shown in Table 1.3.
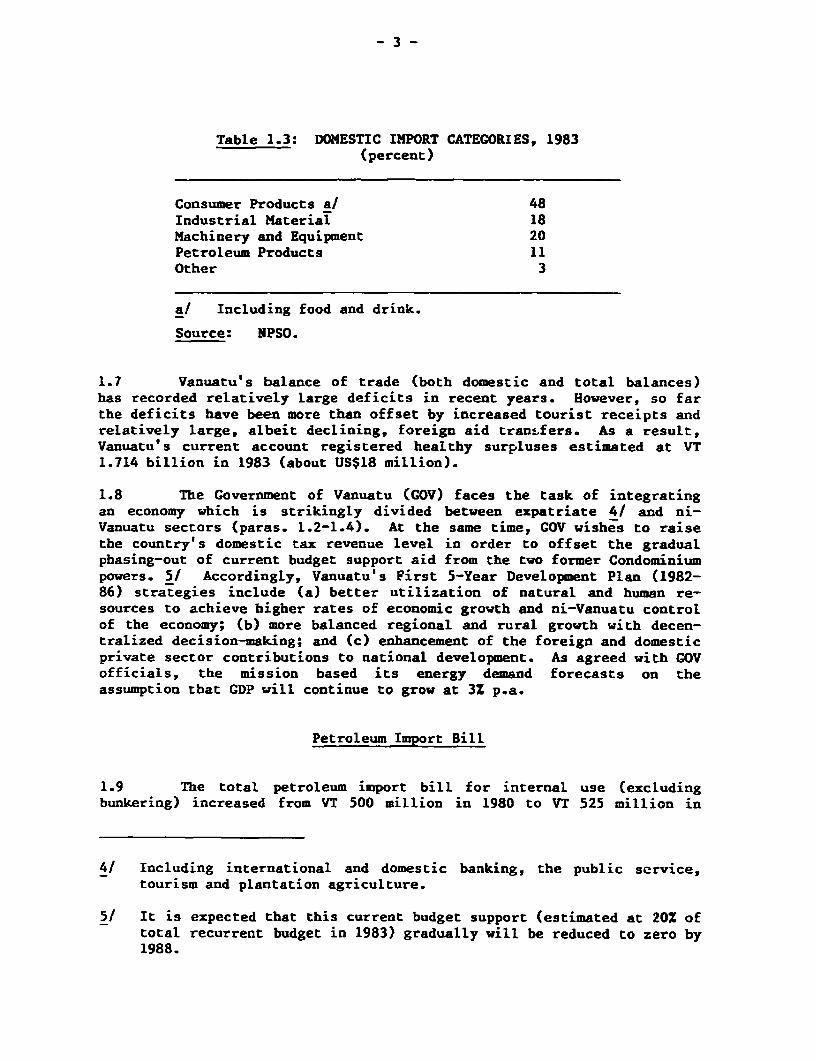
Table 1.3: DOMESTIC IMPORT CATEGORIES, 1983(percent)
Consumer Products a/ 48Industrial Material 18Machinery and Equipment 20Petroleum Products 11Other 3
a/ Including food and drink.
Source: NPSO.
1.7 Vanuatu's balance of trade (both domestic and total balances)has recorded relatively Large deficits in recent years. However, so farthe deficits have been more than offset by increased tourist receipts andrelatively large, albeit declining, foreign aid transfers. As a result,Vanuatu's current account registered healthy surpluses estimated at VT1.714 billion in 1983 (about US$18 million).
1.8 The Government of Vanuatu (GOV) faces the task of integratingan economy which is strikingly divided between expatriate 4/ and ni-Vanuatu sectors (paras. 1.2-1.4). At the same time, GOV wishes to raisethe country's domestic tax revenue level in order to offset the gradualphasing-out of current budget support aid from the two former Condominiumpowers. 51 Accordingly, Vanuatu's First 5-Year Development Plan (1982-86) strategies include (a) better utilization of natural and human re-sources to achieve higher rates of economic growth and ni-Vanuatu controlof the economy; (b) more balanced regional and rural growth with decen-tralized decision-making; and (c) enhancement of the foreign and domesticprivate sector contributions to national development. As agreed with GOVofficials, the mission based its energy demand forecasts on theassumption that GDP will continue to grow at 3% p.a.
Petroleum Import Bill
1.9 The total petroleum import bill for internal use (excludingbunkering) increased from VT 500 million in 1980 to VT 525 million in
4/ Including international and domestic banking, the public service,tourism and plantation agriculture.
5/ It is expected that this current budget support (estimated at 20% oftotal recurrent budget in 1983) gradually will be reduced to zero by1988.
- 4 -
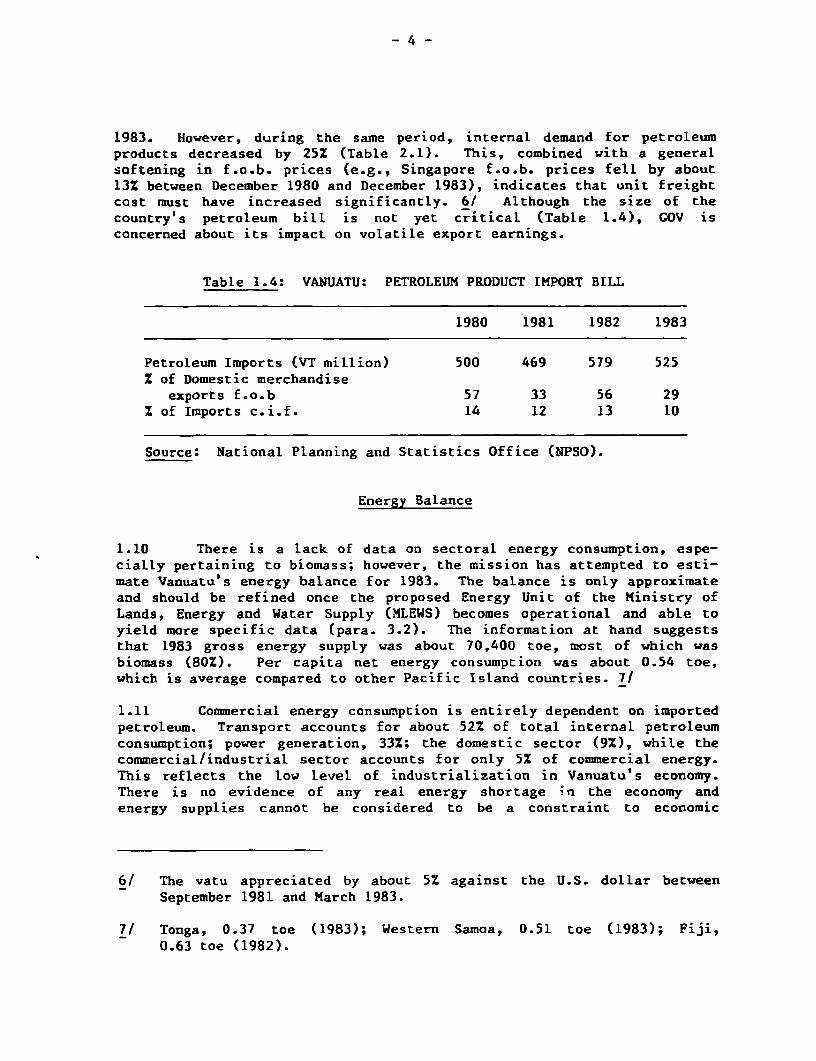
1983. However, during the same period, internal demand for petroleumproducts decreased by 25% (Table 2.1). This, combined with a generalsoftening in f.o.b. prices (e.g., Singapore f.o.b. prices fell by about13% between December 1980 and December 1983), indicates that unit freightcost must have increased significantly. 6/ Although the size of thecountry's petroleum bill is not yet critical (Table 1.4), GOV isconcerned about its impact on volatile export earnings.
Table 1.4: VANUATU: PETROLEUM PRODUCT IMPORT BILL
1980 1981 1982 1983
Petroleum Imports (VT million) 500 469 579 525Z of Domestic merchandise
exports f.o.b 57 33 56 29x of Imports c.i.f. 14 12 13 10
Source: National Planning and Statistics Office (NPSO).
Energy Balance
1.10 There is a lack of data on sectoral energy consumption, espe-cially pertaining to biomass; however, the mission has attempted to esti-mate Vanuatu' s energy balance for 1983. The balance is only approximateand should be refined once the proposed Energy Unit of the Ministry ofLands, Energy and Water Supply (MLEWS) becomes operational and able toyield more specific data (para. 3.2). The information at hand suggeststhat 1983 gross energy supply was about 70,400 toe, most of which wasbiomass (80%). Per capita net energy consumption was about 0.54 toe,which is average compared to other Pacific Island countries. 7/
1.11 Commercial energy consumption is entirely dependent on importedpetroLeum. Transport accounts for about 52% of total internal petroleumconsumption; power generation, 33%; the domestic sector (9%), while thecommercial/industrial sector accounts for only 5% of commercial energy.This reflects the low level of industrialization in Vanuatu's economy.There is no evidence of any real energy shortage Zn the economy andenergy supplies cannot be considered to be a constraint to economic
6/ The vatu appreciated by about 5% against the U.S. dollar betweenSeptember 1981 and March 1983.
7/ Tonga, 0.37 toe (1983); Western Samoa, 0.51 toe (1983); Fiji,0.63 toe (1982).
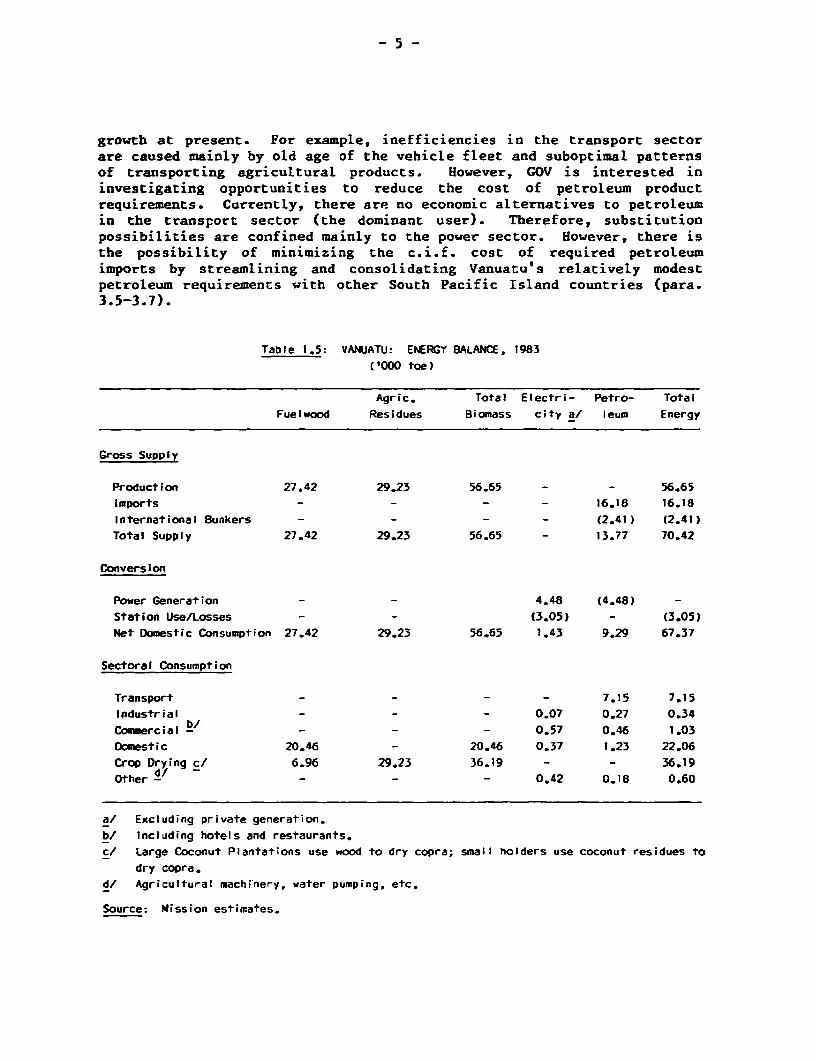
growth at present. For example, inefficiencies in the transport sectorare caused mainly by old age of the vehicle fleet and suboptimal patternsof transporting agricultural products. However, GOV is interested ininvestigating opportunities to reduce the cost of petroleum productrequirements. Currently, there are no economic alternatives to petroleumin the transport sector (the dominant user). Therefore, substitutionpossibilities are confined mainly to the power sector. However, there isthe possibiLity of minimizing the c.i.f. cost of required petroleumimports by streamlining and consolidating Vanuatu's relatively modestpetroleum requirements with other South Pacific Island countries (para.3.5-3.7).
Table 1.5: VANUATU: ENERGY BALANCE, 1983
('000 toe)
Agric. Total Electri- Petro- Total
Fuelwood Residues Biomass city a/ leum Energy
Gross Supply
Production 27.42 29.23 56.65 - - 56.65
Imports - - - - 16.18 16.18
International Bunkers - - - - (2.41) (2.41)
Total Supply 27.42 29.23 56.65 - 13.77 70.42
Conversion
Power Generation - - 4.48 (4.48) -
Station Use/Losses - - (3.05) - (3.05)
Net Domestic Consumption 27.42 29.23 56.65 1.43 9.29 67.37
Sectoral Consumption
Transport -- - - 7.15 7.15
Industrial - - 0.07 0.27 0.34
Commercial b/ - - 0.57 0.46 1.03
Domestic 20.46 - 20.46 0.37 1.23 22.06
Crop Drying c/ 6.96 29.23 36.19 - - 36.19
Other d _ - - 0.42 0.18 0.60
a/ Excluding private generation.
b/ Including hotels and restaurants.
c/ Large Coconut Plantations use wood to dry copra; small holders use coconut residues to
dry copra.d/ Agricultural machinery, water pumping, etc.
Source: Mission estimates.
-6-
Energy Balance Projections
1.12 The mission has attempted energy balance projections for 1990and 1995 based on expected GDP growth of 3% p.a. which, although crude,may serve as an indication of future maximum energy demand. The under-lying assumptions are (a) transport sector petroleum requirements willgrow at 4X due to increased tourism and agricultural product transportneeds; (b) population growth will continue at 32 p.a. with similar growthin domestic fuelwood demand; (c) biomass use for crop drying requirementswill remain stagnant as more fuel-efficient hot-air generators areintroduced; (d) power demand will grow at 5% p.a. as comercial/industrial and domestic sectors expand; (e) a woodfuel power station iscommissioned on Efate to provide base load (16 GWh by 1990); and(f) overall ADO requirements will grow by less than 2% p.a. as increasedtransport needs are offset by biomass substitution in the power sector.
1.13 As shown in Annexes 1 and 2, gross energy suppLy increases from10.42 thousand toe in 1983 to 92.08 thousand toe (1990), to 100.42thousand toe in 1995, an average annual increase of 3.0% p.a. Net energyconsumption shows an increase of only 1.8% p.a. (from 67.37 thousand toein 1983 to 83.05 thousand toe in 1995). This can be partly attributed tothe greater conversion losses involved in biomass power generation.
1.14 The major implications are that (a) imported petroleum require-ments will increase at about 2.3% p.a. as transport requirements arepartially offset by biomass power generation; and (b) biomass demand willgrow by about 3.5% p.a. as a result of population growth and biomasspower generation.
- 7 -
II. ENERGY SECTO OVERVIEW
Energy Resources
2.1 Vanuatu has a diverse energy resource base which still remainsto be fully quantified. Immediately available sources include biomass inthe form of wood and coconut residues. In the medium term, hydro,geothermal and solar resources may play a significant role. Forest coveris estimated at about 75% of total land area and, in view of the widelyscattered population, should be sufficient for national domestic andagroindustrial needs. Of particular interest is a native leucaena forestarea at Port Havannah in northwest Efate. Preliminary estimates of theresources are vague (from 900-2,000 hectares); however, it is anticipatedthat the forest will be utilized on a renewable basis to supply boilerfuel for a proposed 3 MW wood-fired power station (WFPS) planned as thenext capacity increment on the Port Vila grid. Therefore it is importantthat the leucaena forest be quantified as soon as possible (paras. 2.26-2.28; 3.24-3.25). Coconut cover in Vanuatu is estimated at 69,000 hawith a 25-50% senility factor. 8/ As a result, GOV has initiated acoconut replanting program which would be greatly assisted if an end usewere identified for the senile coconut stemwood such as boiler fuel forthe WFPS (para. 2.32).
2.2 Vanuatu's hydroelectrical potential has not yet been evaluatedto a significant extent. However, a hydrological survey program ini-tiated in 1981 and covering the major rivers and potential hydro sitesindicated that there is a medium-term possibility of economic hydrogeneration on both Efate and Santo (para. 3.31). The mission supportsGOV's wish to continue and expand its hydrological program and recommendsaccelerating investigation of hydroelectric opportunities (paras. 3.32-3.25).
2.3 Geothermal resources have been identified on the island ofEfate, on the northern coastf and in the central river valley. A three-phase investigation program was drawn up and the first phase, whichinvolved locating potential sites for geothermal drilling, has beencompleted. 9/ The temperature of the resource is relatively low (165-180). The second phase of the study will include geophysical surveys andsome shallow heat-flow drilling. Encouraging results of the second phasewould lead to a third phase including deep well drilLing. The missionconsidered this work to be relevant within Vanuatu's energy context, butnot of priority at this time. The timing of these activities is suchthat sufficient data will become available to compare to other poweralternatives such as hydro for post 1995 implementation.
8/ Coconut palms over 50 years old.
9/ Financed by the New Zealand Government.
-8-
2.4 The solar regime is apparently good, but poorly defined inVanuatu. Solar energy can have a role to pLay in small-scale, remotepower development, water-heating and crop drying. Long term monitoringof solar insolation at major population centers will prove helpful. 10/
Petroleum Sector
Historical Demand
2.5 Petroleum product imports for internal consumption consist ofliquefied petroleum gas (LPG), petrol (gasoline), illuminating paraffin(kerosene), aviation gasoline (avgas), and automotive diesel oil (ADO).Turbo jet fuel and industrial diesel oil are also imported forconsumption by international airlines and a foreign-owned, Santo-basedfishing company (South Pacific Fishing Company) respectively. However,these products are considered to be imports for re-export and theaccounts are settled externally.
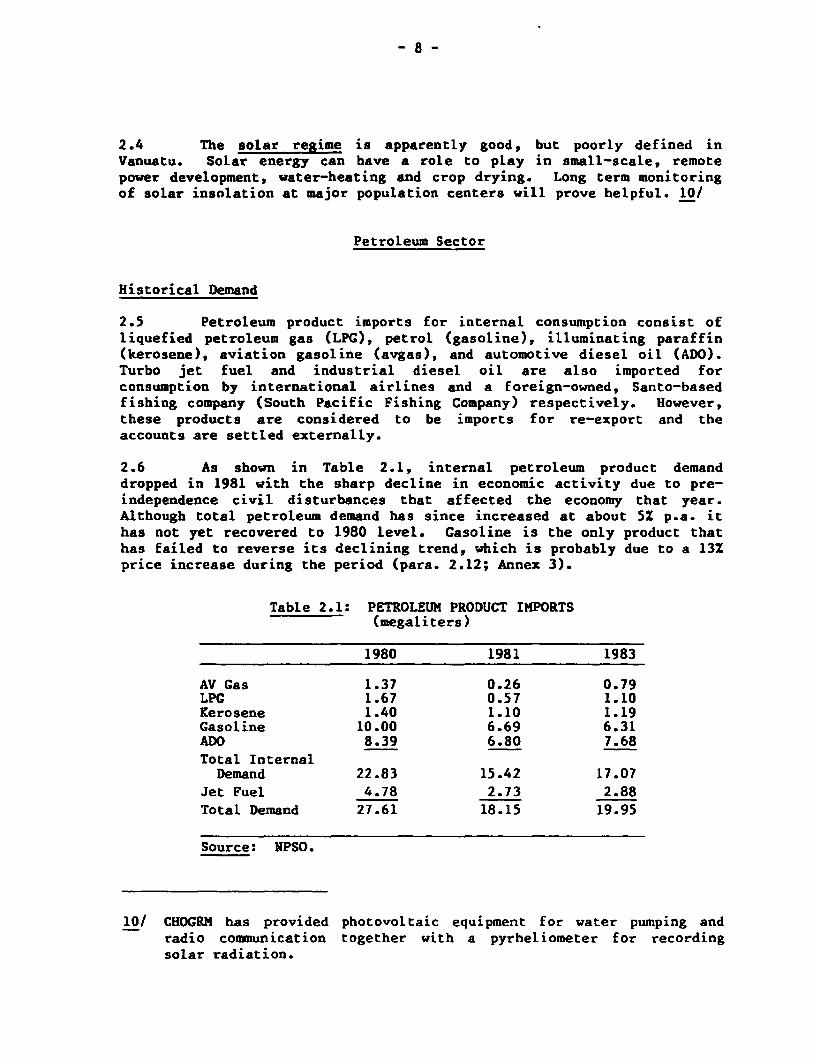
2.6 As shown in Table 2.1, internal petroleum product demanddropped in 1981 with the sharp decline in economic activity due to pre-independence civil disturbances that affected the economy that year.Although total petroleum demand has since increased at about 5% p.a. ithas not yet recovered to 1980 level. Gasoline is the only product thathas failed to reverse its declining trend, which is probably due to a 13Zprice increase during the period (para. 2.12; Annex 3).
Table 2.1: PETROLEUM PRODUCT IMPORTS(megaliters)
1980 1981 1983
AV Gas 1.37 0.26 0.79LPG 1.67 0.57 1.10Kerosene 1.40 1.10 1.19Gasoline 10.00 6.69 6.31ADO 8.39 6.80 7.68Total Internal
Demand 22.83 15.42 17.07Jet Fuel 4.78 2.73 2.88Total Demand 27.61 18.15 19.95
Source: NPSO.
10/ CHOGRM has provided photovoltaic equipment for water pumping andradio communication together with a pyrheliometer for recordingsolar radiation.
- 9 -
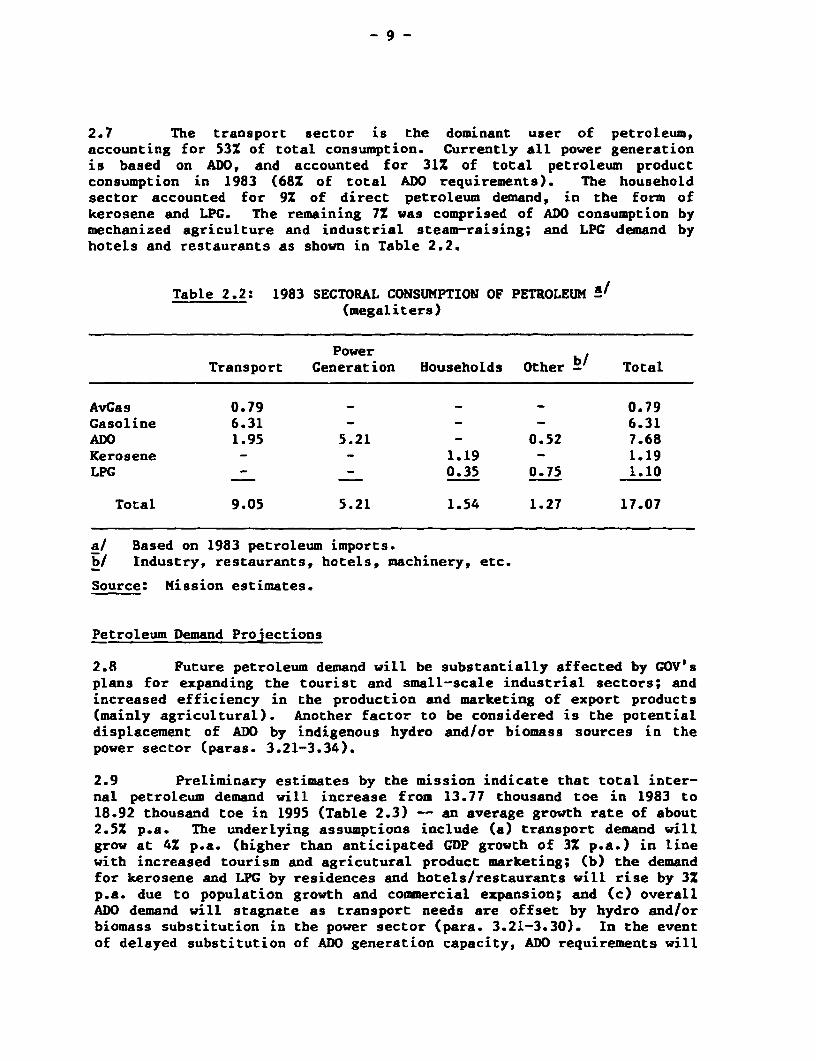
2.7 The transport sector is the dominant user of petroleum,accounting for 53X of total consumption. Currently all power generationis based on ADO, and accounted for 31% of total petroleum productconsumption in 1983 (68% of total ADO requirements). The householdsector accounted for 9Z of direct petroleum demand, in the form ofkerosene and LPG. The remaining 7X was comprised of ADO consumption bymechanized agriculture and industrial steam-raising; and LPG demand byhotels and restaurants as shown in Table 2.2.
Table 2.2: 1983 SECTORAL CONSUMPTION OF PETROLEUM a/(megaliters)
PowerTransport Generation Households Other - Total
AvGas 0.79 - - 0.79Gasoline 6.31 - - 6.31ADO 1.95 5.21 - 0.52 7.68Kerosene - - 1.19 - 1.19LPG - 0.35 0.75 1.10
Total 9.05 5.21 1.54 1.27 17.07
a/ Based on 1983 petroleum imports.b/ Industry, restaurants, hotels, machinery, etc.
Source: Mission estimates.
Petroleum Demand Projections
2.8 Future petroleum demand will be substantially affected by GOV'splans for expanding the tourist and small-scale industrial sectors; andincreased efficiency in the production and marketing of export products(mainly agricultural). Another factor to be considered is the potentialdisplacement of ADO by indigenous hydro and/or biomass sources in thepower sector (paras. 3.21-3.34).
2.9 Preliminary estimates by the mission indicate that total inter-nal petroleum demand will increase from 13.77 thousand toe in 1983 to18.92 thousand toe in 1995 (Table 2.3) - an average growth rate of about2.52 p.a. The underlying assumptions include (a) transport demand willgrow at 42 p.a. (higher than anticipated GDP growth of 3% p.a.) in linewith increased tourism and agricutural product marketing; (b) the demandfor kerosene and LPG by residences and hotels/restaurants will rise by 3%p.a. due to population growth and comuercial expansion; and (c) overallADO demand will stagnate as transport needs are offset by hydro and/orbiomass substitution in the power sector (para. 3.21-3.30). In the eventof delayed substitution of ADO generation capacity, ADO requirements will
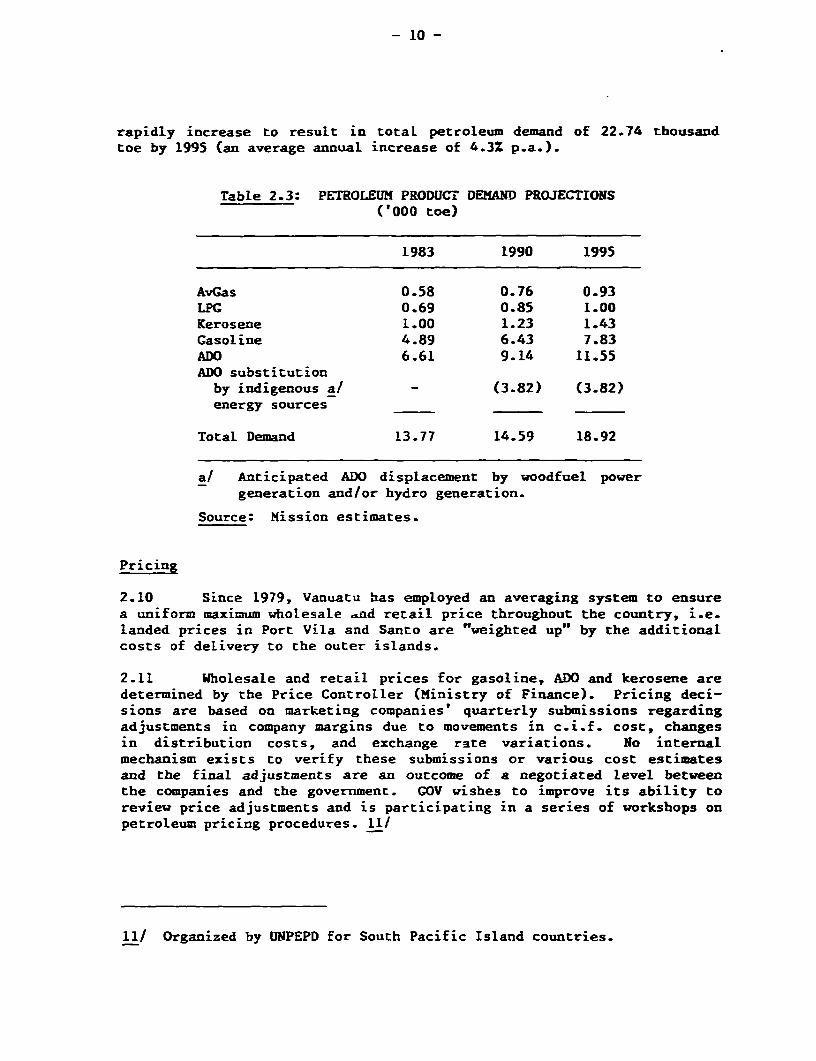
- 10 -
rapidly increase to result in total petroleum demand of 22.74 thousandtoe by 1995 (an average annual increase of 4.3Z p.a.).
Table 2.3: PETROLEUM PRODUCT DEMAND PROJECTIONS('000 toe)
1983 1990 1995
AvGas 0.58 0.76 0.93LPG 0.69 0.85 1.00Kerosene 1.00 1.23 1.43Gasoline 4.89 6.43 7.83ADO 6.61 9.14 11.55ADO substitutionby indigenous a/ - (3.82) (3.82)energy sources
Total Demand 13.77 14.59 18.92
a/ Anticipated ADO displacement by woodfuel powergeneration and/or hydro generation.
Source: Mission estimates.
Pricing
2.10 Since 1979, Vanuatu has employed an averaging system to ensurea uniform maximum wholesale .nd retail price throughout the country, i.e.landed prices in Port Vila and Santo are "weighted up" by the additionalcosts of delivery to the outer islands.
2.11 Wholesale and retail prices for gasoline, ADO and kerosene aredetermined by the Price Controller (Ministry of Finance). Pricing deci-sions are based on marketing companies' quarterly submissions regardingadjustments in company margins due to movements in c.i.f. cost, changesin distribution costs, and exchange rate variations. No internalmechanism exists to verify these submissions or various cost estimatesand the final adjustments are an outcome of a negotiated level betweenthe companies and the government. GOV wishes to improve its ability toreview price adjustments and is participating in a series of workshops onpetroleum pricing procedures. 11/
11/ Organized by UNPEPD for South Pacific Island countries.
- 11 -
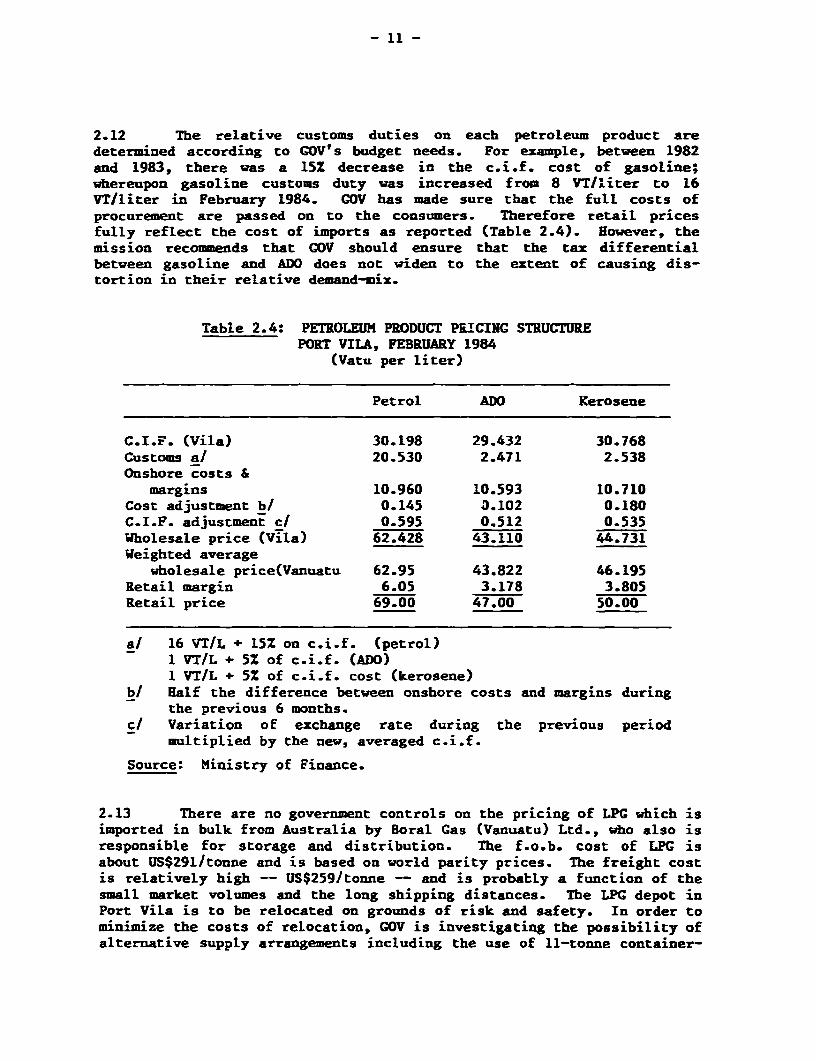
2.12 The relative customs duties on each petroleum product aredetermined according to GOV's budget needs. For example, between 1982and 1983, there was a 15Z decrease in the c.i.f. cost of gasoline;whereupon gasoline customs duty was increased from 8 VT/'Liter to 16VT/liter in February 1984. COV has made sure that the full costs ofprocurement are passed on to the consumers. Therefore retail pricesfully reflect the cost of imports as reported (Table 2.4). However, themission recommends that COV should ensure that the tax differentialbetween gasoline and ADO does not widen to the extent of causing dis-tortion in their relative demand-mix.
Table 2.4: PETROLEUM PRODUCT PRICINC STRUCTUREPORT VILA, FEBRUARY 1984
(Vatu per liter)
Petrol ADO Kerosene
C.I.F. (Vila) 30.198 29.432 30.768customs a/ 20.530 2.471 2.538Onshore costs &
margins 10.960 10.593 10.710Cost adjustment b/ 0.145 3.102 0.180C.I.F. adjustment c/ 0.595 0.512 0.535Wholesale price (Vila) 62.428 43.110 44.731Weighted average
wholesale price(Vanuatu 62.95 43.822 46.195Retail margin 6.05 3.178 3.805Retail price 69.00 47.00 50.00
ai 16 VT/L + 15% on c.i.f. (petrol)I VT/L + 5% of c.i.f. (ADO)1 VT/L + 5% of c.i.f. cost (kerosene)
b/ Half the difference between onshore costs and margins duringthe previous 6 months.
c/ Variation of exchange rate during the previous periodmultiplied by the new, averaged c.i.f.
Source: Ministry of Finance.
2.13 There are no government controls on the pricing of LPC which isimported in bulk from Australia by Boral Gas (Vanuatu) Ltd., who also isresponsible for storage and distribution. The f.o.b. cost of LPC isabout US$291/tonne and is based on world parity prices. The freight costis relatively high - US$259/tonne - and is probably a function of thesmall market volumes and the long shipping distances. The LPG depot inPort Vila is to be relocated on grounds of risk and safety. In order tominimize the costs of reLocation, GOV is investigating the possibility ofalternative supply arrangements including the use of ll-tonne container-
- 12 -
ized portable LPG tanks which could be carried as general deck cargo onmulti-cargo voyagers. LPG procurement and supply options will also beevaluated under the proposed regional petroleum product procurement andsupply analysis (paras. 3.3-3.8).
Electricity Sector
supply
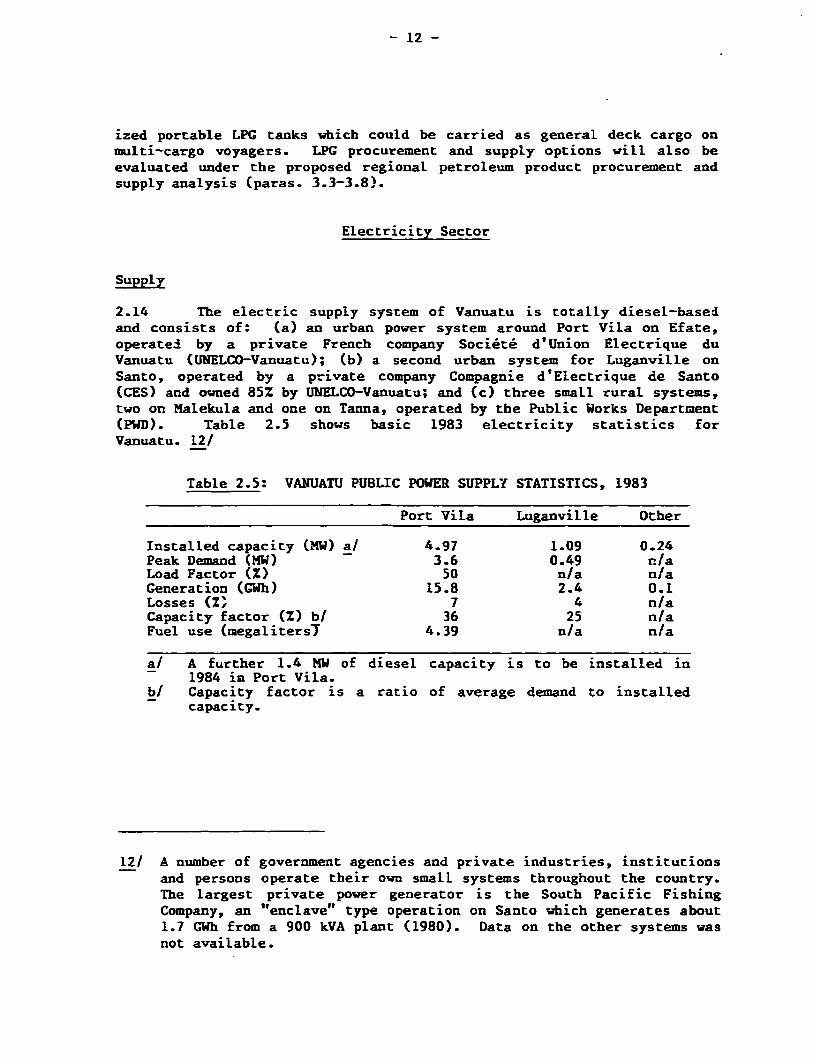
2.14 The electric supply system of Vanuatu is totally diesel-basedand consists of: (a) an urban power system around Port Vila on Efate,operated by a private French company Societe d'Union Electrique duVanuatu (UNELCO-Vanuatu); (b) a second urban system for Luganville onSanto, operated by a private company Compagnie d'Electrique de Santo(CES) and owned 85% by UNELCO-Vanuatu; and (c) three smaLl rural systems,two on Malekula and one on Tanna, operated by the Public Works Department(PWD). Table 2.5 shows basic 1983 electricity statistics forVanuatu. 12/
Table 2.5: VANUATU PUBLIC POWER SUPPLY STATISTICS, 1983
Port ViLa Luganville Other
Installed capacity (MW) a/ 4.97 1.09 0.24Peak Demand (MW) 3.6 0.49 n/aLoad Factor (Z) 50 n/a n/aGeneration (GWh) 15.8 2.4 0.1Losses (MI 7 4 n/aCapacity factor (Z) b/ 36 25 n/aFuel use (megalitersl 4.39 n/a n/a
a/ A further 1.4 MW of diesel capacity is to be installed in1984 in Port Vila.
b/ Capacity factor is a ratio of average demand to installedcapacity.
12/ A number of government agencies and private industries, institutionsand persons operate their own smalL systems throughout the country.The largest private power generator is the South Pacific FishingCompany, an "enclave" type operation on Santo which generates about1.7 GWh from a 900 kVA plant (1980). Data on the other systems wasnot available.
- 13 -
Urban Power Supply
2.15 UNELCO-Vanuatu provides reliable power to its Port Vilacustomers in a technically efficient manner. However, institutionalmodifications will be necessary to ensure that the urban public power-sector, including the Luganville system which is operated by CES (UNELCO-Vanuatu's subsidiary), is operated within the framework of nationaleconomic efficiency (paras. 3.9-3.12).
Rural Power Supply
2.16 Overall responsibility for the small power systems on Malekulaand Tanna has been transferred from the Public Works Department (PND) tothe Ministry of Lands and Energy (MLE). However, in view of its relativelack of technical capability, MLE will leave the daily operations to PWD,while retaining responsibility for electricity policy matters. Themission also recommends that PHD receive a direct allotment from ruralelectricity revenues to cover its operating costs, rather than thepresent system under which such revenues are totally incorporated intogeneral Treasury revenue.
Demand
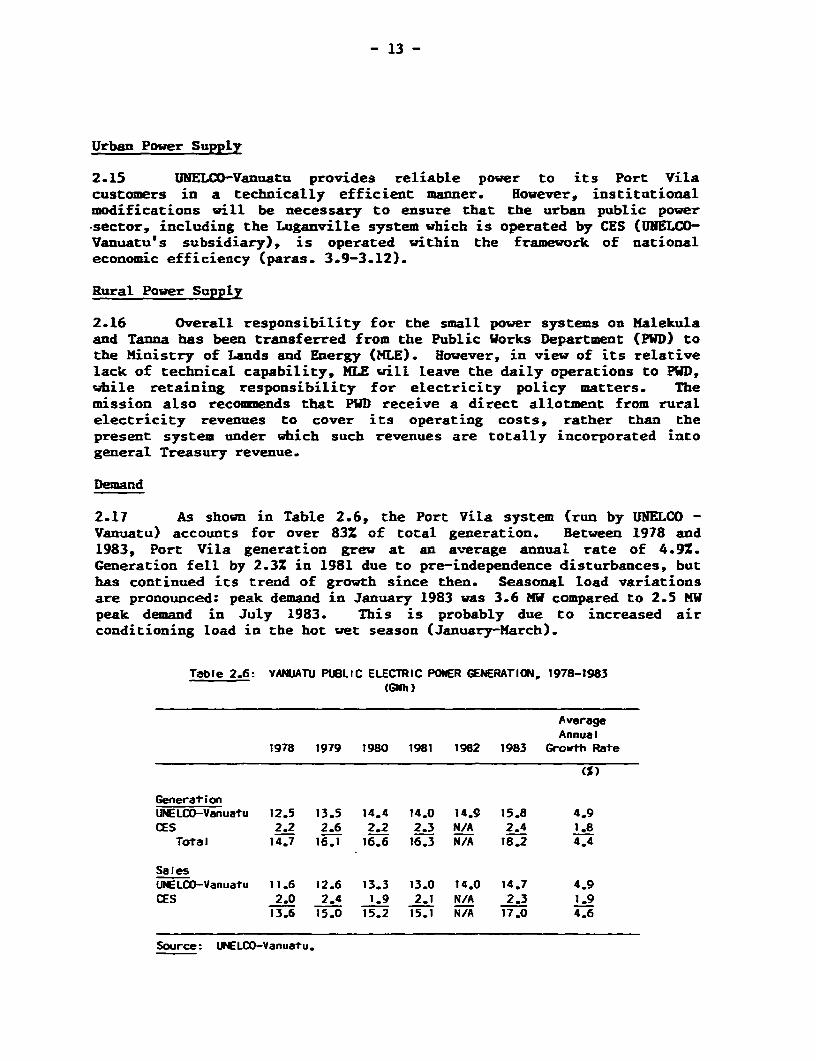
2.17 As shown in Table 2.6, the Port Vila system (run by UNELCO -Vanuatu) accounts for over 83% of total generation. Between 1978 and1983, Port Vila generation grew at an average Annual rate of 4.9x.Generation fell by 2.32 in 1981 due to pre-independence disturbances, buthas continued its trend of growth since then. Seasonal load variationsare pronounced: peak demand in January 1983 was 3.6 MW compared to 2.5 MWpeak demand in July 1983. This is probably due to increased airconditioning load in the hot wet season (January-March).
Table 2.6: VANUATU PUBLIC ELECTRIC POWER GENERATION, 1978-1983(GWh)
AverageAnnual
1978 1979 1980 1981 1982 1983 Growth Rate
(S)
GenerationUNELCO-Vanuatu 12.5 13.5 14.4 14.0 14.9 15.8 4.9CES 2.2 2.6 2.2 2.3 N/A 2.4 1.8
Total 14.7 16.1 16.6 16.3 N/A 18.2 4.4
SalesUNELCD-Vanuatu 11.6 12.6 13.3 13.0 14.0 14.7 4.9CES 2.0 2.4 1.9 2.1 N/A 2.3 1.9
13.6 15.0 15.2 15.1 N/A 17.0 4.6
Source: UNELCO-Vanuatu.
- 14 -
2.18 About 15% of urban and surburban households have access toelectricity; 80% of the electricity subscribers are foreign residents.Sales to final consumers grew by about 4.9Z in the Port Villa systembetween 1978-83. Although a breakdown of sales by sector was notavailable, GOV and its agencies are estimated to account for 25Z ofelectricity consumption. The two large hotels accounted for 15Z, whilethe water-pumping station consumed 5%. The remaining 55% was dividedbetween industry/commerce and households.
2.19 Sales on Luganville are primarily to the household sectordominated by foreign residents, and to the commercial and officialsectors. As in the Port Vila system, industrial consumption of elec-tricity is negligible. 1983 sales on Tana were about 0.04 GWh to 75consumers; Malekula sales were about 0.04 CWh to 110 consumers.
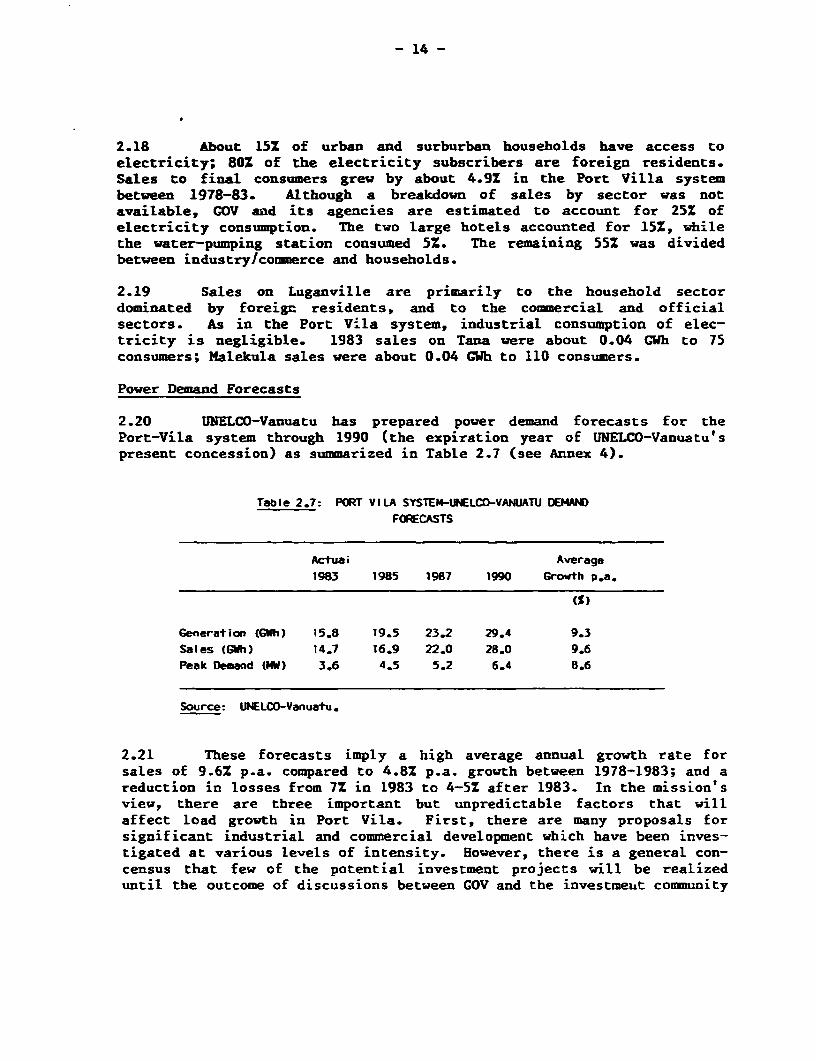
Power Demand Forecasts
2.20 UNELCO-Vanuatu has prepared power demand forecasts for thePort-Vila system through 1990 (the expiration year of UNELCO-Vanuatu'spresent concession) as summarized in Table 2.7 (see Annex 4).
Table 2.7: PORT VILA SYSTEM-tINELCO-VANUATU DEMAOFORECASTS
Actuai Average
1983 1985 1987 1990 Growth p.a.
IS)
Generation (GWh) 15.8 19.5 23.2 29.4 9.3Sales (GWh) 14.7 16.9 22.0 28.0 9.6Peak Demand (MW) 3.6 4.5 5.2 6.4 8.6
Source: LWELCO-Vanuatu.
2.21 These forecasts imply a high average annual growth rate forsales of 9.6% p.a. compared to 4.8% p.a. growth between 1978-1983; and areduction in losses from 7% in 1983 to 4-5% after 1983. In the mission'sview, there are three important but unpredictable factors that willaffect load growth in Port Vila. First, there are many proposals forsignificant industrial and commercial development which have been inves-tigated at various levels of intensity. However, there is a general con-census that few of the potential investment projects will be realizeduntil the outcome of discussions between GOV and the investmetit community
- 15 -
regarding security of tenure. 13/ Second, the uncertainity regarding theinstitutional relationship between GOV and UNELCO-Vanuatu(para. 3.9-3.12) precludes significant power sector investment by eitherparty during the remainder of the concession period. Further, the cur-rent practice of charging substantial capital contributions from poten-tial power consumers and the relatively high tariffs as perceived bysmall industrial and commercial clients (paras. 3.14-3.19) have resultedin several cases of self-generation by relatively small commercial/indus-trial establishments, with more to come, although some such decisions arebased on over-optimistic assessments of self-generation costs. 14/
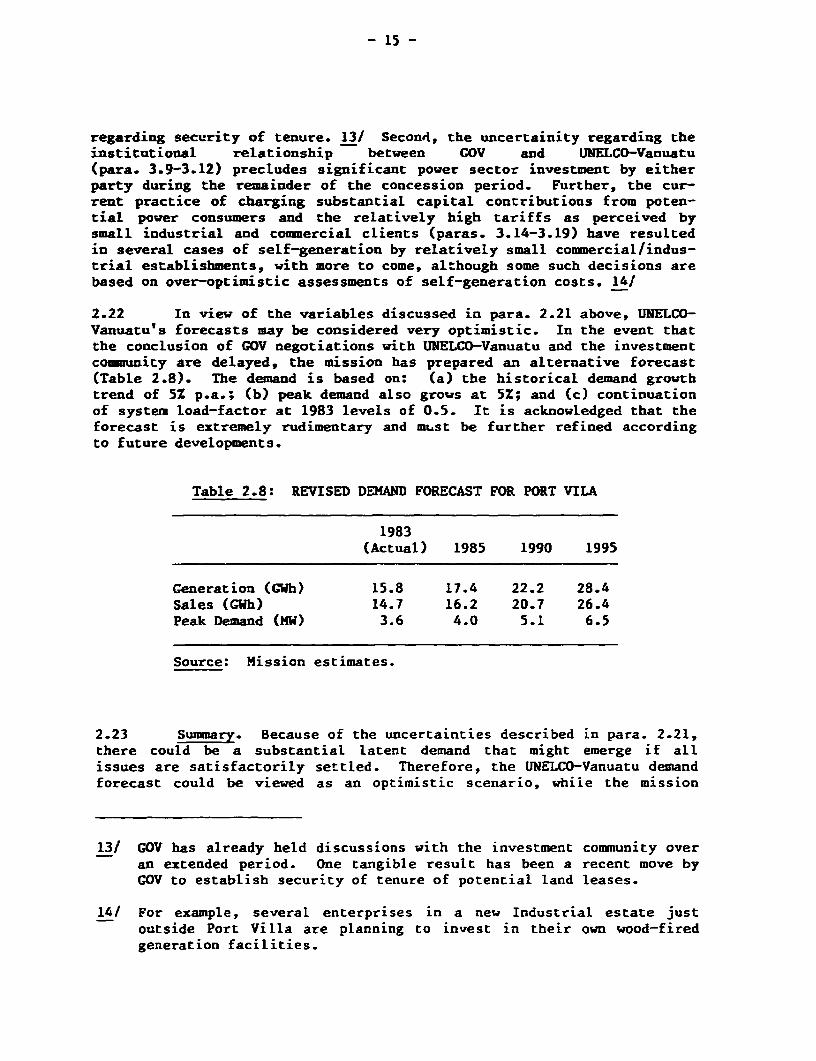
2.22 In view of the variables discussed in para. 2.21 above, UNELCO-Vanuatu's forecasts may be considered very optimistic. In the event thatthe conclusion of GOV negotiations with UNELCO-Vanuatu and the investmentcommunity are delayed, the mission has prepared an alternative forecast(Table 2.8). The demand is based on: (a) the historical demand growthtrend of 5Z p.a.; (b) peak demand also grows at 5X; and (c) continuationof system load-factor at 1983 levels of 0.5. It is acknowledged that theforecast is extremely rudimentary and must be further refined accordingto future developments.
Table 2.8: REVISED DEMAND FORECAST FOR PORT VILA
1983(Actual) 1985 1990 1995
Generation (GWh) 15.8 17.4 22.2 28.4Sales (GWh) 14.7 16.2 20.7 26.4Peak Demand (MI) 3.6 4.0 5.1 6.5
Source: Mission estimates.
2.23 Summa Because of the uncertainties described in para. 2.21,there could be a substantial latent demand that might emerge if allissues are satisfactorily settled. Therefore, the UNELCO-Vanuatu demandforecast could be viewed as an optimistic scenario, while the mission
13/ GOV has already held discussions with the investment community overan extended period. One tangible result has been a recent move byGOV to establish security of tenure of potential land leases.
14/ For example, several enterprises in a new Industrial estate justoutside Port Villa are planning to invest in their own wood-firedgeneration facilities.
- 16 -
forecast is the base-case scenario, assuming continuation of the presentsituation. According to mission forecasts, additional capacity for thePort Vila system will be required by 1985/86 (para. 3.20-3.34).
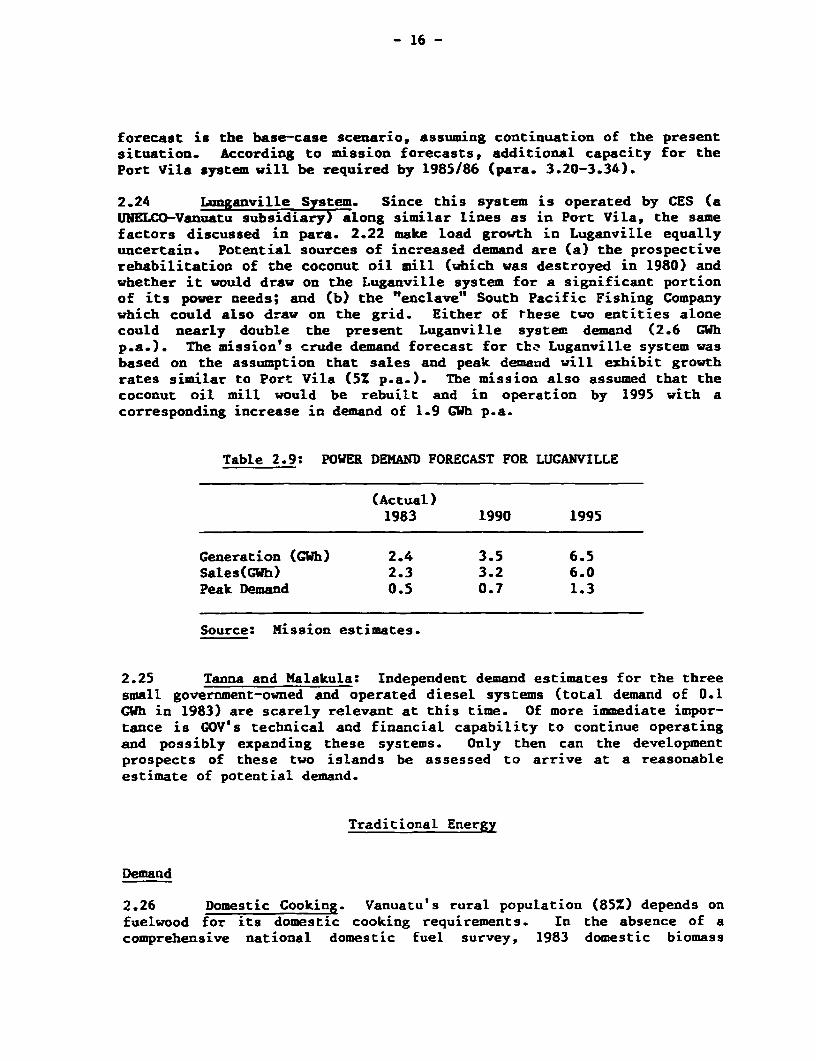
2.24 Lunganville System. Since this system is operated by CES (aUNELCO-Vanuatu subsidiary) along similar lines as in Port Vila, the samefactors discussed in para. 2.22 make load growth in Luganville equallyuncertain. Potential sources of increased demand are (a) the prospectiverehabilitation of the coconut oil mill (which was destroyed in 1980) andwhether it would draw on the Luganville system for a significant portionof its power needs; and (b) the "enclave" South Pacific Fishing Companywhich could also draw on the grid. Either of these two entities alonecould nearly double the present Luganville system demand (2.6 CWhp.a.). The mission's crude demand forecast for thb Luganville system wasbased on the assumption that sales and peak demazd will exhibit growthrates similar to Port Vila (5% p.a.). The mission also assumed that thecoconut oil mill would be rebuilt and in operation by 1995 with acorresponding increase in demand of 1.9 GWh p.a.
Table 2.9: POWER DEMAND FORECAST FOR LUGANVILLE
(Actual)1983 1990 1995
Generation (Gwh) 2.4 3.5 6.5Sales(GWh) 2.3 3.2 6.0Peak DemAnd 0.5 0.7 1.3
Source: Mission estimates.
2.25 Tanna and Malakula: Independent demand estimates for the threesmall government-owned and operated diesel systems (total demand of 0.1GWh in 1983) are scarely relevant at this time. Of more immediate impor-tance is GOV's technical and financial capability to continue operatingand possibly expanding these systems. Only then can the developmentprospects of these two islands be assessed to arrive at a reasonableestimate of potential demand.
Traditional Energy
Demand
2.26 Domestic Cooking. Vanuatu's rural population (85%) depends onfuelwood for its domestic cooking requirements. In the absence of acomprehensive national domestic fuel survey, 1983 domestic biomass
- 17 -
consumption was estimated at 62,000 tonnes. 15/ In view of the scatteredpopulation pattern, it can be assumed that most fuelwood is gathered"free' from nearby woodlots and that commercialized firewood trading isminimal. GOV wished to carry out a national household survey of domesticfuelwood consumption which, together with the results of the proposedbiomass resources inventory (para. 2.28), would indicate areas ofpotential localized fuelwood shortage and the precise requirement (ifany) for dedicated fuelwood plantations.
2.27 Crop-Drying. The major crop-drying use of biomass is in copradrying. The 1983 marketed copra production was estimated at 37,900tonnes. Currently, there are no centralized copra-drying facilities inVanuatu. Smallholder copra (77% of total production) is dried at neigh-borhood copra dryers using coconut husks and shells as fuel input; thelarge estates prefer to use wood for copra-drying and leave the husks torot in the fields. 1983 crop-drying requirements were estimated at66,430 tonnes of coconut residues (smallholder copra) and 21,100 tonnesof wood (plantation copra and cocoa drying). Until recently, the open-fire "smoke-dry" method was predominant, which led to inferior qualitycopra and depressed prices for Vanuatu's copra exports. In 1981, GOVintroduced a program to improve copra quality by using hot-air generatorsthat not only produce high quality copra, but also require less fuel in-put. 16/ By the end of 1983, hot-air dried copra comprised 15% of totaloutput. The introduction of hot-air generators is a good opportunity forlarge scale plantations to start using coconut residues instead of woodfor copra drying (paras. 2.34; 3.36-3.37).
Supply
2.28 Natural Forest. Although there is no comprehensive biomassresource inventory, there does not appear to be any short-term lack ofbiomass for present energy requirements in Vanuatu because of thedispersed nature of both the population and biomass resource. About900,000 ha (75X of total land area) is estimated to be under naturalvegetation. However, inventories of forest area and wood volumes havebeen limited to preliminary surveys in some of the better forest areas.Therefore, data on forest resources is inadequate for detailed forestplanning. COV proposes to carry out a detailed land-use/forestry inven-tory study which would provide a better picture of the size and locationof Vanuatu's forest resource.
15/ Based on the Papua New Guinea annual domestic consumption of 500 kgper capita.
16/ "Smoke-dry" methods require about 2.5 tonnes of biomass fuel pertonne of copra, while hot-air generators require between 0.5-1.0tonnes biomass/tonne of copra.
- 18 -
2.29 Sawmill/Logging Residues. According to the Forest ryDepartment, the annual productior of sawn timber is about 3000 m :Efate, 2000; m and Santo, 1000 m . Accordingly, conservative estimaresof timber by-products are about 6,000 m3 p.a. of sawmill residues and20,000 m p.a. of logging residues.
2.30 The Forestry Department has two forest plantation programs:(a) local supply plantations (LSP), typically of 200 ha each, are tosupply sawn timber for domestic needs in the various islands. Twenty-seven LSP were established between 1970-1980 and twenty-four more LSP areexpected to be implemented by 1986; and (b) industrial plantationstotalling over 10,000 ha are to be established for the timber exportmarket. Both projects are reported to be progressing well and will be amajor source of logging residues for fuelwood purposes on each individualisland concerned in the future.
2.31 Coconut residues. Coconut coverage in Vanuatu is estimated at69,000 ha, of which 47,000 ha are smallholdings; the remaining 22,000 haare large plantation estates mostly located on Santo. 1983 marketedcopra production was estimated at 37,900 tonnes. 17/ Smallholdersproduced 29,200 tonnes and the estates accounted for the remaining 8,700tonnes. Assuming that one tonne of copra is equivalent to 3.5 tonnes ofcoconut husk and shell, the annual husk/shell resource is estimated at132,000 tonnes. Approximately 66,500 tonnes of this resource is used fordecentralized copra drying. The remaining 65,000 tonnes could be avail-able for alternative fuel purposes.
2.32 Coconut Stemnwood. About 25X of the coconut groves are con-sidered senile (over 50 years old) and another 25% will enter this groupduring the next 20 years. COV realized the negative effect such a largepercentage of senile trees would have on overall coconut productivity andestablished a coconut development project in 1982. Its objective is toencourage the planting of improved coconut species at an annual rate of390 ha (1982/83), rising to 1,000 ha by 1985/86. This project would begreatly assisted if a use was identified to encourage removal of thesenile trees. Since coconut stemwood's resistance to "chipping" rendersit unsuitable for domestic energy, another alternative would be as a fuelinput for wood-fired steam plant on Efate (para. 3.24-3.25).
Biomass Supply and Demand Projections
2.33 In view of Vanuatu's substantial forest resource and the wide-spread distribution pattern of the population in coastal villagesthroughout its 80 islands, it is not likely that fuelwood shortages willbe created in the foreseeable future, especially for the domestic cookingand copra drying sectors.
17/ Domestic consumption of coconuts was reckoned to be about 8,000tonnes of copra equivalent.
- 19 -
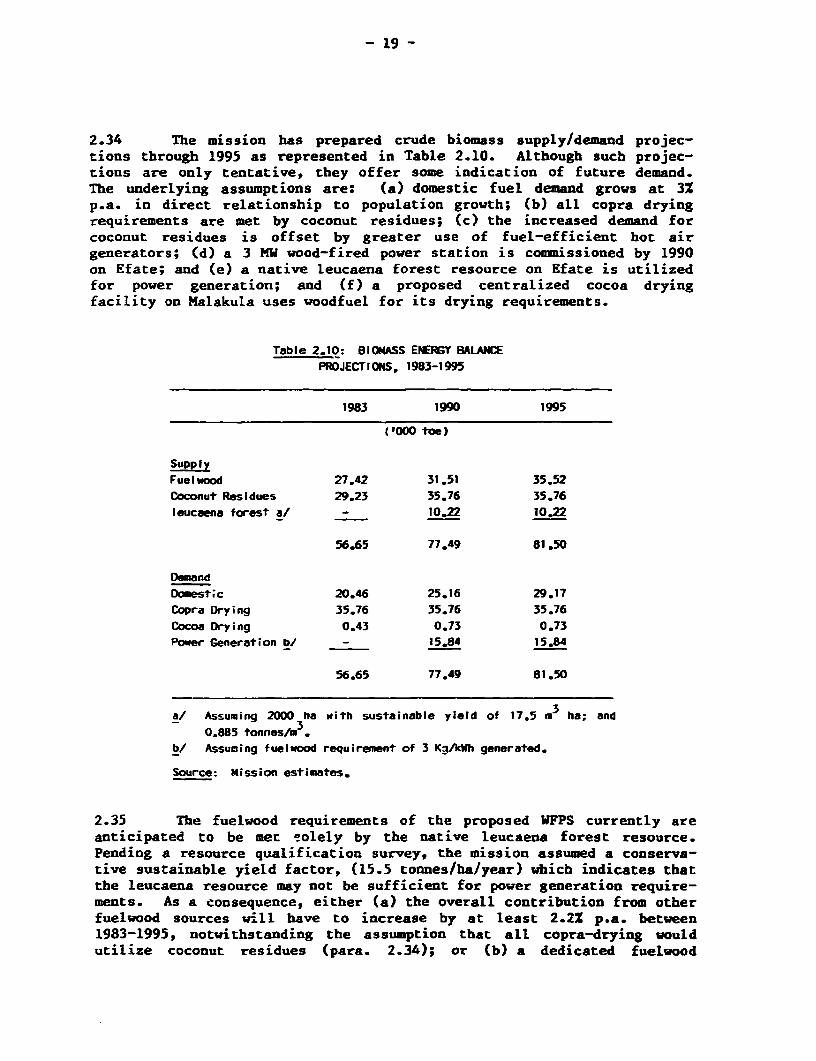
2.34 The mission has prepared crude biomass supply/demand projec-tions through 1995 as represented in Table 2.10. Although such projec-tions are only tentative, they offer some indication of future demand.The underlying assumptions are: (a) domestic fuel demand grows at 3%p.a. in direct relationship to population growth; (b) all copra dryingrequirements are met by coconut residues; (c) the increased demand forcoconut residues is offset by greater use of fuel-efficient hot airgenerators; (d) a 3 MW wood-fired power station is commissioned by 1990on Efate; and (e) a native leucaena forest resource on Efate is utilizedfor power generation; and (f) a proposed centralized cocoa dryingfacility on Malakula uses woodfuel for its drying requirements.
Table 2.10: BIOMASS ENERGY BALANCEPROJECTIONS, 1983-1995
1983 1990 1995
('000 toe)
Supply
Fuelwood 27.42 31.51 35.52
Coconut Residues 29.23 35.76 35.76
leucaena forest a/ - 10.22 10.22
56.65 77.49 81.50
Oemand
Domest;c 20.46 25.16 29.17
Copra Drying 35.76 35.76 35.76
Cocoa Drying 0.43 0.73 0.73
Power Generation bl - 15.84 15.84
56.65 77.49 81.50
a/ Assuming 2000 ha with sustainable yield of 17.5 n3 ha; and
0.885 tonnes/m.
b/ Assuning fuelwood requirement of 3 KA/kWh generated.
Source: Mission estimates.
2.35 The fuelwood requirements of the proposed WFPS currently areanticipated to be mer !olely by the native leucaena forest resource.Pending a resource qualification survey, the mission assumed a conserva-tive sustainable yield factor, (15.5 tonnes/ha/year) which indicates thatthe leucaena resource may not be sufficient for power generation require-ments. As a consequence, either (a) the overall contribution from otherfuelwood sources will have to increase by at least 2.2Z p.a. between1983-1995, notwithstanding the assumption that all copra-drying wouldutilize coconut residues (para. 2.34); or (b) a dedicated fuelwood
- 20 -
plantation would have to be established for WPFS with resultant increasesin the delivered cost of fuelwood to the WFPS. Therefore, it isimportant that the resource be quantified as soon as possible as part ofan overall feasibility study (para. 3.30). Another option which was notdirectly addressed during the mission would be to use that proportion ofEfate's senile coconut stemwood resource that is within economic distancefrom the WFPS in an effort to reduce the need for a dedicated fuelwoodplantation.
- 21 -
III. ISSUES AND OPTIONS
Introduction
3.1 Vanuatu' s energy resource endowment for the medium term is sub-stantial but requires further quantification. Natural vegetation isestimated at 75Z of total land area and is considered adequate for theneeds of the widely dispersed population, especially in view of ongoingplantation programs. As far as large-scale projects such as the proposedWFPS wood-fired power station are concerned, the major obstacle will benot so much the theoretical availability of biomass, but the land-tenuresystem which is based on communaL or traditional ownership. 18/ Thisimplies that procurement of large quantities of biomass will be dependenton successful lease negotiation with customary land owners. In themedium term, there is the strong possibiLity of commercial hydrogeneration on the two major islands, Efate and Santo Espiritu.Hydrocarbon exploration in the offshore waters is continuing; and thereis a geothermal investigation program for Efate. However, in the short-term, petroleum displacement options are mainly confined to biomass inthe power sector and Vanuatu will continue to rely on imports for itspetroleum requirements.
3.2 Certain essential ingredients of a national energy policy stemfrom these considerations. Of immediate concern are (a) the evaluationof least-cost petroleum product supply options; (b) the operation of thepower sector within the context of national economic efficiency; (c) thepotential for partial displacement of ADO by indigenous energy resourcesin power generation; (d) acceleration of hydropower development investi-gations; and (e) continued efficient use of biomass residues in the agro-processing industries. The medium to long-term aspects involve develop-ment of indigenous energy resources, particularly geothermal and hydro-carbons. It is expected that the incoming ADB-funded Energy Advisor tothe Ministry of Lands and Energy (MLE) will work in close cooperationwith the economic planning authorities (National Planning and StatisticsOffice) to formulate an overall energy policy within Vanuatu's macro-economic framework.
Petroleum Supply Arrangements
3.3 The liquid petroleum product market in Vanuatu is shared amongthree major oil companies that are directly responsible for importation,internal storage and distribution: Shell and Mobil on Santo; and Shell,Mobil and British Petroleum on Efate. Total storage capacity is 8,423
18/ Since independence in 1980.
- 22 -
tonnes, representing about 160 days demand coverage (at 1983 demandlevels) which is adequate for most situations.
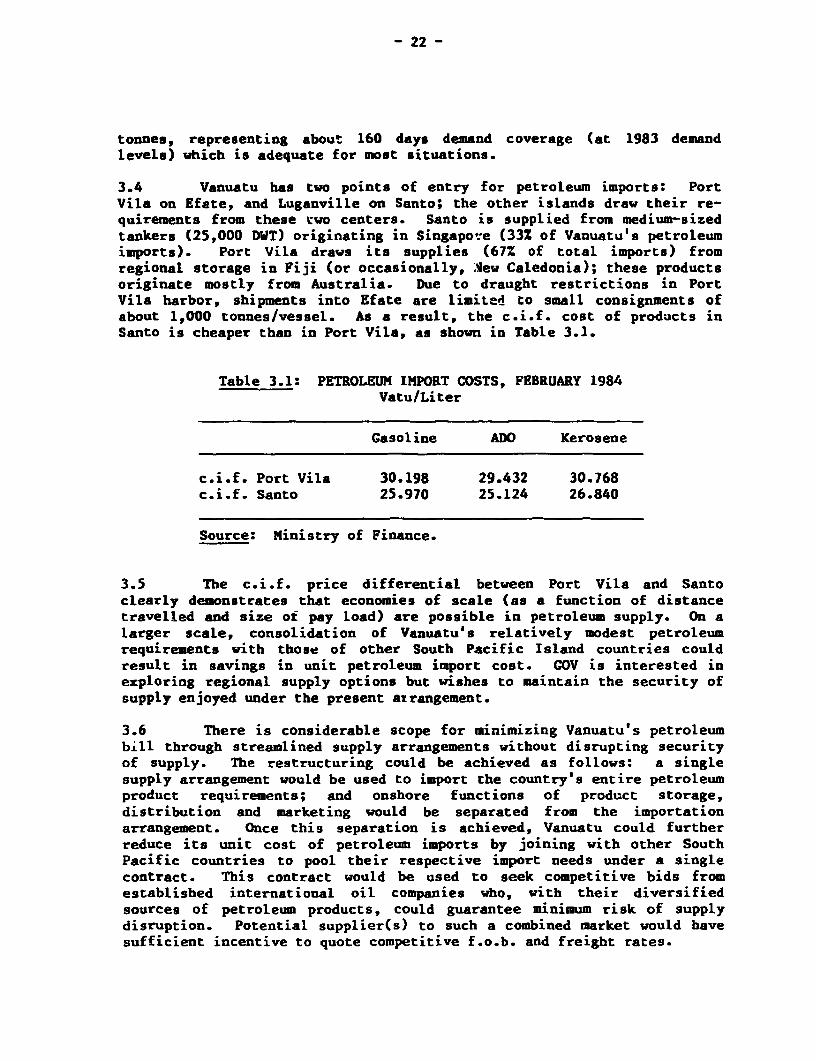
3.4 Vanuatu has two points of entry for petroleum imports: PortVila on Efete, and Luganville on Santo; the other islands draw their re-quirements from these cwo centers. Santo is supplied from medium-sizedtankers (25,000 DIT) originating in Singapore (33X of Vanuatu's petroleumimports). Port Vila draws its supplies (67% of total imports) fromregional storage in Fiji (or occasionally, ;Yew Caledonia); these productsoriginate mostly from Australia. Due to draught restrictions in PortVila harbor, shipments into Efate are limited to small consignments ofabout 1,000 tonnes/vessel. As a result, the c.i.f. cost of products inSanto is cheaper than in Port Vila, as shown in Table 3.1.
Table 3.1: PETROLEUM IMPORT COSTS, FEBRUARY 1984Vatu/Liter
Gasoline ADO Kerosene
c.i.f. Port Vila 30.198 29.432 30.768c.i.f. Santo 25.970 25.124 26.840
Source: Ministry of Finance.
3.5 The c.i.f. price differential between Port Vila and Santoclearly demonstrates that economies of scale (as a function of distancetravelled and size ot pay load) are possible in petroleum supply. On alarger scale, consolidation of Vanuatu's relativeLy modest petroleumrequirements with those of other South Pacific Island countries couldresult in savings in unit petroleum import cost. GOV is interested inexploring regional supply options but wishes to maintain the security ofsupply enjoyed under the present azrangement.
3.6 There is considerable scope for minimizing Vanuatu's petroleumbill through streamlined supply arrangements without disrupting securityof supply. The restructuring could be achieved as follows: a singlesupply arrangement would be used to import the country's entire petroleumproduct requirements; and onshore functions of product storage,distribution and marketing would be separated from the importationarrangement. Once this separation is achieved, Vanuatu could furtherreduce its unit cost of petroleum imports by joining with other SouthPacific countries to pool their respective import needs under a singlecontract. This contract would be used to seek competitive bids fromestablished international oil companies who, with their diversifiedsources of petroleum products, could guarantee minimum risk of supplydisruption. Potential supplier(s) to such a combined market would havesufficient incentive to quote competitive f.o.b. and freight rates.
- 23 -
3.7 The mechanism involved in such a regional petroleum procurementwould need to be worked out jointly between participating Pacific coun-tries. Therefore, as a first step the mission recommends a proposedtechnical assistance mission to six South Pacific countries: Vanuatu,Fiji, Papua New Guinea, Solomon Islands, Tonga and Western Samoa, whichtogether account for more than 95% of South Pacific petroleumrequirements 19/ -- about 1,160 megaliters in 1981. 20/ According topreliminary estimates, freight costs could be reduced by 5-10% bydeveloping an optimum regional procurement strategy. 21/
3.8 The primary objectives of the technical assistance missionwhich will be financed and executed by the joint UNDP/World Bank EnergySector Management Assistance Program (ESMAP) will be to: (a) reviewpreviously completed preliminary studies; 22/ (b) examine current supplyand transport arrangements; (c) identify and evaluate the economicfeasibility of alternative procurement options; (d) determine the optimalleast-cost combination of procurement and transport logistics; and(e) define medium-term technical assistance and training requirements toenable government agencies to implement the recommended option (Annex10).
Power Sector Administration
Background
3.9 Under a 1939 agreement, the Condominium powers granted UNELCO amonopoly concession to supply public power in Port Vila and its ;uwediatesurroundings. This agreement was renewed in 1976 for a 14-jear periodending in 1990. By decision of cabinet (GOV) of November 1982, UNELCOwas authorized to transfer the concession agreement and its associated"Cahier des Charges" to the newly-formed power utility UNELCO-Vanuatu,which is owned by UNELCO and one of its subsidiary companies, Soc van, ina ratio of 7:3. Similarly, Luganville (on Santo) is supplied wiLh powerby CES (owned 85Z by UNELCO-Vanuatu). However, Luganville powe- supplyis not covered by the original concession agreement which pertained onlyto Port Vila. The position of the Government of independent Vanuatu withrespect to the Agreement has not yet been clarified. An official pre-
19/ UNDP/IBRD Energy Assessment missions have made similarrecoumeiedations for all six countries.
20/ Most of this is accounted for by Papua New Guinea (56%) and Fiji(28%).
21/ East-West Center (Hawaii).
22/ Carried out by UNPEPD (Fiji) and the East-West Center.
- 24 -
independence statement indicated GOV's desire to re-negotiate the termsof the Agreement. Since then GOV has received advice regarding possiblerenegotiatiGns of the Agreement. 23/ However, to date no formal dis-cussions have taken place.
Concession Agreement
3.10 The principal features of the agreement are: (a) theconcessionaire has exclusive rights to produce and supply public elec-tricity in the Port Vila area until 1990; (b) the concessionaire isresponsible for financing all investments in generation facilities, butonly a portion of the distribution facilities; 24/ (c) tariffs would bedetermined on a tax-exempt basis and would be revised every 6 months,according to an agreed formula; (d) the concessionaire would keep finan-cial accounts according to French law which would be subject to verifica-tion by an external auditor appointed by the concessionaire; (e) in addi-tion to normal depreciation, an additional charge ("caducite") will applytc all investments financed by the concessionaire, revalued annually, tofaciliate recovery of funds at expiry of the concession; (f) subject totwo years' notice the Government may at any time "repurchase" the conces-sion by reimbursing the concessionaire for the undepreciated value ofconcessionaire-financed facilities and for loss of profits over theremaining life of the concession. Finally, the agreement stated thatshould a subsequent government of Vanuatu (after independence) repudiatethe concession, the Condominium powers would be obliged to recompensatethe concessionaire. 25i
3.11 In the mission's view, the 1976 Agreement is deficient in twomain aspects. First, although it is stipulated that the concessionaireshall keep financial accounts, there is no provision for submission ofsuch accounts to the national authorities. 26/ Thus, accordingly,UNELCO-Vanuatu does not submit its detailed accounts for inspection by
23/ "Report on Electricity Supply" November 1981, Cooper and LybrandAssociates. This report was sponsored by the United Nations Centreon Transnational Corporation (UNCTC).
241 Approximately 25% of the cost of total distribution facilities. Therest is financed by public and private consumers as a condition forconnection to the grid.
25/ Sources: 1976 Concession Agreement, "Cahier des Charges" (1976);"Report on Vanuatu Electricity Supply" (1981).
26/ These are defined as the Condominium powe-rs (1976-1980); and GOVthereafter.
- 25 -
GOV or its representatives, 271 nor does GOV have the right to approvethe selection of UNELCD-Vanuatu's external auditor. Second, there are noestablished channels of commnunication between GOV (the natioval autho-rity) and UNELCO-Vanuatu (the monopoly concessionaire) to ensure that thenational power system is operated in accordance with the Agreement and inan economically efficient manner from a national viewpoint with regard tosuch matters as electricity pricing, tariff structure and systemexpansion.
3.12 In principle, operation and partial financing of the publicpower system in Vanuatu by a competent private foreign company is anattractive proposition in view of the present scarcity of skilled tech-nical and managerial resources. However, the institutional relationshipbetween GOY and Unelco-Vanuatu should be regularized as soon as possiblebefore the existing concession expires. The mission recomends that GOVseek technical assistance to pursue discussions with UNELCO-Vanuaturegarding a modified agreement that is equitable to both parties.Important factors to be considered should include: (a) the desirabilityof maintaining the involvement of UNELCO-Vanuatu as an investor in thepower sector; (b) formulation of guidelines for future generation anddistribution of electricity; and (c) determination of the economic costof electricity supply (para. 3.13-3.18).
Electricity Tariffs
3.13 Port Vila. UNELCO-Vanuacu does not publish financial state-ments, nor are such statements submitted to GOV. In the absence of otherinformation, the mission has attempted to estimate the economic cost ofpower generation in the Port Vila system based on expansion of dieselcapacity since diesel plants will continue to be operated at the margin,at all times of the day, despite projected investments in non-dieselcapacity. As shown in Table 3.2, the mission estimated the economicgeneration cost at about 11 VT/kWh.
3.14 The current UNETCO-Vanuatu tariff for Port Vila is shown inAnnex 6 and suumarized in Table 3.3. Economic efficiency criteria forallocating scarce resources indicate that tariffs should be structured,so that consumers pay the full economic cost of supply. In practice,other factors must also be considered, especially social objectives andthe financial viability of the power utility. In the absence of data onthe economic costs of transmission and distribution as well as consumer-related costs, only very broad observations can be made about the currenttariff levels. Further, no detailed information was made available onthe consumption patterns of different consumer groups e.g., daily load
27/ UNELCO-Vanuatu does submit a brief statistical report on an annualbasis which provides little information for control purposes.
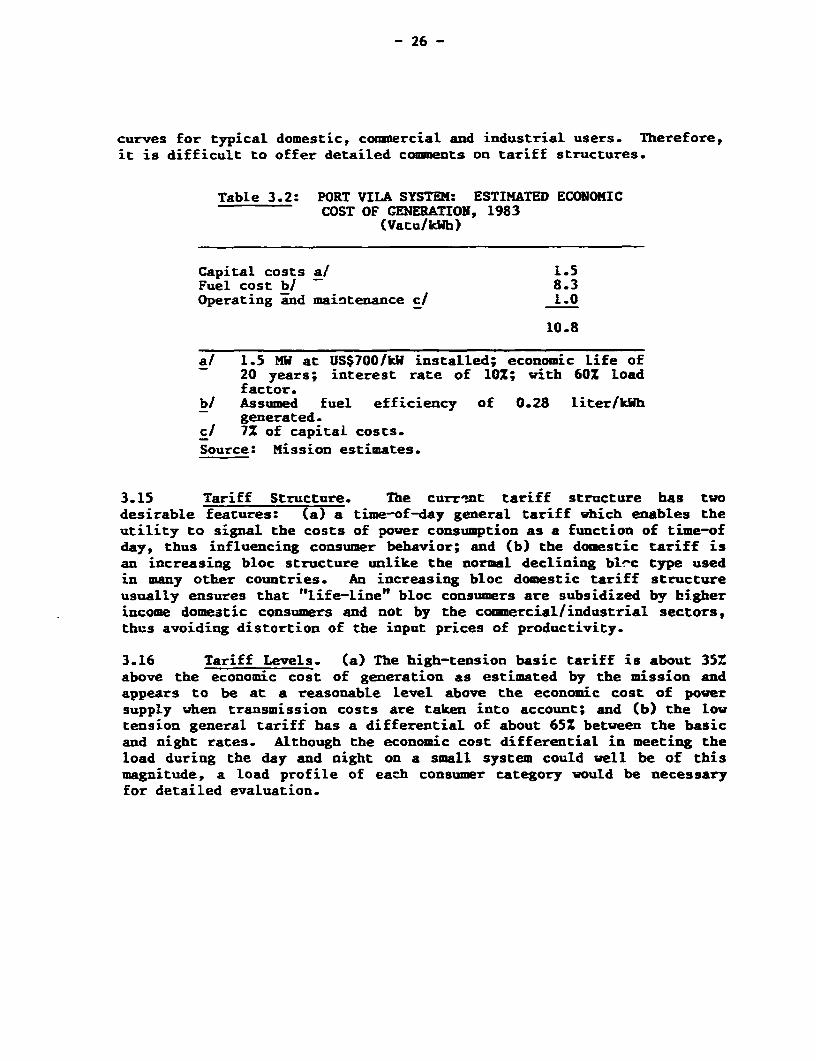
- 26 -
curves for typical domestic, commercial and industrial users. Therefore,it is difficult to offer detailed comments on tariff structures.
Table 3.2: PORT VILA SYSTEM: ESTIMATED ECONOMICCOST OF GENERATION, 1983
(Vatu/kWh)
Capital costs a/ 1.5Fuel cost b/ - 8.3Operating and maintenance c/ 1.0
10.8
a/ 1.5 MW at US$700IkW installed; economic life of20 years; interest rate of 10%; with 60% loadfactor.
bl Assumed fuel efficiency of 0.28 liter/kWhgenerated.
ci 7% of capital costs.Source: Mission estimates.
3.15 Tariff Structure. The curr-nt tariff structure has twodesirable features: (a) a time-of-day general tariff which enables theutility to signal the costs of power consumption as a function of time-ofday, thus influencing consumer behavior; and (b) the domestic tariff isan increasing bloc structure unlike the normal declining bl-c type usedin many other countries. An increasing bloc domestic tariff structureusually ensures that "Life-line" bloc consumers are subsidized by higherincome domestic consumers and not by the commercial/industrial sectors,thus avoiding distortion of the input prices of productivity.
3.16 Tariff Levels. (a) The high-tension basic tariff is about 35%above the economic cost of generation as estimated by the mission andappears to be at a reasonable level above the economic cost of powersupply when transmission costs are taken into account; and (b) the lowtension general tariff has a differential of about 65% between the basicand night rates. Although the economic cost differential in meeting theload during the day and night on a small system could well be of thismagnitude, a load profile of each consumer category would be necessaryfor detailed evaluation.
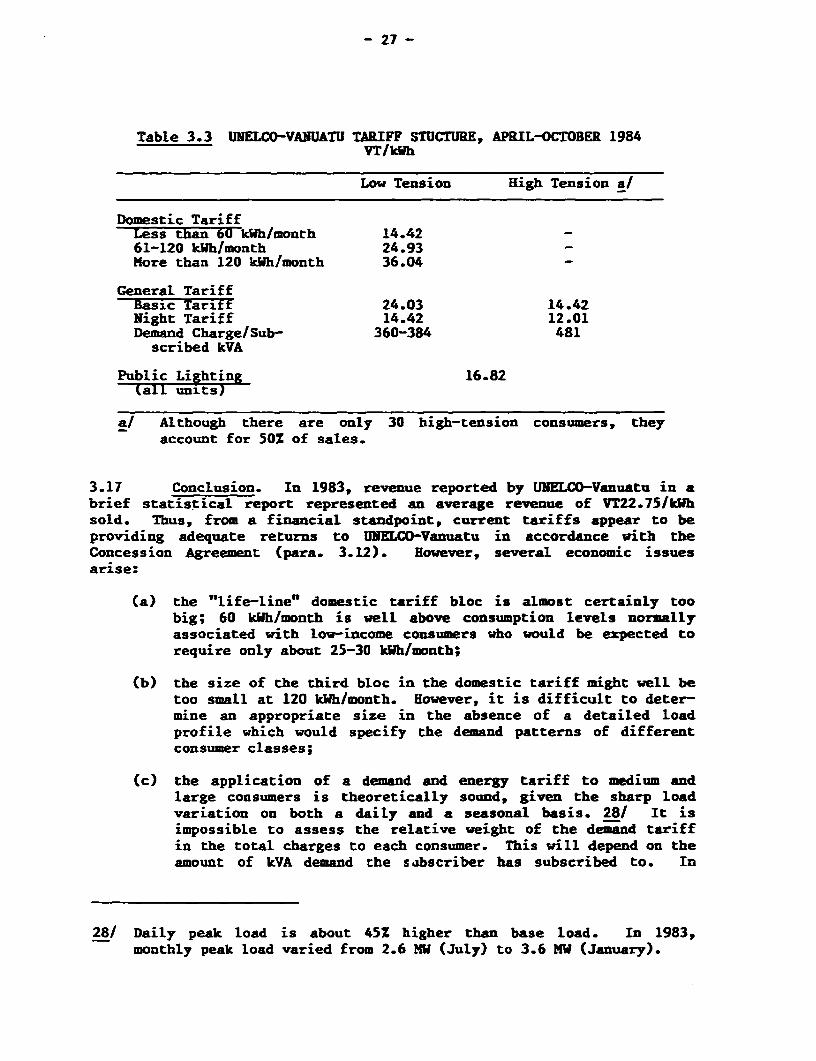
- 27 -
Table 3.3 UNELCO-VANUATU TARIFF STUCTURE, APRIL-OCTOBER 1984VT/kWh
Low Tension High Tension a/
Domestic TariffLess than 60 kWh/month 14.4261-120 kWh/month 24.93More than 120 kWh/month 36.04 -
General TariffBasic TarxTt 24.03 14.42Night Tariff 14.42 12.01Demand Charge/Sub- 360-384 481scribed kVA
Public Lighting 16.82(all units)}
a/ Although there are only 30 high-tension consumers, theyaccount for 50% of sales.
3.17 Conclusion. In 1983, revenue reported by UNELCO-Vanuatu in abrief statistical report represented an average revenue of VT22.75/1khsold. Thus, from a financial standpoint, current tariffs appear to beproviding adequate returns to UNELCD-Vanuatu in accordance with theConcession Agreement (para. 3.12). However, several economic issuesarise:
(a) the "life-line' domestic tariff bloc is almost certainly toobig; 60 kWh/month is well above consumption levels normallyassociated with low-income consumers who would be expected torequire only about 25-30 kWhfmonth;
(b) the size of the third bloc in the domestic tariff might well betoo small at 120 kWh/month. However, it is difficult to deter-mine an appropriate size in the absence of a detailed loadprofile which would specify the demand patterns of differentconsumer classes;
(c) the application of a demand and energy tariff to medium andlarge consumers is theoretically sound, given the sharp loadvariation on both a daily and a seasonal basis. 28/ It isimpossible to assess the relative weight of the demand tariffin the total charges to each consumer. This will depend on theamount of kVA demand the sabscriber has subscribed to. In
28/ Daily peak load is about 45% higher than base load. In 1983,monthly peak load varied from 2.6 MW (July) to 3.6 KW (January).
- 28 -
1983, a total of 12,559 kVA was subscribed to, which is highcompared to the peak demand of 3.6 MW which includes the peakdemand from the small domestic consumers. This suggests thatmany consumers are subscribing to a high artificial demandwhich bears little relationship to their actual demand.
3.18 In order to ensure that decisions about future system expansionreflect economic efficiency criteria, the mission recommends that GOV andUNELCO-Vanuatu undertake a joint analysis of the economic costs of powersupply on the Port Vila system (Annex 10).
3.19 Other. In the absence of any relevant financial informationabout the Luganville system, the mission could only assume that itseconomic supply costs are likely to be higher on a per unit basis than inPort Vila (20-25%) since it is a smaller system using less fuel efficientengines. At the PWD generating units on Tanna and Malekula, costs wouldbe higher still, given the small size of the units and the additionalcost of supplying fuel.
Power System Expansion
Introduction
3.20 According to the power demand forecasts in paras. 2.21-2.23,additional generation capacity will be required on Efate before 1990.Although there is a possibility for hydro generation in the early 1990s,short-term generation options require a choice between ADO-fueled powerand wood-fired steam generation. GOV is actively pursuing the wood-firedoption as a viabLe alternative to diesel capacity. A 3 MW plant isanticipated and a feasibility study was completed by UNELCO-Vanuatu (thepublic power supply company) in partnership with Heilborn GMBH, a WestGerman supplier of wood-fired power stations. 29/
Wood-Fired Power Generation
3.21 Power generation utilizing wood-fired steam is a proventechnology that is already in commercial operation elsewhere in thePacific. 30/ However, it is essential to ascertain that the anticipatedbenefits of wood-fired power generation include not only displacement ofimported petroleum but also contribute to minimizing the cost of powerproduction. Factors to be considered include: (a) capital costs;
29/ The feasibility study was funded by the EEC on the basis thatHeilborn would engineer and construct the facility and UNELCO-Vanuatu would operate it.
30/ Philippines.
- 29 -
(b) availability and delivered cost of fuelwood over the wood-fired powereation (WFPS) life cycle; and (c) institutional arrangements for power
'uction and distribution.
3.22 Capital Costs. The capital costs of a wood-fired power station(WFPS) can vary greatly as a function of basic design criteria, use ofpackaged hardware, source country of hardware, and bid procedures.Therefore, a range of US$1,500 to US$2,500 per installed kW can beexpected in an open competitive bid situation (compared to dieselcapacity at about US$700/installed kW). 31/ Site selection also plays apart: questions to be asked include: Ta) possible seismic activity inthe area; (b) historic high-water conditions resulting from rainstorms;(c) anticipated problems concerning the heavy foLndations required forpower plant equipment; (d) analysis of fresh water supplies to be used bythe plant; (e) distance from source of woodfuel supplies; and (f)distance from transmission facilities.
3.23 Given the high capital cost of a WFPS, such a plant shouldsupply baseload at a fairly high load factor (0.6 or more). Technically,excessive cycling with larger steam units or running smaller units forrelativeLy short periods per day is not desirable and would certainly addsignificantly to the cost of operation. A reasonable balance must bestruck between maximum diesel displacement and the desirability ofrunning the WFPS at a relatively high load factor.
3.24 Delivered Cost of Fuelwood. It is proposed that the WFPS wouldobtain its woodfuel requirements from an existing stand of leucaenaforest in the Port Havannah area. The ownership of the forest resourceis not clear; if communal or private, a realistic market price must beestablished for the wood, or a cost set for purchase of the land. In anycase, the cost of wood must include an amount sufficient to provide foroptimum conditions of regrowth and repeated future harvests (para. 2.28).
3.25 There is no definitive quantification of the leucaena forestland that is to be used as a source of woodfuel. Estimates vary from 900ha to 2000 ha. According to mission estimates, a 3-MNW WFPS operating at13% system efficiency with a load factor of 0.6 to produce 16 GWh p.a.would require a reliable supply of about 48,000 tonnes woodfuel p.a.throughout its project life. 32/ This indicates a conservative estimateof required forest coverage of about 3 000 ha assuming annual sustainableyield of 15.5 tonnes/ha/year (17.5 mi/ha/year). Therefore, should theexisting '.eucaena resource prove insufficient, there would be a need toestablish a dedicated fuelwood plantation which would increase the total
31/ Based on other bids for similar stations in the Pacific over thelast 12 months.
32/ Assuming a power generation requirement of 3.0 kg/kWh generated at50% moisture content, wet basis.
- 30 -
capital cost by about US$1,500 - US$3,000 per ha of plantation, dependingon the level of mechanization and expected productivity levels. Harvest-ing, logging and transport costs also have to be incorporated into thefinal cost estimate of delivered fuelwood.
3.26 Institutional Organization. The third issue relates to owner-ship and management of the WFPS and its associated fuelwood sources. Itis not yet certain whether the WFPS will be financed by GOV, UNELCO-Vanutu or as a joint venture. Any decision taken on plant ownership willhave an effect on the investment requireraets of the participants and onthe tariff structure/levels. Another question with investmentimplications is whether the fuelvood resources will be owned and managedin conjunction with the WFPS in the interests of ensuring theavailability of woodfuel required or whether a separate contract will benegotiated with a third party concerning harvesting and delivery ofwoodfuel to the plant.
3.21 Cost Sensitivity Analysis. As discussed in paras. 3.22-3.26above, there are several areas of uncertainty that can affect both theshort-term capital outlay costs and the long-term operating costs of aWFPS; such costs would subsequently affect the cost of power generation.Therefore, the mission has prepared a crude sensitivity analysis for a 3-NW WFPS (producing an average 16 GWh p.a. with a fuelwood requirement of3.0 kg/kWh generated) compared to diesel generation. Table 3.4demonstrates the effect of different assumptions about capital outlaycosts and delivered woodfuel costs on the overall cost if powergeneration.
3.28 The 'optimist-ct" case assumes a low capital cost of US$4.5million (or US$1,500/kW installed) due to open competitive bid proce-dures, and a low delivered cost of woodfuel (US$10/tonne) due to theavailability of ample leucaena and other woodfuel resources. On theother hand, the "pessimistic" case assumes a high capital cost of US$7.5million (or US$2,500/kW installed) as a result of closed bidding tied toa financing source, and a high delivered cost of fuelwood (US$30/tonne)due to the necessity of establishing a fuelwood plantation to complementexisting native leucaena forest.
3.29 As shown below, WFPS generation costs can vary over a widerange between about USC10.0/kWh and USCl7.01kWh. At the upper end of therange, VFPS generation costs would be much higher than present estimatedADO generation costs of about USC11.0/kWh (para. 3.13). Although dieselimport savings of 4.5 million liters p.a. are achieved in bothscenarios, 33/ the "optimistic" scenario represents the optimum in both
33/ Based on 3.6 kWh/litre.
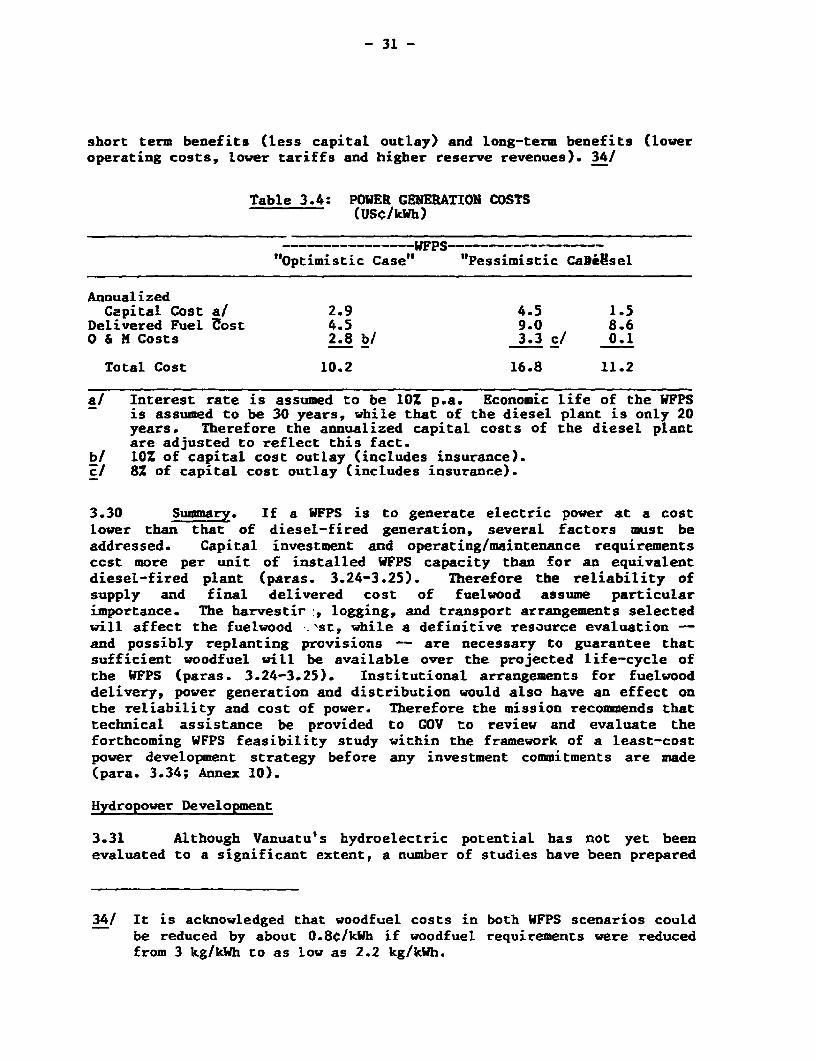
- 31 -
short term benefits (less capital outlay) and long-term benefits (loweroperating costs, lower tariffs and higher reserve revenues). 34/
Table 3.4: POWER GENERATION COSTS(USC/kWh)
… ------ WFPS…------ "Optimistic Case" "Pessimistic CaDeisel
AnnualizedCapital Cost a/ 2.9 4.5 1.5
Delivered Fuel Uost 4.5 9.0 8.6O & M Costs 2.8 b/ 3.3 c/ 0.1
Total Cost 10.2 16.8 11.2
a/ Interest rate is assumed to be 10% p.a. Economic life of the WFPSis assumed to be 30 years, while that of the diesel plant is only 20years. Therefore the annualized capital costs of the diesel plantare adjusted to reflect this fact.
b/ 10% of capital cost outlay (includes insurance).'El 8Z of capital cost outlay (includes insurance).
3.30 Summar. If a WFPS is to generate electric power at a costlower than that of diesel-fired generation, several factors must beaddressed. Capital investment and operating/maintenance requirementsccst more per unit of installed WFPS capacity than for an equivalentdiesel-fired plant (paras. 3.24-3.25). Therefore the reliability ofsupply and final delivered cost of fuelwood assume particularimportance. The harvestir:, logging, and transport arrangements selectedwill affect the fuelwood st, while a definitive resource evaluation --and possibly replanting provisions -- are necessary to guarantee thatsufficient woodfuel will be available over the projected life-cycle ofthe WFPS (paras. 3.24-3.25). Institutional arrangements for fuelwooddelivery, power generation and distribution would also have an effect onthe reliability and cost of power. Therefore the mission recommends thattechnical assistance be provided to GOV to review and evaluate theforthcoming WFPS feasibility study within the framework of a least-costpower development strategy before any investment commitments are made(para. 3.34; Annex 10).
Hydropower Development
3.31 Although Vanuatu's hydroelectric potential has not yet beenevaluated to a significant extent, a number of studies have been prepared
34/ It is acknowledged that woodfuel costs in both WFPS scenarios couldbe reduced by about 0.8C/kWh if woodfuel requirements were reducedfrom 3 kg/kWh to as low as 2.2 kg/kWh.
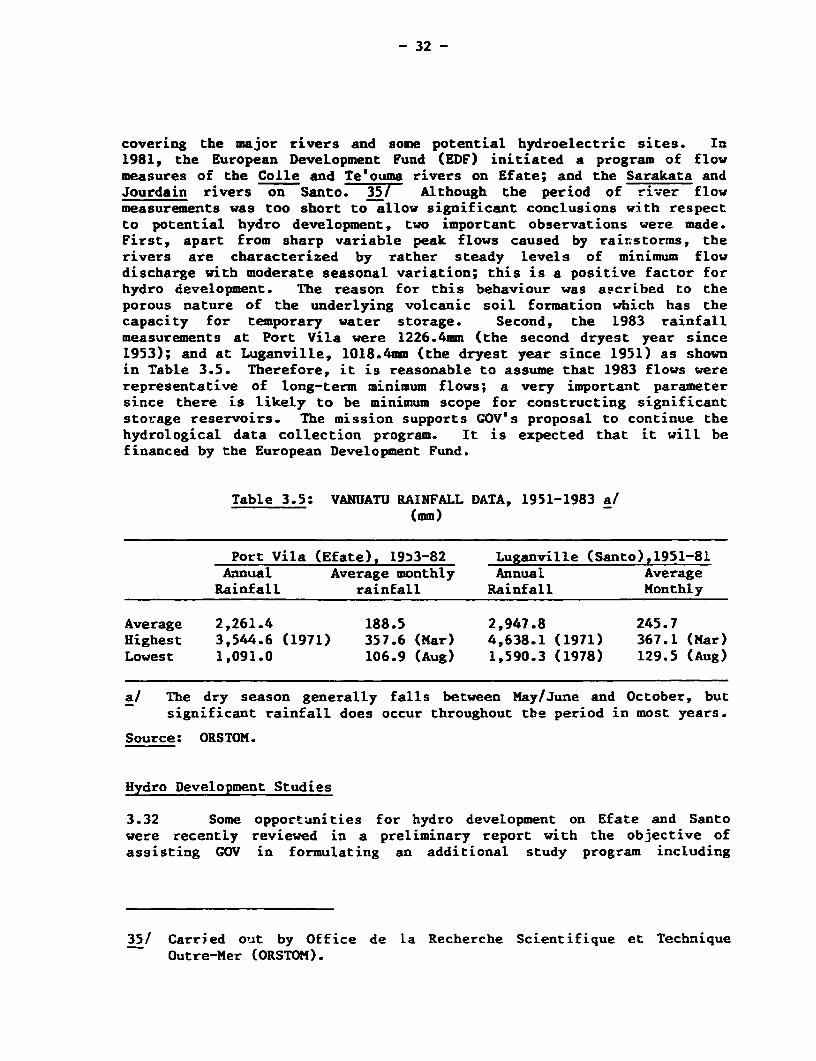
- 32 -
covering the major rivers and some potential hydroelectric sites. In1981, the European Development Fund (EDF) initiated a program of flowmeasures of the Colle and Te'ouma rivers on Efate; and the Sarakata andJourdain rivers on Santo. 35/ Although the period of river flowmeasurements was too short to allow significant conclusions with respectto potential hydro development, two important observations were made.First, apart from sharp variable peak flows caused by rainstorms, therivers are characterized by rather steady levels of minimum flowdischarge with moderate seasonal variation; this is a positive factor forhydro development. The reason for this behaviour was ascrLbed to theporous nature of the underlying volcanic soil formation which has thecapacity for temporary water storage. Second, the 1983 rainfallmeasurements at Port Vila were 1226.4mm (the second dryest year since1953); and at Luganville, 1018.4mm (the dryest year since 1951) as shownin Table 3.5. Therefore, it is reasonable to assume that 1983 flows wererepresentative of long-term minimum flows; a very important parametersince there is likely to be minimum scope for constructing significantstorage reservoirs. The mission supports GOV's proposal to continue thehydrological data collection program. It is expected that it will befinanced by the European Development Fund.
Table 3.5: VANUATU RAINFALL DATA, 1951-1983 a/(mm)
Port Vila (Efate), 19t3-82 Luganville (Santo),1951-81Annual Average monthly Annual AverageRainfall rainfall Rainfall Monthly
Average 2,261.4 188.5 2,947.8 245.7Highest 3,544.6 (1971) 357.6 (Mar) 4,638.1 (1971) 367.1 (Mar)Lowest 1,091.0 106.9 (Aug) 1,590.3 (1978) 129.5 (Aug)
a/ The dry season generally falls between May/June and October, butsignificant rainfalL does occur throughout tbe period in most years.
Source: ORSTOM.
Hydro Development Studies
3.32 Some opportunities for hydro development on Efate and Santowere recently reviewed in a preliminary report with the objective ofassisting GOV in formulating an additional study program including
35/ Carried out by Office de la Recherche Scientifique et TechniqueOutre-Mer (ORSTOM).
- 33 -
continuation of the hydrologic survey discussed in para. 3.31above. 36/ The report concluded that:
(a) future hydro development would generally have to be based onrun-of-river plants with some daily storage capacity, since theriver valleys are narrow and deeply incised without significantfalls. Further, the permeability of the underlying volcanicformations, the frequency of Kastic formations, and the highlevel of seismic activity contribute to making reservoirconstruction prohibitively expensive in most cases.
(b) the seasonal distribution of rain and riverflows tends to coin-cide with the seasonal distribution of power demand. That is,power demand is highest during the warm, wet season and about30% less during the cooler, dry season (para 2.17).
3.33 Several existing hydroelectric development proposals were alsoreviewed with the recommendation that future hydrological data collectionand hydroelectric development attention should be focused on threerivers: the Teouma (Efate); the Sarakata (Santo); and the Brenwe(Malekula):
(a) Teouma River (Efate). A potentially attractive scheme isproposed for a site approximately 14 km. from Port Villa. Itinvolves a 2.1-MW hydro complex with an annual output of 16 GWh(equal to Port Vila's present demand), which would exploit a 75meter fall by means of a simple intake structure, a 2,700 metertunnel and a 700 meter penstock. With estimated costs of VT10/kWh, the scheme is considered economically attractive. 371However, the scheme is only in the conceptual stage, based onmap studies alone and there are technical reservations aboutthe level of Karstic development in the underlying formationwhich might inhibit tunnel construction. Therefore, a thoroughfield exploration is warranted to determine the Karsticfeatures of the soil formation (para. 3.44).
(b) Sarakata River (Santo). The review report proposes a firstphase hydro development near Luganville, based on the second oftwo earlier studies. 38/ Subject to confirming feasibilityfield studies, a 1.84 MW hydro facility could generate 16 GWhp.a. aimed at Luganville (12 km) and the South Pacific Fishing
36/ The review was carried out by Electricite de France.
371 Total costs of VT 1500 milLion at 10% p.a. interest rate (1982prices).
38/ La Societe d'Etudes et d'Enterprises (1950s); Sir William Halcrowand Partners (1962).
- 34 -
Company (13 km). Although ihe original study called for aminim z river flow of 3.7 m Isecond, 1983 measured flows of2.76 m /second are considered sufficient to produce the sameoutput. However, there are technical reservations aboutgeological conditions; and the economic viability of the scheme(VT6.2/kWh generated) 39/ is dependent on rapid expansion ofdemand (paras. 2.24). 407
3.34 The mission agrees with the recommendation to further investi-gate small, run-of-river hydroelectric development opportunities. Moreemphasis should be given to the possibility of hydro projects which couldbe more suitable for present demand levels. For example, with the pre-sent Port ViLa system peak demand of 3.6 MV, a 1 MW hydro plant wouldprobably cover the base load, while thermal generation would cover thepeak load. Installed costs of such hydro plants are likely to be signif-icantly less than the installed cost of US$5,O0O-US$7,000 per kW implicitin the existing proposals (para. 3.33). Therefore, the missionrecommends technical assistance for GOV to carry out an economic andtechnical evaluation of various hydroel2ctric options - taking intoaccount previously completed work -- as an input to developing a least-cost system expansion program. The required expertise would be: (a) ageotechnical engineer with experience in hydro development in Karsticareas; (ii) a civil engineer, knowledgeable about small hydro structuresin relatively isolated areas; and (c) a systems planning engineer(para. 3.30; Annex 10).
Other Renewable Energy Options
Biomass Gasification
3.35 During recent years, significant efforts have been made toimprove biomass gasifier technology as part of the worldwide effort todevelop better means of exploiting the energy potential of biomass.Gasification involves the conversion of solid fuels such as wood or char-coal and certain crop residues into producer gas. This gas can (a) sub-stitute partially or wholly for liquid fuels in internal combustionengines; or (b) provide process heat in boilers, furnaces and otherheating appliances.
3.36 Hot-air Generators. Vanuatu has already initiated the use ofhot-air generators for the copra drying; 15Z of the copra produced in
39/ Total costs of VT 975 million at 101 p.a. interest rate (1982prices).
40/ A subsequent second phase development could generate an additional14 GWh p.a.
- 35 -
1983 was by means of this method. The major advantages of hot airgenerators compared to open fires are fuel efficiency and improvedquality of the dried copra. Hot air generators have a thermal efficiencyof 70-85%, compared to 10% for open-fires; therefore, they consume muchless wood. 41/ The hot-air dried copra quality was also much better,fetching a 10 premium on the worLd market as compared to the smoke-driedcopra that was selling at 10% below world prices. 42/ This program isbeing intensified in 1984 and 1985.
3.37 The Agricultural Department is currently preparing a projectfor a 1700 hectare cocoa plantation with associated centralized dryingfacilities which include a diesel-fired boiler. At full production, theplantation is expected to produce 3,000 tonnes of dried cocoa p.a. Thiswould require about 240 kiloliters of ADO p.a. An alternative dryingmethod to be considered would be wood-fired, hot-air generators. 43/Assuming 502 moisture content, woodfuel requirements would be about 1,000tonnes p.a. Such hot-air generators are being used elsewhere in thePacific for cocoa drying. Potential foreign exchange savings would be VT7.2 million p.a. at full capacity, giving a pay-back period of betweenone and two years. 44/ Therefore, the mission recommends that theAgricultural Department evaluate the feasibility of substituting a wood-fired, hot-air generator for the ADO-fired boiler. This includes (a) asurvey of woodfuel availability on a long-term basis and definition ofany need for fuelwood planting to estimate the delivered cost offuelwood; and (b) capital cost estimates for the hot-air generator alongwith woodfuel handling and also removal systems; and (c) economicanalysis of expected benefits and additional investment needs (Annex 8).
3.38 Power Generation Gasifiers. Some types of gasifiers can beused for retrofitting diesel generator sets to run on producer gas inrural areas remote from the grid. However, this application is morecomplex technically and economically -- than the direct-heat applicationdiscussed above: (a) careful testing is required to establish thecompatibility of particular engine-gasifier combinations; (b) the lowenergy content of producer gas results in significant power output lossesranging from 30Z-40%; and (c) careful operation and maintenance, plus an
41/ A smoke-dried tonne of copra requires about 2.5 tonnes of biomasfuel; a hot-air generator would require only 0.5 tonnes biomass.
42/ In recent years, f.o.b. prices for copra in the Pacific have rangedfrom US$180 - 235/tonne.
43/ In view of the relatively modest production scale envisaged, themission considered that a hot-air generator would be preferable to awood-fired steam drier.
44/ Assuming a c.i.f. direct cost of VT 29.4/litre, and a hot-airgenerator installed cost of VT 6,000/KW.
- 36 -
efficient gas cleaning system are all essential to ensure that clean,high-quality gas reaches the engine.
3.39 Vanuatu has gained some experience with the use of small enginegasifiers retrofitted to small internal combustion engine generators. Ahigh school in Efate operates a homemade 25 kW gasifier fitted to a 100hp spark ignition engine to produce eLectric power for the school'sneeds. 45/ Wood chips are fired in a home-made downdraft oil drumgasifier; the ensuing producer gas is cooled in a shell and tube heatexchanger and is then drawn through a fillet mesh for removal of ash par-ticles. The relatively clean and cooled gas is then injected into theengine to produce power. However, the equipment has operated only inter-mittently and little data on performance and maintenance is available.
3.40 In this context, the mission support the proposed EEC-financedgasifier program for Vanuatu which involves the installation and demon-stration of a 50 kW biomass gasifier for power generation at Onesua HighSchool. The feedstock will be dry woodchips from surrounding woodlots.The second component of the EEC program is a 75 kVA gasifier for therural government centre at Isangel on Tanna Island utilizing charcoalfeedstock. 46/ The mission advises that proper management and extensiveperformance monitoring 47/ and detailed record-keeping is essential, ifthe pilot project is to achieve its objectives of: (a) investigating thefeasibility of retrofitting internal combustion engine-generators withbiomass gasifiers; and (b) a training programme for gasifier operators.
Photovoltaics
3.41 A small solar PV system is in operation at a tourist hotel onTanna Island; it provides energy to sixteen 12-watt bulbs in place ofkerosene lamps. 48/ No records exist as to the economic feasibility ofthis system. Several COV departments have also installed PV systems inselected areas throughout the country, mainly for communicationpurposes. However, there is a lack of data on their performance and
45/ The homemade gasifier followed an unsatisfactory experience with aFluidyne gasifier purchased from New Zealand.
46/ During Government discussions, the mission was informed that thisproject component would not be implemented due to the uneconomiccost of the proposed feedstock. Instead, the funds were to be re-allocated to the Onesua gasifier.
47/ As part of the EEC gasifier program, the projects in Vanuatu will betied into the UNDP/World Bank Global gasifier monitoring program andsignificant data feedback should occur.
48/ Funded by the South Pacific Commission.
- 37 -
economic viability. Activities are going on elsewhere in the Pacific 49/concerning the economic viability of solar-powered systems that can bemonitored by GOV with special reference to operating and replacementcosts. The mission recommends that GOV monitor and evaluate the resultsof these ongoing activities before committing any of its own resources tosolar PV systems for lighting and other power purposes.
Ethanol
3.42 A low-technology pilot scheme was proposed in 1980 to produceethanol from cassava as a potential substitute for diesel oil in industryor as a feedstock input to a process for producing ester of coconut oilas a diesel substitute in the transport sector. A site was selected onTanna Island for the 100,000 liter p.a. plant and several major pieces ofequipment were ordered. 50/
3.43 Activities elsewhere have indicated that producing ethanol fromcassava is uneconomic, largely because there is no waste product to actas a "free" energy source for producing the ethanol (unlike bagasse inthe case of sugarcane), therefore requiring fuel oil or wood as energysources. Also, ethanol has a low cetane number and thus can be used incompression ignition diesel engines only through substantial enginemodification or through mixing of ethanol with special additives. Inview of the opportunity cost of scarce capital and manpower resources,the mission recommends that GOV should discontinue the project.
Coconut Oil
3.44 At present, there is a small, private oil mill that processescopra to produce coconut oil for its own power generation needs on EfateIsland. 51/ UNELCO-Vanuatu has also conducted research into theviability of this fuel from the private mill, since there are nocentralized oil mills operating in Vanuatu. The competitiveness ofcoconut oil as a substitute for diesel in power generation and transportdepends to some extent on the requirement for a higher level of enginemaintenAnce 52/ and on the production costs of coconut oil vis-a-vis thedelivered cost of diesel oil. However, even if production costs are
49/ E.g., the EEC regional program has provided funding for photovoltaicsystems in two remote villages in Tonga.
50/ New Zealand funded NZ$40,000 of the project.
51/ Diesel and coconut oil are injected into a motor diesel engine in aratio of 1:4. This mixture is supposed to have provided over 10,000hours of reliable engine service.
52/ To date, experience has shown a need for increased enginemaintenance needs even with mixtures in a ratio of 1:1.
- 38 -
comparable to the delivered cost of diesel (as has been indicated in someremote regions) and skilled manpower is available for maintenance needs,the deciding factor is the opportunity cost i.e. the prevailing worldmarket prices for coconut oil and for copra. Assuming an f.o.b price ofabout US$450 per tonne of coconut oil, comparison with the current c.i.f.cost of diesel of US$360/tonne indicates that coconut oil is notcompetitive with diesel. The export value of copra and/or coconut oil issubject to international influences beyond the control of the GOV.Therefore the mission recommends that GOV should not implement anyinvestigation into the power generation aspects of coconut oil at thistime.
Charcoal Production
3.45 Some interest has been shown in the development of charcoalproduction and the introduction of improved charcoal stoves as asubstitute for kerosene to meet the cooking needs of low-income urbandwellers. 53/ At present, charcoal is produced on Tanna Island by KITOWat an estimated cost of VT 10.000/tonne. About 0.2 tonne/month areshipped for sale in Port Villa -- mostly to expatriates. Estimates ofthe delivered cost are around VT 18,750/tonne, or 50% of the equivalentkerosene cost. 54/ However, the mission agrees with GOV that in view ofthe absence of a substantial commercialized firewood market in Vanuatu,first priority in the household sector should be given to carrying out acomprehensive biomass consumption/supply study (including both domesticand agro-processing sectors) for each Island in Vanuatu starting withEfate (para. 2.26). This would indicate any localized fuelvood deficitareas, and potential demand for charcoal.
Hydrocarbon Exploration
3.46 Geophysical investigations for evaluating hydrocarbon resourcesin the offshore regions of the central basin of Vanuatu began in the late1960s. Several oil companies undertook exploration activities consistingof both single- and multi-channel seismic-reflection data in the centralbasin of Vanuatu between 1972 and 1982. 55/
3.47 Evaluation of data collected during this period on offshoregeophysical surveys indicated that certain sediment thicknesses andstructures within the central basin of Vanuatu were promising areas for
53/ The rural population has access to significant amounts of "free"firewood from natural forests.
54/ PEDP Report.
55/ Including joint OPSTOM-CCOP/SOPAC investigations in 1980 and 1982.
- 39 -
potential hydrocarbon deposits. Therefore, in order to carry out furtherevaluation and to restimulate the interest of the oil industry, in 1982,a hydrocarbon and mineral resources investigation was carried out by theU.S. Geological Survey. 56/
3.48 The results of the survey delineated specific sub-basins withsediment thickness of over 2 km which are folded and faulted to producetraps that could be considered promising targets for hydrocarbongeneration and accumulation. Areas identified include: North Aoba, SouthAoba, East Santo and Malakula basins. The Malakula basin, in particular,appears to contain the desirable sediment types, structures, and strati-graphic continuity to deeper water basins for the migration and accumu-lation of hydrocarbons. Its structure is simple, with sediments dippinggentLy from east and west into the basin forming a broad syncline. Thesesediments consist of well-layered to discontinuously and chaoticallyLayered sedimentary rocks that have been correlated with upper Miocene toPliocene calcareous sandstones and mudstones, coarse detrital limestonesand conglomerates on land. These on-land equivalent rocks appear to havefair porosity and permeability, although some are quite compacted andwell cemented. Its eastern boundary structure is a broad anticline thatis not faulted or fractured on its upper flanks or crest wit- closurethat appears to be good. Although source rock analyses indicate a slightpromise of oil and gas, further investigations need to be done to obtaina comprehensive evaluation. Before any basin can be considered forfurther exploration, source rock potential must be thoroughly analyzed.
3.49 Another offshore geophysical survey is to be undertaken by theU.S. Geological Survey in the central basin of Vanuatu in late 1984 andit is hoped that this will complement the existing data base by furtherdeclineating significant structures and correlating seismic stratigraphicunits within the basin.
3.50 Once the results of the forthcoming survey are established, itwill then be possible to evaluate the promotional, and technicalassistance needs for GOV to prepare a comprehensive data package aimed atthe oil industry which already has expressed interest in the ongoingsurvey. Such a package could advance GOV's interest in attracting moreoil companies and accelerating the exploration program.
56/ Arranged by the 1982 ANZUS (Australia, New Zealand, U.S.A.) Tri-partite Agreement in association with CCOP/SOPAC (the UnitedNations-sponsored Committee for the Co-ordination of Joint Pros-pecting for Mineral Resources in South Pacific offshore areas).
- 40 -
IV. ENEtCY rNSTITUTIONS AND THIECAL ASSISTANCE
Energy Planning and Administration
4.1 The Ministry of Lands, Energy and Rural Water Supply (MLERIS)is responsible for energy planning and policy, legislation andadministration. MIEBWS is also responsible for issues pertaining to thedevelopment of hydropower, hydrocarbon and geo-hermal resources, as wellas issues pertaining to land allotments and surveys (Annex 8). ThereforeMLERWS is well placed to deal with the energy issues identified in thisreport.
4.2 MLERWS is aware that (a) it lacks the technical capacity toimplement diverse energy projects; and (b) energy planning and policyfunctions should be kept separate from implementation when possible.Therefore MLERWS intends to concentrate on its role of planning andpolicy and to act as coordinator between the other agencies involved inthe energy sector; i.e. Ministry of Finance (petroleum product pricing),Ministry of Agriculture and Forestry (fuelvood plantations), the PublicWorks Department (rural power supplies), and UNELCO-Vanuatu (urban powersupply).
4.3 An Energy Advisor (funded by ADB) is expected to join MLERWS asthe nucleus of an energy planning unit. The mission recommends that theprime functions of the Energy Advisor should be to: (a) act as coordi-nator between the various energy subsectors- and (b) prepare an appropri-ate energy policy and program, including future review and evaluation ofcurrent energy sector proposals for investments and/or technical assis-tance. MLERWS is aware of the need for coordinating energy policy withnational macro-economic objectives and has arranged for the EnergyAdvisor to work in close cooperation with the National Planning andStatistics Office (NPSO) in the Prime Minister's Office. In view ofMLERWS's present lack of technical capacity, the mission recommends thatfirst priority be given to locating and recruiting local counterparts toassist in coordinating and monitoring energy sector developments.
Implications for External Ass.stance
4.4 Vanuatu has re_eived financial and technical assistance frommultilateral and bilateral sources over a wide range of energysubsectors, as shown in Annex 9. However, many of the ongoing programsare regional, spreaa ever several South Pacific countries; therefore theoverall contribution to and impact on .'anuatu's energy situation cannotyet be determined. The mission has focussed on those energy aspects thatrequire immediate further detailed technical assistance (totalling aboutUS$380,000) as shown in Annex 10. The areas affected are: (a) regionals_ast-cost petroleum product supply analysis; (b) power sector adminis-
- 41 -
tration and tariffs; and (c) evaluation of least-cost power system expan-sion options including acceleration of hydro power development investiga-tions.
4.5 At present, the major energy investment requirement appears tobe between US$5.0 million and US$8.0 million for a 3 MW wood-fired powerstation. However, this will depend on the results of the forthcomingfeasibility study (para. 3.20). Investment needs for other capital proj-ects such as the possible need to expand petroleum product storagefacilities and introducing hydropower capacity can be further definedonce the recommended technical assistance proposals have been carriedout.
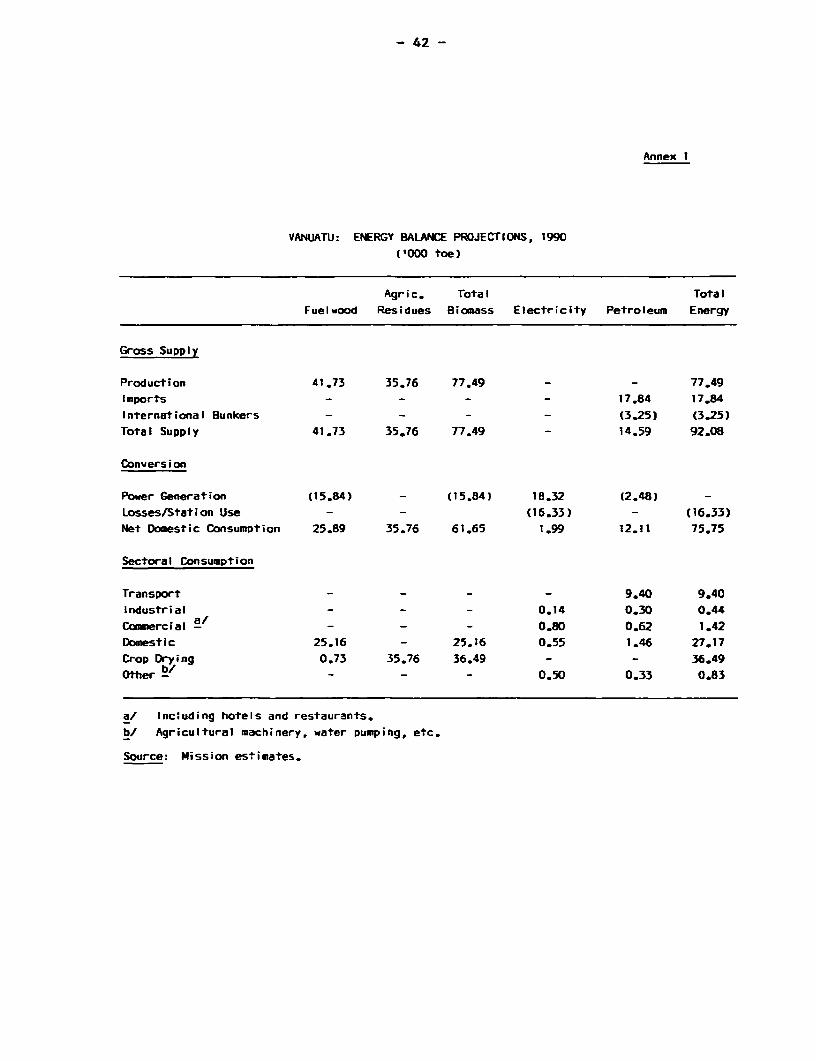
- 42 -
Annex I
VANUATU: ENERGY BALANCE PROJECTIONS, 1990
('000 toe)
Agric. Total Total
Fuelwood Residues Biomass Electricity Petroleum Energy
Gross Supply
Production 41.73 35.76 77.49 - - 77.49
Imports - - - - 17.84 17.84
International Bunkers - - - - (3.25) (3.25)
Total Supply 41.73 35.76 77.49 - 14.59 92.08
Conversion
Power Generation (15.84) - (15.84) 18.32 (2.48) -
Losses/Station Use - - (16.33) - (16.33)
Net Domestic Consumption 25.89 35.76 61.65 1.99 12.11 75.75
Sectoral Consumption
Transport - - - - 9.40 9.40
Industrial - - - 0.14 0.30 0.44
Cnomercial a/ - - - 0.80 0.62 1.42
Domestic 25.16 - 25.16 0.55 1.46 27.17
Crop Drying 0.73 35.76 36.49 - - 36.49
Other b - - - 0.50 0.33 0.83
a/ Including hotels and restaurants.
b/ Agricultural machinery, water pumping, etc.
Source: Mission estimates.
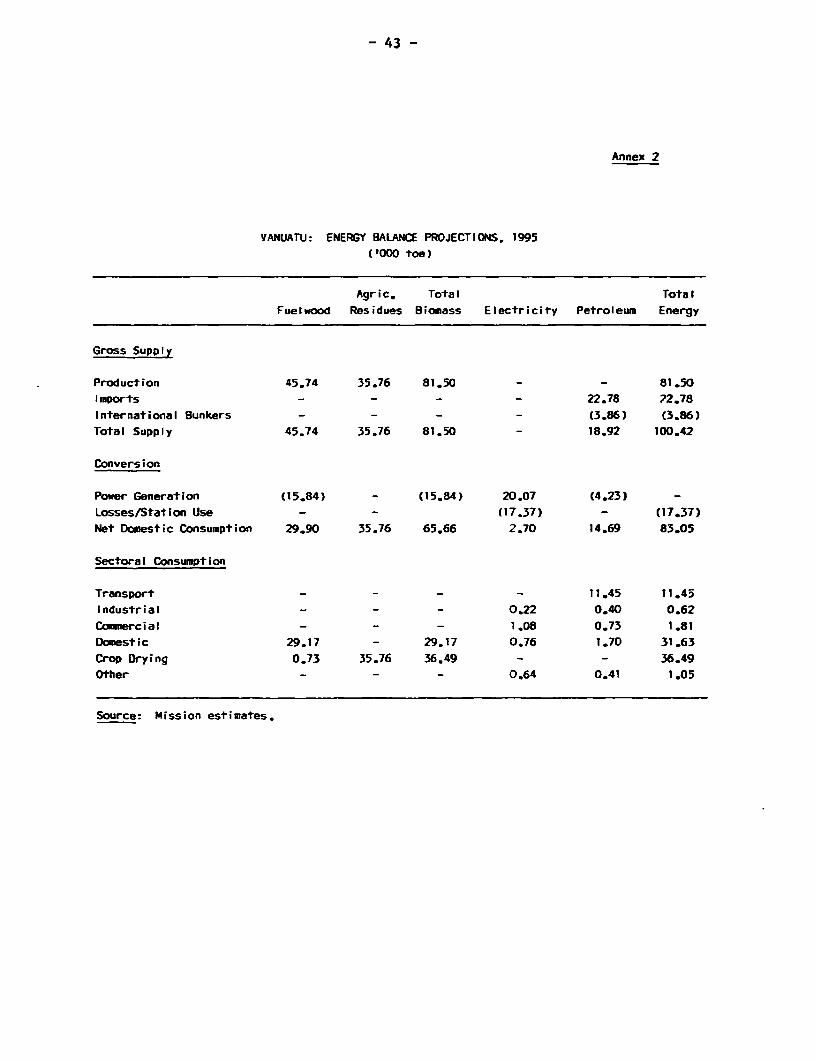
- 43 -
Annex 2
VANUATU: ENERGY BALANCE PROJECTIONS, 1995('000 toe)
Agric. Total Total
Fuelwood Residues Biomass Electricity Petroleum Energy
Gross Supply
Production 45,74 35.76 81.50 - - 81.50
Imports - - - - 22.78 ?2.78International Bunkers - - - - (3.86) (3.86)
Total Supply 45.74 35.76 81.50 - 18.92 100.42
Conversion
Power Generation (15,84) - (15,84) 20.07 (4.23) _
Losses/Station Use - - (17.37) - (17,37)
Net Domestic Consumption 29.90 35.76 65.66 2.70 14.69 83.05
Sectoral Consumption
Transport - - - - 11.45 11.45
Industrial - - - 0.22 0.40 0.62
Conmercial - - - 1.08 0.73 1.81
Domestic 29.17 - 29.17 0.76 1.70 31.63
Crop Drying 0.73 35.76 36.49 - - 36.49
Other - - - 0.64 0.41 1.05
Source: Mission estimates.
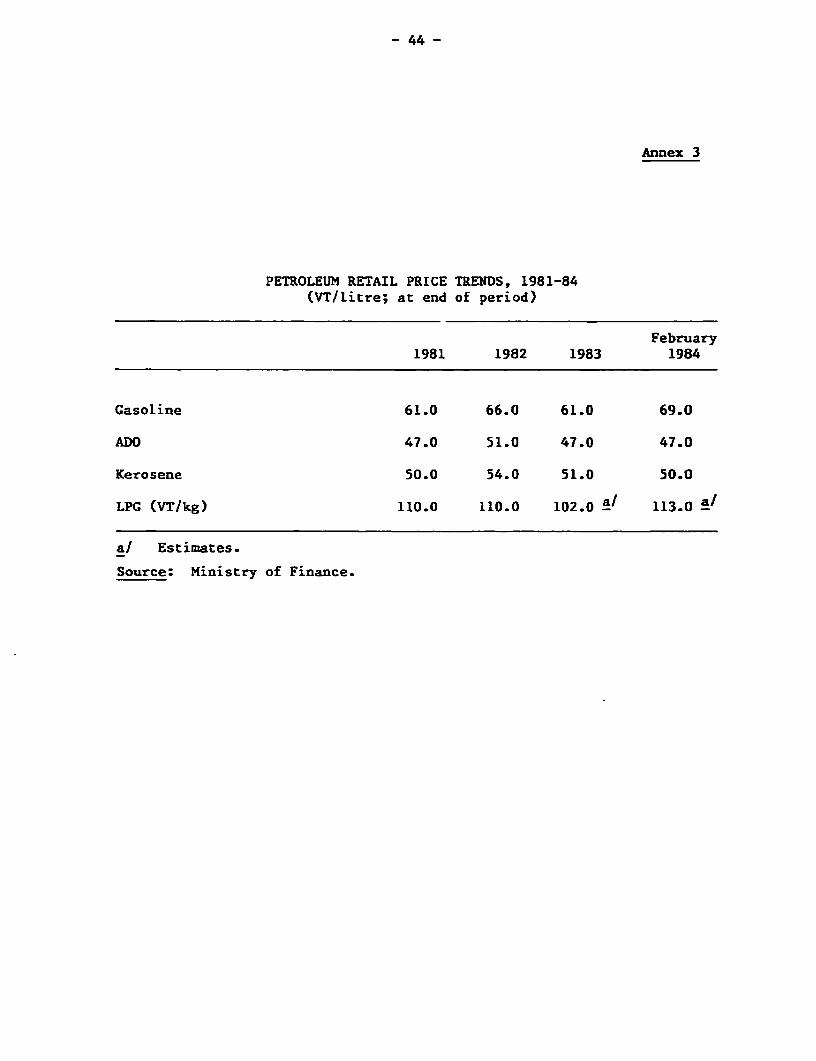
- 44 -
Annex 3
PETROLEUM RETAIL PRICE TRENDS, 1981-84(VT/litre; at end of period)
February1981 1982 1983 1984
Gasoline 61.0 66.0 61.0 69.0
ADO 47.0 51.0 47.0 47.0
Kerosene 50.0 54.0 51.0 50.0
LPG (VT/kg) 110.0 110.0 102.0 al 113.0 a'
a/ Estimates.
Source: Ministry of Finance.
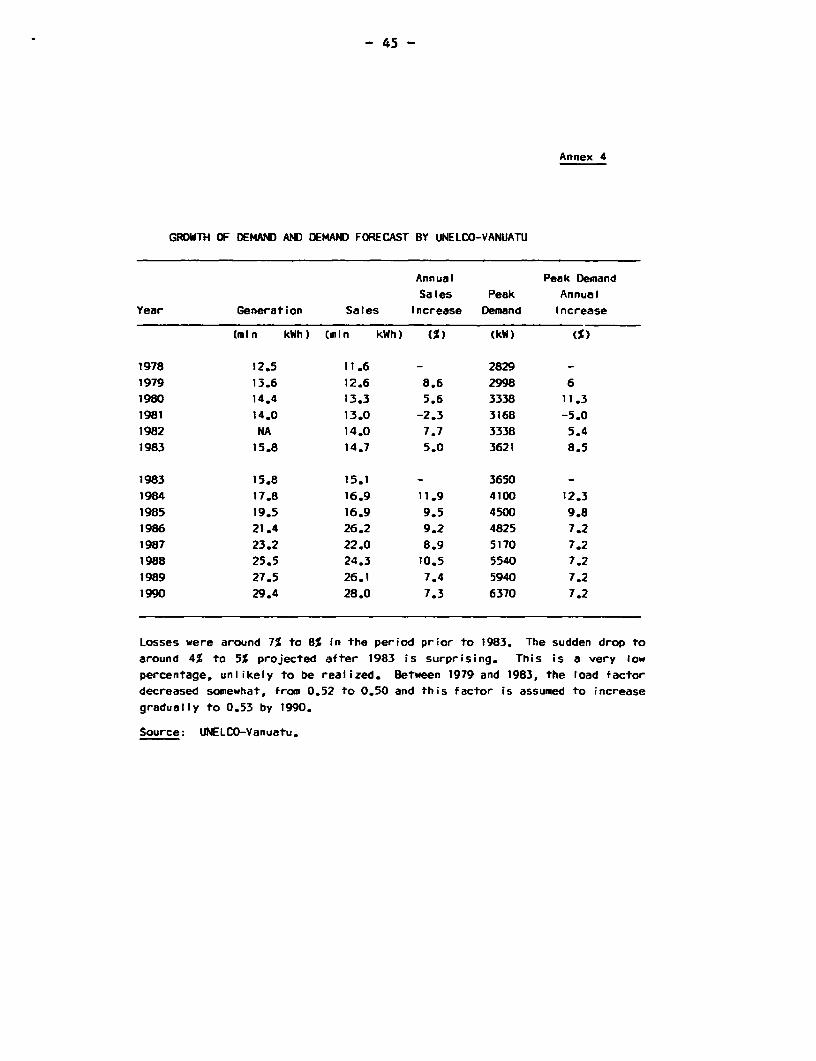
- 45 -
Annex 4
GROWTH OF DEMAND AND DEMAND FORECAST BY UNELCO-VANUATU
Annual Peak Denand
Sales Peak AnnualYear Generation Sales Increase Demand Increase
(mln kWh) (min kWh) (%) (kW) (S)
1978 12.5 It.6 - 2829 -
1979 13.6 12.6 8.6 2998 6
1980 14.4 13.3 5.6 3338 11.31981 14.0 13.0 -2.3 3168 -5.0
1982 NA 14.0 7.7 3338 5.4
1983 15.8 14.7 5.0 3621 8.5
1983 15.8 15.1 - 3650 -
1984 17.8 16.9 11.9 4100 12.3
1985 19.5 16.9 9.5 4500 9.8
1986 21.4 26.2 9.2 4825 7.2
1987 23.2 22.0 8.9 5170 7.2
1988 25.5 24.3 10.5 5540 7.2
1989 27.5 26.1 7.4 5940 7.2
1990 29.4 28.0 7.3 6370 7.2
Losses were around 7% to 8% in the period prior to 1983. The sudden drop to
around 4% to 5% projected after 1983 is surprising. This is a very low
percentage, unlikely to be realized. Between 1979 and 1983, the load factordecreased somewhat, from 0.52 to 0.50 and this factor is assumed to increase
gradually to 0.53 by 1990.
Source: UNELCO-Vanuatu.
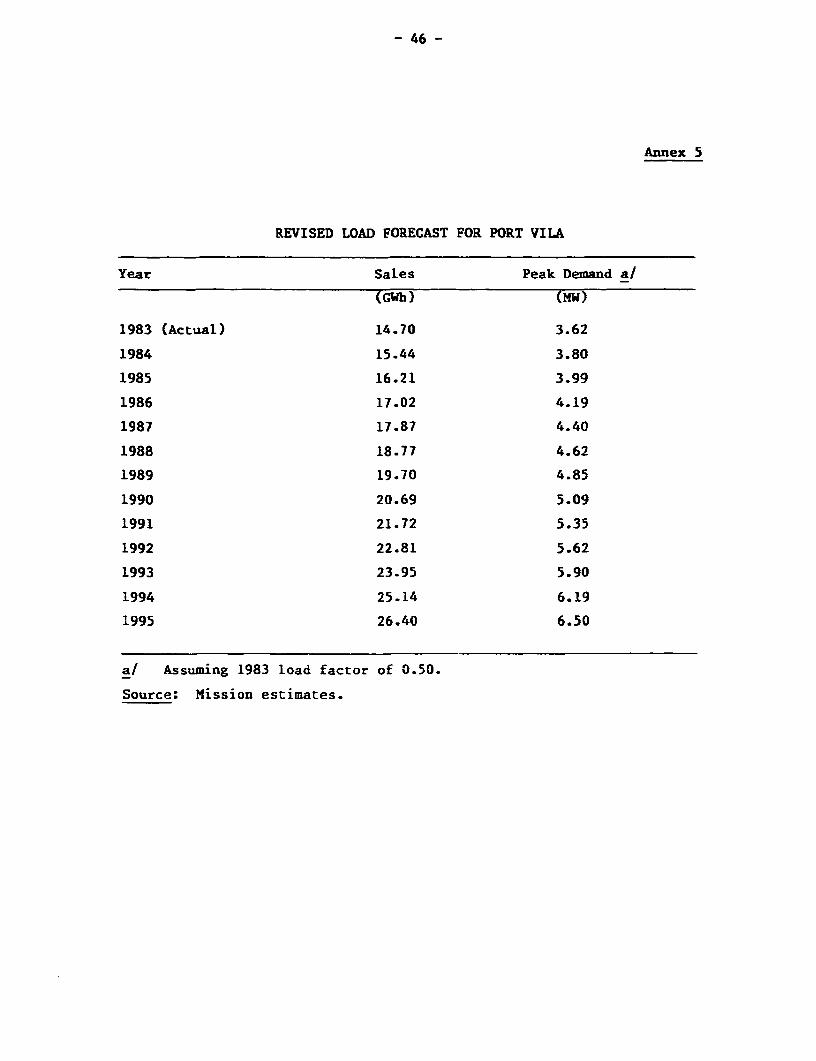
- 46 -
Annex 5
REVISED LOAD FORECAST FOR PORT VILA
Year Sales Peak Demand a/
(GWh) (MW)
1983 (Actual) 14.70 3.62
1984 15.44 3.80
1985 16.21 3.99
1986 17.02 4.19
1987 17.87 4.40
1988 18.77 4.62
1989 19.70 4.85
1990 20.69 5.09
1991 21.72 5.35
1992 22.81 5.62
1993 23.95 5.90
1994 25.14 6.19
1995 26.40 6.50
a/ Assuming 1983 load factor of 0.50.
Source: Mission estimates.
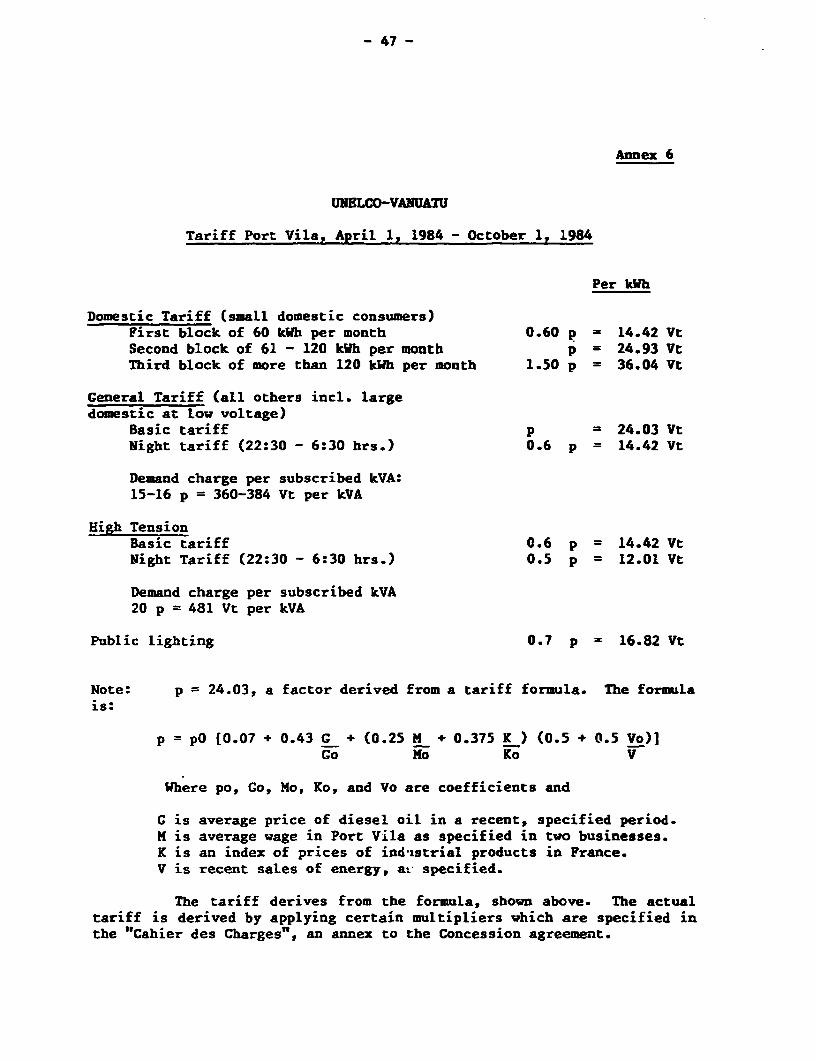
- 47 -
Annex 6
UNELCO-VANUATU
Tariff Port Vila, April 1, 1984 - October 1, 1984
Per kWh
Domestic Tariff (small domestic consumers)First block of 60 kWh per month 0.60 p = 14.42 VtSecond block of 61 - 120 kWh per month p = 24.93 VtThird block of more than 120 kWh per month 1.50 p = 36.04 Vt
General Tariff (all others incl. largedomestic at low voltage)
Basic tariff p = 24.03 VtNight tariff (22:30 - 6:30 hrs.) 0.6 p = 14.42 Vt
Demand charge per subscribed kVA:15-16 p = 360-384 Vt per kVA
High TensionBasic tariff 0.6 p = 14.42 Vtlight Tariff (22:30 - 6:30 hrs.) 0.5 p = 12.01 Vt
Demand charge per subscribed kVA20 p = 481 Vt per kVA
Public lighting 0.7 p = 16.82 Vt
Note: p = 24.03, a factor derived from a tariff formula. The formulais:
p = P0(0.07 + 0.43 G + (0.25 M + 0.375 K ) (0.5 + 0.5 Vo)]To ho Ko V
Where po, Go, Mo, Ko, and Vo are coefficients and
G is average price of diesel oil in a recent, specified period.M is average wage in Port Vila as specified in two businesses.K is an index of prices of ind-strial products in France.V is recent saLes of energy, at specified.
The tariff derives from the formula, shown above. The actualtariff is derived by applying certain multipliers which are specified inthe "Cahier des Charges", an annex to the Concession agreement.
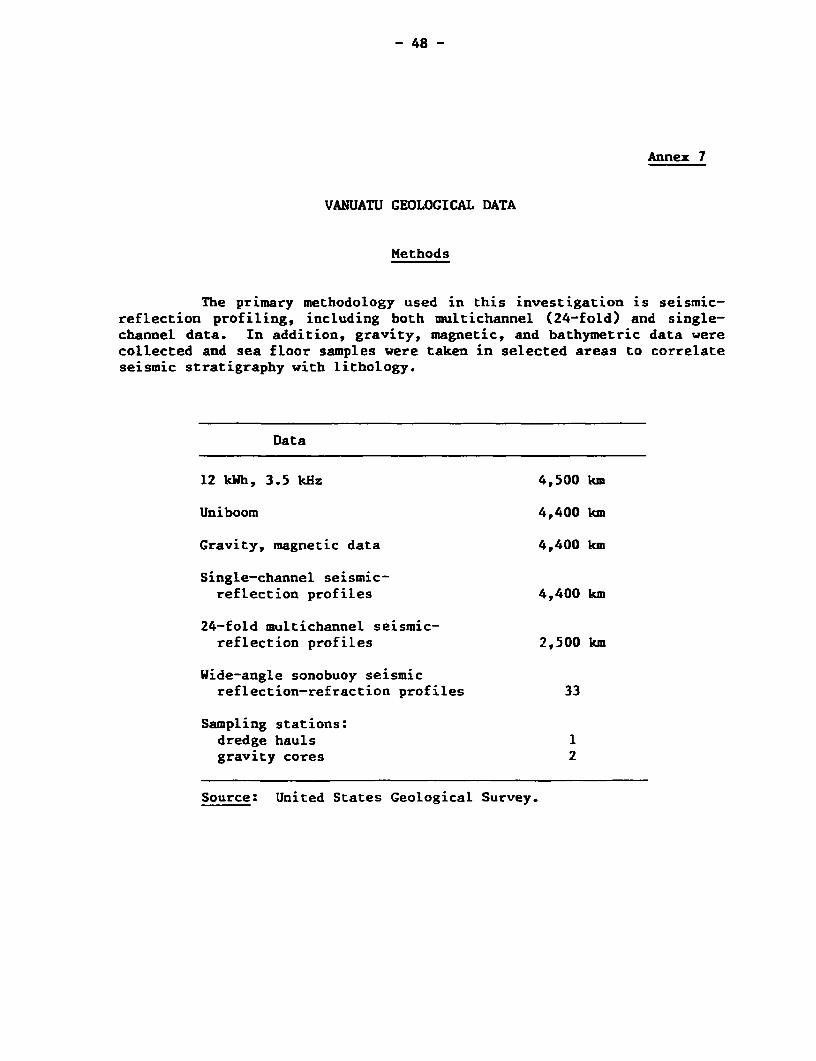
- 48 -
Annex 7
VANUATU GEOLOGICAL DATA
Methods
The primary methodology used in this investigation is seismic-reflection profiling, including both multichannel (24-fold) and single-channel data. In addition, gravity, magnetic, and bathymetric data werecollected and sea floor samples were taken in selected areas to correlateseismic stratigraphy with lithology.
Data
12 kWh, 3.5 kHz 4,500 km
Uniboom 4,400 km
Gravity, magnetic data 4,400 km
Single-channel seismic-reflection profiles 4,400 km
24-fold multichannel seismic-reflection profiles 2,500 km
Wide-angle sonobuoy seismicreflection-refraction profiles 33
Sampling stations:dredge hauls 1gravity cores 2
Source: United States Geological Survey.
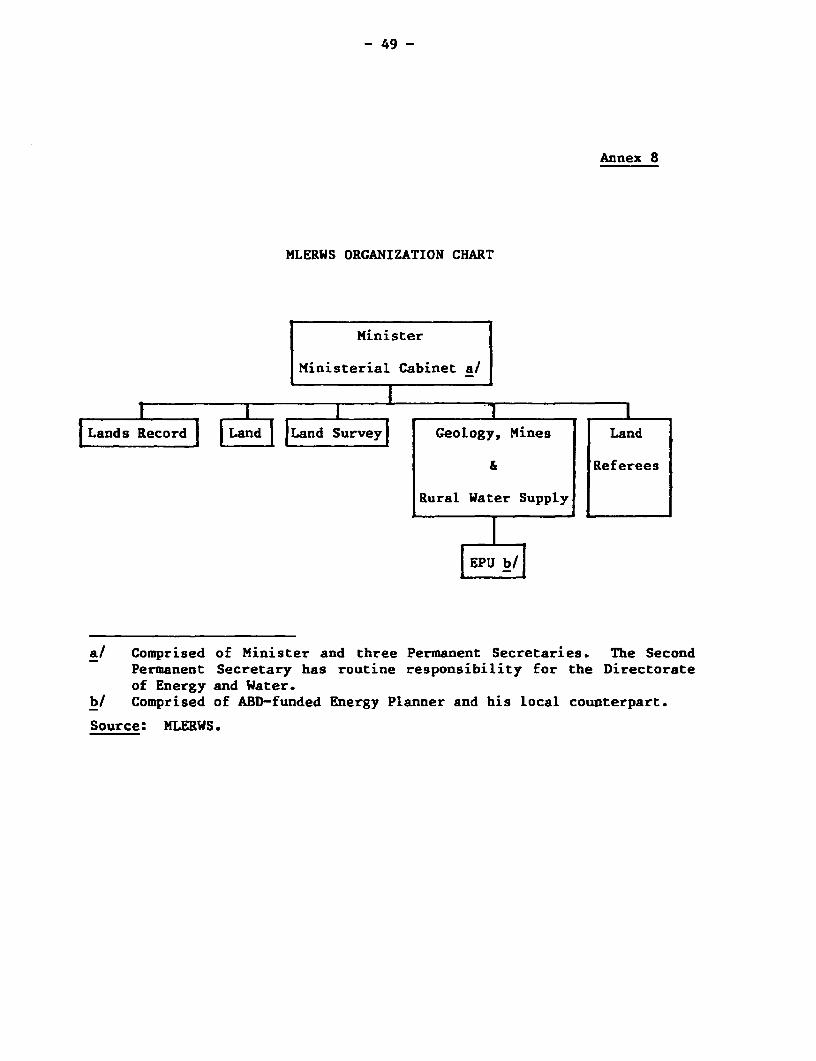
- 49 -
Annex 8
MLERWS ORGANIZATION CHART
Minister
Ministerial Cabinet a/
Lands Record Land Land Survey] Geology, Mines Land
& Referees
Rural Water Supply
at Comprised of Minister and three Permanent Secretaries. The SecondPermanent Secretary has routine responsibility for the Directorateof Energy and Water.
b/ Comprised of ABD-funded Energy Planner and his local counterpart.
Source: MLERWS.
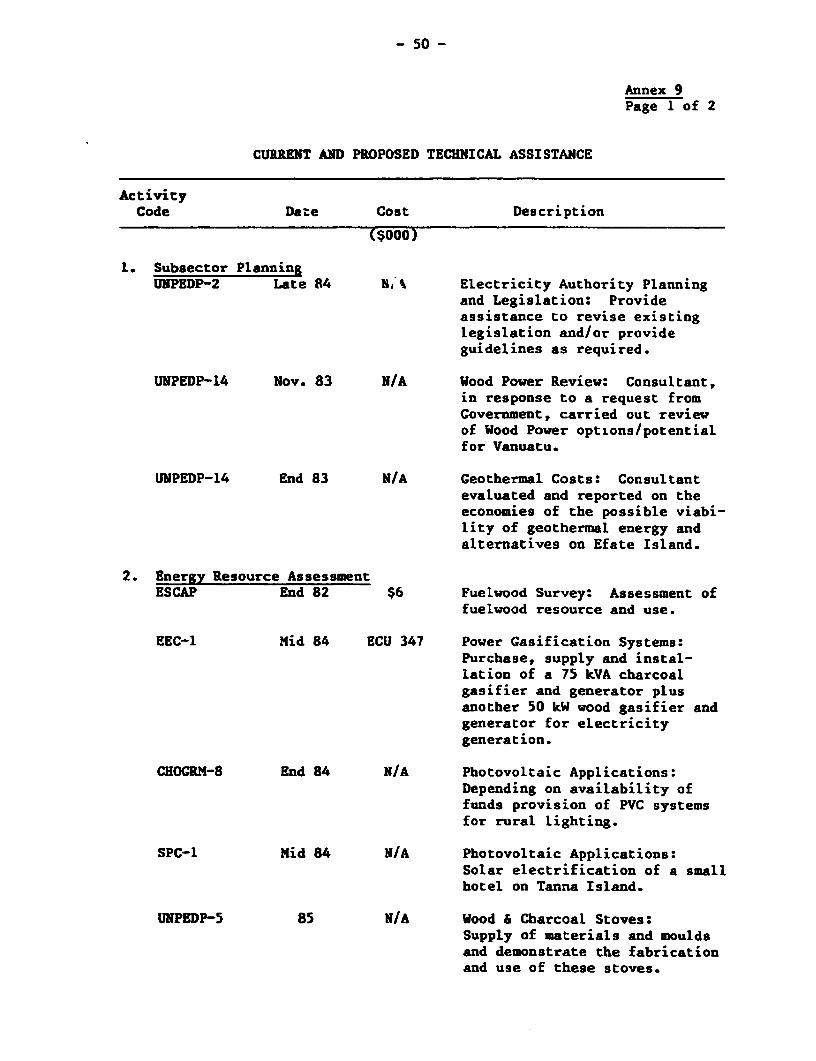
- 50 -
Annex 9Page 1 of 2
CURRENT AND PROPOSED TECHNICAL ASSISTANCE
ActivityCode Date Cost Description
($000)
1. Subsector PlanningUNPEDP-2 Late 84 N, Electricity Authority Planning
and Legislation: Provideassistance to revise existinglegislation and/or provideguidelines as required.
UNPEDP-14 Nov. 83 N/A Wood Power Review: Consultant,in response to a request fromCovernment, carried out reviewof Wood Power options/potentialfor Vanuatu.
UNPEDP-14 End 83 N/A Geothermal Costs: Consultantevaluated and reported on theeconomies of the possible viabi-lity of geothermal energy andalternatives on Efate Island.
2. Energy Resource AssessmentESCAP End 82 $6 Fuelwood Survey: Assessment of
fuelwood resource and use.
EEC-1 Mid 84 ECU 347 Power Gasification Systems:Purchase, supply and instal-lation of a 75 kVA charcoalgasifier and generator plusanother 50 kW wood gasifier andgenerator for electricitygeneration.
CHOcRM-8 End 84 N/A Photovoltaic Applications:Depending on availability offunds provision of PVC systemsfor rural lighting.
SPC-l Mid 84 N/A Photovoltaic Applications:Solar electrification of a smallhotel on Tanna Island.
UNPEDP-5 85 N/A Wood & Charcoal Stoves:Supply of materials and mouldsand demonstrate the fabricationand use of these stoves.
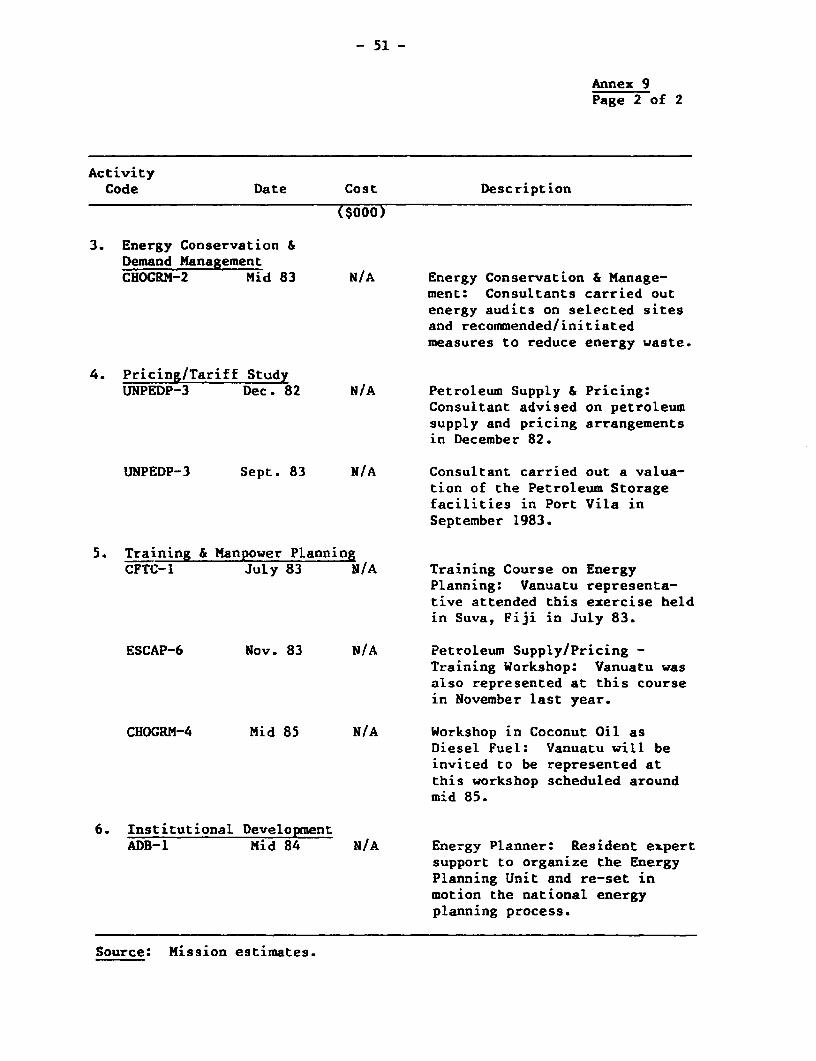
- 51 -
Annex 9Page 2 of 2
ActivityCode Date Cost Description
($000)
3. Energy Conservation &Demand ManagementCHOGRM-2 Mid 83 N/A Energy Conservation & Manage-
ment: Consultants carried outenergy audits on selected sitesand recommended/initiatedmeasures to reduce energy waste.
4. Pricing/Tariff StudyUMPEDP-3 Dec. 82 N/A Petroleum Supply & Pricing:
Consultant advised on petroleumsupply and pricing arrangementsin December 82.
UNPEDP-3 Sept. 83 N/A Consultant carried out a valua-tion of the Petroleum Storagefacilities in Port Vila inSeptember 1983.
5. Training & Manpower PlanningCFTC-1 July 83 N/A Training Course on Energy
Planning: Vanuatu representa-tive attended this exercise heldin Suva, Fiji in July 83.
ESCAP-6 Nov. 83 N/A Petroleum Supply/Pricing -Training Workshop: Vanuatu wasalso represented at this coursein November last year.
CHOGRM-4 Mid 85 N/A Workshop in Coconut Oil asDiesel Fuel: Vanuatu will beinvited to be represented atthis workshop scheduled aroundmid 85.
6. Institutional DevelopmentADB-1 Mid 84 N/A Energy Planner: Resident expert
support to organize the EnergyPlanning Unit and re-set inmotion the national energyplanning process.
Source: Mission estimates.
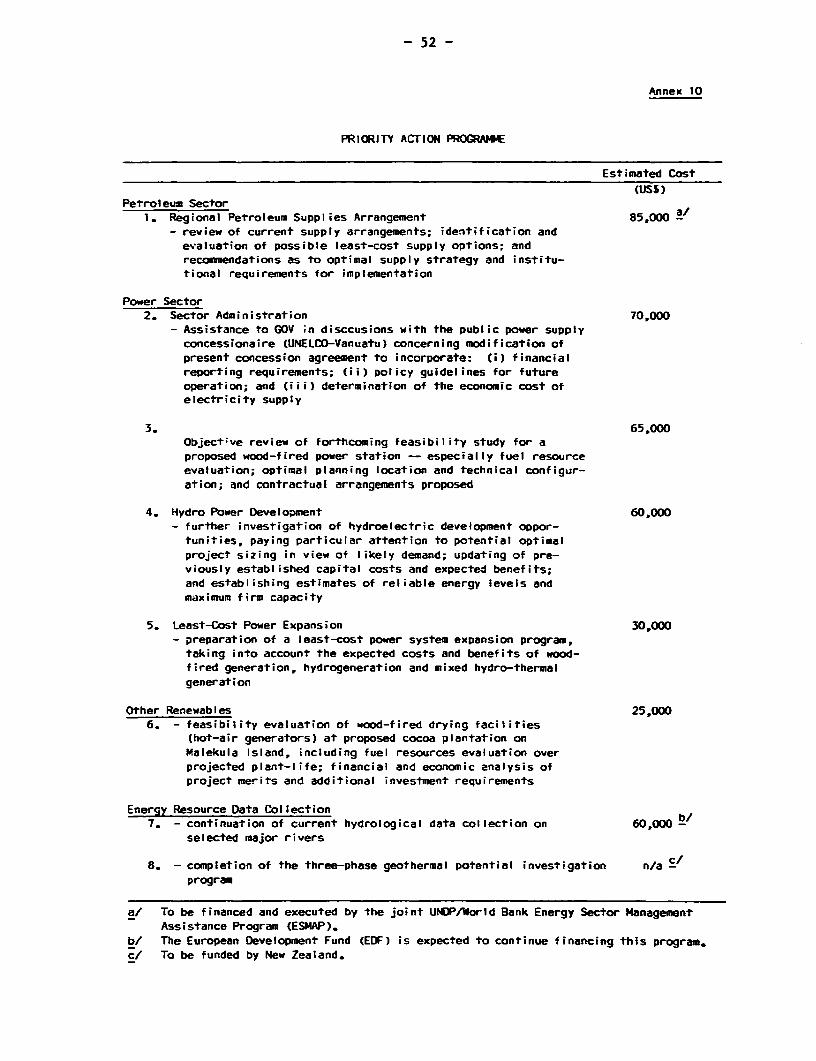
- 52 -
Annex 10
PRIORITY ACTION PROGRAMME
Estimated Cost
(USS)Petroleum Sector
1. Regional Petroleum Supplies Arrangement 85,000 a/- review of current supply arrangements; identification andevaluation of possible least-cost supply options; andrecormendations as to optimal supply strategy and institu-tional requirements for implementation
Power Sector2. Sector Administration 70,000
- Assistance to GOV in disccusions with the public power supplyconcessionaire (UNELOD-Vanuatu) concerning modification ofpresent concession agreement to incorporate: Ci) financialreporting requirements; (ii) policy guidelines for futureoperation; and (iii) determination of the economic cost ofelectricity supply
3. 65.000Objective review of forthcoming feasibility study for aproposed wood-fired power station - especially fuel resourceevaluation; optimal planning location and technical configur-ation; and contractual arrangements proposed
4. Hydro Power Development 60,000- further investigation of hydroelectric development oppor-tunities, paying particular attention to potential optimalproject sizing in view of likely demand; updating of pre-viously established capital costs and expected benefits;and establishing estimates of reliable energy levels andmaximum firm capacity
5. Least-Cost Power Expansion 30 000- preparation of a least-cost power system expansion program,taking into account the expected costs and benefits of wood-fired generation, hydrogeneration and mixed hydro-thermalgeneration
Other Renewables 25,0006. - feasibility evaluation of wood-fired drying facilities
(hot-air generators) at proposed cocoa plantation onMalekula Island, including fuel resources evaluation overprojected plant-life; financial and economic analysis ofproject merits and additional investment requirements
Energy Resource Data Collection7. - continuation of current hydrological data collection on 60,000 -
selected major rivers
8. - completion of the three-phase geothermal potential investigation n/a Sprogram
a/ To be financed and executed by the joint UNDPZWorld Bank Energy Sector ManagementAssistance Program (ESMAP).
b/ The European Development Fund (EDF) is expected to continue financing this program.c/ To be funded by New Zealand.
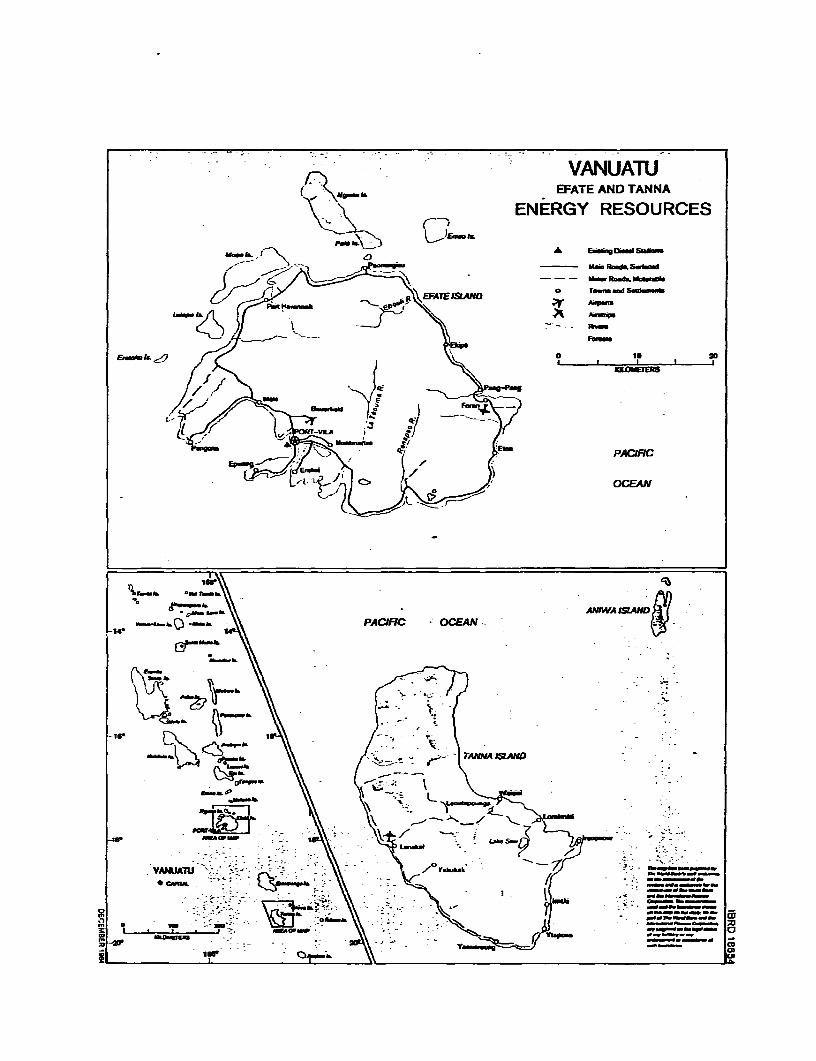
VANUATUEFATE AND TANNA
ENERGY RESOURCES
A E.i 9X.Dina Sm..
Mai. ') SXiid
PARCIC<<5 ~~~~~~~~~~OCEAN
.C Or-AA
t a $ \ . ~~~~~~~~~~~~~~~AWA X54
r_ a\ pARC 0r,-
V-WA-* A --
ALI.~ ~ ~ ~ N
IM* 0 IOPA
SOLDA1 Owe ° _u -- _ _ .
- iew 0 - 2;_ s * -- \\ * Wv -e __;__~~~~~~~~~~~~~~~c
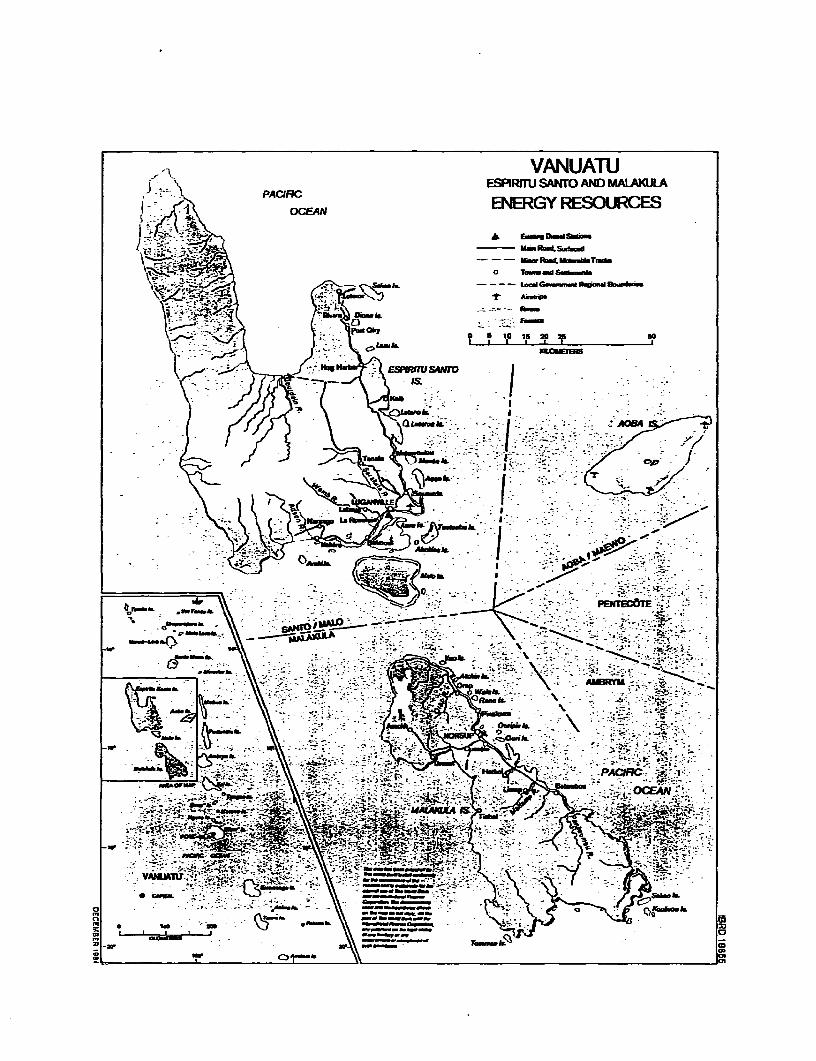
VANUATUN. ' ESPIRrTU SAWrO AND MALAJULA
,. t OCEAN ENERGY RESOURCES
Xi~A ~. - -- M+w ;Ro.d. b.MT4ix ~ ~ ~ ~ ~ ~ ~ 0 T~ M Somma
N~~~~~c S b f - - - - Ly X oaI mz wu
) af#S- . t\5. : I I:
ESPOWSANTO
-- T..- 1.bb"'.,-!---i-,,- /<~~~~~Q.k. - * j OBA/
- i 2jm | -h~ h - ~ w .-- '.:
* \j UW e- - > 4
I..~~~~~~~~~~~~~~.i PBE 71
ANBRYM -
0- rpil AL~,-4..
-PACIFIC -'~
N.. ~. . --
oo o f \ C
0 so ~ ~ ~ ~ -