Embed Size (px)
Citation preview
1
L-Carnitine in omnivorous diets induces an atherogenic gut microbial
pathway in humans
Robert A. Koeth1,2,3, Betzabe Rachel Lam-Galvez4, Jennifer Kirsop1,2, Zeneng Wang1,2, Bruce S. Levison1,
Xiaodong Gu1,2, Matthew F. Copeland4, David Bartlett1,#, David B. Cody4, Hong J. Dai5, Miranda K. Culley1,*,
Xinmin S. Li1,2, Xiaoming Fu1,2, Yuping Wu6, Lin Li1,2, Joseph A. DiDonato1,2, W. H. Wilson Tang1,2,3, Jose
Carlos Garcia-Garcia4 and Stanley L. Hazen1,2,3
1Department of Cellular & Molecular Medicine, Lerner Research Institute; 2Center for Microbiome & Human
Health; and 3Department of Cardiovascular Medicine, Cleveland Clinic, Cleveland, Ohio 44195, USA.4Life Sciences TPT, and 5Global Biosciences, The Procter & Gamble Company, Cincinnati, Ohio 45040, USA. 6Department of Mathematics, Cleveland State University, Cleveland, Ohio 44115, USA.
# current address: Department of Diagnostic Radiology, Mayo Clinic, Rochester, MN 55905, USA.
* current address: Department of Vascular Medicine Institute, University of Pittsburgh School of Medicine,
Pittsburgh, PA 15213, USA.
Address for Correspondence:
Stanley L. Hazen, MD PhD
Department of Cellular & Molecular Medicine, Lerner Research Institute, Cleveland Clinic
9500 Euclid Avenue, mail code NC-10
Cleveland, OH 44195
Phone: (216) 445-9763
Fax: (216) 636-0392
E-mail: [email protected]

2
SUPPLEMENTARY DATA INDEX:
SUPPLEMENTAL FIGURE LEGENDS
- Supplemental Figure 1. (Page 3)
- Supplemental Figure 2. (Page 4)
- Supplemental Figure 3. (Page 5)
- Supplemental Figure 4. (Page 6)
- Supplemental Figure 5. (Page 7)
- Supplemental Figure 6. (Page 8)
SUPPLEMENTAL TABLES
- Supplemental Table 1. (Page 9)
- Supplemental Table 2. (Page 10)
- TREND Statement Checklist. (Pages 11-13)
3
Supplemental Figure 1. Fasting plasma concentrations of L-carnitine in vegans and vegetarians (n =
32) versus omnivores (n = 40). Boxes represent the 25th, 50th, and 75th percentile and whiskers represent
the 10th and 90th percentile. Plasma concentrations of L-carnitine were determined using LC/MS/MS.
Wilcoxon rank sums was used to assess differences between groups.
4
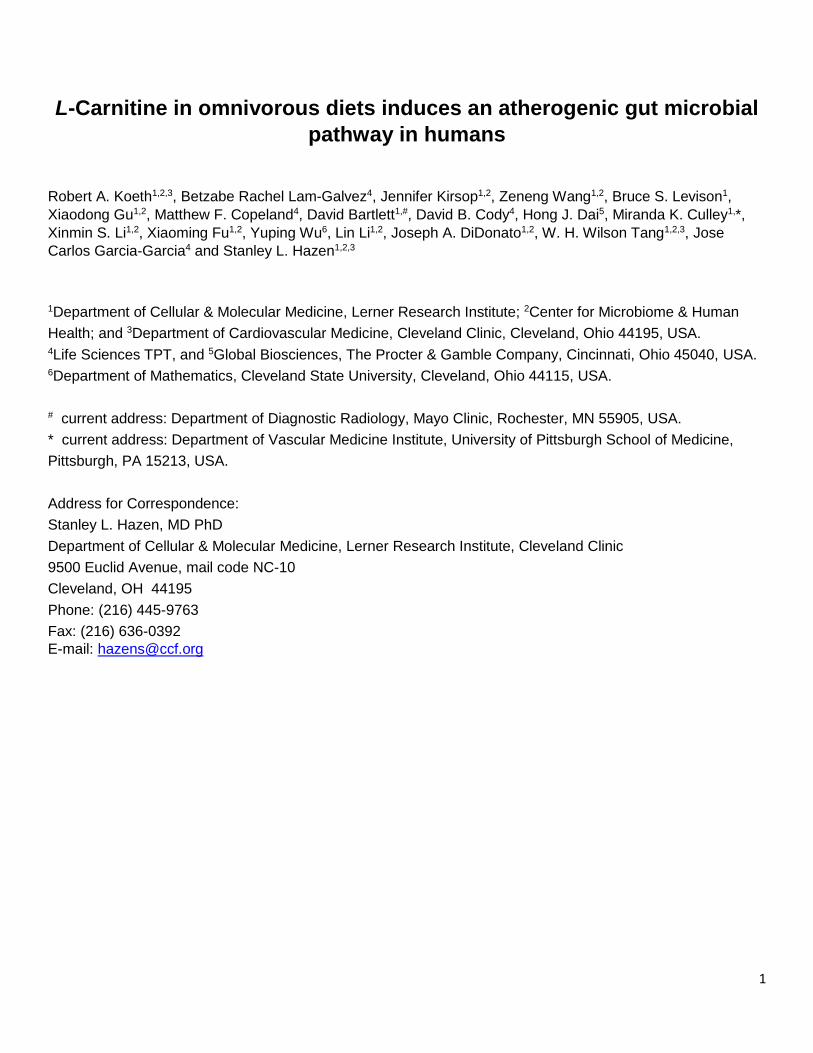
Supplemental Figure 2. Plasma BB concentrations in L-carnitine supplementation study. BB plasma
concentrations in subjects (n = 7 vegans/vegetarians and n = 7 omnivores) at baseline, and following daily L-
carnitine supplementation at visit 2 (Visit 2 = 1 month), and visit 3 (Visit 3 = at least 2 months). Data presented
as mean ± SEM. A repeated measures 1-way ANOVA test was used to assess differences among visits.
5
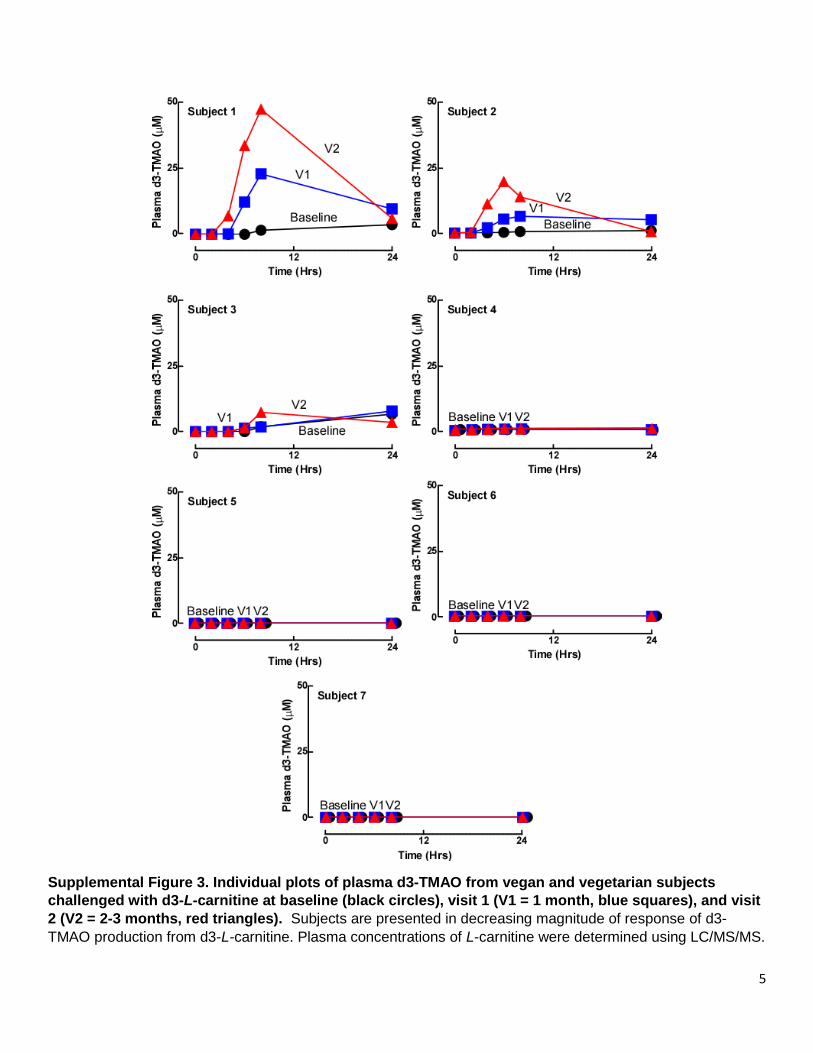
Supplemental Figure 3. Individual plots of plasma d3-TMAO from vegan and vegetarian subjects
challenged with d3-L-carnitine at baseline (black circles), visit 1 (V1 = 1 month, blue squares), and visit
2 (V2 = 2-3 months, red triangles). Subjects are presented in decreasing magnitude of response of d3-
TMAO production from d3-L-carnitine. Plasma concentrations of L-carnitine were determined using LC/MS/MS.
6
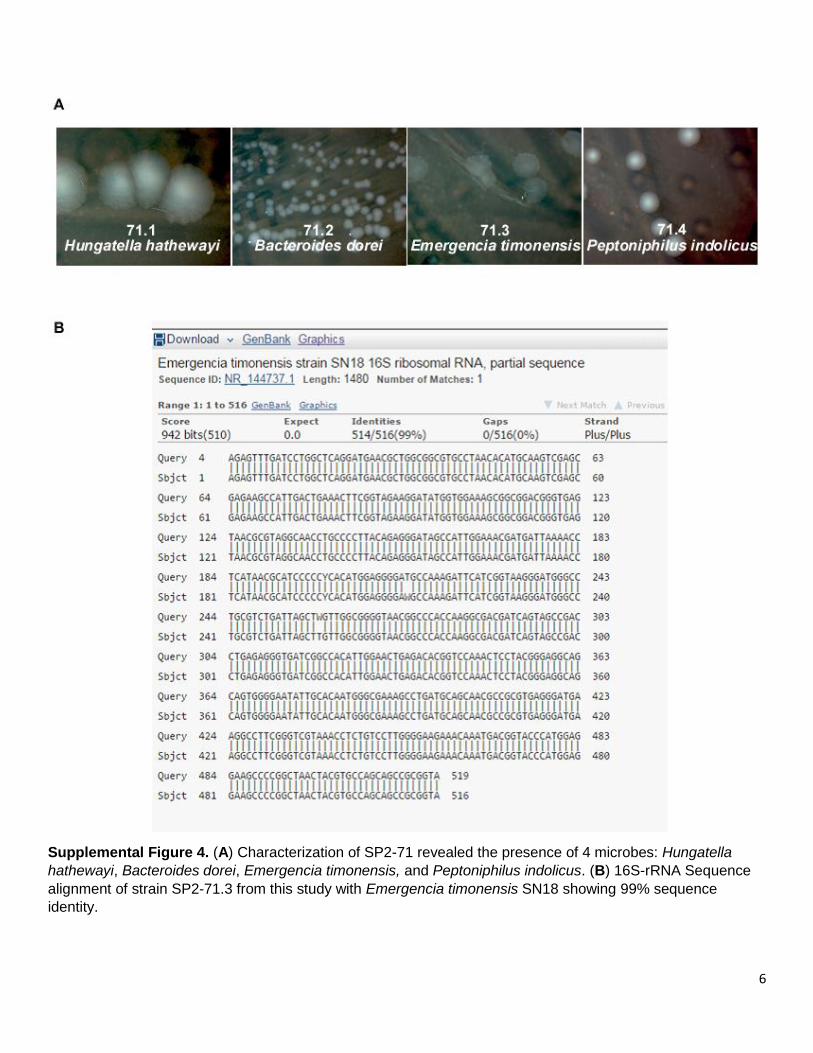
Supplemental Figure 4. (A) Characterization of SP2-71 revealed the presence of 4 microbes: Hungatella
hathewayi, Bacteroides dorei, Emergencia timonensis, and Peptoniphilus indolicus. (B) 16S-rRNA Sequence
alignment of strain SP2-71.3 from this study with Emergencia timonensis SN18 showing 99% sequence
identity.
7
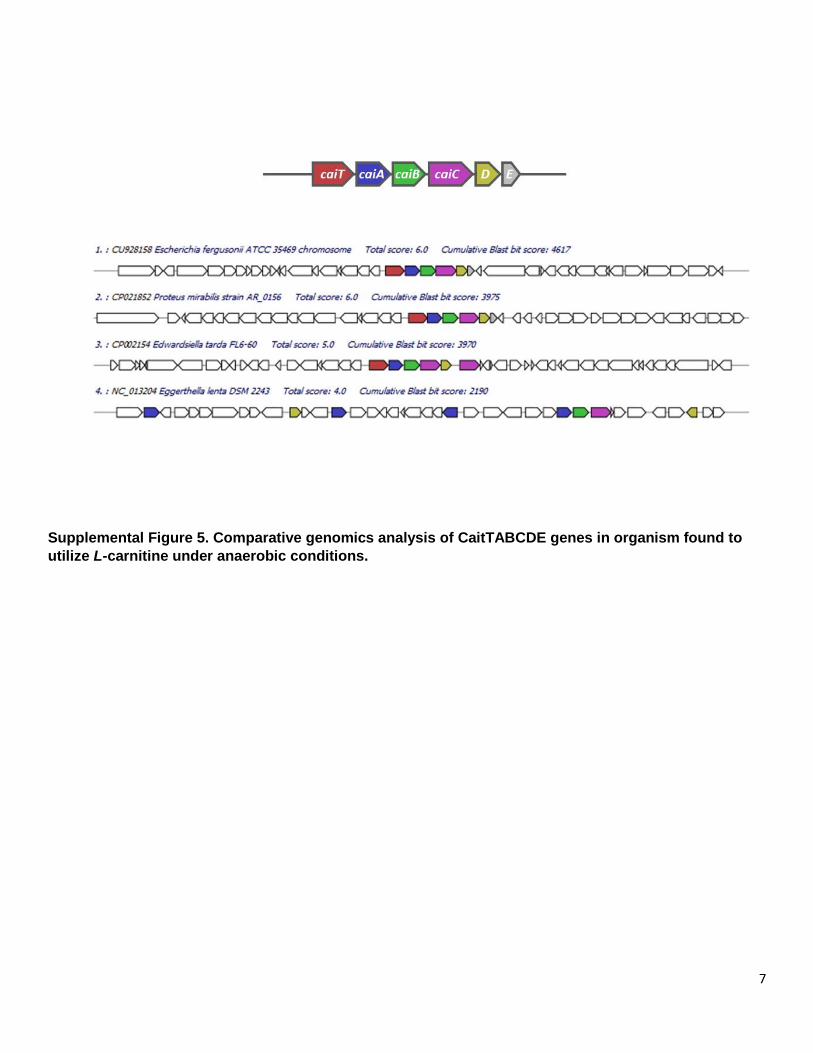
Supplemental Figure 5. Comparative genomics analysis of CaitTABCDE genes in organism found to
utilize L-carnitine under anaerobic conditions.
8
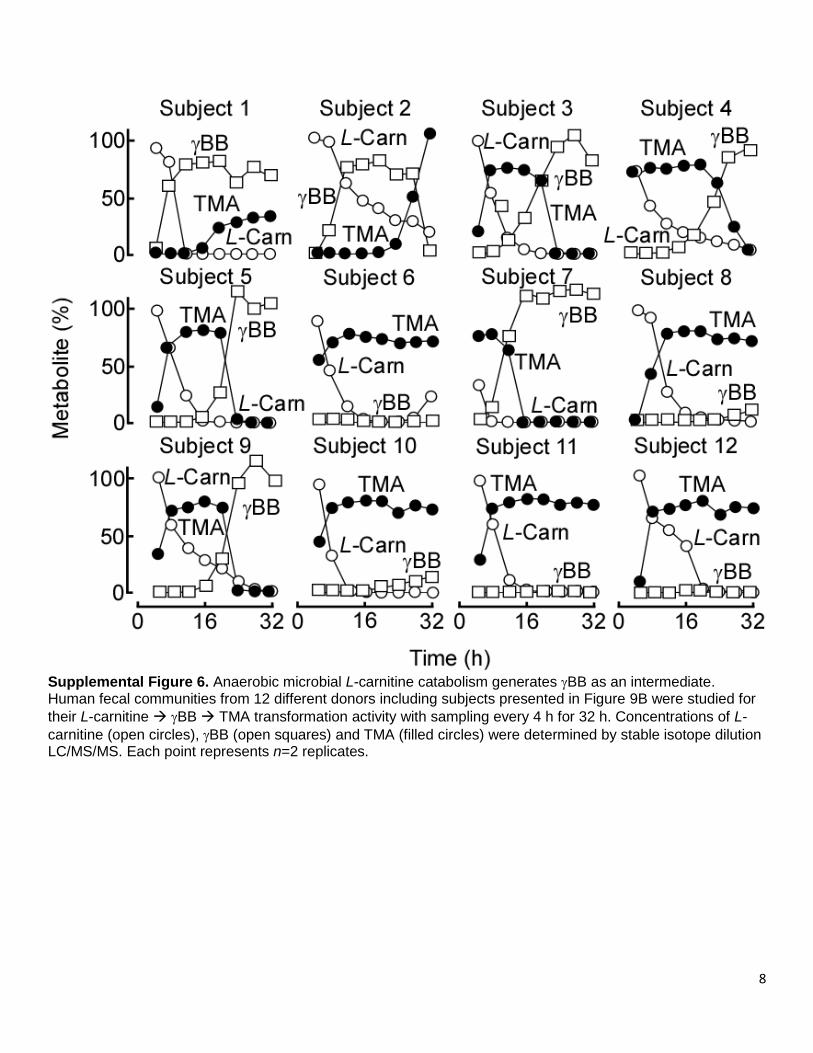
Supplemental Figure 6. Anaerobic microbial L-carnitine catabolism generates BB as an intermediate. Human fecal communities from 12 different donors including subjects presented in Figure 9B were studied for
their L-carnitine BB TMA transformation activity with sampling every 4 h for 32 h. Concentrations of L-
carnitine (open circles), BB (open squares) and TMA (filled circles) were determined by stable isotope dilution LC/MS/MS. Each point represents n=2 replicates.
9
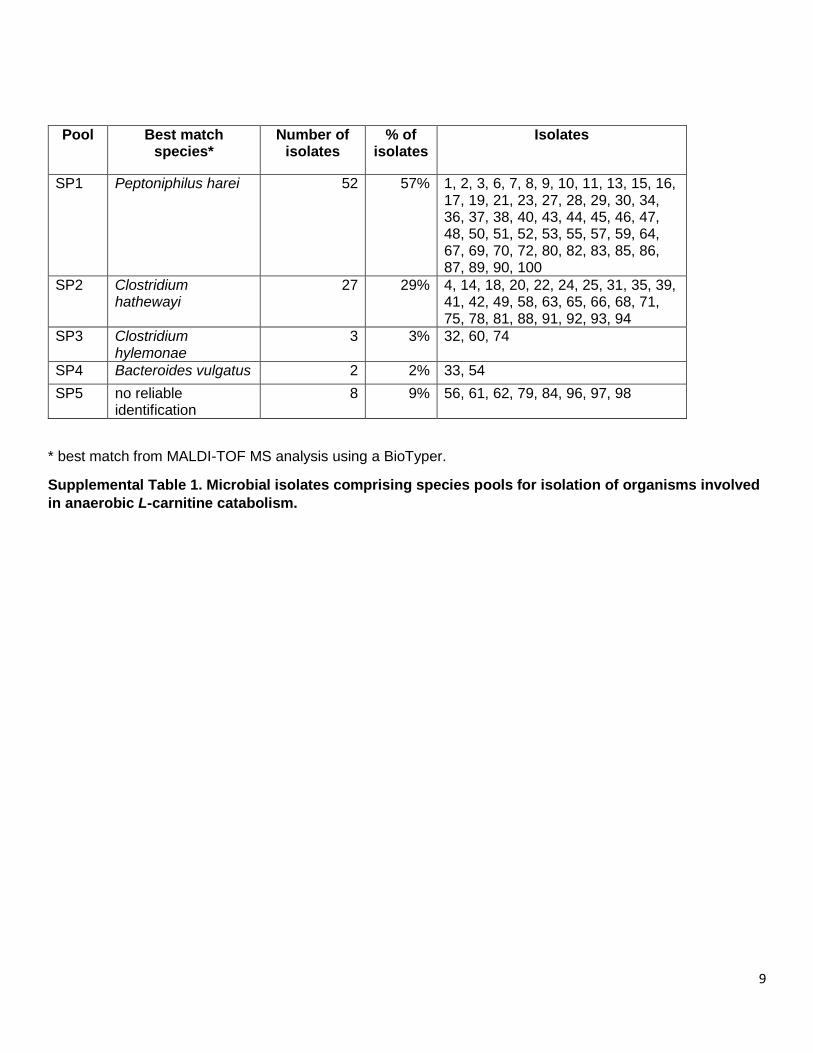
Pool Best match species*
Number of isolates
% of isolates
Isolates
SP1 Peptoniphilus harei 52 57% 1, 2, 3, 6, 7, 8, 9, 10, 11, 13, 15, 16, 17, 19, 21, 23, 27, 28, 29, 30, 34, 36, 37, 38, 40, 43, 44, 45, 46, 47, 48, 50, 51, 52, 53, 55, 57, 59, 64, 67, 69, 70, 72, 80, 82, 83, 85, 86, 87, 89, 90, 100
SP2 Clostridium hathewayi
27 29% 4, 14, 18, 20, 22, 24, 25, 31, 35, 39, 41, 42, 49, 58, 63, 65, 66, 68, 71, 75, 78, 81, 88, 91, 92, 93, 94
SP3 Clostridium hylemonae
3 3% 32, 60, 74
SP4 Bacteroides vulgatus 2 2% 33, 54
SP5 no reliable identification
8 9% 56, 61, 62, 79, 84, 96, 97, 98
* best match from MALDI-TOF MS analysis using a BioTyper.
Supplemental Table 1. Microbial isolates comprising species pools for isolation of organisms involved
in anaerobic L-carnitine catabolism.
10
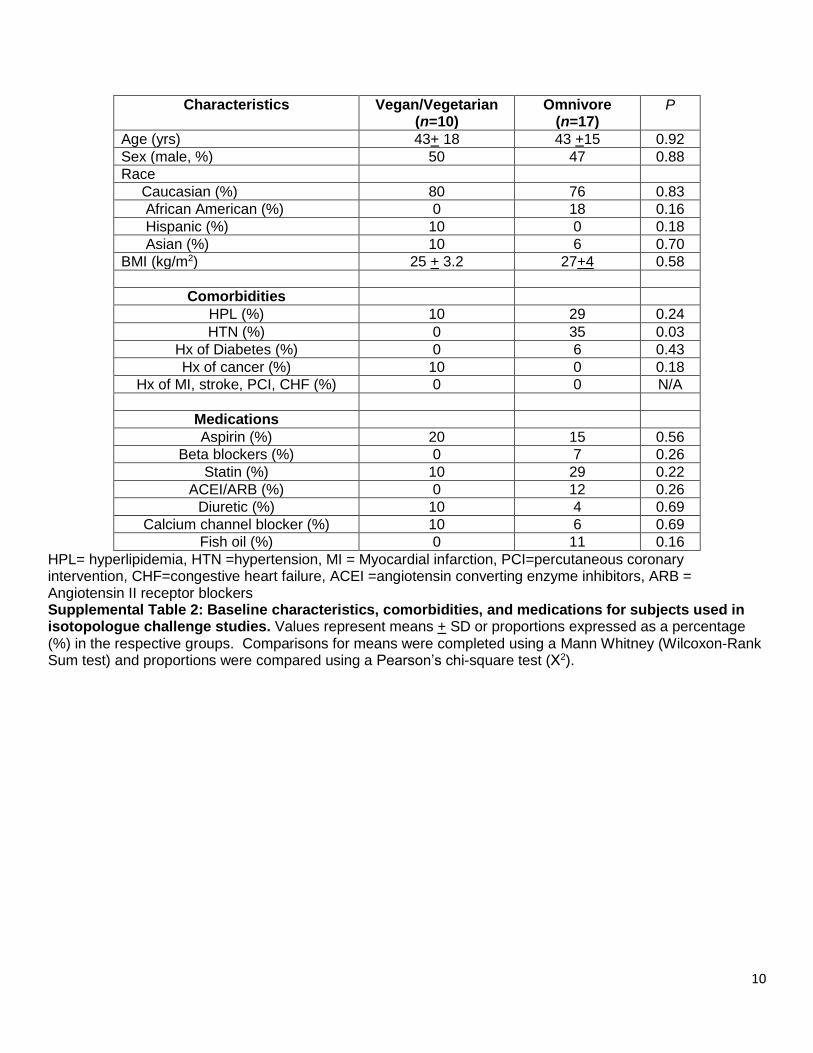
Characteristics Vegan/Vegetarian (n=10)
Omnivore (n=17)
P
Age (yrs) 43+ 18 43 +15 0.92
Sex (male, %) 50 47 0.88
Race
Caucasian (%) 80 76 0.83
African American (%) 0 18 0.16
Hispanic (%) 10 0 0.18
Asian (%) 10 6 0.70
BMI (kg/m2) 25 + 3.2 27+4 0.58
Comorbidities
HPL (%) 10 29 0.24
HTN (%) 0 35 0.03
Hx of Diabetes (%) 0 6 0.43
Hx of cancer (%) 10 0 0.18
Hx of MI, stroke, PCI, CHF (%) 0 0 N/A
Medications
Aspirin (%) 20 15 0.56
Beta blockers (%) 0 7 0.26
Statin (%) 10 29 0.22
ACEI/ARB (%) 0 12 0.26
Diuretic (%) 10 4 0.69
Calcium channel blocker (%) 10 6 0.69
Fish oil (%) 0 11 0.16
HPL= hyperlipidemia, HTN =hypertension, MI = Myocardial infarction, PCI=percutaneous coronary intervention, CHF=congestive heart failure, ACEI =angiotensin converting enzyme inhibitors, ARB = Angiotensin II receptor blockers Supplemental Table 2: Baseline characteristics, comorbidities, and medications for subjects used in isotopologue challenge studies. Values represent means + SD or proportions expressed as a percentage (%) in the respective groups. Comparisons for means were completed using a Mann Whitney (Wilcoxon-Rank Sum test) and proportions were compared using a Pearson’s chi-square test (Χ2).
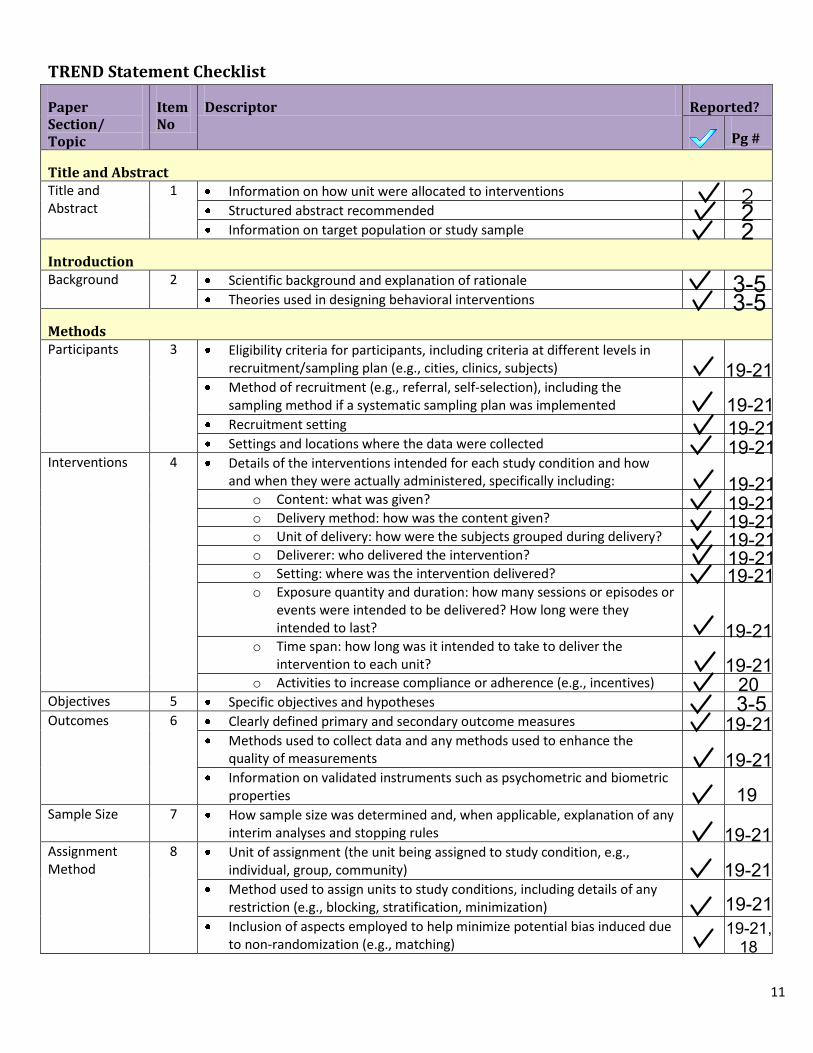
TREND Statement Checklist
Paper Section/ Topic
Item No
Descriptor Reported?
Pg #
Title and Abstract Title and Abstract
1 Information on how unit were allocated to interventions
Structured abstract recommended
Information on target population or study sample
Introduction Background 2 Scientific background and explanation of rationale
Theories used in designing behavioral interventions
Methods Participants 3 Eligibility criteria for participants, including criteria at different levels in
recruitment/sampling plan (e.g., cities, clinics, subjects)
Method of recruitment (e.g., referral, self-selection), including the sampling method if a systematic sampling plan was implemented
Recruitment setting
Settings and locations where the data were collected
Interventions 4 Details of the interventions intended for each study condition and how and when they were actually administered, specifically including:
o Content: what was given?
o Delivery method: how was the content given?
o Unit of delivery: how were the subjects grouped during delivery?
o Deliverer: who delivered the intervention?
o Setting: where was the intervention delivered?
o Exposure quantity and duration: how many sessions or episodes orevents were intended to be delivered? How long were theyintended to last?
o Time span: how long was it intended to take to deliver theintervention to each unit?
o Activities to increase compliance or adherence (e.g., incentives)
Objectives 5 Specific objectives and hypotheses
Outcomes 6 Clearly defined primary and secondary outcome measures
Methods used to collect data and any methods used to enhance the quality of measurements
Information on validated instruments such as psychometric and biometric properties
Sample Size 7 How sample size was determined and, when applicable, explanation of any interim analyses and stopping rules
Assignment Method
8 Unit of assignment (the unit being assigned to study condition, e.g., individual, group, community)
Method used to assign units to study conditions, including details of any restriction (e.g., blocking, stratification, minimization)
Inclusion of aspects employed to help minimize potential bias induced due to non-randomization (e.g., matching)
222
3-53-5
19-21
19-2119-2119-21
19-2119-2119-2119-2119-2119-21
19-21
19-21203-5
19-21
19-21
19
19-21
19-21
19-2119-21,
18
11
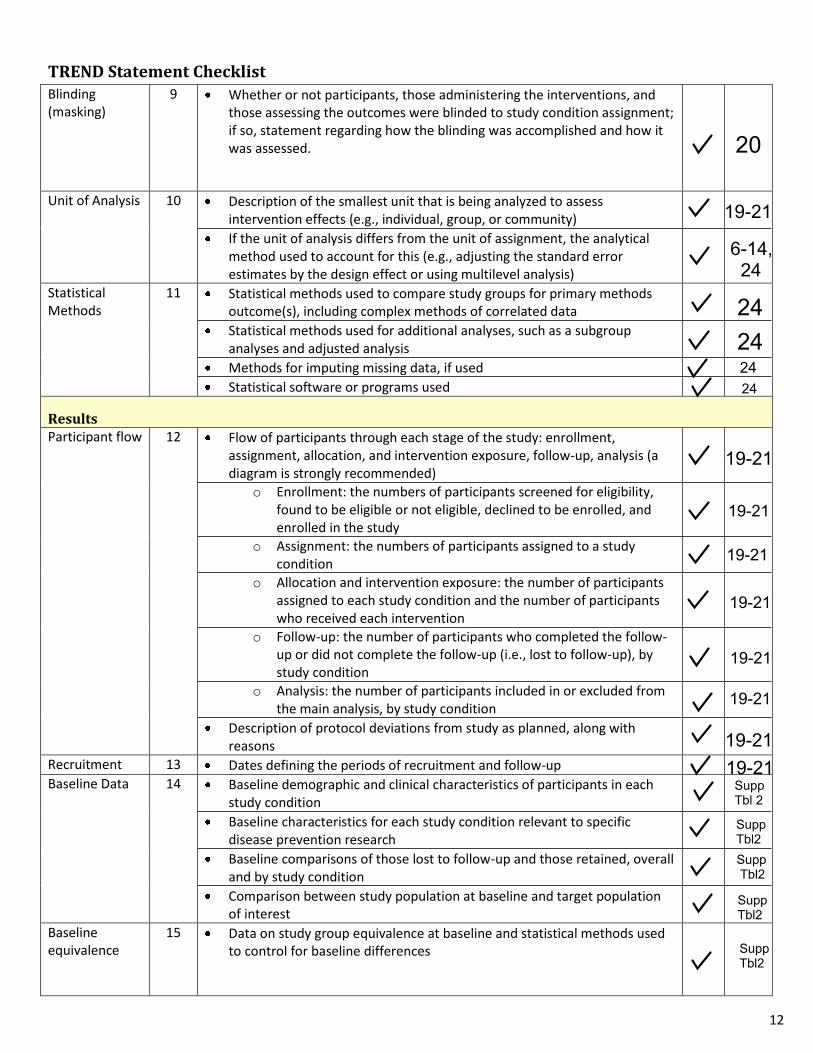
TREND Statement Checklist Blinding (masking)
9 Whether or not participants, those administering the interventions, and those assessing the outcomes were blinded to study condition assignment; if so, statement regarding how the blinding was accomplished and how it was assessed.
Unit of Analysis 10 Description of the smallest unit that is being analyzed to assess intervention effects (e.g., individual, group, or community)
If the unit of analysis differs from the unit of assignment, the analytical method used to account for this (e.g., adjusting the standard error estimates by the design effect or using multilevel analysis)
Statistical Methods
11 Statistical methods used to compare study groups for primary methods outcome(s), including complex methods of correlated data
Statistical methods used for additional analyses, such as a subgroup analyses and adjusted analysis
Methods for imputing missing data, if used
Statistical software or programs used
Results Participant flow 12 Flow of participants through each stage of the study: enrollment,
assignment, allocation, and intervention exposure, follow-up, analysis (a diagram is strongly recommended)
o Enrollment: the numbers of participants screened for eligibility,found to be eligible or not eligible, declined to be enrolled, andenrolled in the study
o Assignment: the numbers of participants assigned to a studycondition
o Allocation and intervention exposure: the number of participantsassigned to each study condition and the number of participantswho received each intervention
o Follow-up: the number of participants who completed the follow-up or did not complete the follow-up (i.e., lost to follow-up), bystudy condition
o Analysis: the number of participants included in or excluded fromthe main analysis, by study condition
Description of protocol deviations from study as planned, along with reasons
Recruitment 13 Dates defining the periods of recruitment and follow-up
Baseline Data 14 Baseline demographic and clinical characteristics of participants in each study condition
Baseline characteristics for each study condition relevant to specific disease prevention research
Baseline comparisons of those lost to follow-up and those retained, overall and by study condition
Comparison between study population at baseline and target population of interest
Baseline equivalence
15 Data on study group equivalence at baseline and statistical methods used to control for baseline differences
20
19-21
6-14,24
24242424
19-21
19-2119-21
19-21
19-21
19-21
19-21
19-21
Supp Tbl 2
Supp Tbl2 Supp Tbl2
Supp Tbl2
Supp Tbl2
12
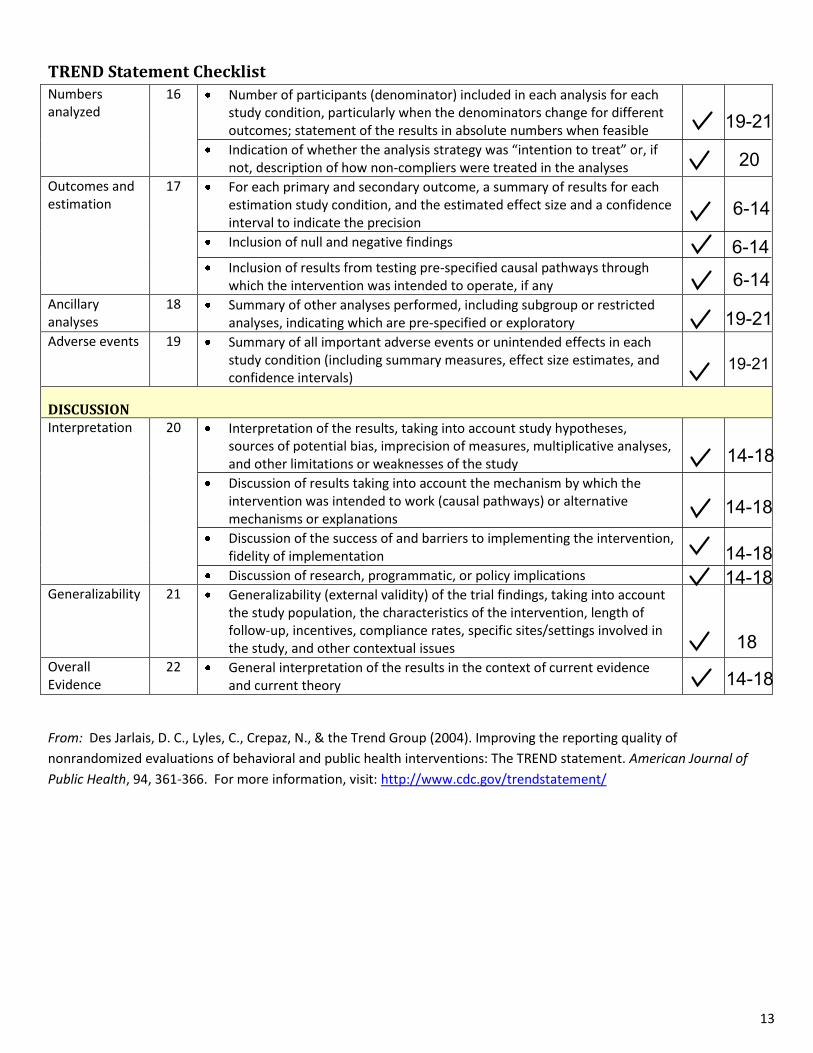
TREND Statement Checklist Numbers analyzed
16 Number of participants (denominator) included in each analysis for each study condition, particularly when the denominators change for different outcomes; statement of the results in absolute numbers when feasible
Indication of whether the analysis strategy was “intention to treat” or, if not, description of how non-compliers were treated in the analyses
Outcomes and estimation
17 For each primary and secondary outcome, a summary of results for each estimation study condition, and the estimated effect size and a confidence interval to indicate the precision
Inclusion of null and negative findings
Inclusion of results from testing pre-specified causal pathways through which the intervention was intended to operate, if any
Ancillary analyses
18 Summary of other analyses performed, including subgroup or restricted analyses, indicating which are pre-specified or exploratory
Adverse events 19 Summary of all important adverse events or unintended effects in each study condition (including summary measures, effect size estimates, and confidence intervals)
DISCUSSION Interpretation 20 Interpretation of the results, taking into account study hypotheses,
sources of potential bias, imprecision of measures, multiplicative analyses, and other limitations or weaknesses of the study
Discussion of results taking into account the mechanism by which the intervention was intended to work (causal pathways) or alternative mechanisms or explanations
Discussion of the success of and barriers to implementing the intervention, fidelity of implementation
Discussion of research, programmatic, or policy implications
Generalizability 21 Generalizability (external validity) of the trial findings, taking into account the study population, the characteristics of the intervention, length of follow-up, incentives, compliance rates, specific sites/settings involved in the study, and other contextual issues
Overall Evidence
22 General interpretation of the results in the context of current evidence and current theory
From: Des Jarlais, D. C., Lyles, C., Crepaz, N., & the Trend Group (2004). Improving the reporting quality of
nonrandomized evaluations of behavioral and public health interventions: The TREND statement. American Journal of
Public Health, 94, 361-366. For more information, visit: http://www.cdc.gov/trendstatement/
14-18
18
14-18
14-18
14-1814-18
19-21
6-14
6-14
6-14
20
19-21
19-21
13


![Quantifying atherogenic lipoproteins for lipid-lowering ... · quantification of atherogenic lipoproteins in nonfasting and fasting blood samples [1, 2]. This article summarizes the](https://img.pdfslide.us/doc/110x75/5f1041c77e708231d44836fa/quantifying-atherogenic-lipoproteins-for-lipid-lowering-quantification-of-atherogenic.jpg)