Embed Size (px)
Citation preview
8132019 L 7amp8 ElectricalSubmersiblePump
httpslidepdfcomreaderfulll-78-electricalsubmersiblepump 112
1
PETROLEUM ENGINEERING DEPARTMENT
FLOW LOOP EXPERIMENT
EXPERIMENT 7 amp 8
ELECTRICAL SUBMERSIBLE PUMPS (ESP)
8132019 L 7amp8 ElectricalSubmersiblePump
httpslidepdfcomreaderfulll-78-electricalsubmersiblepump 212
2
ELECTRICAL SUBMERIBLE PUMP (ESP)
OBJECTIVE
To develop the performance curve of an ESP
To study the effect of rotation speed and intake pressure to the pump performace
To Examine the Affinity Law
CENTRIFUGAL PUMP THEORY
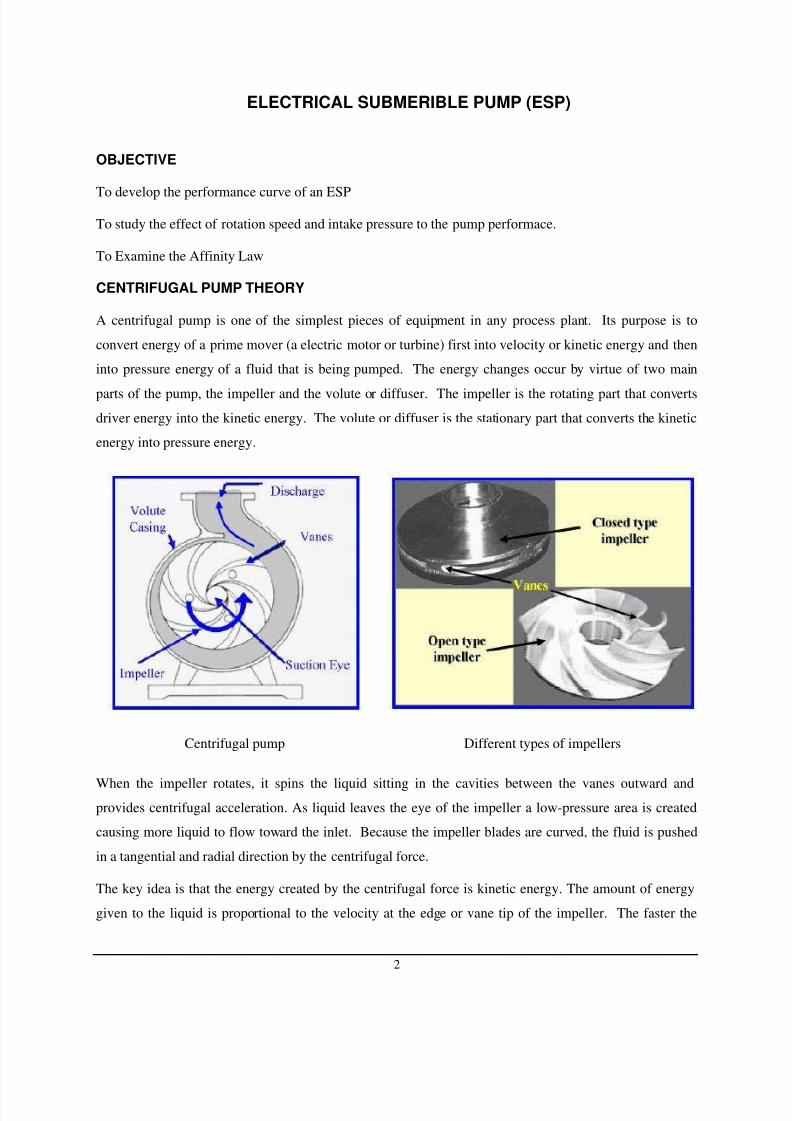
A centrifugal pump is one of the simplest pieces of equipment in any process plant Its purpose is to
convert energy of a prime mover (a electric motor or turbine) first into velocity or kinetic energy and then
into pressure energy of a fluid that is being pumped The energy changes occur by virtue of two main
parts of the pump the impeller and the volute or diffuser The impeller is the rotating part that converts
driver energy into the kinetic energy The volute or diffuser is the stationary part that converts the kinetic
energy into pressure energy
Centrifugal pump Different types of impellers
When the impeller rotates it spins the liquid sitting in the cavities between the vanes outward and
provides centrifugal acceleration As liquid leaves the eye of the impeller a low-pressure area is created
causing more liquid to flow toward the inlet Because the impeller blades are curved the fluid is pushed
in a tangential and radial direction by the centrifugal force
The key idea is that the energy created by the centrifugal force is kinetic energy The amount of energy
given to the liquid is proportional to the velocity at the edge or vane tip of the impeller The faster the
8132019 L 7amp8 ElectricalSubmersiblePump
httpslidepdfcomreaderfulll-78-electricalsubmersiblepump 312
3
impeller revolves or the bigger the impeller is then the higher will be the velocity of the liquid at the vane
tip and the greater the energy imparted to the liquid This kinetic energy of a liquid coming out of an
impeller is harnessed by creating a resistance to the flow The first resistance is created by the pump
volute (casing) that catches the liquid and slows it down In the discharge nozzle the liquid further
decelerates and its velocity is converted to pressure according to Bernoullirsquos principle Therefore the
head (pressure in terms of height of liquid) developed is approximately equal to the velocity energy at the
periphery of the impeller expressed by the following well-known formula
983101 983090
where H is the total head developed in feet v is the velocity at periphery of impeller in ftsec and g is the
acceleration due to gravity g = 322 ftsec2
This head can also be calculated from the readings on the pressure gauges attached to the suction anddischarge lines Pump curves relate flow rate and pressure (head) developed by the pump at different
impeller sizes and rotational speeds
Water performance of curve of the ESP GC6100 at Hz one stage
Centrifugal pumps can be single-stage or multi-stage units Single-stage pumps are mainly used when low
to medium discharge pressure is required while multi-stage pumps are designed to overcome higher
discharge pressures This is the case of Electric Submersible Pumping (ESP) used in the petroleum
industry where fluids must be lifted from deep formations
8132019 L 7amp8 ElectricalSubmersiblePump
httpslidepdfcomreaderfulll-78-electricalsubmersiblepump 412
4
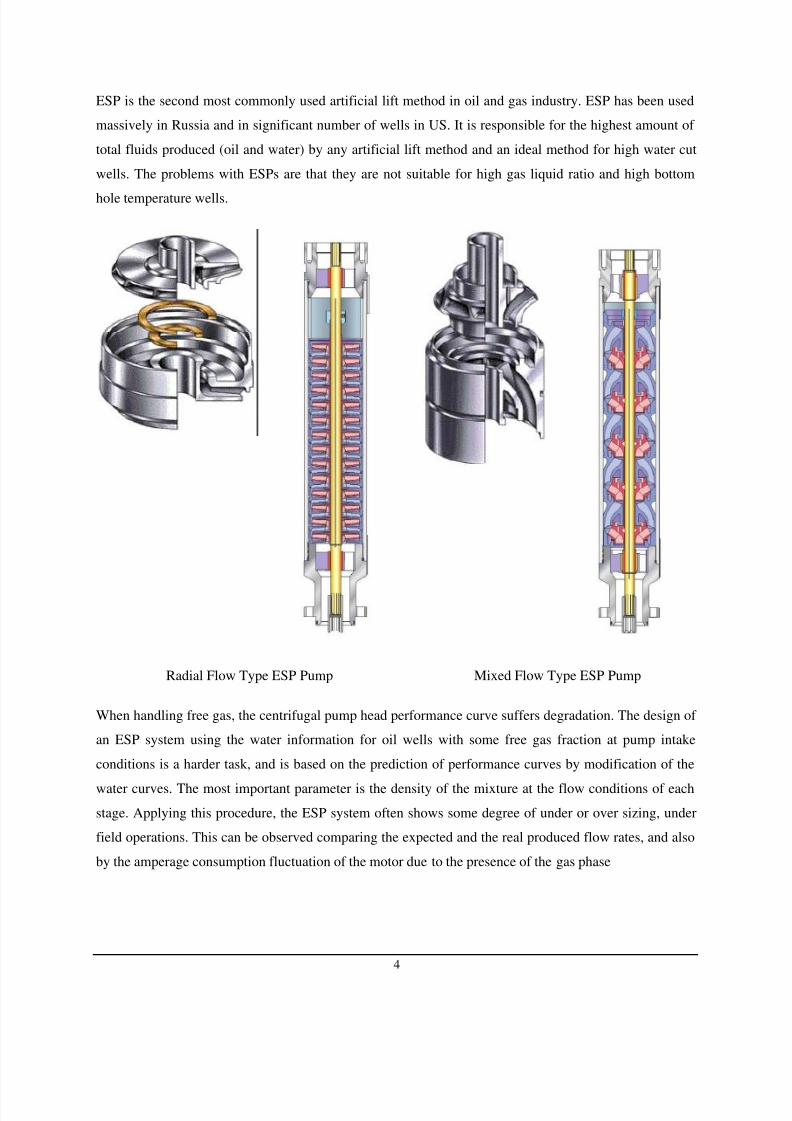
ESP is the second most commonly used artificial lift method in oil and gas industry ESP has been used
massively in Russia and in significant number of wells in US It is responsible for the highest amount of
total fluids produced (oil and water) by any artificial lift method and an ideal method for high water cut
wells The problems with ESPs are that they are not suitable for high gas liquid ratio and high bottom
hole temperature wells
Radial Flow Type ESP Pump Mixed Flow Type ESP Pump
When handling free gas the centrifugal pump head performance curve suffers degradation The design of
an ESP system using the water information for oil wells with some free gas fraction at pump intake
conditions is a harder task and is based on the prediction of performance curves by modification of the
water curves The most important parameter is the density of the mixture at the flow conditions of each
stage Applying this procedure the ESP system often shows some degree of under or over sizing under
field operations This can be observed comparing the expected and the real produced flow rates and also
by the amperage consumption fluctuation of the motor due to the presence of the gas phase
8132019 L 7amp8 ElectricalSubmersiblePump
httpslidepdfcomreaderfulll-78-electricalsubmersiblepump 512
5
The centrifugal pump operation should conform to the pump curves supplied by the manufacturer In
order to read and understand the pump curves it is very important to develop a clear understanding of the
terms used in the curves
Capacity Q GPM
Capacity means the flow rate with which liquid is moved or pushed by the pump to the desired point in
the process It is commonly measured in either gallons per minute (gpm) or cubic meters per hour
(m3 hr) The effect on the flow through a pump by changing the outlet pressures is graphed on a pump
curve
Head H ft
The pressure at any point in a liquid can be thought of as being caused by a vertical column of the liquid
due to its weight The height of this column is called the static head and is expressed in terms of feet of
liquid The same head term is used to measure the kinetic energy created by the pump In other words
head is a measurement of the height of a liquid column that the pump could create from the kinetic energy
imparted to the liquid Head is a term that has units of a length or feet and pressure has units of force per
unit area or pound per square inch The main reason for using head instead of pressure to measure a
centrifugal pumps energy is that the pressure from a pump will change if the specific gravity (weight) of
the liquid changes but the head will not change
8132019 L 7amp8 ElectricalSubmersiblePump
httpslidepdfcomreaderfulll-78-electricalsubmersiblepump 612
6
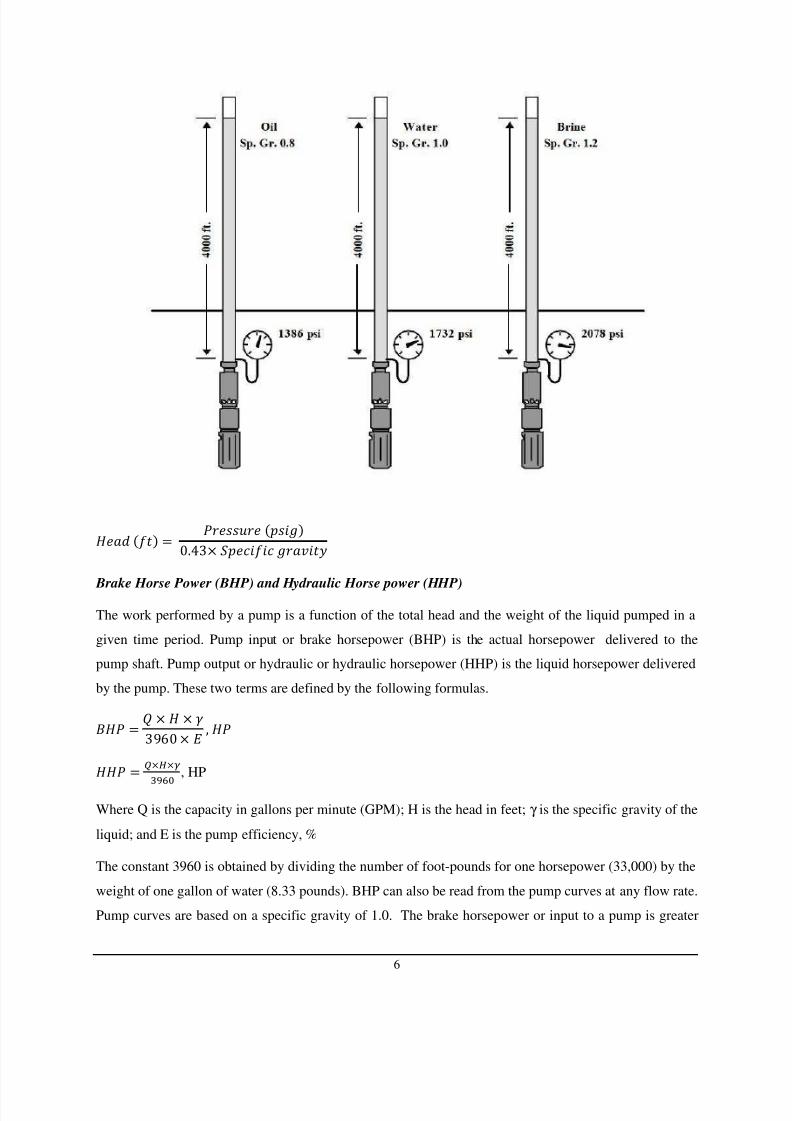
983101 0983092983091983255
Brake Horse Power (BHP) and Hydraulic Horse power (HHP)
The work performed by a pump is a function of the total head and the weight of the liquid pumped in a
given time period Pump input or brake horsepower (BHP) is the actual horsepower delivered to the
pump shaft Pump output or hydraulic or hydraulic horsepower (HHP) is the liquid horsepower delivered
by the pump These two terms are defined by the following formulas
983101 983255 983255 9830919830979830940 983255
983101
983255983255
HP
Where Q is the capacity in gallons per minute (GPM) H is the head in feet γ is the specific gravity of the
liquid and E is the pump efficiency
The constant 3960 is obtained by dividing the number of foot-pounds for one horsepower (33000) by the
weight of one gallon of water (833 pounds) BHP can also be read from the pump curves at any flow rate
Pump curves are based on a specific gravity of 10 The brake horsepower or input to a pump is greater
8132019 L 7amp8 ElectricalSubmersiblePump
httpslidepdfcomreaderfulll-78-electricalsubmersiblepump 712
7
than the hydraulic horsepower or output due to the mechanical and hydraulic losses incurred in the pump
Therefore the pump efficiency is the ratio of these two values
Best Efficiency Point (BEP)
Best Efficiency Point (BEP) is defined as the capacity at which the efficiency of the pump is highest Allpoints to the right or left of BEP have a lower efficiency The BEP is the area on the curve where the
change of velocity energy into pressure energy at a given gallon per minute is optimum in essence the
point where the pump is most efficient The impeller will be subject to non-symmetrical forces when
operating to the right or left of the BEP These forces manifest themselves in many mechanically
unstable conditions like vibration excessive hydraulic thrust temperature rise and erosion and separation
cavitation Thus the operation of a centrifugal pump should not be outside the furthest left or right
efficiency curves published by the manufacturer The centrifugal pump should be operated in a range of
plusmn20 of the maximum efficiency Emax
The -02Emax
is called the lower operating range and the +02Emax
is called the upper operating range If the ESP is operated out of the operating range it will suffer under
either upthrust or downthrust which causes the damage of the impellers
8132019 L 7amp8 ElectricalSubmersiblePump
httpslidepdfcomreaderfulll-78-electricalsubmersiblepump 812
8
Specific Speed
Specific Speed as a measure of the geometric similarity of pumps Specific speed (Ns) is a non-
dimensional design index that identifies the geometric similarity of pumps It is used to classify pump
impellers as to their type and proportions Pumps of the same Ns but of different size are considered to be
geometrically similar one pump being a size- factor of the other Specific speed Calculation The
following formula is used to determine specific speed
983101 983255
Where Q is the capacity at the best efficiency point in GPM H is the head per stage at BEP in feet and N
is the pump speed in RPM
As per the above formula it is defined as the speed in revolutions per minute at which a geometrically
similar impeller would operate if it were of such a size as to deliver one gallon per minute flow against
one-foot head The understanding of this definition is of design engineering significance only however
and specific speed should be thought of only as an index used to predict certain pump characteristics
Specific speed as a measure of the shape or class of the impellers The specific speed determines the
general shape or class of the impellers As the specific speed increases the ratio of the impeller outlet
diameter D2 to the inlet or eye diameter D1 decreases This ratio becomes 10 for a true axial flow
impeller Radial flow impellers develop head principally through centrifugal force Radial impellers are
generally low flow high head designs Pumps of higher specific speeds develop head partly by centrifugal
force and partly by axial force A higher specific speed indicates a pump design with head generation
more by axial forces and less by centrifugal forces An axial flow or propeller pump with a specific speed
of 10000 or greater generates its head exclusively through axial forces Axial flow impellers are high
flow low head designs
Ns 500 to 5000 D1D2 gt 15 - radial flow pump
Ns 5000 to 10000 D1D2 lt 15 - mixed flow pump
Ns 10000 to 15000 D1D2 = 1 - axial flow pump
8132019 L 7amp8 ElectricalSubmersiblePump
httpslidepdfcomreaderfulll-78-electricalsubmersiblepump 912
Classification of
Chat Ef
The Affinity Laws
The Affinity Laws are mathematic
when a change is made to pump sp
9
entrifugal Pumps according to Specific Speed
ficiency of Pumps Versus Specific Speed
al expressions that define changes in pump capaci
ed impeller diameter or both According to Affinit
s
y head and BHP
y Laws
8132019 L 7amp8 ElectricalSubmersiblePump
httpslidepdfcomreaderfulll-78-electricalsubmersiblepump 1012
10
Capacity Q changes in direct proportion to speed N ratio
983101
Head H changes in direct proportion to the square of speed N ratio
983101
BHP changes in direct proportion to the cube of speed ratio
983101
The Affinity Laws are valid only under conditions of constant efficiency and very low viscosity of fluids
EXPERIMENTS
Note that we have two pumps connected in series With two pumps in series we can simulate an ESP
with 2 stages We can also simulate the two pumps in series in the different way the first pump is to
simulate the bottom hole pressure or the intake pressure of the ESP meanwhile the second pump is
simulated as an ESP with 1 stage We can change the speed of the ESP by controlling the VFD Similarly
the intake pressure of the ESP can be varied by adjusting the return valve
This procedure is applied for those who are very familiar with the flow loop If students have any
questions or concerns please check with the TA
1 Keep the ldquomanualautordquo switch in the speed control panel in the manual mode
2 Adjust all the valves in the right postions we need to have the flow through the two pumps frac34rsquorsquo
pipe and through the frac12rsquorsquo pipe (No flow through the orifice)
3 Mass flow meter will be used for all ESP tests
Experiment 7 Develop the pump performancersquos curves of an ESP
Procedures
1 Keep the discharge pressure of the first pump (intake pressure of the second pump) at 30 psig by
adjusting the return valve on the return line of the first pump
2 On the speed control panel set a speed of 3500 RPM for the second pump
3 Start recording the data
8132019 L 7amp8 ElectricalSubmersiblePump
httpslidepdfcomreaderfulll-78-electricalsubmersiblepump 1112
11
4 Use the end valve as circle in the flow loop schematic to change the flow rate of the the fluid In
the beginning the end valve must be open The end valve will be changed from fully open to
fully close with 10 different openings Talk with the TA if you need help
5 Repeat steps 2 to 4 with different pump speed for the second pump 3200 3000 2700 2400
2000 1500 RPM
6 Stop recording the data
7 Stop the two pumps
8 Copy the data and then turn off the production lab program
Calculation
1 Convert the flow rate to barrel per day (BPD) and m3 s
2 Convert the differential pressure between intake and discharge pressure to head in the unit of ft
and meter
3 Calculate the hydraulic horse power developed by the second pump
4 Calculate the specific speed of the pump
5 Develop the performance curve of the pump by plotting these ralationships in one graph head (ft
and meter) vs flow rate (bblday and m3 s) specific speed vs flow rate (bblday) hydraulic horse
power vs flow rate (bblday)
6 Plot the performance curve for the two-stage pump (two pump in series) Assuming the intake
pressure is zero
End valve
8132019 L 7amp8 ElectricalSubmersiblePump
httpslidepdfcomreaderfulll-78-electricalsubmersiblepump 1212
12
Questions
1 What is the priciple of bulding head in a centrifugal pump
2 What are the differences between a conventional centrifugal pump and an ESP
3 What are the advantages and disadvantages of an ESP
4 What are the problems if the ESP is operated out of the operating range
5 How does the pump speed change the pump performace curves Why
6 Based on the calculated specific speed how would you classify this centrifigal pump
Experiment 8 The effects of intake pressure on the pump performace curves - Affinity Law
Procedure
1 Apply the same procedure in the experiment 7 but with only two pump speed of 3200 RPM
and 3000 RPM and different intake pressure of 10 20 40 and 50 psig
Calculations
Note that for all the calculations below flow rate is expressed in bblday and head in feet
1 Use the performance curve at 3500 RPM and intake pressure of 30 psig obtained from the
experiment 7 as a reference Apply the Affinity Law to predict the performance curves at
different pump speed of 3200 3000 2700 2400 RPM
2 Plot in the same plot the performance curves predicted by the Affinity Law and the performace
curves obtained from experimental data in the experiment 7
3 Plot the relationship between head and flow rate at 3200 RPM at different intake pressure 10
20 30 40 and 50 psig
4 Generate a similar plot as step 3 but with the pump speed of 3000 RPM
Questions
1 Describe the Affinity Law What are the limitations of the Affinity Law
2 How does the Affinity Law match with the experimental data What may cause the descrepancy
between the prediction of Affinity Law and the experimental data
3
Based on the experimental data how does the intake pressure affect on the pump performanceWhat would you predict the effect of the intake pressure on the pump performance if the fluid is
two phase liquid and gas
8132019 L 7amp8 ElectricalSubmersiblePump
httpslidepdfcomreaderfulll-78-electricalsubmersiblepump 212
2
ELECTRICAL SUBMERIBLE PUMP (ESP)
OBJECTIVE
To develop the performance curve of an ESP
To study the effect of rotation speed and intake pressure to the pump performace
To Examine the Affinity Law
CENTRIFUGAL PUMP THEORY
A centrifugal pump is one of the simplest pieces of equipment in any process plant Its purpose is to
convert energy of a prime mover (a electric motor or turbine) first into velocity or kinetic energy and then
into pressure energy of a fluid that is being pumped The energy changes occur by virtue of two main
parts of the pump the impeller and the volute or diffuser The impeller is the rotating part that converts
driver energy into the kinetic energy The volute or diffuser is the stationary part that converts the kinetic
energy into pressure energy
Centrifugal pump Different types of impellers
When the impeller rotates it spins the liquid sitting in the cavities between the vanes outward and
provides centrifugal acceleration As liquid leaves the eye of the impeller a low-pressure area is created
causing more liquid to flow toward the inlet Because the impeller blades are curved the fluid is pushed
in a tangential and radial direction by the centrifugal force
The key idea is that the energy created by the centrifugal force is kinetic energy The amount of energy
given to the liquid is proportional to the velocity at the edge or vane tip of the impeller The faster the
8132019 L 7amp8 ElectricalSubmersiblePump
httpslidepdfcomreaderfulll-78-electricalsubmersiblepump 312
3
impeller revolves or the bigger the impeller is then the higher will be the velocity of the liquid at the vane
tip and the greater the energy imparted to the liquid This kinetic energy of a liquid coming out of an
impeller is harnessed by creating a resistance to the flow The first resistance is created by the pump
volute (casing) that catches the liquid and slows it down In the discharge nozzle the liquid further
decelerates and its velocity is converted to pressure according to Bernoullirsquos principle Therefore the
head (pressure in terms of height of liquid) developed is approximately equal to the velocity energy at the
periphery of the impeller expressed by the following well-known formula
983101 983090
where H is the total head developed in feet v is the velocity at periphery of impeller in ftsec and g is the
acceleration due to gravity g = 322 ftsec2
This head can also be calculated from the readings on the pressure gauges attached to the suction anddischarge lines Pump curves relate flow rate and pressure (head) developed by the pump at different
impeller sizes and rotational speeds
Water performance of curve of the ESP GC6100 at Hz one stage
Centrifugal pumps can be single-stage or multi-stage units Single-stage pumps are mainly used when low
to medium discharge pressure is required while multi-stage pumps are designed to overcome higher
discharge pressures This is the case of Electric Submersible Pumping (ESP) used in the petroleum
industry where fluids must be lifted from deep formations
8132019 L 7amp8 ElectricalSubmersiblePump
httpslidepdfcomreaderfulll-78-electricalsubmersiblepump 412
4
ESP is the second most commonly used artificial lift method in oil and gas industry ESP has been used
massively in Russia and in significant number of wells in US It is responsible for the highest amount of
total fluids produced (oil and water) by any artificial lift method and an ideal method for high water cut
wells The problems with ESPs are that they are not suitable for high gas liquid ratio and high bottom
hole temperature wells
Radial Flow Type ESP Pump Mixed Flow Type ESP Pump
When handling free gas the centrifugal pump head performance curve suffers degradation The design of
an ESP system using the water information for oil wells with some free gas fraction at pump intake
conditions is a harder task and is based on the prediction of performance curves by modification of the
water curves The most important parameter is the density of the mixture at the flow conditions of each
stage Applying this procedure the ESP system often shows some degree of under or over sizing under
field operations This can be observed comparing the expected and the real produced flow rates and also
by the amperage consumption fluctuation of the motor due to the presence of the gas phase
8132019 L 7amp8 ElectricalSubmersiblePump
httpslidepdfcomreaderfulll-78-electricalsubmersiblepump 512
5
The centrifugal pump operation should conform to the pump curves supplied by the manufacturer In
order to read and understand the pump curves it is very important to develop a clear understanding of the
terms used in the curves
Capacity Q GPM
Capacity means the flow rate with which liquid is moved or pushed by the pump to the desired point in
the process It is commonly measured in either gallons per minute (gpm) or cubic meters per hour
(m3 hr) The effect on the flow through a pump by changing the outlet pressures is graphed on a pump
curve
Head H ft
The pressure at any point in a liquid can be thought of as being caused by a vertical column of the liquid
due to its weight The height of this column is called the static head and is expressed in terms of feet of
liquid The same head term is used to measure the kinetic energy created by the pump In other words
head is a measurement of the height of a liquid column that the pump could create from the kinetic energy
imparted to the liquid Head is a term that has units of a length or feet and pressure has units of force per
unit area or pound per square inch The main reason for using head instead of pressure to measure a
centrifugal pumps energy is that the pressure from a pump will change if the specific gravity (weight) of
the liquid changes but the head will not change
8132019 L 7amp8 ElectricalSubmersiblePump
httpslidepdfcomreaderfulll-78-electricalsubmersiblepump 612
6
983101 0983092983091983255
Brake Horse Power (BHP) and Hydraulic Horse power (HHP)
The work performed by a pump is a function of the total head and the weight of the liquid pumped in a
given time period Pump input or brake horsepower (BHP) is the actual horsepower delivered to the
pump shaft Pump output or hydraulic or hydraulic horsepower (HHP) is the liquid horsepower delivered
by the pump These two terms are defined by the following formulas
983101 983255 983255 9830919830979830940 983255
983101
983255983255
HP
Where Q is the capacity in gallons per minute (GPM) H is the head in feet γ is the specific gravity of the
liquid and E is the pump efficiency
The constant 3960 is obtained by dividing the number of foot-pounds for one horsepower (33000) by the
weight of one gallon of water (833 pounds) BHP can also be read from the pump curves at any flow rate
Pump curves are based on a specific gravity of 10 The brake horsepower or input to a pump is greater
8132019 L 7amp8 ElectricalSubmersiblePump
httpslidepdfcomreaderfulll-78-electricalsubmersiblepump 712
7
than the hydraulic horsepower or output due to the mechanical and hydraulic losses incurred in the pump
Therefore the pump efficiency is the ratio of these two values
Best Efficiency Point (BEP)
Best Efficiency Point (BEP) is defined as the capacity at which the efficiency of the pump is highest Allpoints to the right or left of BEP have a lower efficiency The BEP is the area on the curve where the
change of velocity energy into pressure energy at a given gallon per minute is optimum in essence the
point where the pump is most efficient The impeller will be subject to non-symmetrical forces when
operating to the right or left of the BEP These forces manifest themselves in many mechanically
unstable conditions like vibration excessive hydraulic thrust temperature rise and erosion and separation
cavitation Thus the operation of a centrifugal pump should not be outside the furthest left or right
efficiency curves published by the manufacturer The centrifugal pump should be operated in a range of
plusmn20 of the maximum efficiency Emax
The -02Emax
is called the lower operating range and the +02Emax
is called the upper operating range If the ESP is operated out of the operating range it will suffer under
either upthrust or downthrust which causes the damage of the impellers
8132019 L 7amp8 ElectricalSubmersiblePump
httpslidepdfcomreaderfulll-78-electricalsubmersiblepump 812
8
Specific Speed
Specific Speed as a measure of the geometric similarity of pumps Specific speed (Ns) is a non-
dimensional design index that identifies the geometric similarity of pumps It is used to classify pump
impellers as to their type and proportions Pumps of the same Ns but of different size are considered to be
geometrically similar one pump being a size- factor of the other Specific speed Calculation The
following formula is used to determine specific speed
983101 983255
Where Q is the capacity at the best efficiency point in GPM H is the head per stage at BEP in feet and N
is the pump speed in RPM
As per the above formula it is defined as the speed in revolutions per minute at which a geometrically
similar impeller would operate if it were of such a size as to deliver one gallon per minute flow against
one-foot head The understanding of this definition is of design engineering significance only however
and specific speed should be thought of only as an index used to predict certain pump characteristics
Specific speed as a measure of the shape or class of the impellers The specific speed determines the
general shape or class of the impellers As the specific speed increases the ratio of the impeller outlet
diameter D2 to the inlet or eye diameter D1 decreases This ratio becomes 10 for a true axial flow
impeller Radial flow impellers develop head principally through centrifugal force Radial impellers are
generally low flow high head designs Pumps of higher specific speeds develop head partly by centrifugal
force and partly by axial force A higher specific speed indicates a pump design with head generation
more by axial forces and less by centrifugal forces An axial flow or propeller pump with a specific speed
of 10000 or greater generates its head exclusively through axial forces Axial flow impellers are high
flow low head designs
Ns 500 to 5000 D1D2 gt 15 - radial flow pump
Ns 5000 to 10000 D1D2 lt 15 - mixed flow pump
Ns 10000 to 15000 D1D2 = 1 - axial flow pump
8132019 L 7amp8 ElectricalSubmersiblePump
httpslidepdfcomreaderfulll-78-electricalsubmersiblepump 912
Classification of
Chat Ef
The Affinity Laws
The Affinity Laws are mathematic
when a change is made to pump sp
9
entrifugal Pumps according to Specific Speed
ficiency of Pumps Versus Specific Speed
al expressions that define changes in pump capaci
ed impeller diameter or both According to Affinit
s
y head and BHP
y Laws
8132019 L 7amp8 ElectricalSubmersiblePump
httpslidepdfcomreaderfulll-78-electricalsubmersiblepump 1012
10
Capacity Q changes in direct proportion to speed N ratio
983101
Head H changes in direct proportion to the square of speed N ratio
983101
BHP changes in direct proportion to the cube of speed ratio
983101
The Affinity Laws are valid only under conditions of constant efficiency and very low viscosity of fluids
EXPERIMENTS
Note that we have two pumps connected in series With two pumps in series we can simulate an ESP
with 2 stages We can also simulate the two pumps in series in the different way the first pump is to
simulate the bottom hole pressure or the intake pressure of the ESP meanwhile the second pump is
simulated as an ESP with 1 stage We can change the speed of the ESP by controlling the VFD Similarly
the intake pressure of the ESP can be varied by adjusting the return valve
This procedure is applied for those who are very familiar with the flow loop If students have any
questions or concerns please check with the TA
1 Keep the ldquomanualautordquo switch in the speed control panel in the manual mode
2 Adjust all the valves in the right postions we need to have the flow through the two pumps frac34rsquorsquo
pipe and through the frac12rsquorsquo pipe (No flow through the orifice)
3 Mass flow meter will be used for all ESP tests
Experiment 7 Develop the pump performancersquos curves of an ESP
Procedures
1 Keep the discharge pressure of the first pump (intake pressure of the second pump) at 30 psig by
adjusting the return valve on the return line of the first pump
2 On the speed control panel set a speed of 3500 RPM for the second pump
3 Start recording the data
8132019 L 7amp8 ElectricalSubmersiblePump
httpslidepdfcomreaderfulll-78-electricalsubmersiblepump 1112
11
4 Use the end valve as circle in the flow loop schematic to change the flow rate of the the fluid In
the beginning the end valve must be open The end valve will be changed from fully open to
fully close with 10 different openings Talk with the TA if you need help
5 Repeat steps 2 to 4 with different pump speed for the second pump 3200 3000 2700 2400
2000 1500 RPM
6 Stop recording the data
7 Stop the two pumps
8 Copy the data and then turn off the production lab program
Calculation
1 Convert the flow rate to barrel per day (BPD) and m3 s
2 Convert the differential pressure between intake and discharge pressure to head in the unit of ft
and meter
3 Calculate the hydraulic horse power developed by the second pump
4 Calculate the specific speed of the pump
5 Develop the performance curve of the pump by plotting these ralationships in one graph head (ft
and meter) vs flow rate (bblday and m3 s) specific speed vs flow rate (bblday) hydraulic horse
power vs flow rate (bblday)
6 Plot the performance curve for the two-stage pump (two pump in series) Assuming the intake
pressure is zero
End valve
8132019 L 7amp8 ElectricalSubmersiblePump
httpslidepdfcomreaderfulll-78-electricalsubmersiblepump 1212
12
Questions
1 What is the priciple of bulding head in a centrifugal pump
2 What are the differences between a conventional centrifugal pump and an ESP
3 What are the advantages and disadvantages of an ESP
4 What are the problems if the ESP is operated out of the operating range
5 How does the pump speed change the pump performace curves Why
6 Based on the calculated specific speed how would you classify this centrifigal pump
Experiment 8 The effects of intake pressure on the pump performace curves - Affinity Law
Procedure
1 Apply the same procedure in the experiment 7 but with only two pump speed of 3200 RPM
and 3000 RPM and different intake pressure of 10 20 40 and 50 psig
Calculations
Note that for all the calculations below flow rate is expressed in bblday and head in feet
1 Use the performance curve at 3500 RPM and intake pressure of 30 psig obtained from the
experiment 7 as a reference Apply the Affinity Law to predict the performance curves at
different pump speed of 3200 3000 2700 2400 RPM
2 Plot in the same plot the performance curves predicted by the Affinity Law and the performace
curves obtained from experimental data in the experiment 7
3 Plot the relationship between head and flow rate at 3200 RPM at different intake pressure 10
20 30 40 and 50 psig
4 Generate a similar plot as step 3 but with the pump speed of 3000 RPM
Questions
1 Describe the Affinity Law What are the limitations of the Affinity Law
2 How does the Affinity Law match with the experimental data What may cause the descrepancy
between the prediction of Affinity Law and the experimental data
3
Based on the experimental data how does the intake pressure affect on the pump performanceWhat would you predict the effect of the intake pressure on the pump performance if the fluid is
two phase liquid and gas

8132019 L 7amp8 ElectricalSubmersiblePump
httpslidepdfcomreaderfulll-78-electricalsubmersiblepump 312
3
impeller revolves or the bigger the impeller is then the higher will be the velocity of the liquid at the vane
tip and the greater the energy imparted to the liquid This kinetic energy of a liquid coming out of an
impeller is harnessed by creating a resistance to the flow The first resistance is created by the pump
volute (casing) that catches the liquid and slows it down In the discharge nozzle the liquid further
decelerates and its velocity is converted to pressure according to Bernoullirsquos principle Therefore the
head (pressure in terms of height of liquid) developed is approximately equal to the velocity energy at the
periphery of the impeller expressed by the following well-known formula
983101 983090
where H is the total head developed in feet v is the velocity at periphery of impeller in ftsec and g is the
acceleration due to gravity g = 322 ftsec2
This head can also be calculated from the readings on the pressure gauges attached to the suction anddischarge lines Pump curves relate flow rate and pressure (head) developed by the pump at different
impeller sizes and rotational speeds
Water performance of curve of the ESP GC6100 at Hz one stage
Centrifugal pumps can be single-stage or multi-stage units Single-stage pumps are mainly used when low
to medium discharge pressure is required while multi-stage pumps are designed to overcome higher
discharge pressures This is the case of Electric Submersible Pumping (ESP) used in the petroleum
industry where fluids must be lifted from deep formations
8132019 L 7amp8 ElectricalSubmersiblePump
httpslidepdfcomreaderfulll-78-electricalsubmersiblepump 412
4
ESP is the second most commonly used artificial lift method in oil and gas industry ESP has been used
massively in Russia and in significant number of wells in US It is responsible for the highest amount of
total fluids produced (oil and water) by any artificial lift method and an ideal method for high water cut
wells The problems with ESPs are that they are not suitable for high gas liquid ratio and high bottom
hole temperature wells
Radial Flow Type ESP Pump Mixed Flow Type ESP Pump
When handling free gas the centrifugal pump head performance curve suffers degradation The design of
an ESP system using the water information for oil wells with some free gas fraction at pump intake
conditions is a harder task and is based on the prediction of performance curves by modification of the
water curves The most important parameter is the density of the mixture at the flow conditions of each
stage Applying this procedure the ESP system often shows some degree of under or over sizing under
field operations This can be observed comparing the expected and the real produced flow rates and also
by the amperage consumption fluctuation of the motor due to the presence of the gas phase
8132019 L 7amp8 ElectricalSubmersiblePump
httpslidepdfcomreaderfulll-78-electricalsubmersiblepump 512
5
The centrifugal pump operation should conform to the pump curves supplied by the manufacturer In
order to read and understand the pump curves it is very important to develop a clear understanding of the
terms used in the curves
Capacity Q GPM
Capacity means the flow rate with which liquid is moved or pushed by the pump to the desired point in
the process It is commonly measured in either gallons per minute (gpm) or cubic meters per hour
(m3 hr) The effect on the flow through a pump by changing the outlet pressures is graphed on a pump
curve
Head H ft
The pressure at any point in a liquid can be thought of as being caused by a vertical column of the liquid
due to its weight The height of this column is called the static head and is expressed in terms of feet of
liquid The same head term is used to measure the kinetic energy created by the pump In other words
head is a measurement of the height of a liquid column that the pump could create from the kinetic energy
imparted to the liquid Head is a term that has units of a length or feet and pressure has units of force per
unit area or pound per square inch The main reason for using head instead of pressure to measure a
centrifugal pumps energy is that the pressure from a pump will change if the specific gravity (weight) of
the liquid changes but the head will not change
8132019 L 7amp8 ElectricalSubmersiblePump
httpslidepdfcomreaderfulll-78-electricalsubmersiblepump 612
6
983101 0983092983091983255
Brake Horse Power (BHP) and Hydraulic Horse power (HHP)
The work performed by a pump is a function of the total head and the weight of the liquid pumped in a
given time period Pump input or brake horsepower (BHP) is the actual horsepower delivered to the
pump shaft Pump output or hydraulic or hydraulic horsepower (HHP) is the liquid horsepower delivered
by the pump These two terms are defined by the following formulas
983101 983255 983255 9830919830979830940 983255
983101
983255983255
HP
Where Q is the capacity in gallons per minute (GPM) H is the head in feet γ is the specific gravity of the
liquid and E is the pump efficiency
The constant 3960 is obtained by dividing the number of foot-pounds for one horsepower (33000) by the
weight of one gallon of water (833 pounds) BHP can also be read from the pump curves at any flow rate
Pump curves are based on a specific gravity of 10 The brake horsepower or input to a pump is greater
8132019 L 7amp8 ElectricalSubmersiblePump
httpslidepdfcomreaderfulll-78-electricalsubmersiblepump 712
7
than the hydraulic horsepower or output due to the mechanical and hydraulic losses incurred in the pump
Therefore the pump efficiency is the ratio of these two values
Best Efficiency Point (BEP)
Best Efficiency Point (BEP) is defined as the capacity at which the efficiency of the pump is highest Allpoints to the right or left of BEP have a lower efficiency The BEP is the area on the curve where the
change of velocity energy into pressure energy at a given gallon per minute is optimum in essence the
point where the pump is most efficient The impeller will be subject to non-symmetrical forces when
operating to the right or left of the BEP These forces manifest themselves in many mechanically
unstable conditions like vibration excessive hydraulic thrust temperature rise and erosion and separation
cavitation Thus the operation of a centrifugal pump should not be outside the furthest left or right
efficiency curves published by the manufacturer The centrifugal pump should be operated in a range of
plusmn20 of the maximum efficiency Emax
The -02Emax
is called the lower operating range and the +02Emax
is called the upper operating range If the ESP is operated out of the operating range it will suffer under
either upthrust or downthrust which causes the damage of the impellers
8132019 L 7amp8 ElectricalSubmersiblePump
httpslidepdfcomreaderfulll-78-electricalsubmersiblepump 812
8
Specific Speed
Specific Speed as a measure of the geometric similarity of pumps Specific speed (Ns) is a non-
dimensional design index that identifies the geometric similarity of pumps It is used to classify pump
impellers as to their type and proportions Pumps of the same Ns but of different size are considered to be
geometrically similar one pump being a size- factor of the other Specific speed Calculation The
following formula is used to determine specific speed
983101 983255
Where Q is the capacity at the best efficiency point in GPM H is the head per stage at BEP in feet and N
is the pump speed in RPM
As per the above formula it is defined as the speed in revolutions per minute at which a geometrically
similar impeller would operate if it were of such a size as to deliver one gallon per minute flow against
one-foot head The understanding of this definition is of design engineering significance only however
and specific speed should be thought of only as an index used to predict certain pump characteristics
Specific speed as a measure of the shape or class of the impellers The specific speed determines the
general shape or class of the impellers As the specific speed increases the ratio of the impeller outlet
diameter D2 to the inlet or eye diameter D1 decreases This ratio becomes 10 for a true axial flow
impeller Radial flow impellers develop head principally through centrifugal force Radial impellers are
generally low flow high head designs Pumps of higher specific speeds develop head partly by centrifugal
force and partly by axial force A higher specific speed indicates a pump design with head generation
more by axial forces and less by centrifugal forces An axial flow or propeller pump with a specific speed
of 10000 or greater generates its head exclusively through axial forces Axial flow impellers are high
flow low head designs
Ns 500 to 5000 D1D2 gt 15 - radial flow pump
Ns 5000 to 10000 D1D2 lt 15 - mixed flow pump
Ns 10000 to 15000 D1D2 = 1 - axial flow pump
8132019 L 7amp8 ElectricalSubmersiblePump
httpslidepdfcomreaderfulll-78-electricalsubmersiblepump 912
Classification of
Chat Ef
The Affinity Laws
The Affinity Laws are mathematic
when a change is made to pump sp
9
entrifugal Pumps according to Specific Speed
ficiency of Pumps Versus Specific Speed
al expressions that define changes in pump capaci
ed impeller diameter or both According to Affinit
s
y head and BHP
y Laws
8132019 L 7amp8 ElectricalSubmersiblePump
httpslidepdfcomreaderfulll-78-electricalsubmersiblepump 1012
10
Capacity Q changes in direct proportion to speed N ratio
983101
Head H changes in direct proportion to the square of speed N ratio
983101
BHP changes in direct proportion to the cube of speed ratio
983101
The Affinity Laws are valid only under conditions of constant efficiency and very low viscosity of fluids
EXPERIMENTS
Note that we have two pumps connected in series With two pumps in series we can simulate an ESP
with 2 stages We can also simulate the two pumps in series in the different way the first pump is to
simulate the bottom hole pressure or the intake pressure of the ESP meanwhile the second pump is
simulated as an ESP with 1 stage We can change the speed of the ESP by controlling the VFD Similarly
the intake pressure of the ESP can be varied by adjusting the return valve
This procedure is applied for those who are very familiar with the flow loop If students have any
questions or concerns please check with the TA
1 Keep the ldquomanualautordquo switch in the speed control panel in the manual mode
2 Adjust all the valves in the right postions we need to have the flow through the two pumps frac34rsquorsquo
pipe and through the frac12rsquorsquo pipe (No flow through the orifice)
3 Mass flow meter will be used for all ESP tests
Experiment 7 Develop the pump performancersquos curves of an ESP
Procedures
1 Keep the discharge pressure of the first pump (intake pressure of the second pump) at 30 psig by
adjusting the return valve on the return line of the first pump
2 On the speed control panel set a speed of 3500 RPM for the second pump
3 Start recording the data
8132019 L 7amp8 ElectricalSubmersiblePump
httpslidepdfcomreaderfulll-78-electricalsubmersiblepump 1112
11
4 Use the end valve as circle in the flow loop schematic to change the flow rate of the the fluid In
the beginning the end valve must be open The end valve will be changed from fully open to
fully close with 10 different openings Talk with the TA if you need help
5 Repeat steps 2 to 4 with different pump speed for the second pump 3200 3000 2700 2400
2000 1500 RPM
6 Stop recording the data
7 Stop the two pumps
8 Copy the data and then turn off the production lab program
Calculation
1 Convert the flow rate to barrel per day (BPD) and m3 s
2 Convert the differential pressure between intake and discharge pressure to head in the unit of ft
and meter
3 Calculate the hydraulic horse power developed by the second pump
4 Calculate the specific speed of the pump
5 Develop the performance curve of the pump by plotting these ralationships in one graph head (ft
and meter) vs flow rate (bblday and m3 s) specific speed vs flow rate (bblday) hydraulic horse
power vs flow rate (bblday)
6 Plot the performance curve for the two-stage pump (two pump in series) Assuming the intake
pressure is zero
End valve
8132019 L 7amp8 ElectricalSubmersiblePump
httpslidepdfcomreaderfulll-78-electricalsubmersiblepump 1212
12
Questions
1 What is the priciple of bulding head in a centrifugal pump
2 What are the differences between a conventional centrifugal pump and an ESP
3 What are the advantages and disadvantages of an ESP
4 What are the problems if the ESP is operated out of the operating range
5 How does the pump speed change the pump performace curves Why
6 Based on the calculated specific speed how would you classify this centrifigal pump
Experiment 8 The effects of intake pressure on the pump performace curves - Affinity Law
Procedure
1 Apply the same procedure in the experiment 7 but with only two pump speed of 3200 RPM
and 3000 RPM and different intake pressure of 10 20 40 and 50 psig
Calculations
Note that for all the calculations below flow rate is expressed in bblday and head in feet
1 Use the performance curve at 3500 RPM and intake pressure of 30 psig obtained from the
experiment 7 as a reference Apply the Affinity Law to predict the performance curves at
different pump speed of 3200 3000 2700 2400 RPM
2 Plot in the same plot the performance curves predicted by the Affinity Law and the performace
curves obtained from experimental data in the experiment 7
3 Plot the relationship between head and flow rate at 3200 RPM at different intake pressure 10
20 30 40 and 50 psig
4 Generate a similar plot as step 3 but with the pump speed of 3000 RPM
Questions
1 Describe the Affinity Law What are the limitations of the Affinity Law
2 How does the Affinity Law match with the experimental data What may cause the descrepancy
between the prediction of Affinity Law and the experimental data
3
Based on the experimental data how does the intake pressure affect on the pump performanceWhat would you predict the effect of the intake pressure on the pump performance if the fluid is
two phase liquid and gas
8132019 L 7amp8 ElectricalSubmersiblePump
httpslidepdfcomreaderfulll-78-electricalsubmersiblepump 412
4
ESP is the second most commonly used artificial lift method in oil and gas industry ESP has been used
massively in Russia and in significant number of wells in US It is responsible for the highest amount of
total fluids produced (oil and water) by any artificial lift method and an ideal method for high water cut
wells The problems with ESPs are that they are not suitable for high gas liquid ratio and high bottom
hole temperature wells
Radial Flow Type ESP Pump Mixed Flow Type ESP Pump
When handling free gas the centrifugal pump head performance curve suffers degradation The design of
an ESP system using the water information for oil wells with some free gas fraction at pump intake
conditions is a harder task and is based on the prediction of performance curves by modification of the
water curves The most important parameter is the density of the mixture at the flow conditions of each
stage Applying this procedure the ESP system often shows some degree of under or over sizing under
field operations This can be observed comparing the expected and the real produced flow rates and also
by the amperage consumption fluctuation of the motor due to the presence of the gas phase
8132019 L 7amp8 ElectricalSubmersiblePump
httpslidepdfcomreaderfulll-78-electricalsubmersiblepump 512
5
The centrifugal pump operation should conform to the pump curves supplied by the manufacturer In
order to read and understand the pump curves it is very important to develop a clear understanding of the
terms used in the curves
Capacity Q GPM
Capacity means the flow rate with which liquid is moved or pushed by the pump to the desired point in
the process It is commonly measured in either gallons per minute (gpm) or cubic meters per hour
(m3 hr) The effect on the flow through a pump by changing the outlet pressures is graphed on a pump
curve
Head H ft
The pressure at any point in a liquid can be thought of as being caused by a vertical column of the liquid
due to its weight The height of this column is called the static head and is expressed in terms of feet of
liquid The same head term is used to measure the kinetic energy created by the pump In other words
head is a measurement of the height of a liquid column that the pump could create from the kinetic energy
imparted to the liquid Head is a term that has units of a length or feet and pressure has units of force per
unit area or pound per square inch The main reason for using head instead of pressure to measure a
centrifugal pumps energy is that the pressure from a pump will change if the specific gravity (weight) of
the liquid changes but the head will not change
8132019 L 7amp8 ElectricalSubmersiblePump
httpslidepdfcomreaderfulll-78-electricalsubmersiblepump 612
6
983101 0983092983091983255
Brake Horse Power (BHP) and Hydraulic Horse power (HHP)
The work performed by a pump is a function of the total head and the weight of the liquid pumped in a
given time period Pump input or brake horsepower (BHP) is the actual horsepower delivered to the
pump shaft Pump output or hydraulic or hydraulic horsepower (HHP) is the liquid horsepower delivered
by the pump These two terms are defined by the following formulas
983101 983255 983255 9830919830979830940 983255
983101
983255983255
HP
Where Q is the capacity in gallons per minute (GPM) H is the head in feet γ is the specific gravity of the
liquid and E is the pump efficiency
The constant 3960 is obtained by dividing the number of foot-pounds for one horsepower (33000) by the
weight of one gallon of water (833 pounds) BHP can also be read from the pump curves at any flow rate
Pump curves are based on a specific gravity of 10 The brake horsepower or input to a pump is greater
8132019 L 7amp8 ElectricalSubmersiblePump
httpslidepdfcomreaderfulll-78-electricalsubmersiblepump 712
7
than the hydraulic horsepower or output due to the mechanical and hydraulic losses incurred in the pump
Therefore the pump efficiency is the ratio of these two values
Best Efficiency Point (BEP)
Best Efficiency Point (BEP) is defined as the capacity at which the efficiency of the pump is highest Allpoints to the right or left of BEP have a lower efficiency The BEP is the area on the curve where the
change of velocity energy into pressure energy at a given gallon per minute is optimum in essence the
point where the pump is most efficient The impeller will be subject to non-symmetrical forces when
operating to the right or left of the BEP These forces manifest themselves in many mechanically
unstable conditions like vibration excessive hydraulic thrust temperature rise and erosion and separation
cavitation Thus the operation of a centrifugal pump should not be outside the furthest left or right
efficiency curves published by the manufacturer The centrifugal pump should be operated in a range of
plusmn20 of the maximum efficiency Emax
The -02Emax
is called the lower operating range and the +02Emax
is called the upper operating range If the ESP is operated out of the operating range it will suffer under
either upthrust or downthrust which causes the damage of the impellers
8132019 L 7amp8 ElectricalSubmersiblePump
httpslidepdfcomreaderfulll-78-electricalsubmersiblepump 812
8
Specific Speed
Specific Speed as a measure of the geometric similarity of pumps Specific speed (Ns) is a non-
dimensional design index that identifies the geometric similarity of pumps It is used to classify pump
impellers as to their type and proportions Pumps of the same Ns but of different size are considered to be
geometrically similar one pump being a size- factor of the other Specific speed Calculation The
following formula is used to determine specific speed
983101 983255
Where Q is the capacity at the best efficiency point in GPM H is the head per stage at BEP in feet and N
is the pump speed in RPM
As per the above formula it is defined as the speed in revolutions per minute at which a geometrically
similar impeller would operate if it were of such a size as to deliver one gallon per minute flow against
one-foot head The understanding of this definition is of design engineering significance only however
and specific speed should be thought of only as an index used to predict certain pump characteristics
Specific speed as a measure of the shape or class of the impellers The specific speed determines the
general shape or class of the impellers As the specific speed increases the ratio of the impeller outlet
diameter D2 to the inlet or eye diameter D1 decreases This ratio becomes 10 for a true axial flow
impeller Radial flow impellers develop head principally through centrifugal force Radial impellers are
generally low flow high head designs Pumps of higher specific speeds develop head partly by centrifugal
force and partly by axial force A higher specific speed indicates a pump design with head generation
more by axial forces and less by centrifugal forces An axial flow or propeller pump with a specific speed
of 10000 or greater generates its head exclusively through axial forces Axial flow impellers are high
flow low head designs
Ns 500 to 5000 D1D2 gt 15 - radial flow pump
Ns 5000 to 10000 D1D2 lt 15 - mixed flow pump
Ns 10000 to 15000 D1D2 = 1 - axial flow pump
8132019 L 7amp8 ElectricalSubmersiblePump
httpslidepdfcomreaderfulll-78-electricalsubmersiblepump 912
Classification of
Chat Ef
The Affinity Laws
The Affinity Laws are mathematic
when a change is made to pump sp
9
entrifugal Pumps according to Specific Speed
ficiency of Pumps Versus Specific Speed
al expressions that define changes in pump capaci
ed impeller diameter or both According to Affinit
s
y head and BHP
y Laws
8132019 L 7amp8 ElectricalSubmersiblePump
httpslidepdfcomreaderfulll-78-electricalsubmersiblepump 1012
10
Capacity Q changes in direct proportion to speed N ratio
983101
Head H changes in direct proportion to the square of speed N ratio
983101
BHP changes in direct proportion to the cube of speed ratio
983101
The Affinity Laws are valid only under conditions of constant efficiency and very low viscosity of fluids
EXPERIMENTS
Note that we have two pumps connected in series With two pumps in series we can simulate an ESP
with 2 stages We can also simulate the two pumps in series in the different way the first pump is to
simulate the bottom hole pressure or the intake pressure of the ESP meanwhile the second pump is
simulated as an ESP with 1 stage We can change the speed of the ESP by controlling the VFD Similarly
the intake pressure of the ESP can be varied by adjusting the return valve
This procedure is applied for those who are very familiar with the flow loop If students have any
questions or concerns please check with the TA
1 Keep the ldquomanualautordquo switch in the speed control panel in the manual mode
2 Adjust all the valves in the right postions we need to have the flow through the two pumps frac34rsquorsquo
pipe and through the frac12rsquorsquo pipe (No flow through the orifice)
3 Mass flow meter will be used for all ESP tests
Experiment 7 Develop the pump performancersquos curves of an ESP
Procedures
1 Keep the discharge pressure of the first pump (intake pressure of the second pump) at 30 psig by
adjusting the return valve on the return line of the first pump
2 On the speed control panel set a speed of 3500 RPM for the second pump
3 Start recording the data
8132019 L 7amp8 ElectricalSubmersiblePump
httpslidepdfcomreaderfulll-78-electricalsubmersiblepump 1112
11
4 Use the end valve as circle in the flow loop schematic to change the flow rate of the the fluid In
the beginning the end valve must be open The end valve will be changed from fully open to
fully close with 10 different openings Talk with the TA if you need help
5 Repeat steps 2 to 4 with different pump speed for the second pump 3200 3000 2700 2400
2000 1500 RPM
6 Stop recording the data
7 Stop the two pumps
8 Copy the data and then turn off the production lab program
Calculation
1 Convert the flow rate to barrel per day (BPD) and m3 s
2 Convert the differential pressure between intake and discharge pressure to head in the unit of ft
and meter
3 Calculate the hydraulic horse power developed by the second pump
4 Calculate the specific speed of the pump
5 Develop the performance curve of the pump by plotting these ralationships in one graph head (ft
and meter) vs flow rate (bblday and m3 s) specific speed vs flow rate (bblday) hydraulic horse
power vs flow rate (bblday)
6 Plot the performance curve for the two-stage pump (two pump in series) Assuming the intake
pressure is zero
End valve
8132019 L 7amp8 ElectricalSubmersiblePump
httpslidepdfcomreaderfulll-78-electricalsubmersiblepump 1212
12
Questions
1 What is the priciple of bulding head in a centrifugal pump
2 What are the differences between a conventional centrifugal pump and an ESP
3 What are the advantages and disadvantages of an ESP
4 What are the problems if the ESP is operated out of the operating range
5 How does the pump speed change the pump performace curves Why
6 Based on the calculated specific speed how would you classify this centrifigal pump
Experiment 8 The effects of intake pressure on the pump performace curves - Affinity Law
Procedure
1 Apply the same procedure in the experiment 7 but with only two pump speed of 3200 RPM
and 3000 RPM and different intake pressure of 10 20 40 and 50 psig
Calculations
Note that for all the calculations below flow rate is expressed in bblday and head in feet
1 Use the performance curve at 3500 RPM and intake pressure of 30 psig obtained from the
experiment 7 as a reference Apply the Affinity Law to predict the performance curves at
different pump speed of 3200 3000 2700 2400 RPM
2 Plot in the same plot the performance curves predicted by the Affinity Law and the performace
curves obtained from experimental data in the experiment 7
3 Plot the relationship between head and flow rate at 3200 RPM at different intake pressure 10
20 30 40 and 50 psig
4 Generate a similar plot as step 3 but with the pump speed of 3000 RPM
Questions
1 Describe the Affinity Law What are the limitations of the Affinity Law
2 How does the Affinity Law match with the experimental data What may cause the descrepancy
between the prediction of Affinity Law and the experimental data
3
Based on the experimental data how does the intake pressure affect on the pump performanceWhat would you predict the effect of the intake pressure on the pump performance if the fluid is
two phase liquid and gas

8132019 L 7amp8 ElectricalSubmersiblePump
httpslidepdfcomreaderfulll-78-electricalsubmersiblepump 512
5
The centrifugal pump operation should conform to the pump curves supplied by the manufacturer In
order to read and understand the pump curves it is very important to develop a clear understanding of the
terms used in the curves
Capacity Q GPM
Capacity means the flow rate with which liquid is moved or pushed by the pump to the desired point in
the process It is commonly measured in either gallons per minute (gpm) or cubic meters per hour
(m3 hr) The effect on the flow through a pump by changing the outlet pressures is graphed on a pump
curve
Head H ft
The pressure at any point in a liquid can be thought of as being caused by a vertical column of the liquid
due to its weight The height of this column is called the static head and is expressed in terms of feet of
liquid The same head term is used to measure the kinetic energy created by the pump In other words
head is a measurement of the height of a liquid column that the pump could create from the kinetic energy
imparted to the liquid Head is a term that has units of a length or feet and pressure has units of force per
unit area or pound per square inch The main reason for using head instead of pressure to measure a
centrifugal pumps energy is that the pressure from a pump will change if the specific gravity (weight) of
the liquid changes but the head will not change
8132019 L 7amp8 ElectricalSubmersiblePump
httpslidepdfcomreaderfulll-78-electricalsubmersiblepump 612
6
983101 0983092983091983255
Brake Horse Power (BHP) and Hydraulic Horse power (HHP)
The work performed by a pump is a function of the total head and the weight of the liquid pumped in a
given time period Pump input or brake horsepower (BHP) is the actual horsepower delivered to the
pump shaft Pump output or hydraulic or hydraulic horsepower (HHP) is the liquid horsepower delivered
by the pump These two terms are defined by the following formulas
983101 983255 983255 9830919830979830940 983255
983101
983255983255
HP
Where Q is the capacity in gallons per minute (GPM) H is the head in feet γ is the specific gravity of the
liquid and E is the pump efficiency
The constant 3960 is obtained by dividing the number of foot-pounds for one horsepower (33000) by the
weight of one gallon of water (833 pounds) BHP can also be read from the pump curves at any flow rate
Pump curves are based on a specific gravity of 10 The brake horsepower or input to a pump is greater
8132019 L 7amp8 ElectricalSubmersiblePump
httpslidepdfcomreaderfulll-78-electricalsubmersiblepump 712
7
than the hydraulic horsepower or output due to the mechanical and hydraulic losses incurred in the pump
Therefore the pump efficiency is the ratio of these two values
Best Efficiency Point (BEP)
Best Efficiency Point (BEP) is defined as the capacity at which the efficiency of the pump is highest Allpoints to the right or left of BEP have a lower efficiency The BEP is the area on the curve where the
change of velocity energy into pressure energy at a given gallon per minute is optimum in essence the
point where the pump is most efficient The impeller will be subject to non-symmetrical forces when
operating to the right or left of the BEP These forces manifest themselves in many mechanically
unstable conditions like vibration excessive hydraulic thrust temperature rise and erosion and separation
cavitation Thus the operation of a centrifugal pump should not be outside the furthest left or right
efficiency curves published by the manufacturer The centrifugal pump should be operated in a range of
plusmn20 of the maximum efficiency Emax
The -02Emax
is called the lower operating range and the +02Emax
is called the upper operating range If the ESP is operated out of the operating range it will suffer under
either upthrust or downthrust which causes the damage of the impellers
8132019 L 7amp8 ElectricalSubmersiblePump
httpslidepdfcomreaderfulll-78-electricalsubmersiblepump 812
8
Specific Speed
Specific Speed as a measure of the geometric similarity of pumps Specific speed (Ns) is a non-
dimensional design index that identifies the geometric similarity of pumps It is used to classify pump
impellers as to their type and proportions Pumps of the same Ns but of different size are considered to be
geometrically similar one pump being a size- factor of the other Specific speed Calculation The
following formula is used to determine specific speed
983101 983255
Where Q is the capacity at the best efficiency point in GPM H is the head per stage at BEP in feet and N
is the pump speed in RPM
As per the above formula it is defined as the speed in revolutions per minute at which a geometrically
similar impeller would operate if it were of such a size as to deliver one gallon per minute flow against
one-foot head The understanding of this definition is of design engineering significance only however
and specific speed should be thought of only as an index used to predict certain pump characteristics
Specific speed as a measure of the shape or class of the impellers The specific speed determines the
general shape or class of the impellers As the specific speed increases the ratio of the impeller outlet
diameter D2 to the inlet or eye diameter D1 decreases This ratio becomes 10 for a true axial flow
impeller Radial flow impellers develop head principally through centrifugal force Radial impellers are
generally low flow high head designs Pumps of higher specific speeds develop head partly by centrifugal
force and partly by axial force A higher specific speed indicates a pump design with head generation
more by axial forces and less by centrifugal forces An axial flow or propeller pump with a specific speed
of 10000 or greater generates its head exclusively through axial forces Axial flow impellers are high
flow low head designs
Ns 500 to 5000 D1D2 gt 15 - radial flow pump
Ns 5000 to 10000 D1D2 lt 15 - mixed flow pump
Ns 10000 to 15000 D1D2 = 1 - axial flow pump
8132019 L 7amp8 ElectricalSubmersiblePump
httpslidepdfcomreaderfulll-78-electricalsubmersiblepump 912
Classification of
Chat Ef
The Affinity Laws
The Affinity Laws are mathematic
when a change is made to pump sp
9
entrifugal Pumps according to Specific Speed
ficiency of Pumps Versus Specific Speed
al expressions that define changes in pump capaci
ed impeller diameter or both According to Affinit
s
y head and BHP
y Laws
8132019 L 7amp8 ElectricalSubmersiblePump
httpslidepdfcomreaderfulll-78-electricalsubmersiblepump 1012
10
Capacity Q changes in direct proportion to speed N ratio
983101
Head H changes in direct proportion to the square of speed N ratio
983101
BHP changes in direct proportion to the cube of speed ratio
983101
The Affinity Laws are valid only under conditions of constant efficiency and very low viscosity of fluids
EXPERIMENTS
Note that we have two pumps connected in series With two pumps in series we can simulate an ESP
with 2 stages We can also simulate the two pumps in series in the different way the first pump is to
simulate the bottom hole pressure or the intake pressure of the ESP meanwhile the second pump is
simulated as an ESP with 1 stage We can change the speed of the ESP by controlling the VFD Similarly
the intake pressure of the ESP can be varied by adjusting the return valve
This procedure is applied for those who are very familiar with the flow loop If students have any
questions or concerns please check with the TA
1 Keep the ldquomanualautordquo switch in the speed control panel in the manual mode
2 Adjust all the valves in the right postions we need to have the flow through the two pumps frac34rsquorsquo
pipe and through the frac12rsquorsquo pipe (No flow through the orifice)
3 Mass flow meter will be used for all ESP tests
Experiment 7 Develop the pump performancersquos curves of an ESP
Procedures
1 Keep the discharge pressure of the first pump (intake pressure of the second pump) at 30 psig by
adjusting the return valve on the return line of the first pump
2 On the speed control panel set a speed of 3500 RPM for the second pump
3 Start recording the data
8132019 L 7amp8 ElectricalSubmersiblePump
httpslidepdfcomreaderfulll-78-electricalsubmersiblepump 1112
11
4 Use the end valve as circle in the flow loop schematic to change the flow rate of the the fluid In
the beginning the end valve must be open The end valve will be changed from fully open to
fully close with 10 different openings Talk with the TA if you need help
5 Repeat steps 2 to 4 with different pump speed for the second pump 3200 3000 2700 2400
2000 1500 RPM
6 Stop recording the data
7 Stop the two pumps
8 Copy the data and then turn off the production lab program
Calculation
1 Convert the flow rate to barrel per day (BPD) and m3 s
2 Convert the differential pressure between intake and discharge pressure to head in the unit of ft
and meter
3 Calculate the hydraulic horse power developed by the second pump
4 Calculate the specific speed of the pump
5 Develop the performance curve of the pump by plotting these ralationships in one graph head (ft
and meter) vs flow rate (bblday and m3 s) specific speed vs flow rate (bblday) hydraulic horse
power vs flow rate (bblday)
6 Plot the performance curve for the two-stage pump (two pump in series) Assuming the intake
pressure is zero
End valve
8132019 L 7amp8 ElectricalSubmersiblePump
httpslidepdfcomreaderfulll-78-electricalsubmersiblepump 1212
12
Questions
1 What is the priciple of bulding head in a centrifugal pump
2 What are the differences between a conventional centrifugal pump and an ESP
3 What are the advantages and disadvantages of an ESP
4 What are the problems if the ESP is operated out of the operating range
5 How does the pump speed change the pump performace curves Why
6 Based on the calculated specific speed how would you classify this centrifigal pump
Experiment 8 The effects of intake pressure on the pump performace curves - Affinity Law
Procedure
1 Apply the same procedure in the experiment 7 but with only two pump speed of 3200 RPM
and 3000 RPM and different intake pressure of 10 20 40 and 50 psig
Calculations
Note that for all the calculations below flow rate is expressed in bblday and head in feet
1 Use the performance curve at 3500 RPM and intake pressure of 30 psig obtained from the
experiment 7 as a reference Apply the Affinity Law to predict the performance curves at
different pump speed of 3200 3000 2700 2400 RPM
2 Plot in the same plot the performance curves predicted by the Affinity Law and the performace
curves obtained from experimental data in the experiment 7
3 Plot the relationship between head and flow rate at 3200 RPM at different intake pressure 10
20 30 40 and 50 psig
4 Generate a similar plot as step 3 but with the pump speed of 3000 RPM
Questions
1 Describe the Affinity Law What are the limitations of the Affinity Law
2 How does the Affinity Law match with the experimental data What may cause the descrepancy
between the prediction of Affinity Law and the experimental data
3
Based on the experimental data how does the intake pressure affect on the pump performanceWhat would you predict the effect of the intake pressure on the pump performance if the fluid is
two phase liquid and gas
8132019 L 7amp8 ElectricalSubmersiblePump
httpslidepdfcomreaderfulll-78-electricalsubmersiblepump 612
6
983101 0983092983091983255
Brake Horse Power (BHP) and Hydraulic Horse power (HHP)
The work performed by a pump is a function of the total head and the weight of the liquid pumped in a
given time period Pump input or brake horsepower (BHP) is the actual horsepower delivered to the
pump shaft Pump output or hydraulic or hydraulic horsepower (HHP) is the liquid horsepower delivered
by the pump These two terms are defined by the following formulas
983101 983255 983255 9830919830979830940 983255
983101
983255983255
HP
Where Q is the capacity in gallons per minute (GPM) H is the head in feet γ is the specific gravity of the
liquid and E is the pump efficiency
The constant 3960 is obtained by dividing the number of foot-pounds for one horsepower (33000) by the
weight of one gallon of water (833 pounds) BHP can also be read from the pump curves at any flow rate
Pump curves are based on a specific gravity of 10 The brake horsepower or input to a pump is greater
8132019 L 7amp8 ElectricalSubmersiblePump
httpslidepdfcomreaderfulll-78-electricalsubmersiblepump 712
7
than the hydraulic horsepower or output due to the mechanical and hydraulic losses incurred in the pump
Therefore the pump efficiency is the ratio of these two values
Best Efficiency Point (BEP)
Best Efficiency Point (BEP) is defined as the capacity at which the efficiency of the pump is highest Allpoints to the right or left of BEP have a lower efficiency The BEP is the area on the curve where the
change of velocity energy into pressure energy at a given gallon per minute is optimum in essence the
point where the pump is most efficient The impeller will be subject to non-symmetrical forces when
operating to the right or left of the BEP These forces manifest themselves in many mechanically
unstable conditions like vibration excessive hydraulic thrust temperature rise and erosion and separation
cavitation Thus the operation of a centrifugal pump should not be outside the furthest left or right
efficiency curves published by the manufacturer The centrifugal pump should be operated in a range of
plusmn20 of the maximum efficiency Emax
The -02Emax
is called the lower operating range and the +02Emax
is called the upper operating range If the ESP is operated out of the operating range it will suffer under
either upthrust or downthrust which causes the damage of the impellers
8132019 L 7amp8 ElectricalSubmersiblePump
httpslidepdfcomreaderfulll-78-electricalsubmersiblepump 812
8
Specific Speed
Specific Speed as a measure of the geometric similarity of pumps Specific speed (Ns) is a non-
dimensional design index that identifies the geometric similarity of pumps It is used to classify pump
impellers as to their type and proportions Pumps of the same Ns but of different size are considered to be
geometrically similar one pump being a size- factor of the other Specific speed Calculation The
following formula is used to determine specific speed
983101 983255
Where Q is the capacity at the best efficiency point in GPM H is the head per stage at BEP in feet and N
is the pump speed in RPM
As per the above formula it is defined as the speed in revolutions per minute at which a geometrically
similar impeller would operate if it were of such a size as to deliver one gallon per minute flow against
one-foot head The understanding of this definition is of design engineering significance only however
and specific speed should be thought of only as an index used to predict certain pump characteristics
Specific speed as a measure of the shape or class of the impellers The specific speed determines the
general shape or class of the impellers As the specific speed increases the ratio of the impeller outlet
diameter D2 to the inlet or eye diameter D1 decreases This ratio becomes 10 for a true axial flow
impeller Radial flow impellers develop head principally through centrifugal force Radial impellers are
generally low flow high head designs Pumps of higher specific speeds develop head partly by centrifugal
force and partly by axial force A higher specific speed indicates a pump design with head generation
more by axial forces and less by centrifugal forces An axial flow or propeller pump with a specific speed
of 10000 or greater generates its head exclusively through axial forces Axial flow impellers are high
flow low head designs
Ns 500 to 5000 D1D2 gt 15 - radial flow pump
Ns 5000 to 10000 D1D2 lt 15 - mixed flow pump
Ns 10000 to 15000 D1D2 = 1 - axial flow pump
8132019 L 7amp8 ElectricalSubmersiblePump
httpslidepdfcomreaderfulll-78-electricalsubmersiblepump 912
Classification of
Chat Ef
The Affinity Laws
The Affinity Laws are mathematic
when a change is made to pump sp
9
entrifugal Pumps according to Specific Speed
ficiency of Pumps Versus Specific Speed
al expressions that define changes in pump capaci
ed impeller diameter or both According to Affinit
s
y head and BHP
y Laws
8132019 L 7amp8 ElectricalSubmersiblePump
httpslidepdfcomreaderfulll-78-electricalsubmersiblepump 1012
10
Capacity Q changes in direct proportion to speed N ratio
983101
Head H changes in direct proportion to the square of speed N ratio
983101
BHP changes in direct proportion to the cube of speed ratio
983101
The Affinity Laws are valid only under conditions of constant efficiency and very low viscosity of fluids
EXPERIMENTS
Note that we have two pumps connected in series With two pumps in series we can simulate an ESP
with 2 stages We can also simulate the two pumps in series in the different way the first pump is to
simulate the bottom hole pressure or the intake pressure of the ESP meanwhile the second pump is
simulated as an ESP with 1 stage We can change the speed of the ESP by controlling the VFD Similarly
the intake pressure of the ESP can be varied by adjusting the return valve
This procedure is applied for those who are very familiar with the flow loop If students have any
questions or concerns please check with the TA
1 Keep the ldquomanualautordquo switch in the speed control panel in the manual mode
2 Adjust all the valves in the right postions we need to have the flow through the two pumps frac34rsquorsquo
pipe and through the frac12rsquorsquo pipe (No flow through the orifice)
3 Mass flow meter will be used for all ESP tests
Experiment 7 Develop the pump performancersquos curves of an ESP
Procedures
1 Keep the discharge pressure of the first pump (intake pressure of the second pump) at 30 psig by
adjusting the return valve on the return line of the first pump
2 On the speed control panel set a speed of 3500 RPM for the second pump
3 Start recording the data
8132019 L 7amp8 ElectricalSubmersiblePump
httpslidepdfcomreaderfulll-78-electricalsubmersiblepump 1112
11
4 Use the end valve as circle in the flow loop schematic to change the flow rate of the the fluid In
the beginning the end valve must be open The end valve will be changed from fully open to
fully close with 10 different openings Talk with the TA if you need help
5 Repeat steps 2 to 4 with different pump speed for the second pump 3200 3000 2700 2400
2000 1500 RPM
6 Stop recording the data
7 Stop the two pumps
8 Copy the data and then turn off the production lab program
Calculation
1 Convert the flow rate to barrel per day (BPD) and m3 s
2 Convert the differential pressure between intake and discharge pressure to head in the unit of ft
and meter
3 Calculate the hydraulic horse power developed by the second pump
4 Calculate the specific speed of the pump
5 Develop the performance curve of the pump by plotting these ralationships in one graph head (ft
and meter) vs flow rate (bblday and m3 s) specific speed vs flow rate (bblday) hydraulic horse
power vs flow rate (bblday)
6 Plot the performance curve for the two-stage pump (two pump in series) Assuming the intake
pressure is zero
End valve
8132019 L 7amp8 ElectricalSubmersiblePump
httpslidepdfcomreaderfulll-78-electricalsubmersiblepump 1212
12
Questions
1 What is the priciple of bulding head in a centrifugal pump
2 What are the differences between a conventional centrifugal pump and an ESP
3 What are the advantages and disadvantages of an ESP
4 What are the problems if the ESP is operated out of the operating range
5 How does the pump speed change the pump performace curves Why
6 Based on the calculated specific speed how would you classify this centrifigal pump
Experiment 8 The effects of intake pressure on the pump performace curves - Affinity Law
Procedure
1 Apply the same procedure in the experiment 7 but with only two pump speed of 3200 RPM
and 3000 RPM and different intake pressure of 10 20 40 and 50 psig
Calculations
Note that for all the calculations below flow rate is expressed in bblday and head in feet
1 Use the performance curve at 3500 RPM and intake pressure of 30 psig obtained from the
experiment 7 as a reference Apply the Affinity Law to predict the performance curves at
different pump speed of 3200 3000 2700 2400 RPM
2 Plot in the same plot the performance curves predicted by the Affinity Law and the performace
curves obtained from experimental data in the experiment 7
3 Plot the relationship between head and flow rate at 3200 RPM at different intake pressure 10
20 30 40 and 50 psig
4 Generate a similar plot as step 3 but with the pump speed of 3000 RPM
Questions
1 Describe the Affinity Law What are the limitations of the Affinity Law
2 How does the Affinity Law match with the experimental data What may cause the descrepancy
between the prediction of Affinity Law and the experimental data
3
Based on the experimental data how does the intake pressure affect on the pump performanceWhat would you predict the effect of the intake pressure on the pump performance if the fluid is
two phase liquid and gas

8132019 L 7amp8 ElectricalSubmersiblePump
httpslidepdfcomreaderfulll-78-electricalsubmersiblepump 712
7
than the hydraulic horsepower or output due to the mechanical and hydraulic losses incurred in the pump
Therefore the pump efficiency is the ratio of these two values
Best Efficiency Point (BEP)
Best Efficiency Point (BEP) is defined as the capacity at which the efficiency of the pump is highest Allpoints to the right or left of BEP have a lower efficiency The BEP is the area on the curve where the
change of velocity energy into pressure energy at a given gallon per minute is optimum in essence the
point where the pump is most efficient The impeller will be subject to non-symmetrical forces when
operating to the right or left of the BEP These forces manifest themselves in many mechanically
unstable conditions like vibration excessive hydraulic thrust temperature rise and erosion and separation
cavitation Thus the operation of a centrifugal pump should not be outside the furthest left or right
efficiency curves published by the manufacturer The centrifugal pump should be operated in a range of
plusmn20 of the maximum efficiency Emax
The -02Emax
is called the lower operating range and the +02Emax
is called the upper operating range If the ESP is operated out of the operating range it will suffer under
either upthrust or downthrust which causes the damage of the impellers
8132019 L 7amp8 ElectricalSubmersiblePump
httpslidepdfcomreaderfulll-78-electricalsubmersiblepump 812
8
Specific Speed
Specific Speed as a measure of the geometric similarity of pumps Specific speed (Ns) is a non-
dimensional design index that identifies the geometric similarity of pumps It is used to classify pump
impellers as to their type and proportions Pumps of the same Ns but of different size are considered to be
geometrically similar one pump being a size- factor of the other Specific speed Calculation The
following formula is used to determine specific speed
983101 983255
Where Q is the capacity at the best efficiency point in GPM H is the head per stage at BEP in feet and N
is the pump speed in RPM
As per the above formula it is defined as the speed in revolutions per minute at which a geometrically
similar impeller would operate if it were of such a size as to deliver one gallon per minute flow against
one-foot head The understanding of this definition is of design engineering significance only however
and specific speed should be thought of only as an index used to predict certain pump characteristics
Specific speed as a measure of the shape or class of the impellers The specific speed determines the
general shape or class of the impellers As the specific speed increases the ratio of the impeller outlet
diameter D2 to the inlet or eye diameter D1 decreases This ratio becomes 10 for a true axial flow
impeller Radial flow impellers develop head principally through centrifugal force Radial impellers are
generally low flow high head designs Pumps of higher specific speeds develop head partly by centrifugal
force and partly by axial force A higher specific speed indicates a pump design with head generation
more by axial forces and less by centrifugal forces An axial flow or propeller pump with a specific speed
of 10000 or greater generates its head exclusively through axial forces Axial flow impellers are high
flow low head designs
Ns 500 to 5000 D1D2 gt 15 - radial flow pump
Ns 5000 to 10000 D1D2 lt 15 - mixed flow pump
Ns 10000 to 15000 D1D2 = 1 - axial flow pump
8132019 L 7amp8 ElectricalSubmersiblePump
httpslidepdfcomreaderfulll-78-electricalsubmersiblepump 912
Classification of
Chat Ef
The Affinity Laws
The Affinity Laws are mathematic
when a change is made to pump sp
9
entrifugal Pumps according to Specific Speed
ficiency of Pumps Versus Specific Speed
al expressions that define changes in pump capaci
ed impeller diameter or both According to Affinit
s
y head and BHP
y Laws
8132019 L 7amp8 ElectricalSubmersiblePump
httpslidepdfcomreaderfulll-78-electricalsubmersiblepump 1012
10
Capacity Q changes in direct proportion to speed N ratio
983101
Head H changes in direct proportion to the square of speed N ratio
983101
BHP changes in direct proportion to the cube of speed ratio
983101
The Affinity Laws are valid only under conditions of constant efficiency and very low viscosity of fluids
EXPERIMENTS
Note that we have two pumps connected in series With two pumps in series we can simulate an ESP
with 2 stages We can also simulate the two pumps in series in the different way the first pump is to
simulate the bottom hole pressure or the intake pressure of the ESP meanwhile the second pump is
simulated as an ESP with 1 stage We can change the speed of the ESP by controlling the VFD Similarly
the intake pressure of the ESP can be varied by adjusting the return valve
This procedure is applied for those who are very familiar with the flow loop If students have any
questions or concerns please check with the TA
1 Keep the ldquomanualautordquo switch in the speed control panel in the manual mode
2 Adjust all the valves in the right postions we need to have the flow through the two pumps frac34rsquorsquo
pipe and through the frac12rsquorsquo pipe (No flow through the orifice)
3 Mass flow meter will be used for all ESP tests
Experiment 7 Develop the pump performancersquos curves of an ESP
Procedures
1 Keep the discharge pressure of the first pump (intake pressure of the second pump) at 30 psig by
adjusting the return valve on the return line of the first pump
2 On the speed control panel set a speed of 3500 RPM for the second pump
3 Start recording the data
8132019 L 7amp8 ElectricalSubmersiblePump
httpslidepdfcomreaderfulll-78-electricalsubmersiblepump 1112
11
4 Use the end valve as circle in the flow loop schematic to change the flow rate of the the fluid In
the beginning the end valve must be open The end valve will be changed from fully open to
fully close with 10 different openings Talk with the TA if you need help
5 Repeat steps 2 to 4 with different pump speed for the second pump 3200 3000 2700 2400
2000 1500 RPM
6 Stop recording the data
7 Stop the two pumps
8 Copy the data and then turn off the production lab program
Calculation
1 Convert the flow rate to barrel per day (BPD) and m3 s
2 Convert the differential pressure between intake and discharge pressure to head in the unit of ft
and meter
3 Calculate the hydraulic horse power developed by the second pump
4 Calculate the specific speed of the pump
5 Develop the performance curve of the pump by plotting these ralationships in one graph head (ft
and meter) vs flow rate (bblday and m3 s) specific speed vs flow rate (bblday) hydraulic horse
power vs flow rate (bblday)
6 Plot the performance curve for the two-stage pump (two pump in series) Assuming the intake
pressure is zero
End valve
8132019 L 7amp8 ElectricalSubmersiblePump
httpslidepdfcomreaderfulll-78-electricalsubmersiblepump 1212
12
Questions
1 What is the priciple of bulding head in a centrifugal pump
2 What are the differences between a conventional centrifugal pump and an ESP
3 What are the advantages and disadvantages of an ESP
4 What are the problems if the ESP is operated out of the operating range
5 How does the pump speed change the pump performace curves Why
6 Based on the calculated specific speed how would you classify this centrifigal pump
Experiment 8 The effects of intake pressure on the pump performace curves - Affinity Law
Procedure
1 Apply the same procedure in the experiment 7 but with only two pump speed of 3200 RPM
and 3000 RPM and different intake pressure of 10 20 40 and 50 psig
Calculations
Note that for all the calculations below flow rate is expressed in bblday and head in feet
1 Use the performance curve at 3500 RPM and intake pressure of 30 psig obtained from the
experiment 7 as a reference Apply the Affinity Law to predict the performance curves at
different pump speed of 3200 3000 2700 2400 RPM
2 Plot in the same plot the performance curves predicted by the Affinity Law and the performace
curves obtained from experimental data in the experiment 7
3 Plot the relationship between head and flow rate at 3200 RPM at different intake pressure 10
20 30 40 and 50 psig
4 Generate a similar plot as step 3 but with the pump speed of 3000 RPM
Questions
1 Describe the Affinity Law What are the limitations of the Affinity Law
2 How does the Affinity Law match with the experimental data What may cause the descrepancy
between the prediction of Affinity Law and the experimental data
3
Based on the experimental data how does the intake pressure affect on the pump performanceWhat would you predict the effect of the intake pressure on the pump performance if the fluid is
two phase liquid and gas
8132019 L 7amp8 ElectricalSubmersiblePump
httpslidepdfcomreaderfulll-78-electricalsubmersiblepump 812
8
Specific Speed
Specific Speed as a measure of the geometric similarity of pumps Specific speed (Ns) is a non-
dimensional design index that identifies the geometric similarity of pumps It is used to classify pump
impellers as to their type and proportions Pumps of the same Ns but of different size are considered to be
geometrically similar one pump being a size- factor of the other Specific speed Calculation The
following formula is used to determine specific speed
983101 983255
Where Q is the capacity at the best efficiency point in GPM H is the head per stage at BEP in feet and N
is the pump speed in RPM
As per the above formula it is defined as the speed in revolutions per minute at which a geometrically
similar impeller would operate if it were of such a size as to deliver one gallon per minute flow against
one-foot head The understanding of this definition is of design engineering significance only however
and specific speed should be thought of only as an index used to predict certain pump characteristics
Specific speed as a measure of the shape or class of the impellers The specific speed determines the
general shape or class of the impellers As the specific speed increases the ratio of the impeller outlet
diameter D2 to the inlet or eye diameter D1 decreases This ratio becomes 10 for a true axial flow
impeller Radial flow impellers develop head principally through centrifugal force Radial impellers are
generally low flow high head designs Pumps of higher specific speeds develop head partly by centrifugal
force and partly by axial force A higher specific speed indicates a pump design with head generation
more by axial forces and less by centrifugal forces An axial flow or propeller pump with a specific speed
of 10000 or greater generates its head exclusively through axial forces Axial flow impellers are high
flow low head designs
Ns 500 to 5000 D1D2 gt 15 - radial flow pump
Ns 5000 to 10000 D1D2 lt 15 - mixed flow pump
Ns 10000 to 15000 D1D2 = 1 - axial flow pump
8132019 L 7amp8 ElectricalSubmersiblePump
httpslidepdfcomreaderfulll-78-electricalsubmersiblepump 912
Classification of
Chat Ef
The Affinity Laws
The Affinity Laws are mathematic
when a change is made to pump sp
9
entrifugal Pumps according to Specific Speed
ficiency of Pumps Versus Specific Speed
al expressions that define changes in pump capaci
ed impeller diameter or both According to Affinit
s
y head and BHP
y Laws
8132019 L 7amp8 ElectricalSubmersiblePump
httpslidepdfcomreaderfulll-78-electricalsubmersiblepump 1012
10
Capacity Q changes in direct proportion to speed N ratio
983101
Head H changes in direct proportion to the square of speed N ratio
983101
BHP changes in direct proportion to the cube of speed ratio
983101
The Affinity Laws are valid only under conditions of constant efficiency and very low viscosity of fluids
EXPERIMENTS
Note that we have two pumps connected in series With two pumps in series we can simulate an ESP
with 2 stages We can also simulate the two pumps in series in the different way the first pump is to
simulate the bottom hole pressure or the intake pressure of the ESP meanwhile the second pump is
simulated as an ESP with 1 stage We can change the speed of the ESP by controlling the VFD Similarly
the intake pressure of the ESP can be varied by adjusting the return valve
This procedure is applied for those who are very familiar with the flow loop If students have any
questions or concerns please check with the TA
1 Keep the ldquomanualautordquo switch in the speed control panel in the manual mode
2 Adjust all the valves in the right postions we need to have the flow through the two pumps frac34rsquorsquo
pipe and through the frac12rsquorsquo pipe (No flow through the orifice)
3 Mass flow meter will be used for all ESP tests
Experiment 7 Develop the pump performancersquos curves of an ESP
Procedures
1 Keep the discharge pressure of the first pump (intake pressure of the second pump) at 30 psig by
adjusting the return valve on the return line of the first pump
2 On the speed control panel set a speed of 3500 RPM for the second pump
3 Start recording the data
8132019 L 7amp8 ElectricalSubmersiblePump
httpslidepdfcomreaderfulll-78-electricalsubmersiblepump 1112
11
4 Use the end valve as circle in the flow loop schematic to change the flow rate of the the fluid In
the beginning the end valve must be open The end valve will be changed from fully open to
fully close with 10 different openings Talk with the TA if you need help
5 Repeat steps 2 to 4 with different pump speed for the second pump 3200 3000 2700 2400
2000 1500 RPM
6 Stop recording the data
7 Stop the two pumps
8 Copy the data and then turn off the production lab program
Calculation
1 Convert the flow rate to barrel per day (BPD) and m3 s
2 Convert the differential pressure between intake and discharge pressure to head in the unit of ft
and meter
3 Calculate the hydraulic horse power developed by the second pump
4 Calculate the specific speed of the pump
5 Develop the performance curve of the pump by plotting these ralationships in one graph head (ft
and meter) vs flow rate (bblday and m3 s) specific speed vs flow rate (bblday) hydraulic horse
power vs flow rate (bblday)
6 Plot the performance curve for the two-stage pump (two pump in series) Assuming the intake
pressure is zero
End valve
8132019 L 7amp8 ElectricalSubmersiblePump
httpslidepdfcomreaderfulll-78-electricalsubmersiblepump 1212
12
Questions
1 What is the priciple of bulding head in a centrifugal pump
2 What are the differences between a conventional centrifugal pump and an ESP
3 What are the advantages and disadvantages of an ESP
4 What are the problems if the ESP is operated out of the operating range
5 How does the pump speed change the pump performace curves Why
6 Based on the calculated specific speed how would you classify this centrifigal pump
Experiment 8 The effects of intake pressure on the pump performace curves - Affinity Law
Procedure
1 Apply the same procedure in the experiment 7 but with only two pump speed of 3200 RPM
and 3000 RPM and different intake pressure of 10 20 40 and 50 psig
Calculations
Note that for all the calculations below flow rate is expressed in bblday and head in feet
1 Use the performance curve at 3500 RPM and intake pressure of 30 psig obtained from the
experiment 7 as a reference Apply the Affinity Law to predict the performance curves at
different pump speed of 3200 3000 2700 2400 RPM
2 Plot in the same plot the performance curves predicted by the Affinity Law and the performace
curves obtained from experimental data in the experiment 7
3 Plot the relationship between head and flow rate at 3200 RPM at different intake pressure 10
20 30 40 and 50 psig
4 Generate a similar plot as step 3 but with the pump speed of 3000 RPM
Questions
1 Describe the Affinity Law What are the limitations of the Affinity Law
2 How does the Affinity Law match with the experimental data What may cause the descrepancy
between the prediction of Affinity Law and the experimental data
3
Based on the experimental data how does the intake pressure affect on the pump performanceWhat would you predict the effect of the intake pressure on the pump performance if the fluid is
two phase liquid and gas

8132019 L 7amp8 ElectricalSubmersiblePump
httpslidepdfcomreaderfulll-78-electricalsubmersiblepump 1012
10
Capacity Q changes in direct proportion to speed N ratio
983101
Head H changes in direct proportion to the square of speed N ratio
983101
BHP changes in direct proportion to the cube of speed ratio
983101
The Affinity Laws are valid only under conditions of constant efficiency and very low viscosity of fluids
EXPERIMENTS
Note that we have two pumps connected in series With two pumps in series we can simulate an ESP
with 2 stages We can also simulate the two pumps in series in the different way the first pump is to
simulate the bottom hole pressure or the intake pressure of the ESP meanwhile the second pump is
simulated as an ESP with 1 stage We can change the speed of the ESP by controlling the VFD Similarly
the intake pressure of the ESP can be varied by adjusting the return valve
This procedure is applied for those who are very familiar with the flow loop If students have any
questions or concerns please check with the TA
1 Keep the ldquomanualautordquo switch in the speed control panel in the manual mode
2 Adjust all the valves in the right postions we need to have the flow through the two pumps frac34rsquorsquo
pipe and through the frac12rsquorsquo pipe (No flow through the orifice)
3 Mass flow meter will be used for all ESP tests
Experiment 7 Develop the pump performancersquos curves of an ESP
Procedures
1 Keep the discharge pressure of the first pump (intake pressure of the second pump) at 30 psig by
adjusting the return valve on the return line of the first pump
2 On the speed control panel set a speed of 3500 RPM for the second pump
3 Start recording the data
8132019 L 7amp8 ElectricalSubmersiblePump
httpslidepdfcomreaderfulll-78-electricalsubmersiblepump 1112
11
4 Use the end valve as circle in the flow loop schematic to change the flow rate of the the fluid In
the beginning the end valve must be open The end valve will be changed from fully open to
fully close with 10 different openings Talk with the TA if you need help
5 Repeat steps 2 to 4 with different pump speed for the second pump 3200 3000 2700 2400
2000 1500 RPM
6 Stop recording the data
7 Stop the two pumps
8 Copy the data and then turn off the production lab program
Calculation
1 Convert the flow rate to barrel per day (BPD) and m3 s
2 Convert the differential pressure between intake and discharge pressure to head in the unit of ft
and meter
3 Calculate the hydraulic horse power developed by the second pump
4 Calculate the specific speed of the pump
5 Develop the performance curve of the pump by plotting these ralationships in one graph head (ft
and meter) vs flow rate (bblday and m3 s) specific speed vs flow rate (bblday) hydraulic horse
power vs flow rate (bblday)
6 Plot the performance curve for the two-stage pump (two pump in series) Assuming the intake
pressure is zero
End valve
8132019 L 7amp8 ElectricalSubmersiblePump
httpslidepdfcomreaderfulll-78-electricalsubmersiblepump 1212
12
Questions
1 What is the priciple of bulding head in a centrifugal pump
2 What are the differences between a conventional centrifugal pump and an ESP
3 What are the advantages and disadvantages of an ESP
4 What are the problems if the ESP is operated out of the operating range
5 How does the pump speed change the pump performace curves Why
6 Based on the calculated specific speed how would you classify this centrifigal pump
Experiment 8 The effects of intake pressure on the pump performace curves - Affinity Law
Procedure
1 Apply the same procedure in the experiment 7 but with only two pump speed of 3200 RPM
and 3000 RPM and different intake pressure of 10 20 40 and 50 psig
Calculations
Note that for all the calculations below flow rate is expressed in bblday and head in feet
1 Use the performance curve at 3500 RPM and intake pressure of 30 psig obtained from the
experiment 7 as a reference Apply the Affinity Law to predict the performance curves at
different pump speed of 3200 3000 2700 2400 RPM
2 Plot in the same plot the performance curves predicted by the Affinity Law and the performace
curves obtained from experimental data in the experiment 7
3 Plot the relationship between head and flow rate at 3200 RPM at different intake pressure 10
20 30 40 and 50 psig
4 Generate a similar plot as step 3 but with the pump speed of 3000 RPM
Questions
1 Describe the Affinity Law What are the limitations of the Affinity Law
2 How does the Affinity Law match with the experimental data What may cause the descrepancy
between the prediction of Affinity Law and the experimental data
3
Based on the experimental data how does the intake pressure affect on the pump performanceWhat would you predict the effect of the intake pressure on the pump performance if the fluid is
two phase liquid and gas
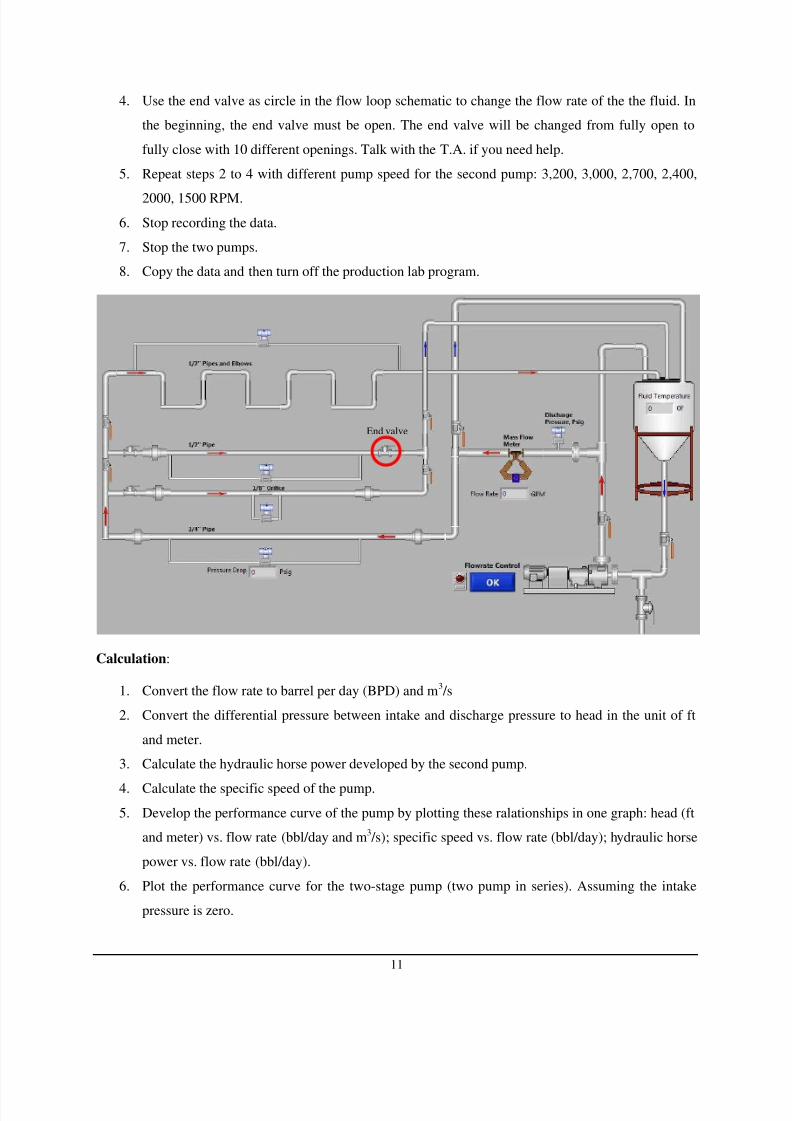
8132019 L 7amp8 ElectricalSubmersiblePump
httpslidepdfcomreaderfulll-78-electricalsubmersiblepump 1112
11
4 Use the end valve as circle in the flow loop schematic to change the flow rate of the the fluid In
the beginning the end valve must be open The end valve will be changed from fully open to
fully close with 10 different openings Talk with the TA if you need help
5 Repeat steps 2 to 4 with different pump speed for the second pump 3200 3000 2700 2400
2000 1500 RPM
6 Stop recording the data
7 Stop the two pumps
8 Copy the data and then turn off the production lab program
Calculation
1 Convert the flow rate to barrel per day (BPD) and m3 s
2 Convert the differential pressure between intake and discharge pressure to head in the unit of ft
and meter
3 Calculate the hydraulic horse power developed by the second pump
4 Calculate the specific speed of the pump
5 Develop the performance curve of the pump by plotting these ralationships in one graph head (ft
and meter) vs flow rate (bblday and m3 s) specific speed vs flow rate (bblday) hydraulic horse
power vs flow rate (bblday)
6 Plot the performance curve for the two-stage pump (two pump in series) Assuming the intake
pressure is zero
End valve
8132019 L 7amp8 ElectricalSubmersiblePump
httpslidepdfcomreaderfulll-78-electricalsubmersiblepump 1212
12
Questions
1 What is the priciple of bulding head in a centrifugal pump
2 What are the differences between a conventional centrifugal pump and an ESP
3 What are the advantages and disadvantages of an ESP
4 What are the problems if the ESP is operated out of the operating range
5 How does the pump speed change the pump performace curves Why
6 Based on the calculated specific speed how would you classify this centrifigal pump
Experiment 8 The effects of intake pressure on the pump performace curves - Affinity Law
Procedure
1 Apply the same procedure in the experiment 7 but with only two pump speed of 3200 RPM
and 3000 RPM and different intake pressure of 10 20 40 and 50 psig
Calculations
Note that for all the calculations below flow rate is expressed in bblday and head in feet
1 Use the performance curve at 3500 RPM and intake pressure of 30 psig obtained from the
experiment 7 as a reference Apply the Affinity Law to predict the performance curves at
different pump speed of 3200 3000 2700 2400 RPM
2 Plot in the same plot the performance curves predicted by the Affinity Law and the performace
curves obtained from experimental data in the experiment 7
3 Plot the relationship between head and flow rate at 3200 RPM at different intake pressure 10
20 30 40 and 50 psig
4 Generate a similar plot as step 3 but with the pump speed of 3000 RPM
Questions
1 Describe the Affinity Law What are the limitations of the Affinity Law
2 How does the Affinity Law match with the experimental data What may cause the descrepancy
between the prediction of Affinity Law and the experimental data
3
Based on the experimental data how does the intake pressure affect on the pump performanceWhat would you predict the effect of the intake pressure on the pump performance if the fluid is
two phase liquid and gas


![IoT L 8 Ú ] ) f 7 - 2 þ ¡1w S ? U Ú 0 # 2 Å ÷ ; f 2 4 f ª5 ...€¦ · L 8 Ú ] ) f 7 - 2æwIoTæxk= Úª5=¨ ^ ' T O f ! Q ] y L 8 Ú ] ) f 7 - 2æwInternet of Things: IoTæx](https://img.pdfslide.us/doc/110x75/5ec412123ef8a554753801a4/iot-l-8-f-7-2-1w-s-u-0-2-f-2-4-f-5-l-8-.jpg)


![?88 L Z #8 =7 ;]; =JG=J S S f G1 88#8](https://img.pdfslide.us/doc/110x75/61a9eb59f85abf47cf5808d8/88-l-z-8-7-jgj-s-s-f-g1-888.jpg)