Embed Size (px)
Citation preview
CAUSATION AN AND ASSOCIATION AND CONFOUNDING
DR DINESH KUMAR WALIAASSTT PROFESSOR
DEPARTMENT OF COMMUNITY MEDICINEGOVERNMENT MEDICAL COLLEGE
CHANDIGARH

TerminologyRisk ??
Risk Factor: Characteristic, condition or behaviour increasingthe problem of developing a disease in a currently
healthy individual.
i.e P (D+ / E+) > P (D+ / E-)
eg. for lung cancer: Smoking.
Risk Factor: env. / behavioural / social / psycho / genetic etc.exposure to risk factor may be point / chronic.
Risk Assessment: Quantification / Extent of association / riskamount.

Risk Markers: Factors indirectly associated with the outcome.
eg. Neonatal Mortality:
Risk factors : Poor pre‐natal care, ………….
Casual factors : LBW …………
Marker : Low SES
Synergy : LBW & other complications.
Characteristics of Casual Factors:
• Consistency
• Strength
• Specificity
• Temporality
• Coherence
RISK FACTOR Vs CASUAL FACTORCasual Factor A risk factor which causes disease
Risk factor casual factor (may be vice versa)
Why? The observed association between risk factor & disease
may also be due to confounders / markers and synergistic
factors.
Confounders?? Synergistic Factors? Markers??

CONFOUNDING FACTORS• Factor associated with exposure whichindependently of any such association is alsorisk factor for the disease.
• Factors distorting association between risk
factor & disease by creating artificial
relationships. A confounder is associated with
both expo. and outcome, but unequally.

To eliminate the effect of confounding.
• Matching
To ensure comparability of cases and controls.
(a) Pair matching
(b) Group matching
• Stratification
Suspected etiologic factors should not be used as
potential confounders for
matching factors.
Examples of Confounding Factors
(1) Smoking & Lung cancer (age is confounder)
(2) Contra use (IUD) - Cervical cancer
(age & marital status)
(3) OC - BC (age)

Synergistic Factors: Synergy means magnification of effects
arising from different exposures / risk factors s.t. effect of
exposures working together is greater than the sum of their
individual effects. ie. P (AB) > P (A) + P (B).
eg. (1) Lung cancer and smoking
Drinking
R [Smoke & Drink] > R (Smoke) + R (Drink)
(2) MI and OC use
Smoking

Difference between confounding and synergy:
• In synergy, we are interested in joint effect or
effect modification. A effect modifier (syn.
Factor) relates essentially to differences between
the measures of associate at different levels of
modifier.
• In confounding, crude measure of associated does
not reflect in each category necessarily, but the
association is consistent.

ASSOCIATION AND CAUSATION
Types of Association:- Spurious / unreal- Indirect- Direct / casual
Types of Causation- One – to – One- Multi-factorial

Criterion for judging Causality of Association- Temporality
Whether suspected cause precede the observed effect.
- Strength of association(RR or dose-response or duration response relationship)
- Specificity (One-One association, but a single cause may result in several outcomes)?
- Consistency- Biological plausibility- Coherence

Risk: Prob. / Prop. Of individuals suffering from particular
disease out of total individuals.
No. of diseased individuals
Risk: P (D+) = ---------------------------------
Total no. of individuals
in cross sec. study, Risk = Prev. rate
Note: In case of cohort study (fixed follow-up)
Risk IR
No. of persons developing diseases during follow-up
= ---------------------------------------------------------------
No. of persons disease free at start of study

13
Probability and odds• Probability• Odds =No of times the event occurs/ No of times
the event doesn’t occur
=Probability that the event will occur divided by the Probability that the event will not occur.
P (Occurrence of event) = ---------------------------------------
P (No. occurrence of the event)

Odds of an event (say disease) is defined as the ratio:P (D+) P (D+)
---------- or -------------P (D-) 1 – P (D+)
a/N a No. of occurrences= ------ = -- = --------------------------
b/N b No. of non-occurrence
• Probability can be expressed as odds and odds can be expressed as probability.
• Odds = probability/1-probability= P/1-P
• P = odds/1 + odds

Odds Ratio (OR) or Relative Odds (RO): OR is used to compare absolute risks in two categories maybe E+ and E- or D+ and D-
(Odds) expoOR = -------------------
(Odds) unexpoIn case of low risk / rare disease, OR gives an excellent approximation of relative risk (RR).
OR RR Estimated RR

Relative Risk:
Risk among expoRR = ------------------
Risk among unexpo
In Cross-sectional study: PR among expo
IR = ------------------PR among unexpo
In Cohort Study:(IR) expo
---------------(IR) unexpo

ATTRIBUTABLE RISK (AR)
Prop of diseased individuals attributable to a particular expovariable ie The amount of risk which can be attributed to aparticular risk factor:
AR (1)= P(D+/E+) – P (D+/E-)____________________
P (D+ / E+)= (IR) expo – (IR) unexpo
______________________(IR)
(for follow-up studies)= I - I = RR – I
-------- -----------RR RR
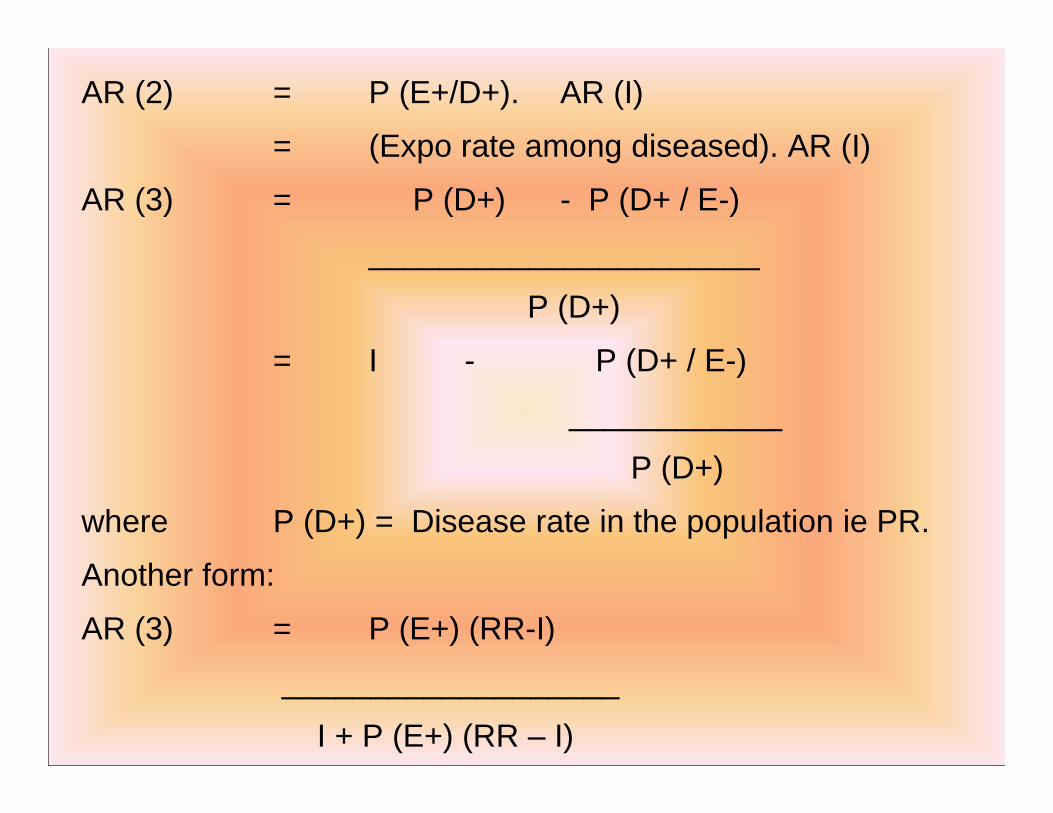
AR (2) = P (E+/D+). AR (I)
= (Expo rate among diseased). AR (I)
AR (3) = P (D+) - P (D+ / E-)
______________________
P (D+)
= I - P (D+ / E-)
____________
P (D+)
where P (D+) = Disease rate in the population ie PR.
Another form:
AR (3) = P (E+) (RR-I)
___________________
I + P (E+) (RR – I)

• AR guides us in management of individual patients.
• AR gives the amount of risk that can be attributed to expo to a particular risk factor.
eg. Epilepsy & Delivery type
AR gives us the risk of epilepsy developing as a consequence of forceps delivery.
• Other syno terms of AR:
Risk difference = P(D+/E+) – P(D+/E-)
= (Risk) expo – (Risk) unexpo.
Excess Risk Rate Difference give crude expressions of AR.

POPULATION ATTRIBUTABLE RISK (PAR)
PAR is a measure of excess amount of risk of a particular
disease in the population that can be solely attributed to the
risk factor.
PAR = AR P(E+) (in population)
If an independent estimate P (E+) ie proportion of people
exposed in the population is available, then PAR can be
obtained.
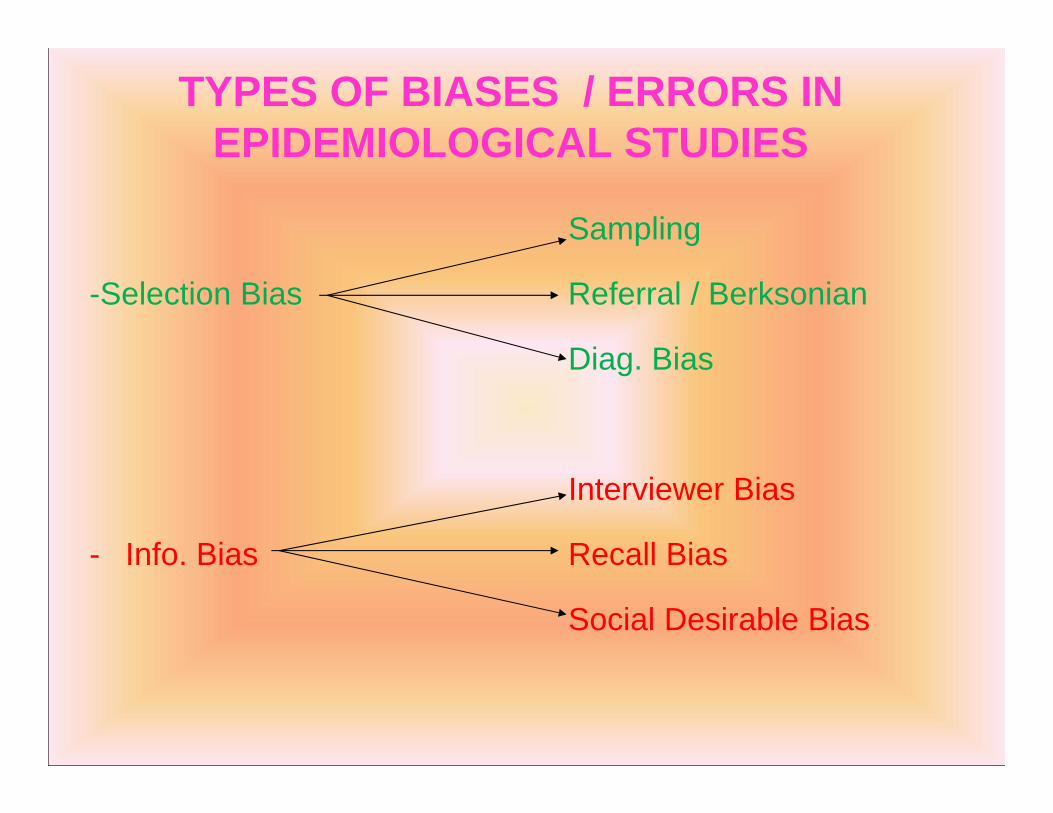
TYPES OF BIASES / ERRORS IN EPIDEMIOLOGICAL STUDIES
Sampling
-Selection Bias Referral / Berksonian
Diag. Bias
Interviewer Bias
- Info. Bias Recall Bias
Social Desirable Bias