Embed Size (px)
Citation preview
Overcoming Resource Constraints: Developing Regional Risk
Management Program Teams
Kynda Curtis, Utah State UniversityStaci Emm, University of Nevada Cooperative Extension
Economic environment Creating collaborations & programmatic
teams Identified program needs
◦ Native Americans◦ Women◦ Beginning Farmers & Ranchers
Amplifying impact
Today’s Presentation
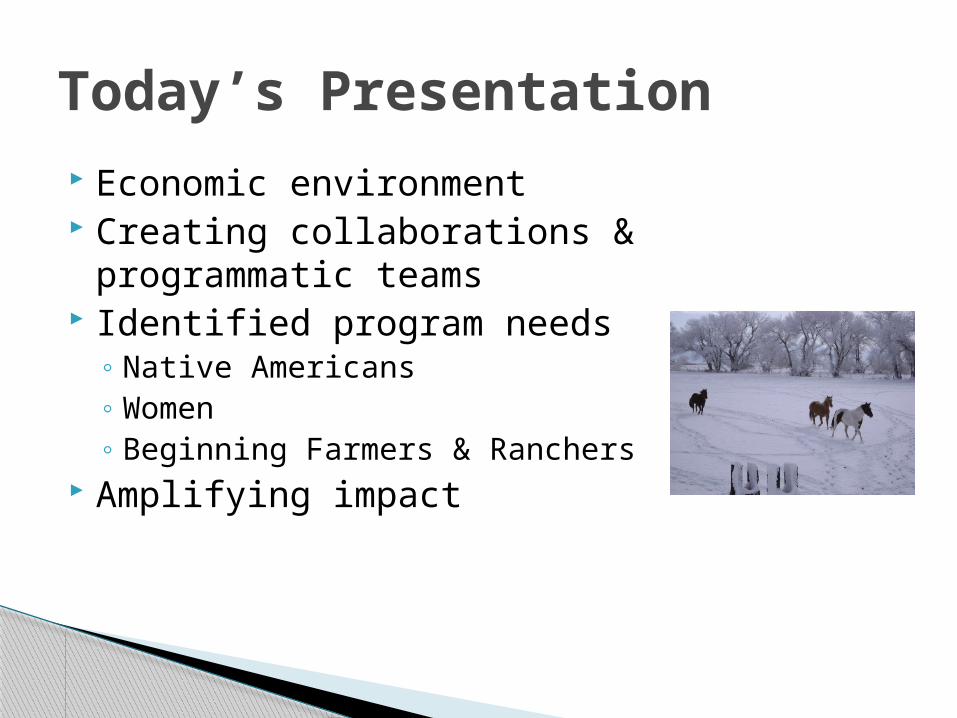
University of Nevada, Reno◦ Budget cuts at 20.7% in 2009, 6.9% in 2010
Loss of ag econ & animal science depts (& associated specialists)
◦ Nevada Cooperative Extension proposed cut of 72%, 2011-2012
Utah State University◦ Budget cuts at 17% for 2009-2010, 2% for 2011
Combining resources to better serve farmers & ranchers in Nevada & Utah
Economic Environment
Identify people that like working together & share similar goals◦ Identify geographic location to be served◦ Identify strengths/weaknesses in team expertise◦ Supplement team through hires if needed
Identify target audience◦ Target Native American, women, & beginning
farmers/ranchers
Creating Collaborations/Teams
Kynda Curtis, Niche marketing/business planning & program evaluation
Staci Emm, Beef production/marketing, business entrepreneurship & youth programs
Ruby Ward, Taxes & financial management Loretta Singletary, Conflict resolution and program evaluation Dillon Feuz, Livestock marketing Randy Emm, Indian programs & crop/livestock insurance Kathy Frasier, Indian programs & record-keeping/Quickbooks Carol Bishop, Enterprise budgets & feasibility analysis
Additional expertise in livestock production, vegetable/fruit production, & food safety/labeling◦ Ron Torell, Dan Drost, Steve Foster, Jay Davison, Karin Allen, & Brent
Black
Team Expertise
Business planning◦ Entrepreneurship◦ Business/marketing plans◦ Niche/direct marketing◦ Crop/livestock insurance◦ Record-keeping/budgeting◦ Tax structure/preparing for taxes◦ Profitability/feasibility assessment
Production◦ Niche beef production◦ Small-scale fruit/vegetable production◦ Food safety
Curriculum
Funding sources◦ Utah State University & University of Nevada
Cooperative Extension◦ USDA-Risk Management Agency
Targeted states program Outreach program
◦ NIFA-BFRDP Beginning farmer/rancher program
◦ NIFA-FRTEP Federal recognized tribes extension program
◦ Western SARE Funding applied for & managed by team PIs
Funding
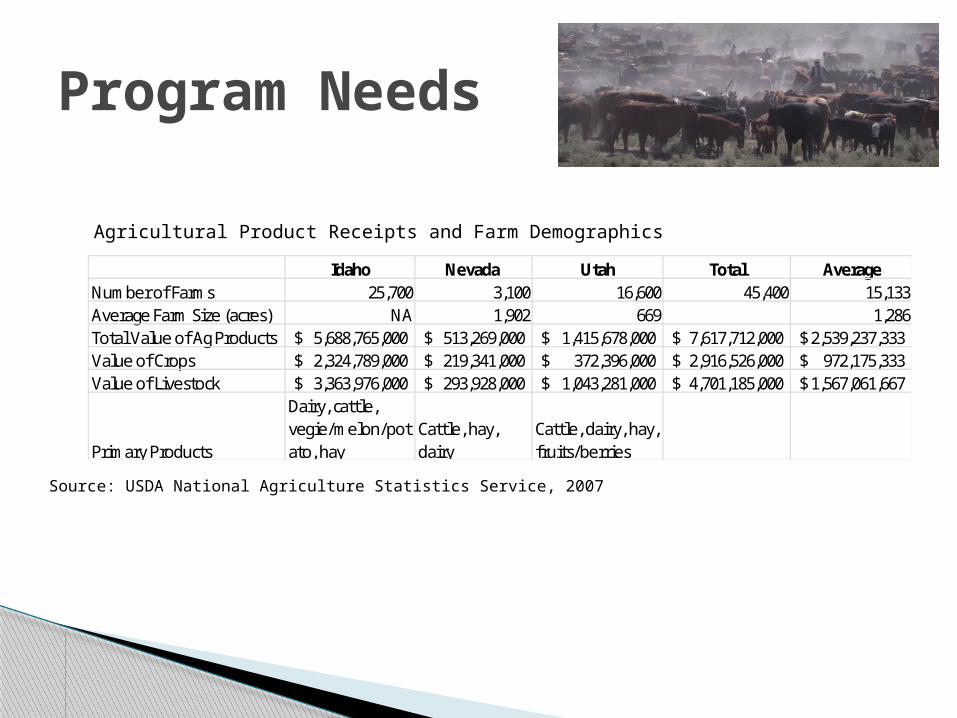
Program Needs
Idaho Nevada Utah Total AverageNumber of Farms 25,700 3,100 16,600 45,400 15,133Average Farm Size (acres) NA 1,902 669 1,286Total Value of Ag Products 5,688,765,000$ 513,269,000$ 1,415,678,000$ 7,617,712,000$ 2,539,237,333$ Value of Crops 2,324,789,000$ 219,341,000$ 372,396,000$ 2,916,526,000$ 972,175,333$ Value of Livestock 3,363,976,000$ 293,928,000$ 1,043,281,000$ 4,701,185,000$ 1,567,061,667$
Primary Products
Dairy, cattle, vegie/melon/potato, hay
Cattle, hay, dairy
Cattle, dairy, hay, fruits/berries
Agricultural Product Receipts and Farm Demographics
Source: USDA National Agriculture Statistics Service, 2007
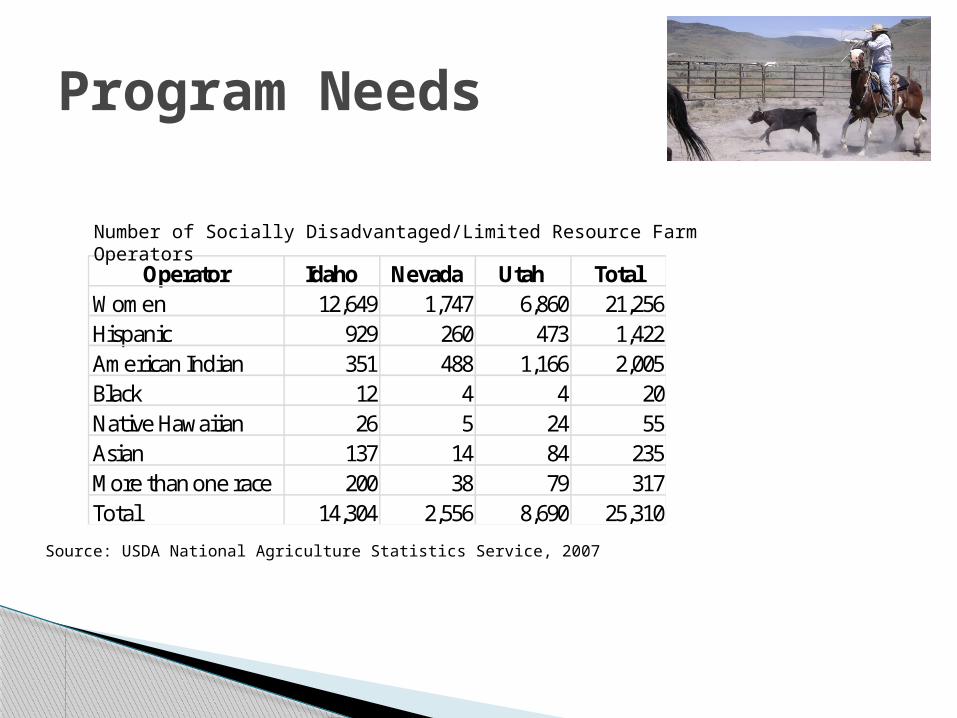
Program Needs
Source: USDA National Agriculture Statistics Service, 2007
Operator Idaho Nevada Utah Total Women 12,649 1,747 6,860 21,256Hispanic 929 260 473 1,422American Indian 351 488 1,166 2,005Black 12 4 4 20Native Hawaiian 26 5 24 55Asian 137 14 84 235More than one race 200 38 79 317Total 14,304 2,556 8,690 25,310
Number of Socially Disadvantaged/Limited Resource Farm Operators
Provide on-reservation training in Nevada ◦ Record-keeping◦ Crop/livestock Insurance◦ Agricultural taxes◦ Small-scale vegetable production
Hold the only statewide American Indian Summit for tribal producers, Nevada
Plan to expand programming to Utah Fall 2011
Conduct regional tribal programming needs assessment summer 2011
Native Americans
Fastest growing producer population Small-scale fruit/vegetable production on
the rise Demand for local foods/direct markets
increasing Require knowledge to increase their profits
& meet their family needs Require skills to reduce family stress &
conflict, including time management and dispute resolution
Women
Nevada Small Farms Conference◦ March Fallon, NV
Great Basin Women & Youth in Ag Conference◦ June Las Vegas, NV – For Utah, Nevada, & Idaho
General Topics◦ Record-keeping/business planning/taxes◦ Crop/livestock insurance◦ Vegetable/fruit production/marketing◦ Food safety in value-added production◦ Niche livestock production/marketing◦ Family business management/conflict resolution◦ Direct marketing-farmers markets, farm-to-school
Women
FFA program – MARSS (managing agriculture risk seminar series), Nevada◦ 30 classes held in pilot 2009◦ 12 classes with new curriculum 2011
Utah Building Farmers Program◦ Fall 8 week session, Utah◦ Fall 3 day conference, tribal members in Nevada
Diversified Agriculture Conference◦ February, Utah
Nevada Small Farms Conference◦ March, Fallon, NV
Economic Assessment of Low Water-Use Crops◦ One-day course held year-round in Utah, Idaho, & Nevada
Beginning Farmers/Ranchers
Evaluation Program Pre/post-testing Post-workshop evaluation 6 month and/or 1 year follow-up evaluation Standard KASA, practices, SEEC model
◦ Change in knowledge/attitude◦ Use of new knowledge/change in practice◦ Economic/social impacts
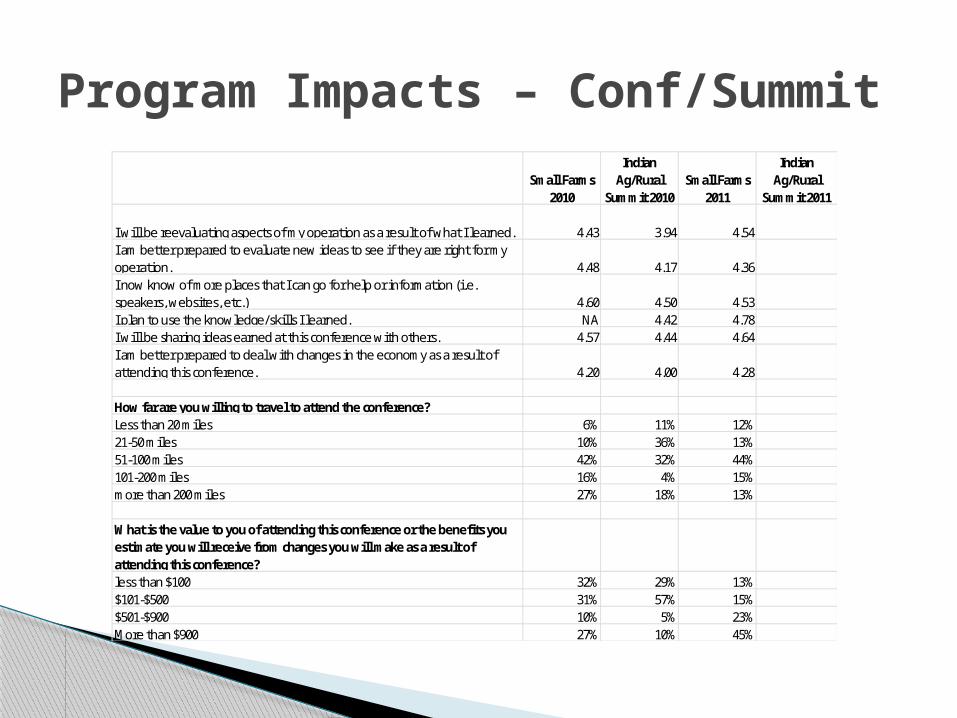
Program Impacts – Conf/Summit
Small Farms 2010
Indian Ag/Rural
Summit 2010Small Farms
2011
Indian Ag/Rural
Summit 2011
I will be reevaluating aspects of my operation as a result of what I learned. 4.43 3.94 4.54I am better prepared to evaluate new ideas to see if they are right for my operation. 4.48 4.17 4.36I now know of more places that I can go for help or information (i.e. speakers, websites, etc.) 4.60 4.50 4.53I plan to use the knowledge/skills I learned. NA 4.42 4.78I will be sharing ideas earned at this conference with others. 4.57 4.44 4.64I am better prepared to deal with changes in the economy as a result of attending this conference. 4.20 4.00 4.28
How far are you willing to travel to attend the conference?Less than 20 miles 6% 11% 12%21-50 miles 10% 36% 13%51-100 miles 42% 32% 44%101-200 miles 16% 4% 15%more than 200 miles 27% 18% 13%
What is the value to you of attending this conference or the benefits you estimate you will receive from changes you will make as a result of attending this conference?less than $100 32% 29% 13%$101-$500 31% 57% 15%$501-$900 10% 5% 23%More than $900 27% 10% 45%
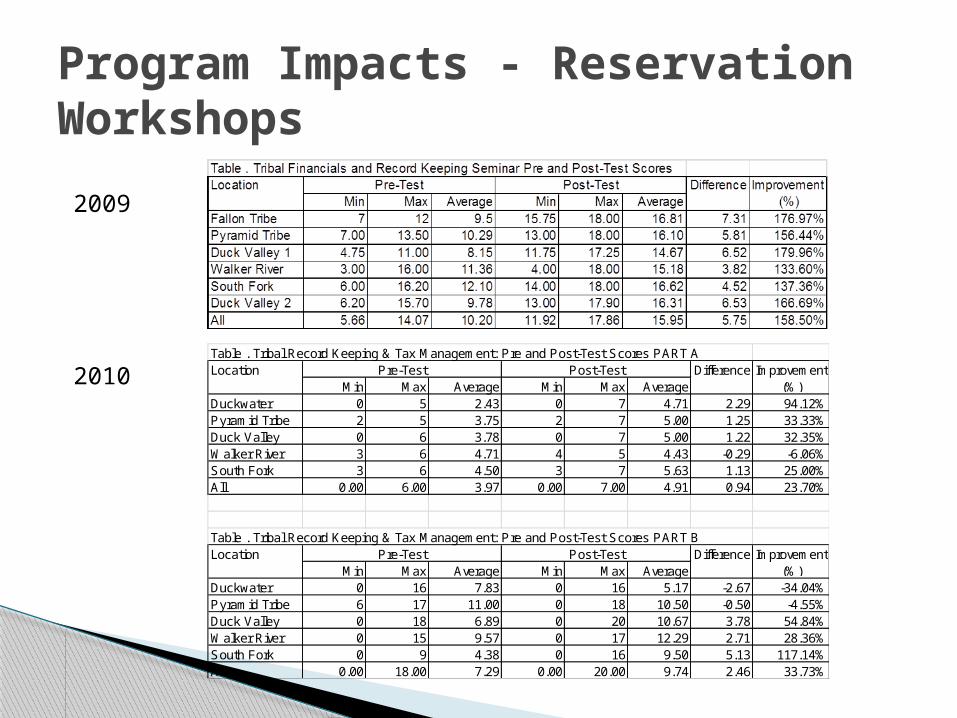
Program Impacts - Reservation Workshops
Table . Tribal Record Keeping & Tax Management: Pre and Post-Test Scores PART A
Min Max Average Min Max AverageDuckwater 0 5 2.43 0 7 4.71 2.29 94.12%Pyramid Tribe 2 5 3.75 2 7 5.00 1.25 33.33%Duck Valley 0 6 3.78 0 7 5.00 1.22 32.35%Walker River 3 6 4.71 4 5 4.43 -0.29 -6.06%South Fork 3 6 4.50 3 7 5.63 1.13 25.00%All 0.00 6.00 3.97 0.00 7.00 4.91 0.94 23.70%
Table . Tribal Record Keeping & Tax Management: Pre and Post-Test Scores PART B
Min Max Average Min Max AverageDuckwater 0 16 7.83 0 16 5.17 -2.67 -34.04%Pyramid Tribe 6 17 11.00 0 18 10.50 -0.50 -4.55%Duck Valley 0 18 6.89 0 20 10.67 3.78 54.84%Walker River 0 15 9.57 0 17 12.29 2.71 28.36%South Fork 0 9 4.38 0 16 9.50 5.13 117.14%All 0.00 18.00 7.29 0.00 20.00 9.74 2.46 33.73%
Improvement (%)
Location Pre-Test Post-Test Difference
Improvement (%)
Location Pre-Test Post-Test Difference
2009
2010
Results of Nevada Crop/Livestock Insurance Handbook Evaluations and Programming Participant Survey Regarding Crop/Livestock Insurance Understanding and Use◦ Understanding of crop insurance features, tools, use in risk
management and awareness of agents increased by 6-15% from 2009-2010
◦ Use of crop insurance increased by 6% from 2009-2010◦ Results from the 2010 handbook evaluations and 2010 survey
are similar ◦ The cost of crop insurance and inappropriate for farm/ranch were
the primary reasons respondents didn’t purchase crop insurance in both the 2010 handbook evaluations and 2010 survey
◦ Crop insurance policies earning premium increased by 32.22% from 2008-2009, and by 5.88% from 2009-2010
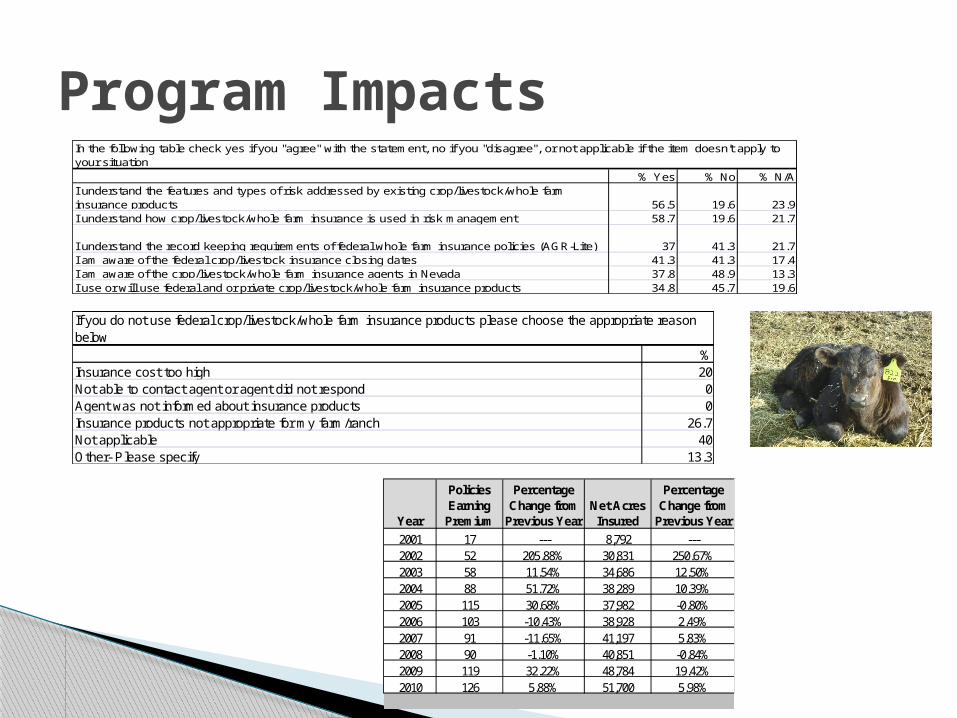
Program Impacts
Program Impacts
Year
Policies Earning
Premium
Percentage Change from
Previous YearNet Acres
Insured
Percentage Change from
Previous Year
2001 17 --- 8,792 ---2002 52 205.88% 30,831 250.67%2003 58 11.54% 34,686 12.50%2004 88 51.72% 38,289 10.39%2005 115 30.68% 37,982 -0.80%2006 103 -10.43% 38,928 2.49%2007 91 -11.65% 41,197 5.83%2008 90 -1.10% 40,851 -0.84%2009 119 32.22% 48,784 19.42%2010 126 5.88% 51,700 5.98%
% Yes % No % N/AI understand the features and types of risk addressed by existing crop/livestock/whole farm insurance products 56.5 19.6 23.9I understand how crop/livestock/whole farm insurance is used in risk management 58.7 19.6 21.7
I understand the record keeping requirements of federal whole farm insurance policies (AGR-Lite) 37 41.3 21.7I am aware of the federal crop/livestock insurance closing dates 41.3 41.3 17.4I am aware of the crop/livestock/whole farm insurance agents in Nevada 37.8 48.9 13.3I use or will use federal and or private crop/livestock/whole farm insurance products 34.8 45.7 19.6
In the following table check yes if you "agree" with the statement, no if you "disagree", or not applicable if the item doesn't apply to your situation
%Insurance cost too high 20Not able to contact agent or agent did not respond 0Agent was not informed about insurance products 0Insurance products not appropriate for my farm/ranch 26.7Not applicable 40Other- Please specify 13.3
If you do not use federal crop/livestock/whole farm insurance products please choose the appropriate reason below

Questions?Thank you!