Embed Size (px)
DESCRIPTION
KwaZulu Natal Province URC Annual Meeting 13-17 December 2010. Provincial Coordinators: Mrs. P Harrison Mrs. M Ngema Mrs. V Mbatha. HCI Facilities. Level support provided. Key Activities. Health Systems Strengthening - PowerPoint PPT Presentation
Citation preview
1
KwaZulu Natal Province
URC Annual Meeting 13-17 December 2010
Provincial Coordinators: Mrs. P Harrison Mrs. M Ngema Mrs. V Mbatha
USAID HEALTH CARE IMPROVEMENT PROJECT
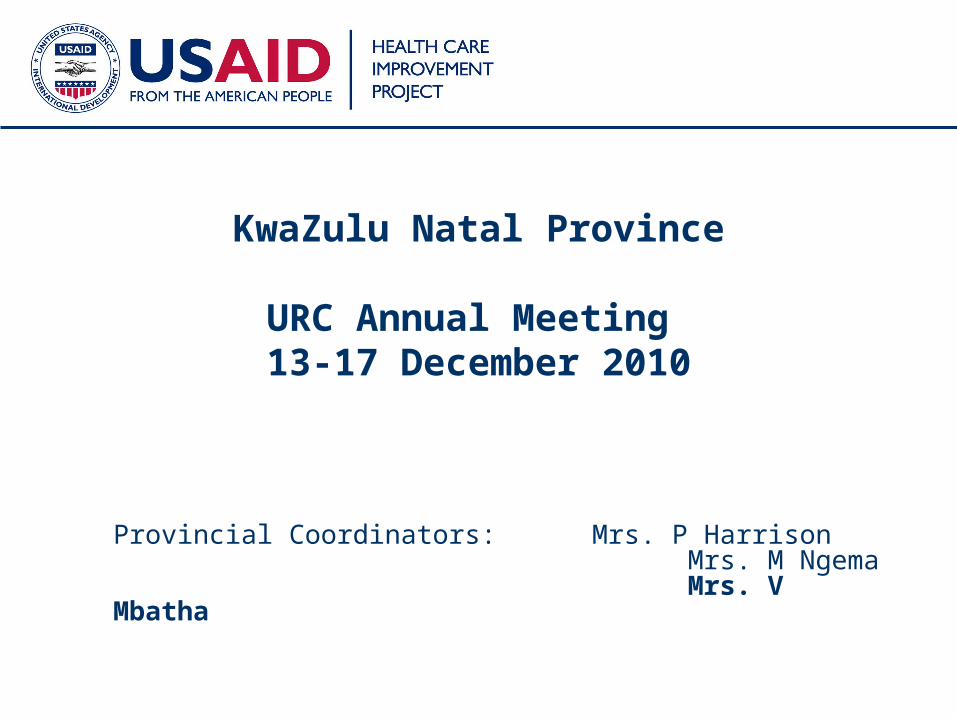
HCI Facilities
District Facilities
Uthungulu 31 health care facilities
Uthungulu Amakhumbuza Home based care organization
USAID HEALTH CARE IMPROVEMENT PROJECT
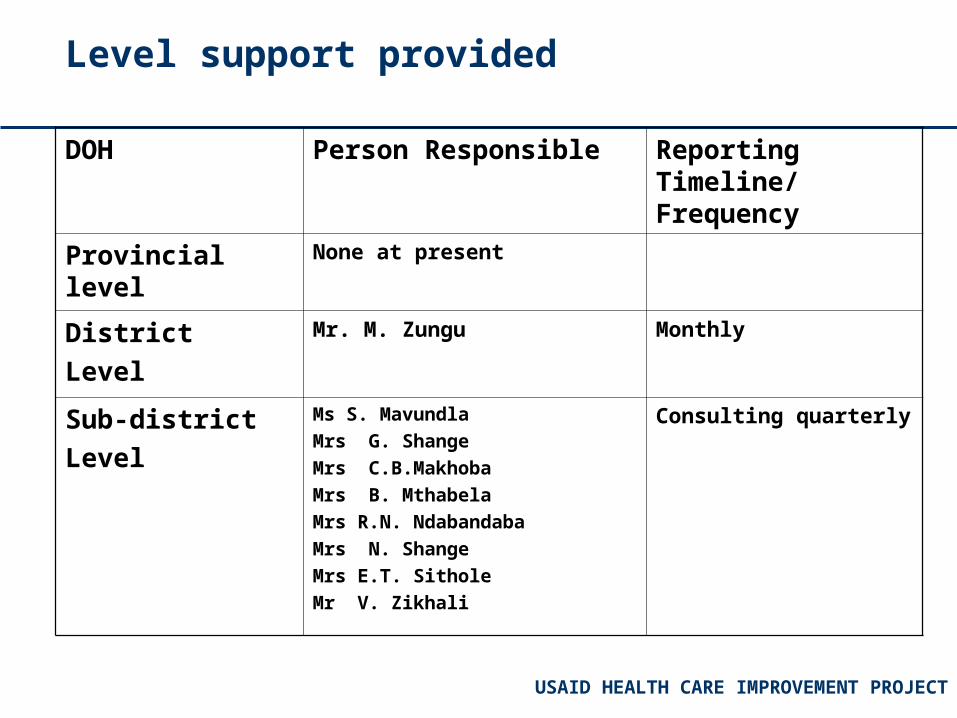
Level support provided
DOH Person Responsible Reporting Timeline/ Frequency
Provincial level None at present
District
Level
Mr. M. Zungu Monthly
Sub-district
Level
Ms S. Mavundla
Mrs G. Shange
Mrs C.B.Makhoba
Mrs B. Mthabela
Mrs R.N. Ndabandaba
Mrs N. Shange
Mrs E.T. Sithole
Mr V. Zikhali
Consulting quarterly
USAID HEALTH CARE IMPROVEMENT PROJECT
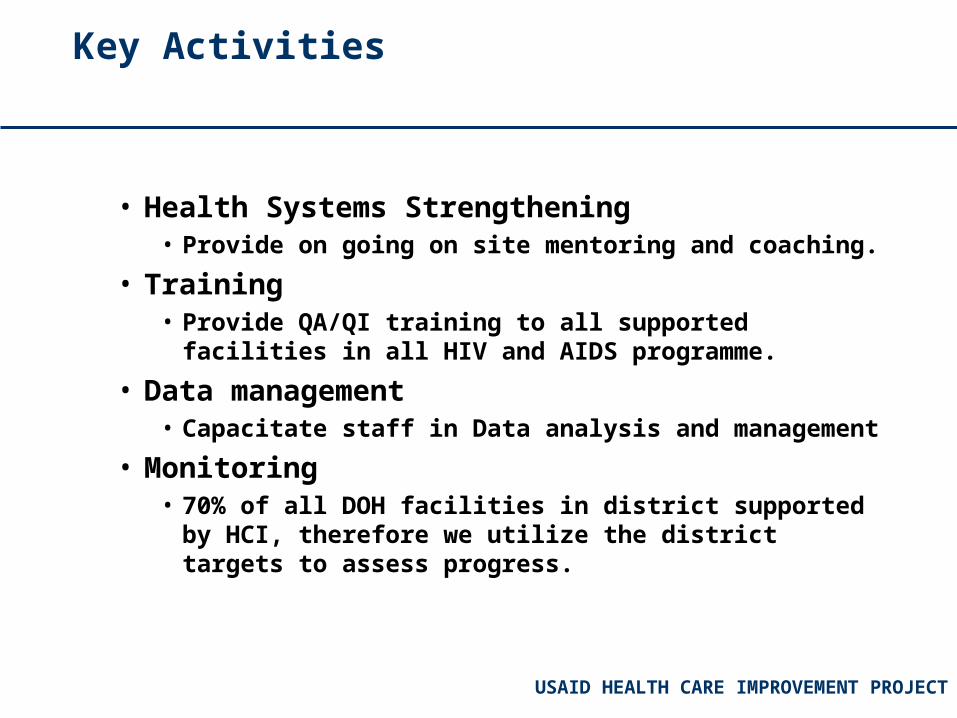
Key Activities
• Health Systems Strengthening• Provide on going on site mentoring and coaching.
• Training• Provide QA/QI training to all supported facilities in all
HIV and AIDS programme.
• Data management• Capacitate staff in Data analysis and management
• Monitoring• 70% of all DOH facilities in district supported by HCI,
therefore we utilize the district targets to assess progress.
USAID HEALTH CARE IMPROVEMENT PROJECT
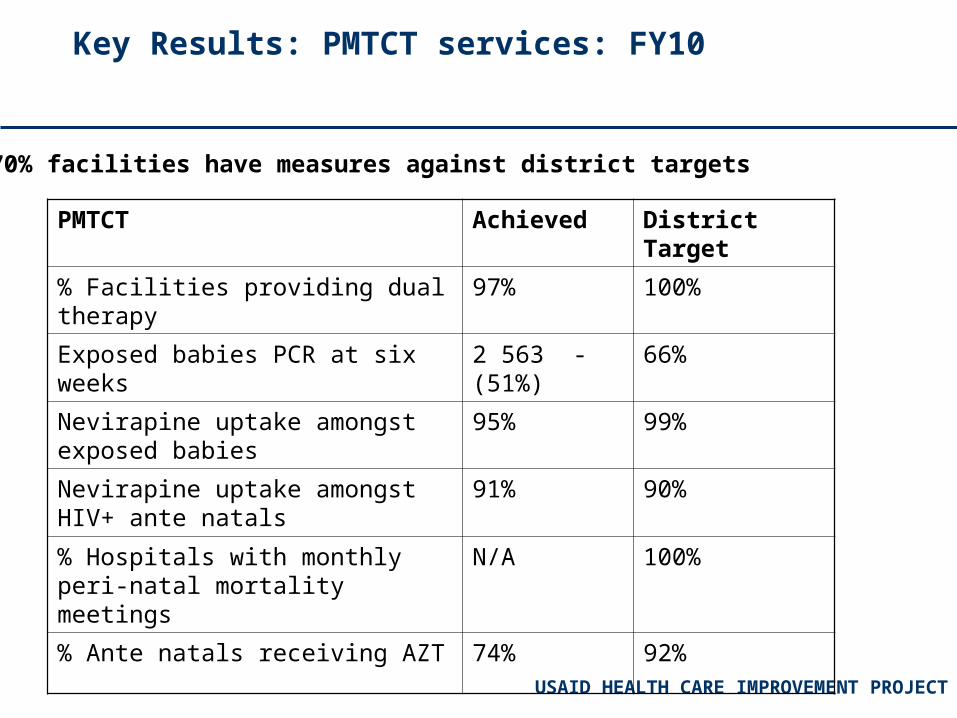
Key Results: PMTCT services: FY10
PMTCT Achieved District Target
% Facilities providing dual therapy 97% 100%
Exposed babies PCR at six weeks 2 563 - (51%) 66%
Nevirapine uptake amongst exposed babies
95% 99%
Nevirapine uptake amongst HIV+ ante natals
91% 90%
% Hospitals with monthly peri-natal mortality meetings
N/A 100%
% Ante natals receiving AZT 74% 92%
70% facilities have measures against district targets
USAID HEALTH CARE IMPROVEMENT PROJECT
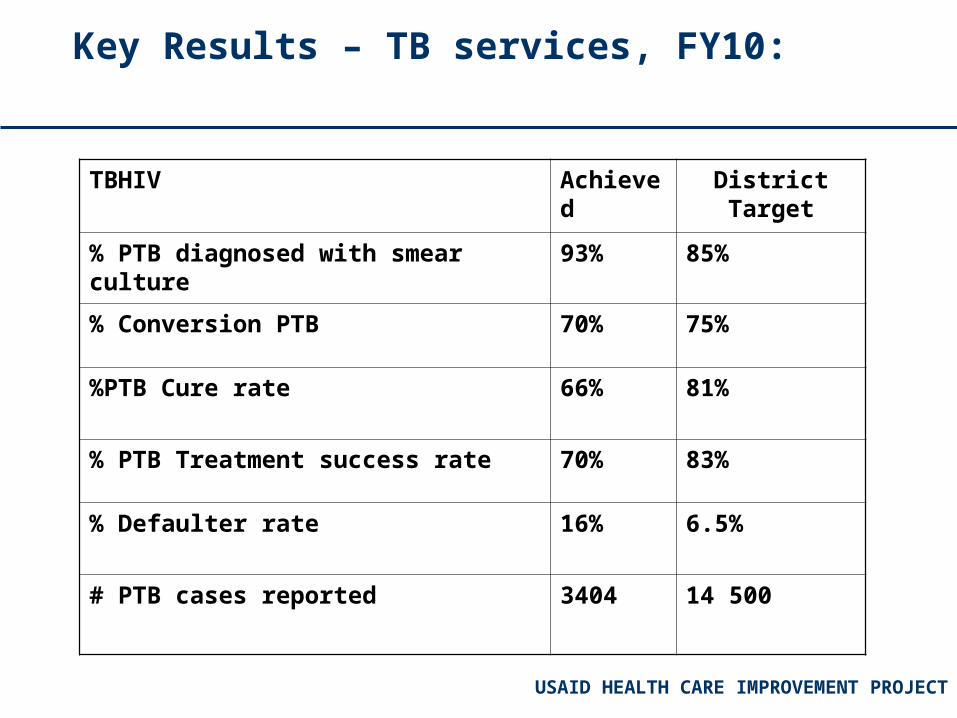
Key Results – TB services, FY10:
TBHIV Achieved District Target
% PTB diagnosed with smear culture 93% 85%
% Conversion PTB 70% 75%
%PTB Cure rate 66% 81%
% PTB Treatment success rate 70% 83%
% Defaulter rate 16% 6.5%
# PTB cases reported 3404 14 500
USAID HEALTH CARE IMPROVEMENT PROJECT
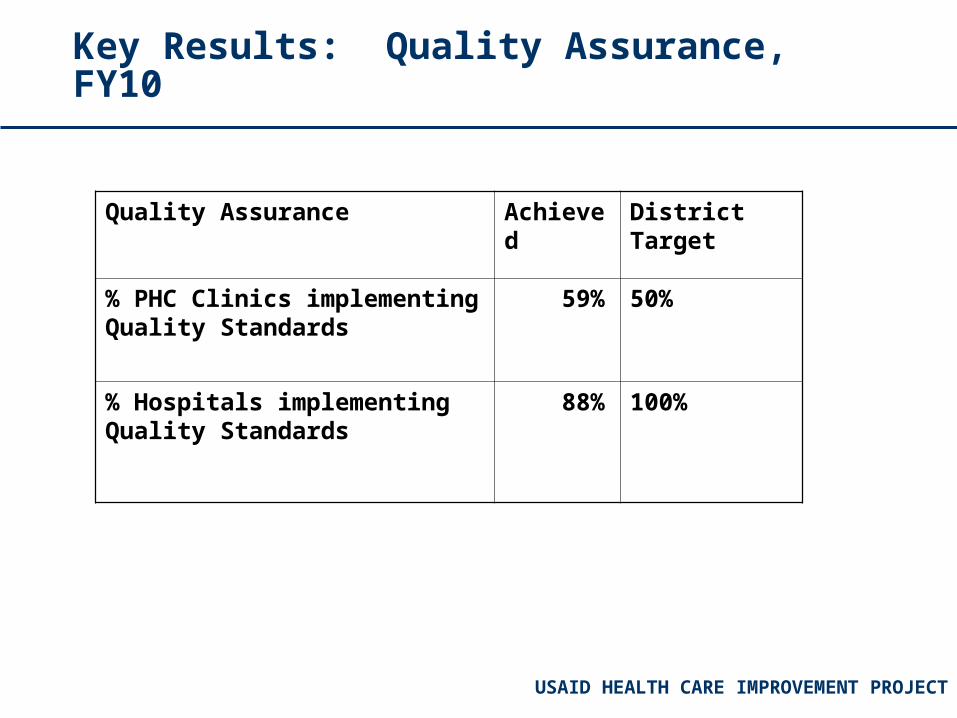
Key Results: Quality Assurance, FY10
Quality Assurance Achieved District Target
% PHC Clinics implementing Quality Standards
59% 50%
% Hospitals implementing Quality Standards
88% 100%
USAID HEALTH CARE IMPROVEMENT PROJECT
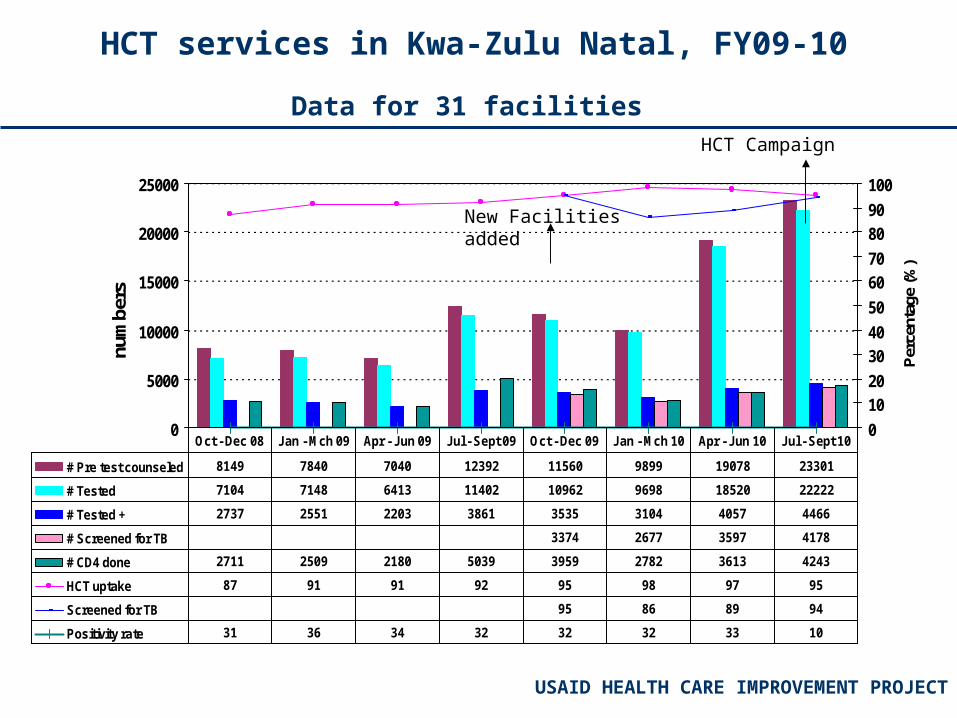
HCT services in Kwa-Zulu Natal, FY09-10
Data for 31 facilities
0
5000
10000
15000
20000
25000
num
bers
0
10
20
30
40
50
60
70
80
90
100
Per
cent
age
(%)
# Pre test counseled 8149 7840 7040 12392 11560 9899 19078 23301
# Tested 7104 7148 6413 11402 10962 9698 18520 22222
# Tested + 2737 2551 2203 3861 3535 3104 4057 4466
# Screened for TB 3374 2677 3597 4178
# CD4 done 2711 2509 2180 5039 3959 2782 3613 4243
HCT uptake 87 91 91 92 95 98 97 95
Screened for TB 95 86 89 94
Positivity rate 31 36 34 32 32 32 33 10
Oct - Dec 08 Jan - Mch 09 Apr - Jun 09 Jul - Sept 09 Oct - Dec 09 Jan - Mch 10 Apr - Jun 10 Jul - Sept 10
New Facilities added
HCT Campaign
USAID HEALTH CARE IMPROVEMENT PROJECT
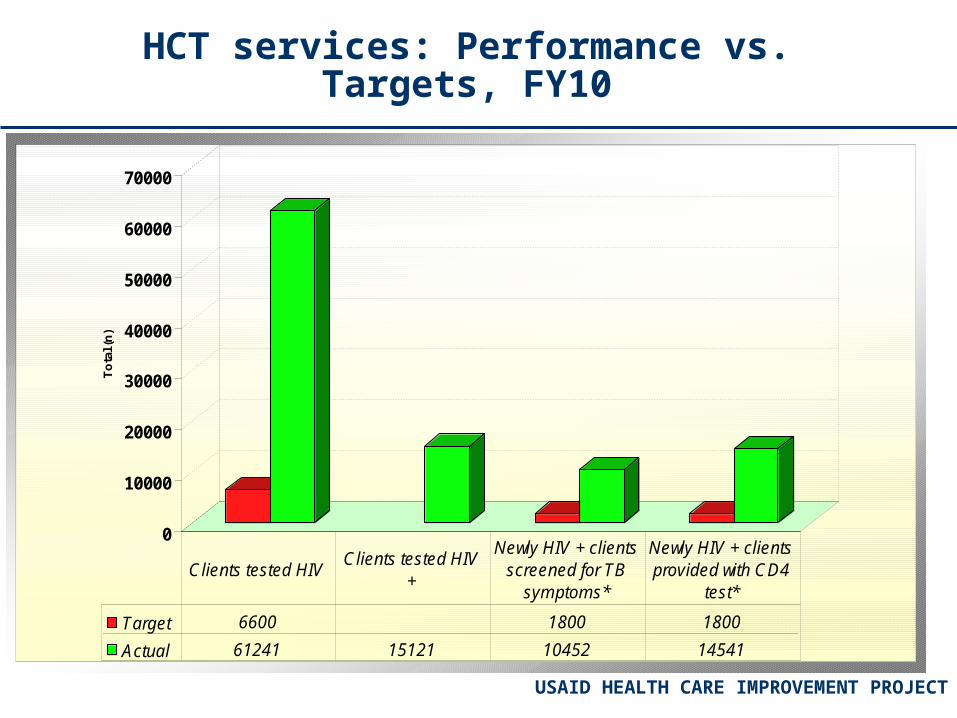
HCT services: Performance vs. Targets, FY10
0
10000
20000
30000
40000
50000
60000
70000
To
tal (
n)
Target 6600 1800 1800
Actual 61241 15121 10452 14541
Clients tested HIV Clients tested HIV
+
Newly HIV + clients screened for TB
symptoms*
Newly HIV + clients provided with CD4
test*
USAID HEALTH CARE IMPROVEMENT PROJECT
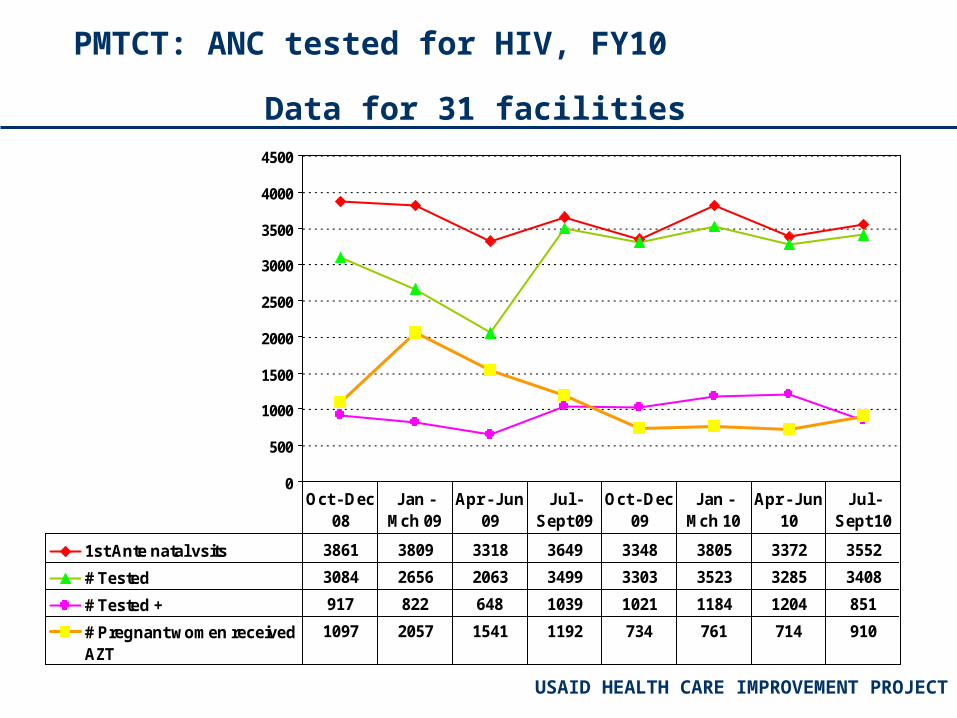
PMTCT: ANC tested for HIV, FY10
Data for 31 facilities
0
500
1000
1500
2000
2500
3000
3500
4000
4500
1st Ante natal vsits 3861 3809 3318 3649 3348 3805 3372 3552
# Tested 3084 2656 2063 3499 3303 3523 3285 3408
# Tested + 917 822 648 1039 1021 1184 1204 851
# Pregnant women receivedAZT
1097 2057 1541 1192 734 761 714 910
Oct - Dec 08
Jan - Mch 09
Apr - Jun 09
Jul - Sept 09
Oct - Dec 09
Jan - Mch 10
Apr - Jun 10
Jul - Sept 10
USAID HEALTH CARE IMPROVEMENT PROJECT
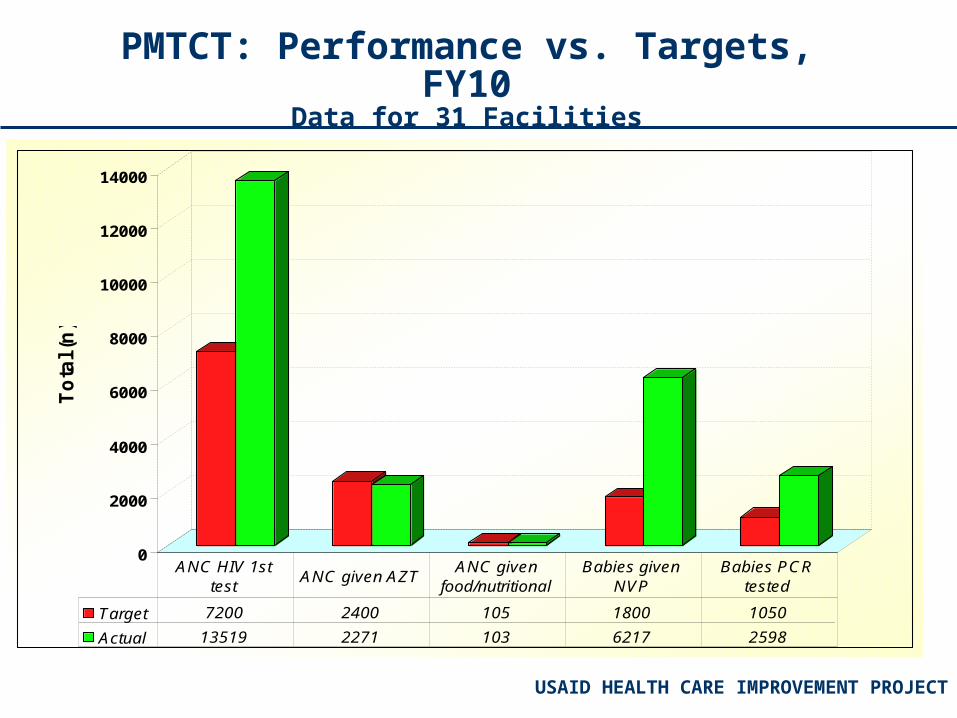
PMTCT: Performance vs. Targets, FY10Data for 31 Facilities
0
2000
4000
6000
8000
10000
12000
14000
To
tal (n
)
Target 7200 2400 105 1800 1050
Actual 13519 2271 103 6217 2598
ANC HIV 1st test
ANC given AZTANC given
food/nutritional Babies given
NVPBabies PCR
tested
USAID HEALTH CARE IMPROVEMENT PROJECT
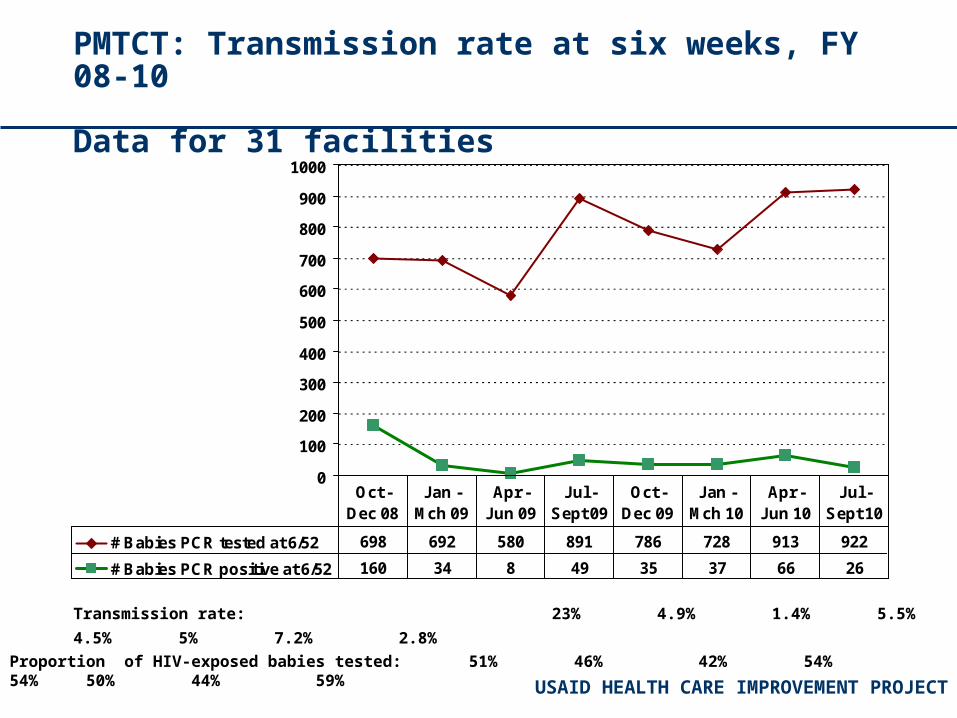
PMTCT: Transmission rate at six weeks, FY 08-10
Data for 31 facilities
0
100
200
300
400
500
600
700
800
900
1000
# Babies PCR tested at 6/52 698 692 580 891 786 728 913 922
# Babies PCR positive at 6/52 160 34 8 49 35 37 66 26
Oct - Dec 08
Jan - Mch 09
Apr - Jun 09
Jul - Sept 09
Oct - Dec 09
Jan - Mch 10
Apr - Jun 10
Jul - Sept 10
Transmission rate: 23% 4.9% 1.4% 5.5% 4.5% 5% 7.2% 2.8%
Proportion of HIV-exposed babies tested: 51% 46% 42% 54% 54% 50% 44% 59%
USAID HEALTH CARE IMPROVEMENT PROJECT
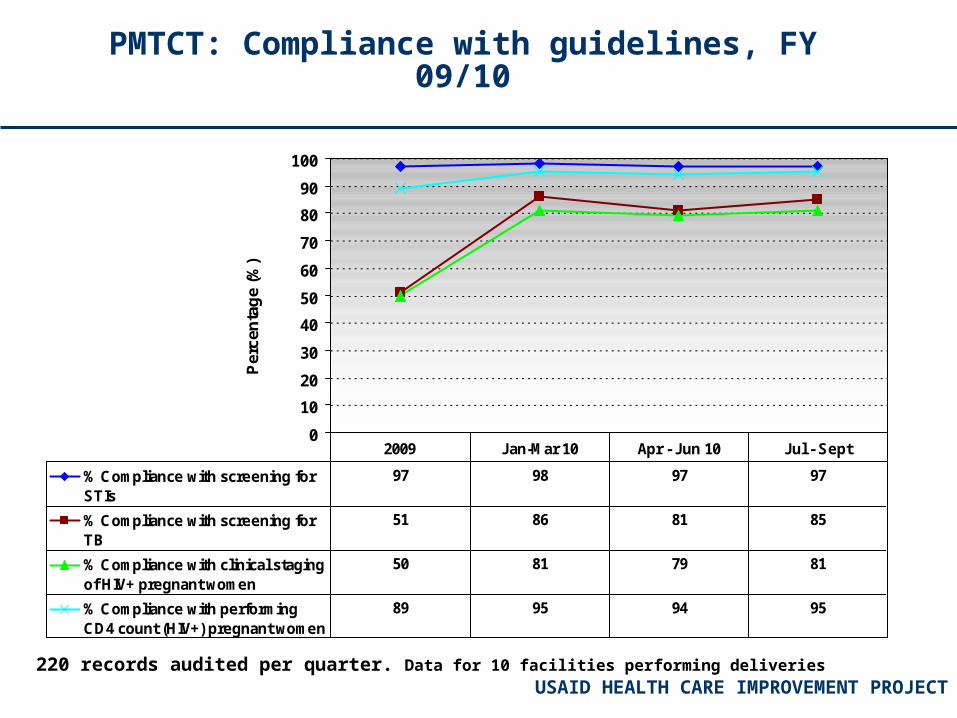
PMTCT: Compliance with guidelines, FY 09/10
0
10
20
30
40
50
60
70
80
90
100
Per
cen
tag
e (%
)
% Compliance with screening forSTIs
97 98 97 97
% Compliance with screening forTB
51 86 81 85
% Compliance with clinical stagingof HIV+ pregnant women
50 81 79 81
% Compliance with performingCD4 count (HIV+) pregnant women
89 95 94 95
2009 Jan-Mar 10 Apr - Jun 10 Jul - Sept
220 records audited per quarter. Data for 10 facilities performing deliveries
USAID HEALTH CARE IMPROVEMENT PROJECT
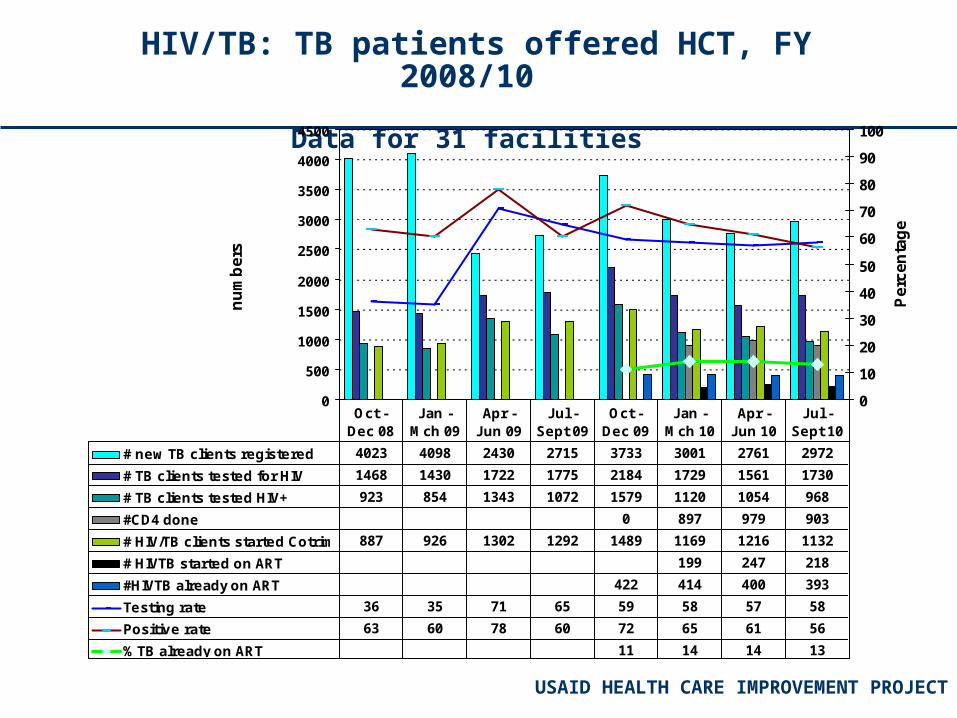
HIV/TB: TB patients offered HCT, FY 2008/10
Data for 31 facilities
0
500
1000
1500
2000
2500
3000
3500
4000
4500
nu
mb
ers
0
10
20
30
40
50
60
70
80
90
100
Pe
rce
nta
ge
# new TB clients registered 4023 4098 2430 2715 3733 3001 2761 2972
# TB clients tested for HIV 1468 1430 1722 1775 2184 1729 1561 1730
# TB clients tested HIV+ 923 854 1343 1072 1579 1120 1054 968
#CD4 done 0 897 979 903
# HIV/TB clients started Cotrim 887 926 1302 1292 1489 1169 1216 1132
# HIVTB started on ART 199 247 218
#HIVTB already on ART 422 414 400 393
Testing rate 36 35 71 65 59 58 57 58
Positive rate 63 60 78 60 72 65 61 56
% TB already on ART 11 14 14 13
Oct - Dec 08
Jan - Mch 09
Apr - Jun 09
Jul -Sept 09
Oct - Dec 09
Jan - Mch 10
Apr - Jun 10
Jul - Sept 10
USAID HEALTH CARE IMPROVEMENT PROJECT
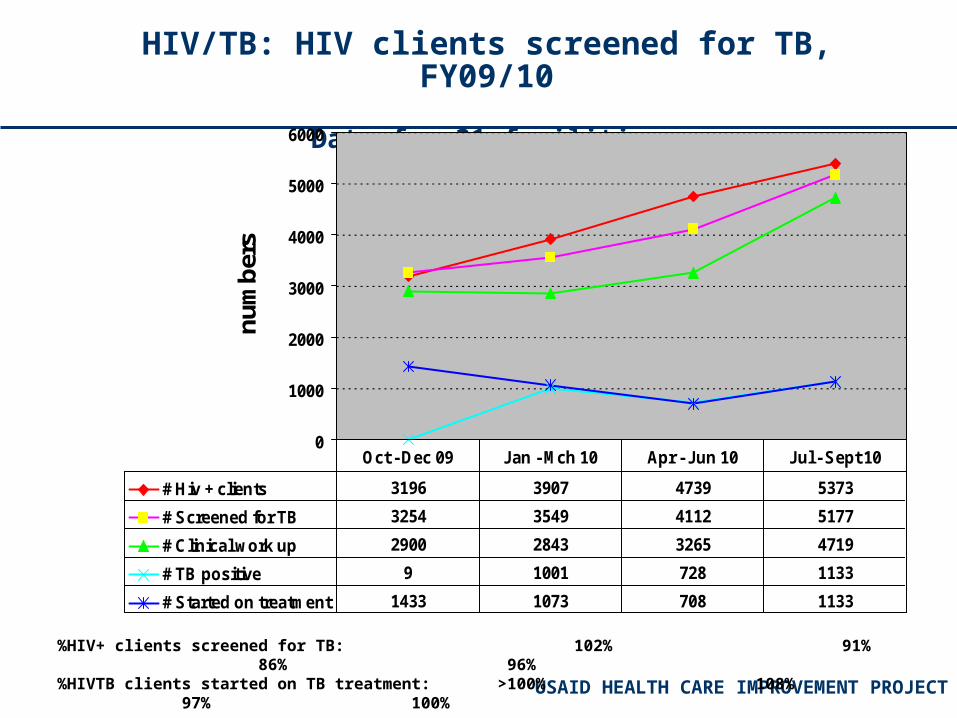
HIV/TB: HIV clients screened for TB, FY09/10
Data for 31 facilities
0
1000
2000
3000
4000
5000
6000
nu
mb
ers
# Hiv + clients 3196 3907 4739 5373
# Screened for TB 3254 3549 4112 5177
# Clinical work up 2900 2843 3265 4719
# TB positive 9 1001 728 1133
# Started on treatment 1433 1073 708 1133
Oct - Dec 09 Jan - Mch 10 Apr - Jun 10 Jul - Sept 10
%HIV+ clients screened for TB: 102% 91% 86% 96%%HIVTB clients started on TB treatment: >100% 108% 97% 100%
USAID HEALTH CARE IMPROVEMENT PROJECT
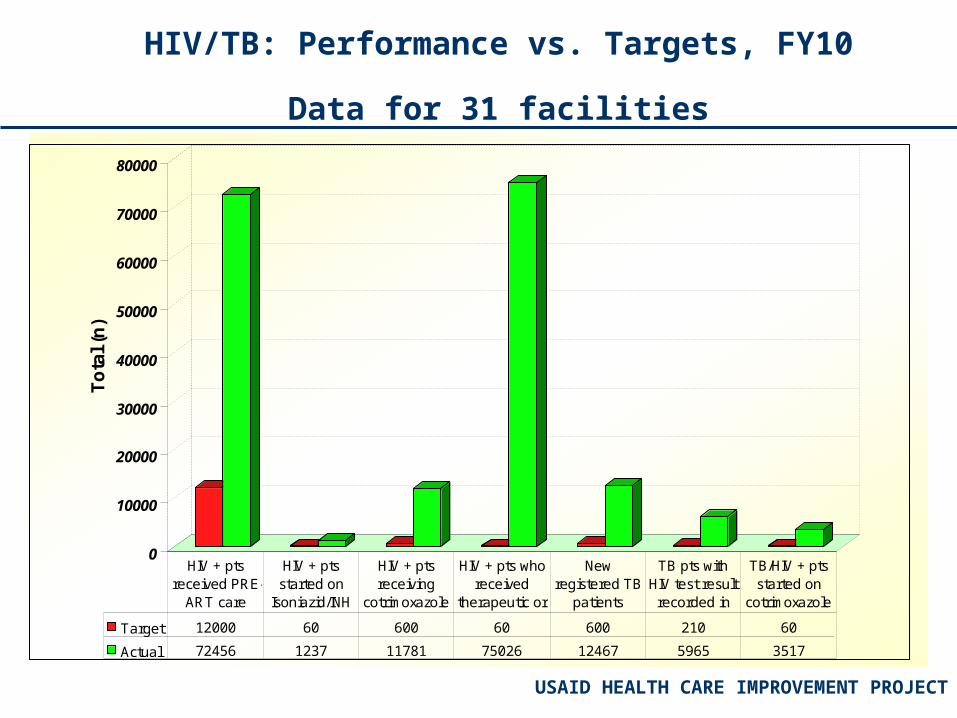
HIV/TB: Performance vs. Targets, FY10
Data for 31 facilities
0
10000
20000
30000
40000
50000
60000
70000
80000
To
tal (
n)
Target 12000 60 600 60 600 210 60
Actual 72456 1237 11781 75026 12467 5965 3517
HIV + pts received PRE-
ART care
HIV + pts started on
Isoniazid/INH
HIV + pts receiving
cotrimoxazole
HIV + pts who received
therapeutic or
New registered TB
patients
TB pts with HIV test result
recorded in
TB/HIV + pts started on
cotrimoxazole
USAID HEALTH CARE IMPROVEMENT PROJECT
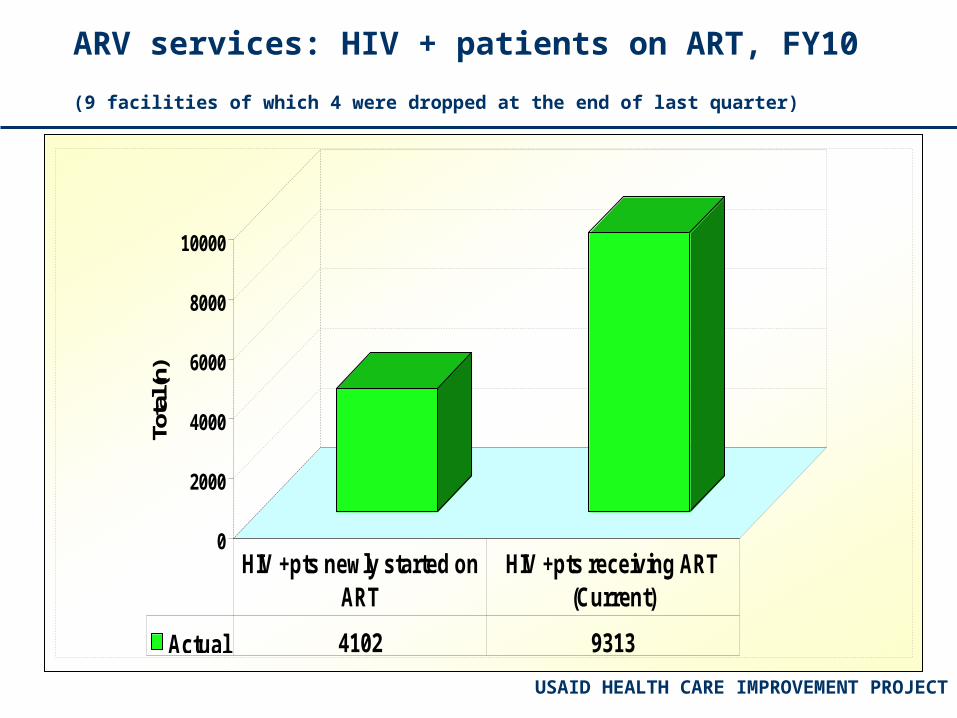
ARV services: HIV + patients on ART, FY10
(9 facilities of which 4 were dropped at the end of last quarter)
0
2000
4000
6000
8000
10000
Tota
l (n)
Actual 4102 9313
HIV +pts newly started on ART
HIV +pts receiving ART (Current)
USAID HEALTH CARE IMPROVEMENT PROJECT
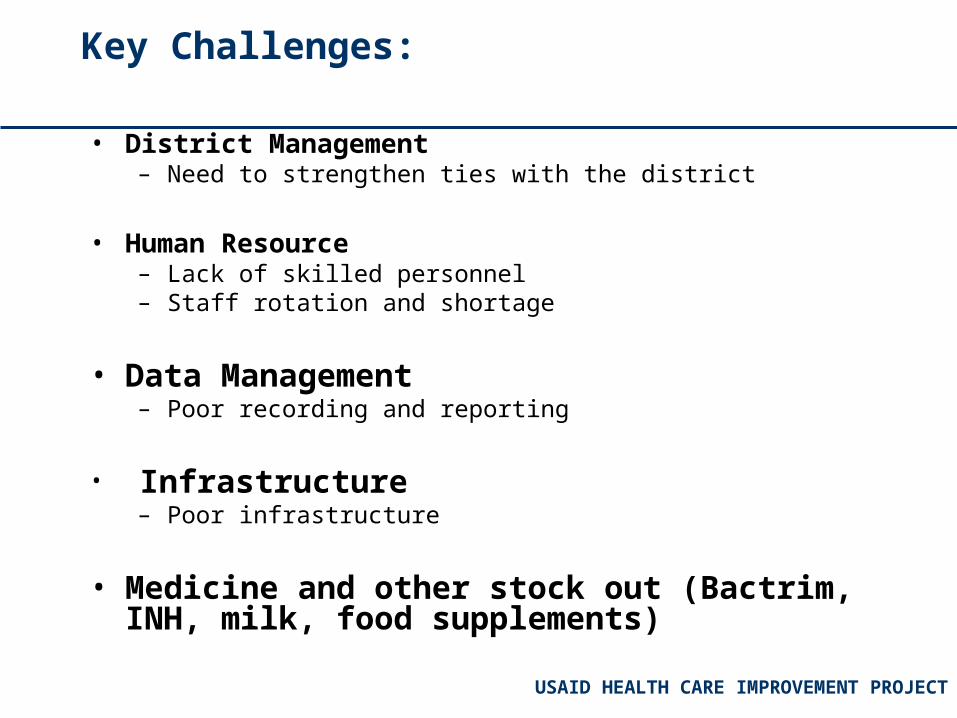
Key Challenges:
• District Management– Need to strengthen ties with the district
• Human Resource– Lack of skilled personnel– Staff rotation and shortage
• Data Management– Poor recording and reporting
• Infrastructure– Poor infrastructure
• Medicine and other stock out (Bactrim, INH, milk, food supplements)
USAID HEALTH CARE IMPROVEMENT PROJECT
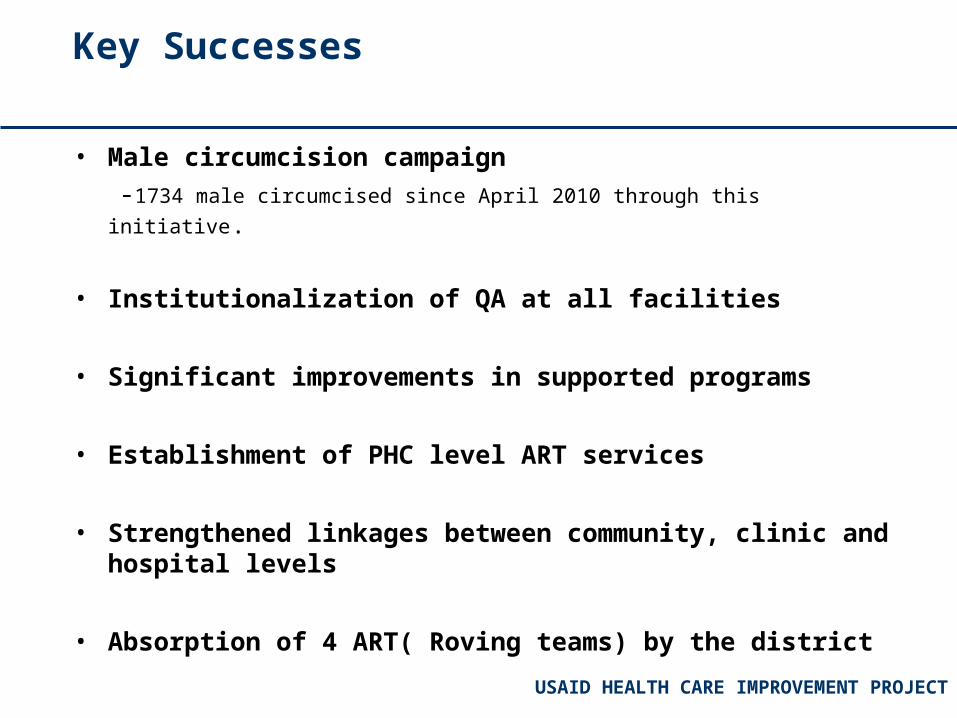
Key Successes
• Male circumcision campaign
-1734 male circumcised since April 2010 through this initiative.
• Institutionalization of QA at all facilities
• Significant improvements in supported programs
• Establishment of PHC level ART services
• Strengthened linkages between community, clinic and hospital levels
• Absorption of 4 ART( Roving teams) by the district
USAID HEALTH CARE IMPROVEMENT PROJECT
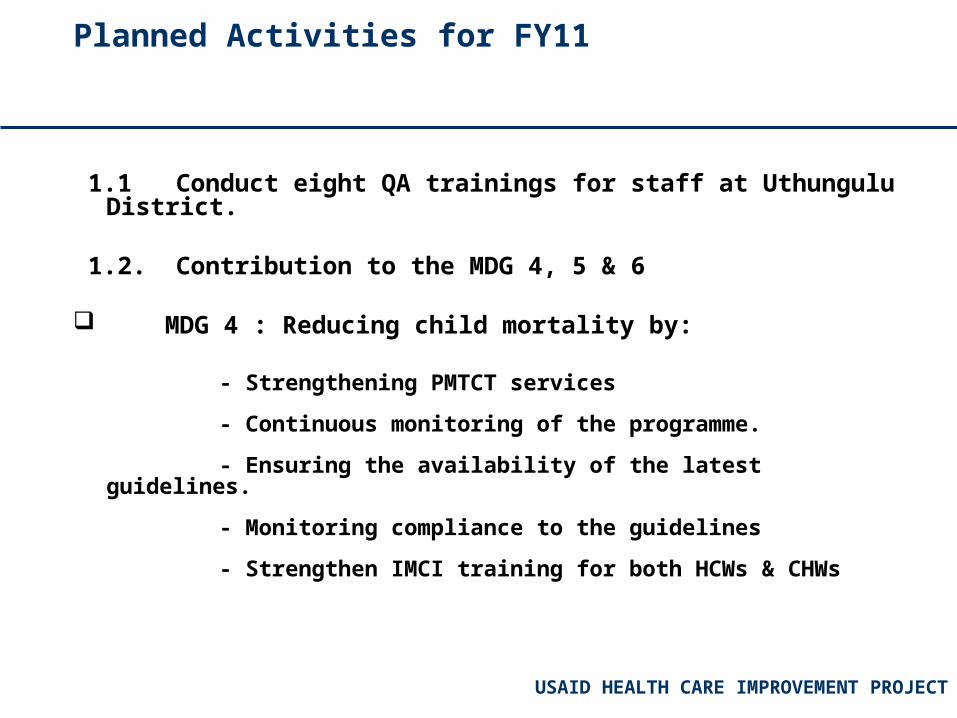
Planned Activities for FY11
1.1 Conduct eight QA trainings for staff at Uthungulu District.
1.2. Contribution to the MDG 4, 5 & 6
MDG 4 : Reducing child mortality by:
- Strengthening PMTCT services
- Continuous monitoring of the programme.
- Ensuring the availability of the latest guidelines.
- Monitoring compliance to the guidelines
- Strengthen IMCI training for both HCWs & CHWs
USAID HEALTH CARE IMPROVEMENT PROJECT
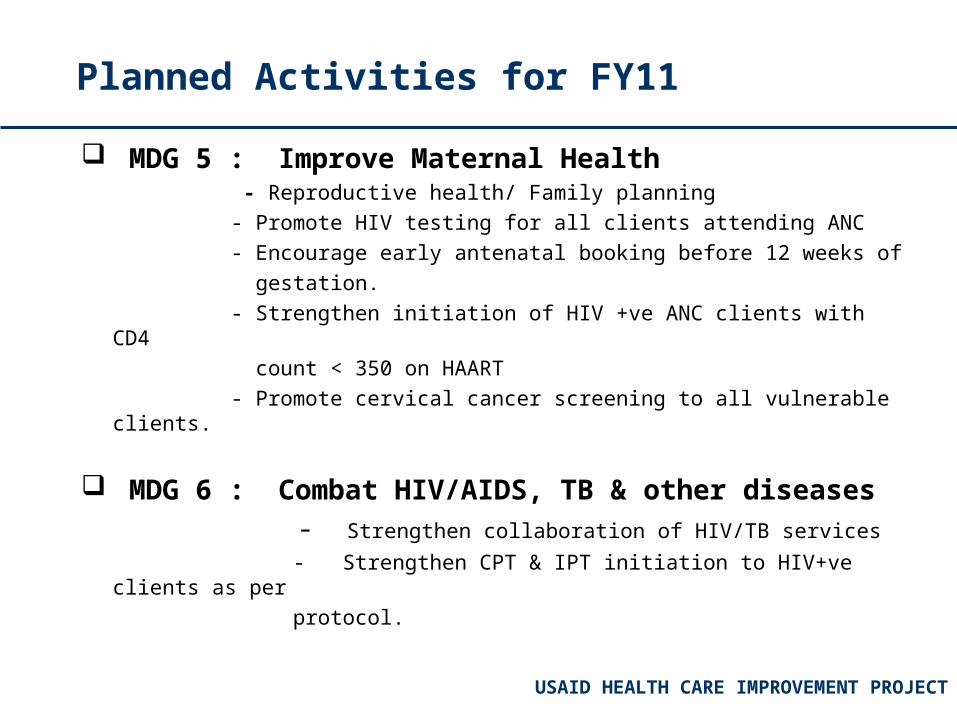
MDG 5 : Improve Maternal Health - Reproductive health/ Family planning
- Promote HIV testing for all clients attending ANC
- Encourage early antenatal booking before 12 weeks of
gestation.
- Strengthen initiation of HIV +ve ANC clients with CD4
count < 350 on HAART
- Promote cervical cancer screening to all vulnerable clients.
MDG 6 : Combat HIV/AIDS, TB & other diseases - Strengthen collaboration of HIV/TB services
- Strengthen CPT & IPT initiation to HIV+ve clients as per
protocol.
Planned Activities for FY11
USAID HEALTH CARE IMPROVEMENT PROJECT
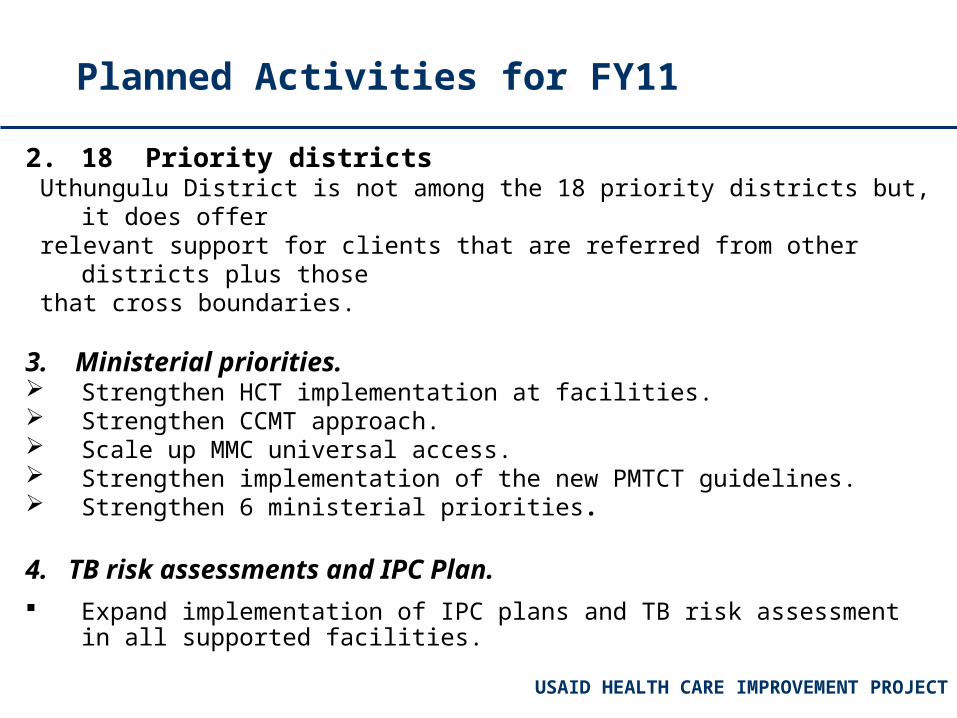
2. 18 Priority districts Uthungulu District is not among the 18 priority districts but, it does offer relevant support for clients that are referred from other districts plus those that cross boundaries.
3. Ministerial priorities. Strengthen HCT implementation at facilities. Strengthen CCMT approach. Scale up MMC universal access. Strengthen implementation of the new PMTCT guidelines. Strengthen 6 ministerial priorities.
4. TB risk assessments and IPC Plan.
Expand implementation of IPC plans and TB risk assessment in all supported facilities.
Planned Activities for FY11
23
Thank you