Embed Size (px)
Citation preview
KTC-00-2
Pavement Design Evaluations I-275 Boone and Kenton Counties
MP 1.05 - 7.15
by
R. Clark Graves, P.E., P.G. Transportation Research Engineer
and
David L. Allen, P.E., P.G. Transportation Research Engineer
Kentucky Transportation Center College of Engineering University of Kentucky Lexington, Kentucky
The contents of this report reflect the views of the authors who are responsible for the facts and accuracy of the data presented herein. The contents do not necessarily reflect the official views or policies of the University of Kentucky. This report does not constitute a standard, specification, or regulation. The inclusion of manufacturer names and trade names are for identification purposes and are not to be considered as endorsements.
May2000
INTRODUCTION
Interstate 275 in Boone and Kenton Counties (MP 1.05 - 7 .15) has been in service for more than 20 years. The eastbound lanes from MP 1.05 - 4.07 was rehabilitated byrubblization of the existing continuously reinforced concrete pavement, the addition of an open-graded drainage layer and a 9-inch PCC overlay in 1991 . The remaining sections have been broken down into two rehabilitation projects as follows:
Section 1 I - 275, Boone/Kenton Counties Kentucky Eastbound from MP 1.05 - 4.06 3 - lanes Original Construction--1973 11" Jointed Reinforced Concrete Pavement over 6" of Dense-Graded Aggregate Base MP 1.99 - 4.06
56,000 AADT, 11.5% Trucks 14,603,000 ESALs for 20 years
MP 1.05 - 1.99 76,000 AADT, 11.5% Trucks 21,400,000 ESALs for 20 years
Section 2 I-275, Boone County, Kentucky East and Westbound MP 4.06 - 7 .15 3-lanes Original Construction--1977 11" Jointed Reinforced Concrete Pavement over 6" of Dense-Graded Aggregate Base 47,000 AADT, 11.5% Trucks 10, 700,000 ESALs for 20 years
REHABILITATION ALTERNATIVES
Two rehabilitation alternatives were evaluated for each of the previously mentioned sections. Alternate 1 would break and seat the existing concrete pavement with an application of an asphaltic concrete overlay. Alternate 2 would involve overlaying the existing concrete pavement with a opengraded bond breaker material and then apply a unbonded concrete overlay. The thickness designs were determined based on a design CBR of3 .0 which was used on the previous rehabilitation in the westbound lanes of Section 1.
To allow for the comparison ofboth the concrete and asphalt alternatives, a 40- year structural design of the pavement was evaluated. Due to the difficulties of forecasting traffic for a 40-year period, the 20-year ESALs were doubled to obtain a 40-year ESAL estimate.
2
Asphalt Alternative
Thickness designs were developed using the 1993 AASHTO Guide for Design of Pavement Structures and the procedures outlined in Research Report KTRP 87-29 "Pavement Designs Based on Work". The following design parameters were utilized for each design procedure.
Ky Procedure UKTRP Report 87-29
Broken Concrete Modulus- 25, 100, and 250 ksi Subgrade CBR- 3.0
1993 AASHTO Procedure
Broken Concrete Layer Coefficient- 0.18 and 0.21 Asphalt Surface Layer Coefficient - 0.44 Asphalt Base Layer Coefficient - 0.40 Effective Layer Coefficient of Existing DGA- 0.10 Initial Serviceability- 4.5 Terminal Serviceability- 3.0 Overall Deviation - 0.49 Reliability- 95% Subgrade CBR- 3.0, ~ = 4,500
Using these parameters, thickness designs have been developed for design ESALs from 10,000,000-50,000,000. The thickness designs for Section 1 (MP 1.05 - 4.06) are given in Figure 1. The designs for Section 2 (MP 4.06 - 7.15) are given in Figure 2.
3

1-275 Pavement Design AC Over Broken and Seated Concrete, MP 1.05 - 4.06
15
13
~ ~ 12 > 0 (.) <{ 11 "O ~ ·5 r::,- 10 Q)
a:
9
8
7
- Ky Procedure, 100 ksi Broken PCC Modulus .... v- · · · AASHTO Procedure, Layer Coeff 0.21 - KY Procedure, 25 KS! Broken PCC Modlus --0- Ky Procedure, 200 KSI Broken PCC Modulus . . , · 1' · · · AASHTO Procedure, Layer Coefficient 0.18
...
" i ~ !
2s1<s1 Rubbiized pee Pavem•
AAS HTO De ,lgn p.,, m,ter1, AC O ver Broken ind S11t1d PC lnltJalServlcu b lllty-, .5
1e+007
;: !il
2e+007
Term lnal Servlcublllty - 3.0 Overall Devlallon - 0 .49 Rehblllty- 95% Subgrade CSR - 3 L 1ye rCo elflclent1
Surrace, 1.25· o 0 .44 Ba11 , urlable thtckneu O 0 .40
E lleclfve Layer Coelllct1n 1 al Broken Concreta - 0 .21 Elie cllve Layer Coa lllclan I ol E xllttno O GA - O. 1 o
3e+007 4e+007 5e+007 Design ESAL.s
6e+007
Figure 1 Asphalt Pavement Design, MP 1.05 - 4.06
1-275 Pavement Design AC Over Broken and Seated Concrete, MP 4.06 - 7.15
15
14
13
~ j 12 0 (.)
<I: 11 ~ ·5 g 10 a:
9
8
7
__._ .. . ·V- . . . ----0-... .... ...
~ § I ... ~ ~ ~ " 0..
"!'
~ w ;: !il
Ky Procedure, 100 ksi Broken PCC Modulus AASHTO Procedure, Layer Coefficient 0.21 KY Procedure , 25 KSI Broken PCC Modlus Ky Procedure, 200 KS! Broken PCC Modulus AASHTO Procedure, Layer Coefficient 0.18
'IJ'
r:r
I i
~ \ized PCC
Pavemen~ 25 \<SI
pCC.'~\(S\
7
§ of
AASHTO D11l9n Parem1t1n ,AC Ovu Broken end S11t1d PC tnltlal S11vlceeblllly- 4 .5
~ Term Ina I Sarvlcaa blll ty - 3.0 OverallOulallon - 0 .49 Re llablllty - 95,r. Subgrade CB R - 3 LayerC011Hclen11
Surlaca, 1.25' 0 o.u BH1 , varlablt lhlckne11 o o .•o
E llectl11e Layer Coe l llcle nl o I Bro ken Concrete - 0 .21 E lfeclin Layer Coemclant of Eicllllng DGA - 0 . 10
1e+007 2e+007 3e+007 4e+007 5e+007 6e+007 Design ESAL.s
Figure 2 Asphalt Pavement Design MP 4.06 - 7.15 4

Based on this analysis, a design thickness of 13 inches of asphaltic concrete over a broken and seated PCC pavement would be recommended for Section 1, and 12 inches of asphaltic concrete would be recommended for Section 2.
PCC Alternative
Thickness designs were developed utilizing the Kentucky PCC Pavement Design Catalog and the 1993 AASHTO procedure. To determine the thickness of the required overlay, two parameters must be determined. First, the thickness of new pavement which would be required based on the design traffic and existing sub grade conditions is determined. In addition, the effective thickness of the existing PCC pavement structure must be determined. Once these two parameters are determined the thickness of the required unbonded PCC overlay can be determined using the flowing equation:
Doverlay = ~ D 2 future - D 2
effective (1)
Where: D overlay = required unbonded overlay thickness, Dfi,ture = required PCC thickness of existing conditions, D effective = effective thickness of the existing PCC pavement based on condition.
To determine the effective thickness of the existing pavement, the actual pavement thickness is reduced based on the estimated remaining life of the pavement structure. A condition factor is determined based on Figure 5.2 in the 1993 AASHTO Guide. The actual pavement thickness, up to 10 inches, is multiplied by the condition factor obtained from the Guide based on an estimated remaining life. For this pavement structure, an estimated remaining life of 50% was chosen, this yields ad condition factor of 0.89. Therefore, the effective thickness of the existing pavement structure would be 10 multiplied by 0.89, which yields 8.9 inches. This value was used to determine the required overlay thickness using equation (1) and the future required thickness determined from both the Kentucky and AASHTO methods.
Kentucky Procedure
Subgrade CBR = 3, effective k = 100
1993 AASHTO Procedure PCC Modulus of Rupture - 600 psi PCC Modulus of Elasticity- 3,500,000 psi Load Transfer Coefficient - 2. 7 Overall Deviation - 0.39 Reliability- 95% Initial Serviceability - 4.5 Terminal Serviceability- 3.0 Modulus of Sub grade Reaction - 100 pci
5

Example:
Existing Pavement Thickness - 11 inches Estimated Remaining Life - 50% Condition Factor~ 0.89, Figure 5.2, 1993 AASHTO Guide Required Pavement Thickness for Future Traffic- 12.8"
Effective Pavement Thickness = 0.89 x 10 = 8.9"
Doverlay = ~12.82 - 8.9 2 9.2"
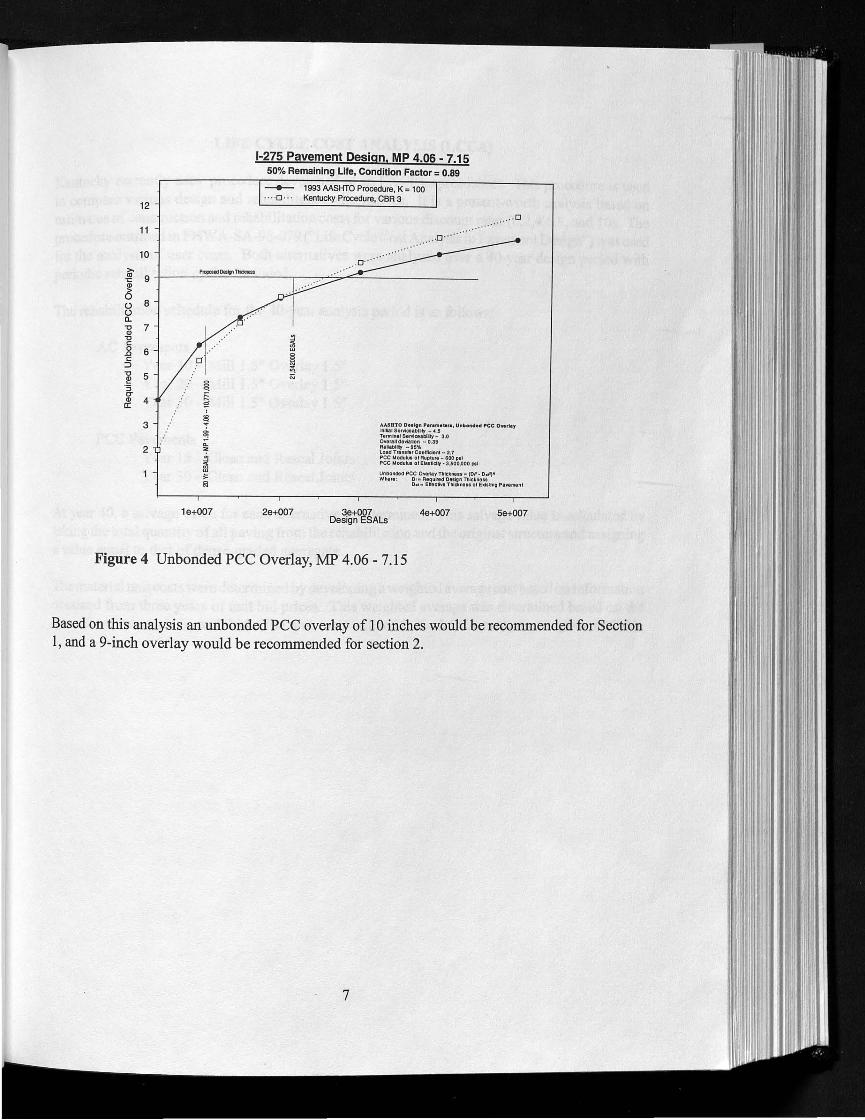
Using these parameters, thickness designs have been developed for design ESALs from 10,000,000-50,000,000. The thickness designs for Section 1 (MP 1.05 - 4.06) are given in Figure 3. The designs for Section 2 (MP 4.06 - 7.15) are given in Figure 4.
12
11
10 >,
.!!! 9 ai > 0 0 8 0 a.. " 7 Q)
" c:: 0 6 .0 c::
::::>
" 5 2? ·5 0-Q) 4 a:
3
2
1e+007
I
~ .;
! 0..
~ ~ "' w ::: ~
1-275 Pavement Design. MP 1.05 - 4.06 50% Remaining Life, Condition Factor= 0.89
2e+007
- 1993 AASHTO Procedure, K = 100 · · · ·D · · · Kentucky Procedure, CBR 3
... .o
AASJITO Design Par1meter1, Unbonded PCC Overlay Initial Servlceabllty - 4.S Tarm lnal ServlceablNty- 3.0 Overall deviation •• 0.39 Re Debility •• 95% Load TranslarCoefflclant-2.7 PCC Modulus ol Rupture - 600 psi PCC Modulus ol Elastlclty • 3,500,000 psi
Unbonded PCC Overlay Thickness = (D~ • o.,1) .. Where: o, • Required Design Thickness
o., ,. Ellectlve Thickness ol Existing Pavemen1
3e+007 Design ESALs
4e+007 5e+007
Figure 3 Unbonded PCC Overlay, MP 1.05 - 4.06
6
12
11
10
~ 9 .::: Q)
> 0 (.) 8 (.) a. "O 7 I Q) "O c
..aJ···· 0 6 .0 c
:::)
"O 5 ~ g ·5 CT § Q) 4 a:
I
3 ~ 81
2 0.
"' ~ ~ .i
1e+007
1-275 Pavement Design, MP 4.06 - 7.15 50% Remaining Life, Condition Factor = 0.89
- 1993AASHTO Procedure, K = 100 · · · ·D · · · Kentucky Procedure, CBR 3
..... o
AASBTO DHJgn Par•m•ter1 , Unbonded PCC Ovu lar 1ntblS•fVlcubl1t1-•-'
2e+007
T1rmln11 SeMceabl lity- 3.0 Overallderilllon - 0.39 Alllabllly -95% Lo1d Tt1n1Jer Coelflcle nt-2 .1 PCC Mocluktt ol Rupture - 600 p1I PCC Moclulul ol El11Uclf'/•3,.500,000 psi
Unbondect PCC Owrlay ThlcknH,. (O,t . Ow)• Where : 01• Required D11lgn Thlckne11
o . , . Ellecllve Thlcli:ne11 ol Eld1llno Paveme nt
3e+007 Design ESALs
4e+007 5e+007
Figure 4 Unbonded PCC Overlay, MP 4.06 - 7.15
Based on this analysis an unbonded PCC overlay of 10 inches would be recommended for Section 1, and a 9-inch overlay would be recommended for section 2.
7
LIFE CYCLE COST ANALYSIS (LCCA)
Kentucky currently uses procedure developed in an EXCEL spreadsheet. This procedure is used to compare various design and rehabilitation alternatives. It is a present-worth analysis based on estimates of construction an,d rehabilitation costs for various discount rates (0,2,4,6,8, and 1 O). The procedure outlined in FHW A-SA-98-079 ("Life Cycle Cost Analysis in Pavement Design") was used for the analysis of user costs. Both alternatives were analyzed over a 40-year design period with periodic rehabilitation cycles included.
The rehabilitation schedule for the 40-year analysis period is as follows:
AC Pavements Year 10 - Mill 1.5" Overlay 1.5" Year 20 - Mill 1.5" Overlay 1.5" Year 30-Mill 1.5" Overlay 1.5"
PCC Pavements Year 15 - Clean and Reseal Joints Year 30- Clean and Reseal Joints
At year 40, a salvage value for each alternative is determined. This salvage value is calculated by taldng the total quantity of all paving from the rehabilitation and the original structure and assigning a value equal to that of dense-graded aggregate.
The material unit costs were determined by developing a weighted average cost based on information obtained from three years of unit bid prices. This weighted average was determined based on the quantity of materials in each bid. The unit costs utilized in the LCCA analysis are given in Table 1.
8 ·
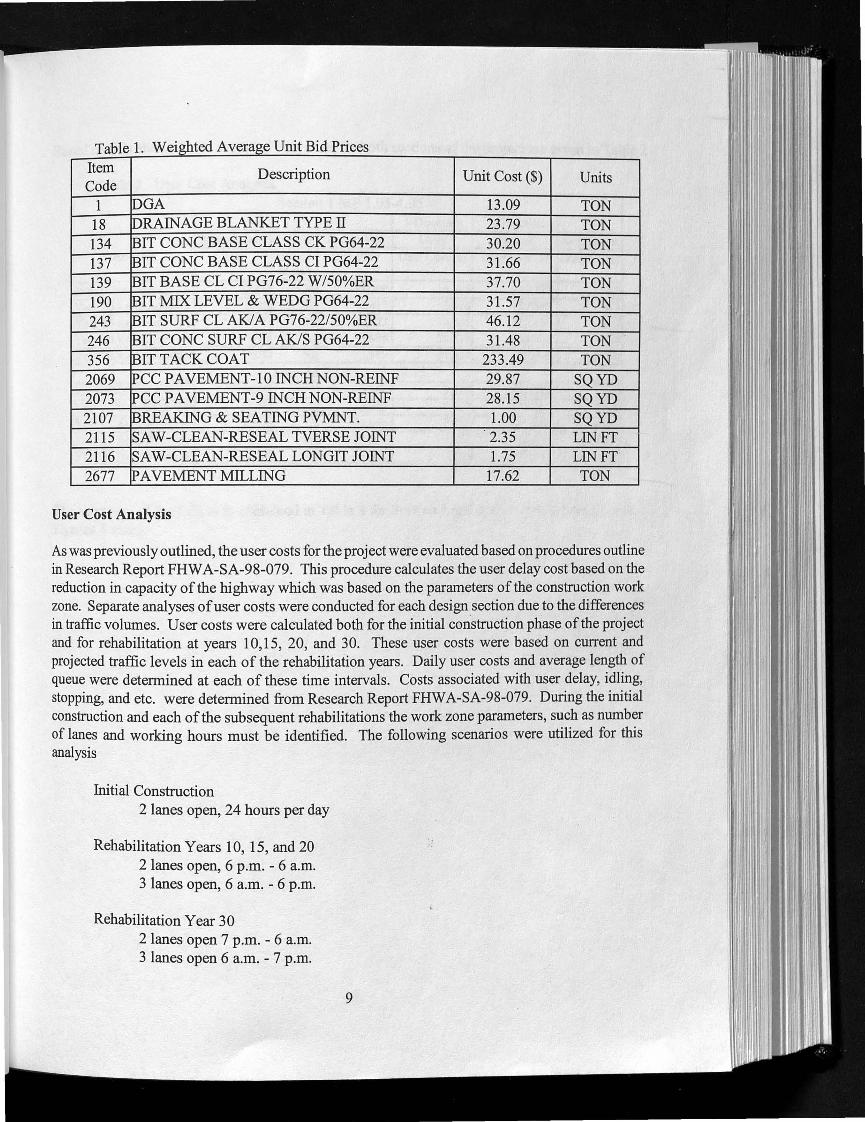
Table 1. Weighted Average Unit Bid Prices
Item Description Unit Cost ($) Units Code
1 OC)GA 13.09 TON 18 DRAINAGE BLANKET TYPE II 23.79 TON 134 BIT CONC BASE CLASS CK PG64-22 30.20 TON 137 BIT CONC BASE CLASS CI PG64-22 31.66 TON 139 BIT BASE CL CI PG76-22 W/50%ER 37.70 TON 190 BIT MIX LEVEL & WEDG PG64-22 31.57 TON 243 BIT SURF CL AK/A PG76-22/50%ER 46.12 TON 246 BIT CONC SURF CL AK/S PG64-22 31.48 TON 356 BIT TACK COAT 233.49 TON 2069 DCC PAVEMENT-10 INCH NON-REINF 29.87 SQYD 2073 PCC PAVEMENT-9 INCHNON-REINF 28.15 SQYD 2107 BREAKING & SEATING PVMNT. 1.00 SQYD 2115 SAW-CLEAN-RESEAL TVERSE JOINT 2.35 LIN FT 2116 SAW-CLEAN-RESEAL LONGIT JOINT 1.75 LIN FT 2677 PAVEMENT MILLING 17.62 TON
User Cost Analysis
As was previously outlined, the user costs for the project were evaluated based on procedures outline in Research Report FHW A-SA-98-079. This procedure calculates the user delay cost based on the reduction in capacity of the highway which was based on the parameters of the construction work zone. Separate analyses of user costs were conducted for each design section due to the differences in traffic volumes. User costs were calculated both for the initial construction phase of the project and for rehabilitation at years 10,15, 20, and 30. These user costs were based on current and projected traffic levels in each of the rehabilitation years. Daily user costs and average length of queue were determined at each of these time intervals. Costs associated with user delay, idling, stopping, and etc. were determined from Research Report FHW A-SA-98-079. During the initial construction and each of the subsequent rehabilitations the work zone parameters, such as number of lanes and working homs must be identified. The following scenarios were utilized for this analysis
Initial Construction 2 lanes open, 24 hours per day
Rehabilitation Years 10, 15, and 20 2 lanes open, 6 p.m. - 6 a.m. 3 lanes open, 6 a.m. - 6 p.m.
Rehabilitation Year 30 2 lanes open 7 p.m. - 6 a.m. 3 lanes open 6 a.m. - 7 p.m.
9

Based on this analysis, the expected user costs for both sections of the project are given in Table 2
12U C Anl. Tab e ser ost aLys1s Section 1 MP 1.05-4.06
1-Direction 1-Direction Improvement Project Traffic Vol. Daily Project Avg. Queue
Activity Year Length One Way User Cost($) User Cost($) Length (mi) (days)
Initial Construciton 2000 120 43,000 16,186 1,942,377 0.8 Year 10 Rehabilitation 2010 30 52,417 5,318 159,547 0.3 Year 15 Rehabilitation 2015 30 57,872 10,463 313,888 0.7 Year 20 Rehabilitation 2020 30 63,896 28,518 855,533 1.8 Year 30 Rehabilitation 2030 30 77,889 27,634 829,006 1.0
Section 2 MP 4.06 - 7.15 Initial Construction 2000 120 26,500 5,179 621 ,504 0.0 Year 10 Rehabilitation 2010 30 32,303 5,867 176,018 0.0 Year 15 Rehabilitation 2015 30 35,666 2,853 85,604 0.0 Year 20 Rehabilitation 2020 30 39,378 3,150 94,514 0.0 Year 30 Rehabilitation 2030 30 48,001 2,445 73,343 0.0
The summary of the LCCA is contained in Table 3 for Section 1 and Table 4 for Section 2 and in Figures 5 and 6
10
.......
.......
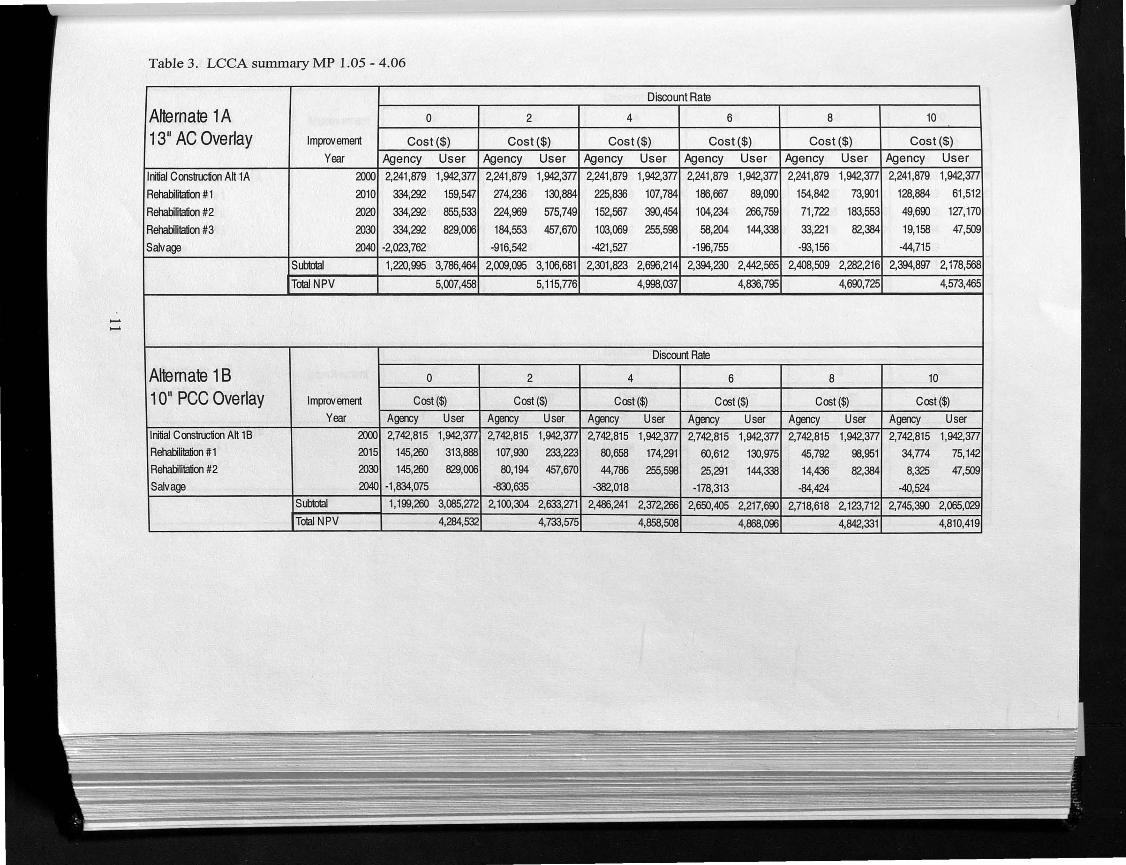
Table 3. LCCA summary MP 1.05 - 4.06
Alternate 1 A 0
13 11 AC Overlay Improvement Cost($)
Year Agency User
Initial Construction Alt 1A 2000 2,241 ,879 1,942,377
Rehabilitation # 1 2010 334,292 159,547
Rehabilitation #2 2020 334,292 855,533
Rehabilitation #3 2030 334,292 829,006
Salvage 2040 ·2,023,762
Subtctal 1,220,995 3,786,464
To1al NPV 5,007,458
Alternate 1 B 0
1011 PCC Overlay Improvement Cost($)
Year Agency User
Initial Construction Alt 18 2000 2,742,815 1,942,377
Rehabilitation # 1 2015 145,260 313,888
Rehabilitation #2 2030 145,260 829,006
Salvage 2040 ·1 ,834,075
Subtctal 1, 199,260 3,085,272
To1al NPV 4,284,532
2
Cost($)
Agency User
2,241,879 1,942,377
274,236 130,884
224,969 575,749
184,553 457,670
·916,542
2,009,095 3, 106,681
5, 115,776
2
Cost($)
Agency User
2,742,815 1,942,377
107,930 233,223
80,194 457,670
-830,635
2,100.~ 2,633,271
4,733,575
Discount Rate
4 6 8 10
Cost($) Cost($) Cost($) Cost($)
Agency User Agency User Agency User Agency User
2,241,879 1,942,377 2,241,879 1,942,377 2,241,879 1,942,377 2,241,879 1,942,377
225,836 107,784 186,667 89,090 154,842 73,901 128,884 61 ,512
152,567 390,454 104,234 266,759 71,722 183,553 49,690 127,170
103,069 255,598 58,204 144,338 33,221 82,384 19,158 47,509
-421 ,527 ·196,755 ·93,156 -44,715
2,301,823 2,696,214 2,394,230 2,442,565 2,408,509 2,282,216 2,394,897 2, 178,568
4,998,037 4,836,795 4,690,725 4,573,465
Discount Rate
4 6 8 10
Cost($) Cost($) Cost($) Cost($)
Agency User Agency User Agency User Agency User
2,742,815 1,942,377 2,742,815 1,942,377 2,742,815 1,942,377 2,742,815 1,942,377
80,658 174,291 60,612 130,975 45,792 98,951 34,774 75,142
44,786 255,598 25,291 144,338 14,436 ~.384 8,325 47,509
·382,018 ·178,313 ·84,424 -40,524 2,486,241 2,372,266 2,650,405 2,217,690 2,718,618 2,123,712 2,745,390 2,065,029
4,858,508 4,868,096 4,842,331 4,810,419
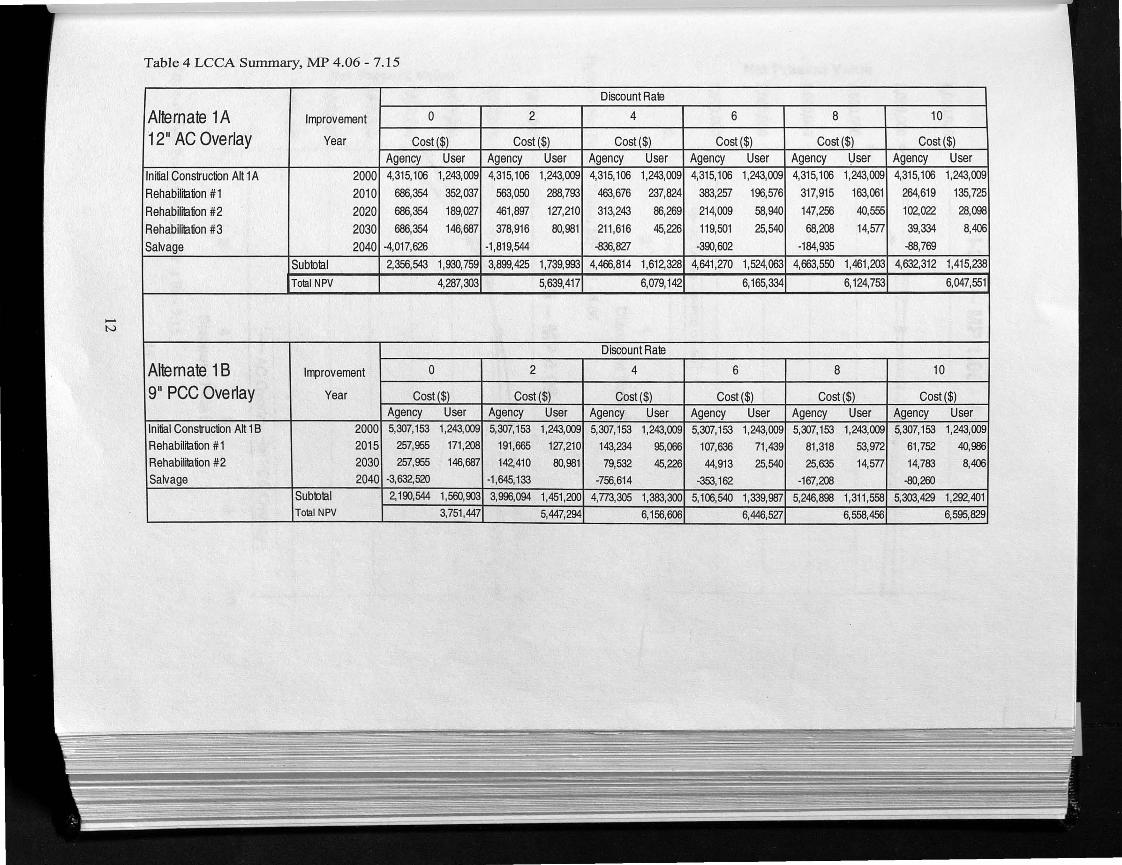
Table 4 LCCA Summary, MP 4.06 - 7.15
Discount Rate
Alternate 1A Improvement 0 2 4 6 8 10
1211 AC Overlay Year Cost($) Cost($) Cost($) Cost($) Cost($) Cost($) Agency User Agency User Agency User Agency User Agency User Agency User
Initial Construction Alt 1 A 2000 4,315,106 1,243,009 4,315,106 1,243,009 4,315, 106 1,243,009 4,315, 106 1,243,009 4,315,106 1,243,009 4,315,106 1,243,009
Rehabilitation # 1 2010 686,354 352,037 563,050 288,793 463,676 237,824 383,257 196,576 317,915 163,061 264,619 135,725
Rehabilitation #2 2020 686,354 189,027 461,897 127,210 313,243 86,269 214,009 58,940 147,256 40,555 102,022 28,098
Rehabilitation #3 2030 686,354 146,687 378,916 80,981 211 ,616 45,226 119,501 25,540 68,208 14,577 39,334 8,406
Salvage 2040 -4,017,626 -1,819,544 -836,827 -300,602 -184,935 -88,769
Sub1D1al 2,356,543 1,930,759 3,899,425 1,739,993 4,466,814 1,612,328 4,641,270 1,524,063 4,663,550 1,461,203 4,632,312 1,415,238
Total NPV 4,287,303 5,639,417 6,079,142 6,165,334 6, 124,753 6,047,551
...... N
Discount Rate
Alternate 1 B Improvement 0 2 4 6 8 10
911 PCC Overlay Year Cost($) Cost($) Cost($) Cost($) Cost($) Cost($) Agency User Agency User Agency User Agency User Agency User Agency User
Initial Construction Alt 1 B 2000 5,307,153 1,243,009 5,307, 153 1,243,009 5,307,153 1,243,009 5,307,153 1,243,009 5,307,153 1,243,009 5,307,153 1,243,009 Rehabilitation # 1 2015 257,955 171,208 191,665 127,210 143,234 95,066 107,636 71,439 81,318 53,972 61,752 40,986 Rehabilitation #2 2030 257,955 146,687 142,410 80,981 79,532 45,226 44,913 25,540 25,635 14,577 14,783 8,406 Salyage 2040 -3,632,520 -1 ,645,133 -756,614 -353, 162 -167,208 -80,260
Sub1Dtll 2,100,544 1,560,903 3,996,094 1,451,200 4,773,305 1,383,300 5,106,540 1,339,987 5,246,898 1,311 ,558 5,303,429 1,292,401 Total NPV 3,751 ,447 5,447,294 6,1 56,606 6,446,527 6,558,456 6,595,829

6,000,000
5,000,000
a,
~ 4,000,000 > ... c ~ 3,000,000 ! D. ~ 2,000,000 z
1,000,000
0
1-275 -- MP 1.05 - 4.06
-- - -- -I~
, ..... Ac Overlay .... Pee Overlay I I I I
0 2 4 6
Discount Rate (%)
Figure 5 Net Present Value, MP 1.05 - 4.06
1-275 -- MP 4.06 - 7.15
---
I
8 10
7,000,000 -,------,-----------------------,
a, 5,000,000 ...J----,,,£.~--------------------j :l 'iii > - 4,000,000 --1--,;~---------------------j c Cl) tn £ 3,000,000 +-------------------------j -Cl)
z 2,000,000 -1--- ------------------------i
1,000,000 +-------------------------i
-AC Overlay -41-PCC Overlay 0+---------1,--~~~-.=-~~~--r~--------1
0 2 4 6
Discount Rate(%)
Figure 6. Net Present Value, MP 4.06 - 7.15
13
8 10

It may be seen from the results of the LCCA that the net present values for the alternatives in both sections are very close to one another. In Section 1, (Figure 5) it may be seen that for discount rates less than 5 percent, the PCC alternative would have a lower net present value, while above 5 percent, the AC alternative would have a lower net present value. The same scenario holds true for Section 2, Figure 6, in that the PCC overlay would have the lower net present value below approximately 3.5 percent, while the AC alternative would be lower above 3.5 percent.
Typically, LCCA comparisons are conducted at discount rates from 3 to 5 percent. Therefore, it may be seen from the above analysis that for this project, the LCCA did not identify a preferred alternative.
SUMMARY AND CONCLUSIONS
Two different pavement rehabilitation alternatives have been identified for each design section, based on the analysis of the current and projected traffic and the existing pavement conditions. The pavement structural design has been evaluated utilizing two methods for each alternative and the following designs would be recommended:
Section 1 - MP 1.05 - 4.06 Break and Seat existing PCC pavement Construct a 13-inch AC Overlay
or Construct a 10-inch Unbonded PCC Overlay
Section 2 - MP 4.06 - 7.15 Break and Seat existing PCC pavement Construct a 12-inch AC Overlay
or Construct a 9-inch Unbonded PCC Overlay
Based on the analysis conducted for this project, the life cycle cost analysis would not identify a preferred alternative.
14
REFERENCES
Walls, J, and Smith, M, "Life-Cycle Cost Analysis in Pavement Design - Interim Technical Bulletin", Federal Highway Administration, FHWA-SA-98-079, September 1998.
Deen, R.C., and Southgate, H.F., "Pavement Designs Based on Work", Kentucky Transportation Research Program, UKTRP-88-29, October 1988.
"AASHTO Guide for Design of Pavement Structures", American Association of State Highway and Transportation Officials, 1993.
15