Embed Size (px)
Citation preview

Page 1 / 28 5.3.2. 04/10
5.3.2. BITUMINOUS MIX DESIGN (a) Mixtures Containing Asphalt Cement.
(1) Scope.
This method covers the procedure for determining the optimum amount of asphalt cement in a given aggregate mixture. Since bituminous mixtures vary by type, and to some extent within type, these instructions must be considered as a general commentary. Judgment and experience must be used in interpreting the design information obtained by this method.
(2) General.
a. Marshall Tests: Conduct tests on mixtures of aggregate and asphalt using Marshall apparatus as described in Kansas Test Method KT-14, and plot the resulting data on KDOT Form No. 702, "Asphaltic Concrete Design Mix Curves." Report percent asphalt on a dry weight basis. [A computer program for the Marshall Mix Design has been developed and it may be used. Examples shown at the end of this section were generated by this computer program.]
b. Interpretation of Test Results: Experience has shown that the results of Marshall tests
can be excellent guidelines to use when determining the optimum asphalt content for a given mix. The mix designer must become familiar with Marshall criteria, learn to judge the significance of each parameter and be able to analyze the characteristics of the mixture from the results of the design calculations and test values. Marshall curves alone should not be used to determine the design asphalt content, but should be used in analyzing the characteristics of the mixture. When deciding upon the optimum asphalt content for a mixture, do not select a value that is obviously not in conformity with some portions of the data in question or with other values derived from the test.
(3) Significance of Properties:
It should remain foremost in the thinking of the mix designer that the design data consists of two
general areas - volumetric and physical.
a. Volumetric Considerations:
Voids in Mineral Aggregate (VMA). The VMA generally decreases to a minimum value then increases with increasing asphalt contents. As far as possible, the mixtures with higher VMA should be preferred because of the following advantages: 1. More asphalt can be incorporated in the mixture to increase durability. 2. Lower sensitivity to variation in asphalt content during production. 3. Mixtures with low VMA will flush if slightly excessive in asphalt content, and
will be dry and brittle if slightly deficient in asphalt content.
Voids Filled with Asphalt (VFA). The VFA increases with increasing asphalt content. There is a maximum VFA for each aggregate blend and compaction effort. The VFA

Page 2 / 28 5.3.2. 04/10
can not be increased above this maximum without increasing or otherwise changing the compaction effort. The VFA curve is usually convex upwards. % Voids - Total Mixture. The percent of air voids decreases with increasing asphalt content, ultimately approaching a minimum void content in much the same manner as the VFA discussed above approaches a maximum value. The air voids curve is usually concave upwards. Voids are the air spaces within the mixture. It is important that a mixture contains sufficient voids to provide spaces for expansion of bitumen and a slight amount of additional densification (compaction) under traffic. Aggregate size, shape and gradation have an effect on the amount of voids developed in a mixture and in the amount of bitumen that a mixture can contain. The voids should be held to a minimum, consistent with the aggregate, yet large enough to permit expansion.
b. Physical Considerations:
Unit Weight (specimen). The Unit Weight of the compacted specimen increases with increasing asphalt content up to a certain point, after which it decreases. Stability. The stability value increases with increasing asphalt content up to a maximum after which the stability decreases. The peak of the stability curve is normally (but not always) at a slightly lower asphalt content than the peak of the Unit Weight curve. Cases are not uncommon where no stability peak is obtained. Stability is a measure of resistance to deformation. It is necessary to have sufficient stability to meet the requirements of traffic without mat distortion or displacement. There are two forms of resistance, frictional or interlocking and cohesive resistance. Frictional or interlocking resistance is dependent on the aggregate framework. Cohesive resistance develops in the bitumen-binder portion of the mixture. It depends on the rate of loading, load and temperature. High stability is undesirable if it is due to high density and low voids. Mixtures of this type have an excess of filler and are deficient in bitumen. Such surfaces will have low resistance to cracking, are brittle in the winter, and tend to ravel under traffic. Flow. This is an index of plasticity or the resistance to distortion. The amount of bitumen that fills the aggregate voids affects the flow. The flow value increases as the bitumen content of the mixture increases. Mixtures which contain high air voids usually develop excessive flow values before reaching the bitumen content which will produce a satisfactory density. Flow values will increase rapidly with small increases in asphalt in mixtures which contain a large amount of filler.
c. Generalized "Need" of a Durable Pavement:
Workability. This is a term which generally describes the spreadability and compactability of the mixture. Decreasing the percentage retained on the No. 8 (2.36 mm) sieve will reduce harshness. Decreasing the percentage of sand and filler will reduce stiffness. Reducing the bitumen content and filler content will reduce gumminess. Skid Resistance. A measure of the sliding force exerted on a tire when the brakes are locked. Bituminous wearing courses must have the highest possible skid resistance obtainable. The type of aggregate used has a great effect on skid resistance.

Page 3 / 28 5.3.2. 04/10
Durability. A measure of resistance to disintegration by weather or traffic conditions. The most important factor with respect to durability is the amount of bitumen. A bituminous mixture is resistant to the action of air and water in direct proportion to the degree that they are kept out of the mixture. If the voids are completely filled with bitumen, the surfaces will become plastic and flushing will occur. It is, however, desirable that the mixture should contain as high a bitumen content as possible that is consistent with stability and voids. This will give the pavement maximum durability and prevent raveling because of a deficiency of bitumen. An asphalt content set totally on durability may produce a slippery surface. Therefore, a compromise between durability and skid resistance must often be accepted. Flexibility. The ability of the bituminous mixture to bend repeatedly without cracking and to conform to changes in the base course. To have flexibility, a mixture must contain the proper amount of bitumen. Open graded mixtures are more flexible than dense graded mixtures. Flexibility decreases as the paving layer thickness increases. Flexibility increases with an increase of temperature.
(4) Types of Mixtures:
The types of mixtures encountered will generally fall within one of the following categories:
a. Balanced Mixture: The Marshall curves for a balanced mixture show that the
maximum unit weight and maximum stability occur at nearly the same asphalt content.
b. Open Graded Mixture: This type of mixture has an open texture, low unit weight and a high percent of voids due to the type, particle shape and gradation of the aggregate. The maximum unit weight and maximum stability can occur at the same asphalt content, which will be much higher than for a balanced mixture.
c. Dense Graded Mixture: This type of mixture has high unit weight, low percentage of
voids and often has no indicated stability peak. This is caused by the proportioning of graded coarse and fine aggregates to produce a mixture that will have maximum density and minimum voids.
Form 707 allows the gradation of the mix to be visually shown. Form 707 (Gradation Chart for
Marshall Design, Sieve Sizes Raised to 0.45 Power) is completed as listed below and shown in the example at the end of this section (5.3.2.).
a. Plot the Marshall Job Mix Single Point (for recycle mixes plot the Theoretical Combined Gradation, RAP Extracted Gradation, and the Virgin Aggregate Job Mix Single Point).
b. Determine the first sieve size with more than 10 percent retained in the Job Mix Single Point.
(For recycle mixes determine the first sieve size with more than 10 percent retained on the Theoretical Combined Gradation).
c. Determine the Maximum Sieve Size. This is two sieve sizes larger than the first sieve with
more than 10% retained.

Page 4 / 28 5.3.2. 04/10
d. Draw the maximum density line. This is a line drawn from the origin of the 0.45 power chart (lower left) to the point at which the Maximum Sieve Size intersects the 0 percent retained (100% passing) line.
e. Determine if the mix VMA falls in Zone 1 or Zone 2 using the instructions on Form 707. f. Terminology definition - Normal Maximum Size is one sieve size smaller than the Maximum
Size. This is also one size larger than the first sieve size with more than 10% retained on the Job Mix Single Point (Theoretical Combined Gradation for recycle mixes.)
(5) Asphalt Content Determination:
a. The recommended asphalt content should be one which best fits or satisfies the
volumetric and physical parameters desired. Information needed for asphalt content selection may be found in the project specifications or plans when Marshall control is specified. When Marshall control is not specified, the best engineering practices should govern the selection.
For guidance, the following table may be used:
Traffic Category* EAL<140 EAL 141-
274
EAL>275
Number of Blows 50 50 (Note 3)
75 (Note 1)
Test Property Min. Max. Min. Max.
Min. Max.
Stability Newtons** (lbs.)
3336 (750)
5338 (1200)
8006 (1800)
Flow, 0.25mm (0.01") 8 18 8 16
8 14
Air Voids, % 3 5 3 5
3 5
VMA, % (Note 2) (Note 2)
(Note 2)
VFA, % 70 80 65 78
65 75
Bearing Capacity
kPa 690 1,725 1,035 2,070
1,205 2,070
(PSI) (100) (250) (150) (300)
(175) (300)
* EAL values will be taken from the latest issue of the NOS condition survey. ** Stability values shown reflect the most recent data published by the Asphalt Institute. These values are considered valid only for those mixes with VMA values in Zone 1, KDOT Form No. 707. For those mixes with VMA values in Zone 2, KDOT Form No. 707, higher stabilities may be required to provide resistance to plastic deformation.

Page 5 / 28 5.3.2. 04/10
Note 1 - Use 75 blows for the top 100mm (4") of new construction in traffic lanes. Use 75 blows for all overlays, including hot recycle, in traffic lanes. Use 50 blows for all other lifts of new construction. (If 75 blow Marshall is required, it is to be specified in the contract.) Note 2 - Zone 1, KDOT Form No. 707, corresponds to mixes which are considered to have sufficient aggregate voids space to provide both adequate room for asphalt and sufficient remaining air voids to prevent flushing. Zone 2 mixtures would be considered as potentially at risk of flushing due to lack of aggregate void space to accommodate sufficient asphalt for durability and insufficient air voids remaining to prevent flushing.
Note 3 - Use 75 blows for overlays on PCCP and composite pavements. (If 75 blow Marshall is required, it is to be specified in the contract.)
b. Using the data previously determined, the bar chart portion of KDOT Form No. 701 is
utilized as follows:
Step 1. Indicate by a horizontal line the range of asphalt contents which include the desired (or specified) properties. Step 2. Indicate by vertical lines the area of "best convergence" of asphalt contents which satisfy the desirable (or specified) properties. Step 3. Indicate by vertical line the computed value of Pb'max as shown in the supplemental calculations, Section 5.10.4 (g) (3). Step 4. Select tentative asphalt content within the "best convergence" zone, but not exceeding the value of Pb'max. Step 5. Show this value (the tentative asphalt content) as the "Recommended % Asphalt." Step 6. Show values for VMA, Air Voids, etc. corresponding to the "Recommended % Asphalt" in the last column at the right side of the bar chart. A completed bar chart is shown as an example at the end of this section.
(b) Mixtures Containing Cutback Asphalt. (1) Formulas: A number of formulas have been devised to calculate the percent of cutback asphalt to be added to aggregate that is to be road-mixed. Two of these, the Nebraska and the New Mexico formulas are used in combination for work in Kansas. The asphalt content as calculated by these formulas will be a good indication of the proper value to use at the start of the work. It may be necessary to make adjustments based on judgment, and past experience in order to provide sufficient asphalt to coat the aggregate particles. Care must be taken not to have an excess amount of asphalt as this can result in an unstable

Page 6 / 28 5.3.2. 04/10
pavement. The quantities of cutback asphalt should be increased to compensate for the amount of diluent that will be lost during mixing, aeration and curing.
a. New Mexico Formula:
P = 0.02a + 0.07b + 0.15c + 0.20d Where: P = Percent of bituminous material by weight of dry aggregate. a = Percent of material retained on the No. 50 (300μm) sieve. b = Percent of material between No. 50 (300μm) and No. 100 (150μm) sieves. c = Percent of material between No. 100 (150μm) and No. 200 (75μm) sieves. d = Percent of material passing the No. 200 (75μm) sieve. When aggregates with an appreciable amount of water absorption are used, the amount of cutback asphalt added to the mixture should be increased by approximately two-thirds (2/3) of the amount of water absorbed by the aggregate.
b. Nebraska Formula:
P = AG (0.02a) + 0.06b + 0.10c + Sd Where: P = Percent of bituminous material by weight of dry aggregate. A = Absorption factor, equal to 1 for sand-gravel and 1 + 2/3 the water absorption of
other aggregates. G = Specific Gravity Correction Factor. This factor equals 1.0 for aggregate mixtures
that have a average specific gravity of 2.61. For aggregate mixtures having a different average specific gravity, this factor is inversely proportional to the average specific gravity of the combined aggregate.
a = Percent of material retained on No. 50 (300μm) sieve. b = Percent of material retained between the No. 50 (300μm) and No. 100 (150μm)
sieves. c = Percent of material retained between the No. 100 (150μm) and No. 200 (75μm)
sieves, plus C1. d = Percent of fines determined by the average of the percent passing the No. 200
(75μm) sieve dry screened, and the percent passing the No. 200 (75μm) on wash test in separate determinations.
C1 = The percent of material equal to the difference between the percent of material
passing the No. 200 (75μm) sieve on wash test and "d".

Page 7 / 28 5.3.2. 04/10
S = 0.2, except for volcanic ash, in which case the "S" factor shall be 0.27. NOTE: The quantity "d" shall be found by separate determinations on two
similar samples of combined material; one sample shall be dry screened only, and the other sample shall be tested by the wash test plus dry screening after washing.
(2) Determination of Asphalt Content:
Example: Assume a predominantly sand-gravel BM-6 mixture containing some crushed stone and volcanic ash.
Gradation Percent Retained - Square Mesh Sieves
19mm
9.5mm
4.75 mm
2.36 mm
1.18 mm
600μm
300μm
150μm
75μm
Dry Sieve 75μm
(3/4")
(3/8")
(#4)
(#8) (#16) (#30) (#50) (#100)
(#200) (#200)
0
3
11
32 55 71 84 89
90 93
Water Absorption = 2.0% (Avg. of Combined Material) Specific Gravity = 2.58 (Avg. of Combined Material) S Factor = 0.27
a. Asphalt Content by New Mexico Formula:
P = (0.02 x 84)+(0.07 x 5)+(0.15 x 1)+(0.20 x 10) P = 1.68 + 0.35 + 0.15 + 2.0 = 4.18% Increase the amount of bituminous material by 2/3 the amount of water absorption of the aggregate.
P = 4.18 + (0.67 x 2.0) = 5.52% b. Asphalt Content by the Nebraska Formula: A = 1 + (0.67 x 2.0) = 2.34 = Absorption Factor 1 = 2.58 G 2.61 G = 2.61 = 1.0116 = Gravity Correction Factor 2.58

Page 8 / 28 5.3.2. 04/10
Ag = 2.34 x 1.0116 = 2.37 d = 10 + 7 = 8.5 2 C1 = 10 - 8.8 = 1.5 C = 1 + 1.5 = 2.5 P = 2.37 (0.02x84) + (0.06x5) + (0.10x2.5) + (0.27x8.5) P = 3.98 + 0.30 + 0.25 + 2.30 = 6.83%
The results of the above calculations using the New Mexico and Nebraska formulas show a calculated asphalt range (after aeration) of between 5.52% and 6.83% based on dry weight of aggregate. Since a cutback asphalt is to be used, the percent of total bituminous material must be increased an amount equal to the amount of diluent which will be lost during aeration and curing. Thus if it is estimated that 50% of the volatiles will be removed and if the cutback contains 14% volatiles, then 7% volatiles by weight of asphalt will be removed. Then the above percentages should be increased as follows:
5.52(1-0.07)
= 5.94% 6.83(1-0.07)
= 7.34%
The results of the above calculations furnish the basis for establishing a starting asphalt content (on the basis of residue after aeration and curing). As previously mentioned, after mixing is started, judgment and experience may dictate adjustments in the percentage of asphalt actually used.
(c) Mixtures Containing Emulsified Asphalt.
A standard method of calculating the proper amount of emulsified asphalt to be used in bituminous mixtures has not been developed at this time. Consequently, the amount of emulsified asphalt to be added at the start of the work is currently being determined from the results of District Laboratory test and observations made on the aggregates and emulsions which will be used on each project.

Page 9 / 28 5.3.2. 04/10
KANSAS DEPARTMENT OF TRANSPORTATION
MARSHALL TEST RESULTS No. of Blows: 50
Single Point to the tenth (Y/N)?: No Contract #:594066008 Project: 99-115 K 4615-01 County: ZOLAN____________ Lab. No.: 9B99099A Mix Designation: BM-2_____ Mix Material Code: 002030500 Specification 1990, Sec. 1103 & 90p-88R3___ Contractor: XYZ CONST. CO., INC._________________________ Asphalt Source: TOTAL____________ Producer: XYZ CONST. CO., INC_________________________ Asphalt Grade: AC-10__ Date Rec./Rep.:_________________________/__March 21, 1995__________________
Percent Retained Square Mesh Sieves 1½"
37.5 mm
1" 25
mm
¾" 19
mm
½" 12.5 mm
⅜" 9.5 mm
4 4.75 mm
8 2.36 mm
16 1.18 mm
30 600 µm
50 300 µm
100 150 µm
200 75 µm
Job Mix Spec. Band
0
11 23
25 37
42 54
58 68
72 82
85 93
90 98
92.0 96.0
Job Mix Single Pt. 0 9 17 31 48 63 77 89 94 94.0Marshall Gradation 0 9 18 31 48 65 76 88 94 95.0
Test DataRange Tested
(% AC) Increment (% AC)
Marshall Mixing Temperature Range (oC)
Marshall Compaction Temperature Range (oC)
4.50 to 7.00 0.50 spec. 143 to 148 132 to137
Operating Range for Hot Mix Plant: 132 to 148 oC ←P’bMax. #Recommend
Asphalt Content% 4.50 5.00 5.50 6.00 6.50 7.00 5.25 Air Voids(3 to 5%) 3.98 VFA (.=70% 80%) 72.70 Bearing Capacity 988 (690-1725 kPa) Density Kg/m3 2315 (Peak+/-0.5%) Stability 4638 Minimum 3336 N # Values at Recommended Asphalt Content Filler/Binder Ratio: 1.14 Eff. Film Thick.: 7.76 P’b Max: 5.42 V.M.A.: 14.30/Zone 2_ Max. Sp. Gr.: 2.410 Theo. Max Density: 2410 Kg/m3 District Materials Engineer

Page 10 / 28 5.3.2. 04/10
FLOW
0
2
4
6
8
10
12
14
16
18
203
3.5 4
4.5 5
5.5 6
6.5 7
% ASPHALT
FLO
W IN
0.2
5 M
M
IFL
OW
IN 0
.01
INC
HE
S
BEARING CAPACITY
0
300
600
900
1200
1500
1800
2100
2400
2700
3000
3 4 5 6 7
% ASPHALT
BE
AR
ING
CA
PAC
ITY
(kPa
)
0
50
100
150
200
250
300
350
400
450
BE
AR
ING
CA
PAC
ITY
(PSI
)
9B99099A BM-2R3
STABILITY
0
2
4
6
8
10
12
14
16
18
33.
5 44.
5 55.
5 66.
5 7
% ASPHALT
STA
BIL
ITY
(kN
)
0
500
1000
1500
2000
2500
3000
3500
4000ST
AB
ILIT
Y (L
BS)

Page 11 / 28 5.3.2. 04/10
DENSITY
2000
2050
2100
2150
2200
2250
2300
2350
2400
2450
2500
2550
2600
3
3.5 4
4.5 5
5.5 6
6.5 7
% ASPHALT
KG
PE
R C
UB
IC M
ET
ER
125
130
135
140
145
150
155
160
LB
S PE
R C
UB
IC F
OO
T
VOIDS FILLED WITH ASPHALT
0
10
20
30
40
50
60
70
80
90
100
3
3.5 4
4.5 5
5.5 6
6.5 7
% ASPHALT
% V
OID
S F
ILL
ED
0
10
20
30
40
50
60
70
80
90
100
% V
OID
S F
ILL
ED
VOIDS-TOTAL MIX
0
1
2
3
4
5
6
7
8
9
10
11
12
3
3.5 4
4.5 5
5.5 6
6.5 7
% ASPHALT
% A
IR V
OID
S
0
1
2
3
4
5
6
7
8
9
10
11
12
% A
IR V
OID
S
VOIDS MINERAL AGGR
0
2
4
6
8
10
12
14
16
18
203
3.5 4
4.5 5
5.5 6
6.5 7
% ASPHALT
% V
MA
0
2
4
6
8
10
12
14
16
18
203
3.5 4
4.5 5
5.5 6
6.5 7
% V
MA

Page 12 / 28 5.3.2. 04/10
KANSAS DEPARTMENT OF TRANSPORTATION Lab No.: 9B99099A
DESIGN JOB-MIX COMPUTATION SHEETS Contract #: 594066008 Mix Desig.: BM-2 Material Code : 002030500 Project: 99-115 K 4615-01 County: ZOLAN
Specifications: 1990 STD. & 90P-88R3
1. AGGREGATES AGGR. TYPE % PRODUCER NAME MAT’L CODE IN MIX PRODUCER CODE # LEGAL DESCRIPTION COUNTY CS-1 20.00 HAMM QUARRY NE 1/4 S10,T072,R10E POTTAWATOMIE 002010117 00800933 CS-2 30.00 MARTIN-MARIETTE SE 1/4 S33,T10S,R09E RILEY 002010217 00802414 SSG 50.00 BLUE RIVER NE 1/4 S25,T05S, R07E MARSHALL AC-10 TOTAL 021110000 00002801 2. INDIVIDUAL AGGREGATE SINGLE POINTS 1½ 1 ¾ ½ ⅜ 4 8 16 30 50 100 200 % 37.5 25 19 12.5 9.5 4.75 2.36 1.18 600 300 150 75 TYPE __IN MIX __ _mm__ _mm__ _mm__mm___mm__ _mm_ _ mm___ mm __µm_ __µm__ _µm__ _µm CS-1 20.00 0 0 0 46 80 93 96 97 97 97 97 97.0 CS-2 30.00 0 0 0 0 1 26 50 64 73 79 82 84.0 SSG 50.00 0 0 0 0 1 10 28 48 72 92 99 99.0 DESIGN SINGLE POINT 0 0 0 9 17 31 48 63 77 89 94 94.0 2A. INDIVIDUAL AGGREGATE GRADATIONS (AS SUBMITTED) 1½ 1 ¾ ½ ⅜ 4 8 16 30 50 100 200 % 37.5 25 19 12.5 9.5 4.75 2.36 1.18 600 300 150 75 TYPE __IN MIX__ _mm_ __mm___mm__mm__ _mm__ _mm_ _ mm_ __mm_ _µm__ _µm__ _µm__ _µm CS-1 20.00 0 0 0 46 80 93 96 97 97 97 97 97.0 CS-2 30.00 0 0 0 0 1 26 50 64 73 79 82 84.0 SSG 50.00 0 0 0 0 1 10 28 48 72 92 99 99.0 THEO COMB GRAD 0 0 0 9 17 31 48 63 77 89 94 94.1 DOT FORM 703

Page 13 / 28 5.3.2. 04/10
Project: 99-115 K 4615-01 Lab No.: 9B99099A 3. DESIGN JOB MIX GRADING 1½ 1 ¾ ½ ⅜ 4 8 16 30 50 100 200 37.5 25 19 12.5 9.5 4.75 2.36 1.18 600 300 150 75 _ _mm__ _mm__ _mm __mm___mm__ _mm_ _ mm__ mm _ µm_ _µm__ _µm__ _µm 0.00 0.00 SINGLE POINT 0 9 17 31 48 63 77 89 94 94.0 TOLERANCE 6 6 6 5 5 4 4 2 No BM-2R3 LOWER 11 25 42 58 72 85 90 92.0 BM-2R3 UPPER 0 23 37 54 68 82 93 98 96.0 4. MASTER GRADING LIMITS 37.5 25 19 12.5 9.5 4.75 2.36 1.18 600 300 150 75 _ _mm__ _mm__ _mm __mm___mm__ _mm_ _ mm__ mm _ µm_ _µm__ _µm__ _µm BM-2R3 LOWER 8 42 64 90 BM-2R3 UPPER 0 30 72 88 97 5. INDIVIDUAL AGGREGATE LIMITS % 37.5 25 19 12.5 9.5 4.75 2.36 1.18 600 300 150 75 TYPE _ IN MIX __ _mm__ _mm__ _mm__mm___mm__ _mm_ _ mm___ mm __µm_ __µm__ _µm__ _µm 0 0 10 60 96 96 97 97 97 97 97 CS-1 20.00 0 0 0 28 77 99 99 99 99 99 99 100 0 0 0 0 22 45 60 70 77 80 81 CS-2 30.00 0 0 0 0 5 34 55 69 78 84 88 88 0 0 0 0 5 22 45 68 87 97 98 CS-3 50.00 0 0 0 0 5 15 32 55 77 95 100 100 6. INDIVIDUAL AGGREGATE COMBINED LIMITS LOWER 0 0 2 12 28 44 60 74 86 92 93 UPPER 0 0 0 6 19 38 52 68 82 93 96 96 7. CHECK OF MIX SPECIFICATIONS SPECS DESIGN % CRUSHED AGGREGATE IN MIX 50 MIN. 50.00 % UNCRUSHED -75µm NATURAL SAND 30 MAX. 8.47 % -2.36mm +75µm NATURAL SAND 15 MIN. 35.50 SAND EQUIVALENT 45 MIN. 53 Design Job Mix Single Point Meets the Screen Spread Limits Specification. DOT Form 704

Page 14 / 28 5.3.2. 04/10
Calculations for Items 7 Form 704 8.A. Natural Sand: Passing No. 2.38 mm and Retained on No. 75µm
Single Point Gradation (From Item 2) (0.50) (99.00 - 28.00) = 35.5% Sand
Lower & Upper Limits (Lowest Calculated Value) (From Item 5)
(0.50) (98.00 - 32.00) = 33.0% Sand 8.B. Uncrushed Minus 75µm
Single Point Gradation (From Item 2A)
(100.00 - 99.00) (0.50) (100)(100 - 94.1)
= 8.47% Uncrushed
Lower & Upper Limits (Highest Calculated Value) (From Item 5)
SSG 50% (100-98) = 1.00 Uncrushed CS-1 20% (100-100) = 0.00 Crushed CS-2 30% (100-88) = 3.60 Crushed Total Minus 75µm = 4.60
Uncrushed Minus 75µm
1.00 (100)
4.60 = 21.8 = 22% Uncrushed

Page 15 / 28 5.3.2. 04/10
WORKSHEET FOR ANALYSIS OF COMPACTED PAVING MIXTURE Contract #: 594066008 Project Number: 99-115 K 4615-01 Date: March 21, 1995 Mix Designation: BM-2 Lab No.: 9B99099A % AC by Wt. Aggr. 4.50 5.00 5.50 6.00 6.50 7.00 Pb’ % AC by Wt. Mix 4.306 4.762 5.213 5.660 6.103 6.542 Pb=A % Aggr. by Wt. Mix 95.694 95.238 94.787 94.340 93.897 93.458 Ps=B S. G. of Asphalt 1.0180 1.0180 1.0180 1.0180 1.0180 1.0180 Gb=c S. G. of Aggr. (bulk) 2.566 2.566 2.566 2.566 2.566 2.566 Gsb=D Max. S. G. Mix (KT-39) 2.434 2.417 2.405 Gmm (computed) 2.434 2.418 2.403 2.387 2.372 2.358 E Theo. Max. Kg/m3 2434 2418 2403 2387 2372 2358 F(SI) =F Eff. S. G. of Aggr. 2.597 2.597 2.597 2.597 2.597 2.597 Gse=G % Abs. Asphalt 0.474 0.474 0.474 0.474 0.474 0.474 Pba=H Eff. Asph. Content 3.852 4.311 4.764 5.213 5.658 6.099 Pbe=I % V. M. A. 14.49 14.45 14.15 14.41 14.78 15.43 VMA=J S. G. of plugs (KT-15) 2.293 2.305 2.323 2.328 2.329 2.322 Gmb=K Lab Plugs Kg/m3 2293 2305 2323 2328 2329 2322 L(SI)=L % Air Voids 5.79 4.67 3.29 2.47 1.81 1.53 Pa=M % Voids Filled 59.88 67.55 76.86 82.73 87.58 90.16 VFA=N P’b Max 5.51 5.49 5.36 5.47 5.63 5.90 O Eff. Film Thickness 6.54 7.36 8.17 8.98 9.79 10.61 P Filler/Binder Ratio 1.33 1.20 1.09 1.00 0.92 0.86 Q P’B * 100 COMBINED AGGREGATE SP. GR. PB = A = ___________ APPARENT BULK % 100 + P’B +4.75 mm 2.652 2.484 31 -4.75 mm 2.669 2.754 69 PS = B = 100 - A Theo. Comb. 2.664 F = 1000 E B GSE = G = ________________ L = 1000 K 100 A ____ - ___ E C E - K G - D P A = M = 100 * PBA = H = 100 * * C E D * G H I PBE = I = A - * B 100 * 100 C VFA = N = J K * B VMA = J = 100 - K D

Page 16 / 28 5.3.2. 04/10
KANSAS DEPARTMENT OF TRANSPORTATION
HOT MIX DESIGN DATA (MARSHALL METHOD) Contract: 594066008 Project: 99-115 K 4615-01 County: Zolan Date: March 21, 1995 Lab No. 9B99099A Mix Designation: BM-2 Asphalt Grade: AC-10 Sp. Gr. AC: 1.0180 Compaction, Blows/Side: 50 Deg.C Comapct Specimen Weight, Grams Water SP. GR. KG/ Water Stability Flow Bearing Temp. Height Dry In S.S.D S.S.D Absorbed Compact Cubic Bath Dial. Adjust (0.25) Capacity % AC (C) (MM) In Air Water In Air In Water % Mix Meter (C) Reading Corr. (N) (MM) (kPa) A 137 63.900 1175.1 661.7 2.289 59 117 1.00 4589 7.5 148 B 136 63.700 1183.8 669.2 2.300 59 143 1.00 5679 7.5 Error C 134 63.600 1174.2 661.5 2.290 61 122 1.00 4799 7.5 4.50 Average 2.293 2293 4694 7.5 1091 A 137 63.800 1185.0 671.3 2.307 60 105 1.00 4087 7.5 148 B 137 63.500 1187.7 674.0 2.312 60 117 1.00 4589 7.5 C 136 63.200 1179.4 665.8 2.296 60 112 1.00 4380 7.5 5.00 Average 2.305 2305 4352 7.5 1012 A 133 63.300 1187.1 675.7 2.307 60 117 1.00 4589 8.0 148 B 133 63.200 1186.6 676.2 2.325 60 127 1.00 5009 9.0 C 134 62.900 1187.1 676.7 2.326 60 131 1.00 5176 9.5 5.50 Average 2.324 2324 4925 8.8 965 A 134 63.300 1193.6 680.6 2.327 59 131 1.00 5176 10.5 148 B 136 62.700 1183.9 675.6 2.329 59 122 1.04 4991 9.5 C 136 63.300 1190.0 679.1 2.329 60 116 1.00 4548 9.5 6.00 Average 2.328 2328 4905 9.8 855 A 137 62.700 1190.5 679.2 2.328 60 114 1.04 4642 12.5 148 B 136 62.900 1184.8 675.6 2.327 60 122 1.00 4799 11.5 C 137 63.100 1186.1 677.6 2.333 60 112 1.00 4380 11.5 6.50 Average 2.329 2329 4607 11.8 655 A 137 62.900 1184.5 674.7 2.323 59 119 1.00 4673 14.0 148 B 136 63.100 1184.3 672.9 2.316 60 105 1.00 4087 13.5 C 134 63.600 1189.2 677.8 2.325 60 118 1.00 4631 13.5 7.00 Average 2.322 2322 4464 13.7 537 Specific Gravity Method: I ERROR = PLUG OUT OF ALLOWED RANGE D.O.T. FORM 705

Page 17 / 28 5.3.2. 04/10
KANSAS DEPARTMENT OF TRANSPORTATION
THEORETICAL MAXIMUM SPECIFIC GRAVITY OF PAVING MIXTURES
References: ASTM D 2041 (Rice’s Method) and Kansas Test Method KT-39 Date: March 21, 1995 Contract Number: 594066008 Project Number: 99-115 K 4615-01 County: Zolan Lab No: 9B99099A Bowl # Sample #
4.50 A
4.50 B
5.00 A
5.00 B
5.50 A
5.50 B
Mass of Sample & Bowl in Air, Grams
3646.5
3698.3
3720.3
3709.2
3681.9
3673.7
Mass of Bowl in Air, Grams
2144.0
2141.9
2173.7
2149.5
2114.6
2112.2
Mass of Sample in Air, Grams (A)
1502.5
1556.4
1546.6
1559.7
1567.3
1561.5
Temp. of Bath, Sample and Bowl after 10 Minutes
78.8
78.6
77.9
78.0
77.5
77.6
Mass of Sample and Bowl in Water, Grams
2240.4
2258.9
2270.3
2260.2
2251.9
2246.7
Mass of Bowl in Water, Grams
1368.2
1365.1
1386.9
1362.7
1337.8
1335.4
Mass of Sample in Water, Grams (C)
872.2
893.8
883.4
897.5
914.1
911.3
Maximum Sp. Gr. of Mix (Rice’s) A/(A-C)
2.3838
2.3489
2.3320
2.3553
2.3994
2.4015
Average Max. Sp. Gr. of Mix
2.366
2.344
2.400
D.O.T Form 706

Page 18 / 2
28
5.3.2. 04//10

Page 19 / 28 5.3.2. 04/10
KANSAS DEPARTMENT OF TRANSPORTATION MARSHALL TEST RESULTS
No. of Blows: 50 Single Point to the tenth (Y/N)?: No
Contract #:094066008 Project: 99-115 K 4615-01 County: ZOLAN____________ Lab. No.: 9B99099A Mix Designation: BM-2_____ Mix Material Code: 002030500 Specification 1990, Sec. 1103 & 90P-88R3___ Contractor: XYZ CONST. CO., INC._________________________ Asphalt Source: TOTAL____________ Producer: XYZ CONST. CO., INC_________________________ Asphalt Grade: AC-10__ Date Rec./Rep.:_________________________/__March 21, 1995__________________
Percent Retained Square Mesh Sieves 1½"
37.5 mm
1" 25
mm
¾" 19
mm
½" 12.5 mm
⅜ 9.5 mm
4 4.75 mm
8 2.36 mm
16 1.18 mm
30 600 µm
50 300 µm
100 150 µm
200 75 µm
Job Mix Spec. Band
0
11 23
25 37
42 54
58 68
72 82
85 93
90 98
92.0 96.0
Job Mix Single Pt. 0 9 17 31 48 63 77 89 94 94.0Marshall Gradation 0 9 18 31 48 65 76 88 94 95.0
Test DataRange Tested
(% AC) Increment (% AC)
Marshall Mixing Temperature Range (oF)
Marshall Compaction Temperature Range (oF)
4.50 to 7.00 0.50 spec. 289 to 298 270 to279
Operating Range for Hot Mix Plant: 270 to 298 oF ←P’bMax. #Recommend
Asphalt Content% 4.50 5.00 5.50 6.00 6.50 7.00 5.25 Air Voids(3 to 5%) 3.98 VFA (.=70% 80%) 72.70 Bearing Capacity 143 (690-1725 PSI) Density (lbs/ft3) 144.42 (Peak+/-0.5%) Stability 1043 Minimum 750 lbs. # Values at Recommended Asphalt Content Filler/Binder Ratio: 1.14 Eff. Film Thick.: 7.76 P’b Max: 5.42 V.M.A.: 14.30/Zone 2_ Max. Sp. Gr.: 2.410 Theo. Max Density: 150.38 lbs/ft3 District Materials Engineer

Page 20 / 28 5.3.2. 04/10
BEARING CAPACITY
0
50
100
150
200
250
300
350
400
450
3 3.5 4 4.5 5 5.5 6 6.5 7
% ASPHALT
BE
AR
ING
CA
PAC
ITY
PSI
0
300
600
900
1200
1500
1800
2100
2400
2700
3000
BE
AR
ING
CA
PAC
ITY
(kPa
)
STABILITY
0
500
1000
1500
2000
2500
3000
3500
4000
3 3.5 4 4.5 5 5.5 6 6.5 7
% ASPHALT
STA
BIL
ITY
(L
BS)
0
2
4
6
8
10
12
14
16ST
AB
ILIT
Y
FLOW
0
2
4
6
8
10
12
14
16
18
20
3 3.5 4 4.5 5 5.5 6 6.5 7
% ASPHALT
FLO
W IN
0.0
1"
0
2
4
6
8
10
12
14
16
18
20
FLO
W IN
0.2
5 M
M

Page 21 / 28 5.3.2. 04/10
VOIDS FILLED WITH ASPHALT
0
10
20
30
40
50
60
70
80
90
100
3
3.5 4
4.5 5
5.5 6
6.5 7
% ASPHALT%
VO
IDS
FIL
LE
D
0
10
20
30
40
50
60
70
80
90
100
% V
OID
S F
ILL
ED
VOIDS-TOTAL MIX
0
1
2
3
4
5
6
7
8
9
10
11
12
3
3.5 4
4.5 5
5.5 6
6.5 7
% ASPHALT
% A
IR V
OID
S
0
1
2
3
4
5
6
7
8
9
10
11
12
% A
IR V
OID
S
VOIDS MINERAL AGGR
0
2
4
6
8
10
12
14
16
18
20
3
3.5 4
4.5 5
5.5 6
6.5 7
% ASPHALT
% V
MA
0
2
4
6
8
10
12
14
16
18
20
3
3.5 4
4.5 5
5.5 6
6.5 7
%V
MA
DENSITY
125
130
135
140
145
150
155
160
1653
3.5 4
4.5 5
5.5 6
6.5 7
% ASPHALT
LB
S PE
R C
UB
IC F
OO
T
2000
2050
2100
2150
2200
2250
2300
2350
2400
2450
2500
2550
2600
KG
PE
R C
UB
IC
ME
TE
R

Page 22 / 28 5.3.2. 04/10
KANSAS DEPARTMENT OF TRANSPORTATION Lab No. : 9B99098A
DESIGN JOB-MIX COMPUTATION SHEETS Contract #: 904066008 Mix Design : BM-2 Material Code : 002030500 Project: 99-115 K 4615-01 County: Zolan Specifications: 1990 STD. & 90P-88 R 3 1. AGGREGATES AGGR. TYPE % PRODUCER NAME MAT’L CODE IN MIX PRODUCER CODE LEGAL DESCRIPTION COUNTY CS-1 20.00 Hamm Quarry NE 1/4 S10,T07S,R10E Pottawatomie 002010117 00800933 CS-2 30.00 Martin-Marietta SE 1/4 S33,T10S,R09E Riley 002010217 00802414 SSG 50.00 Blue River NE 1/4 S25,T05S,R07E Marshall AC-10 TOTAL 021110000 00002801 2. INDIVIDUAL AGGREGATE SINGLE POINTS % TYPE IN MIX 1 1/2 1 3/4 1/2 3/8 4 8 16 30 50 100 200 CS-1 20.00 0 0 0 46 80 93 96 97 97 97 97 97.0 CS-2 30.00 0 0 0 0 1 26 50 64 73 79 82 84.0 SSG 50.00 0 0 0 0 1 10 28 48 72 92 99 99.0 DESIGN SINGLE POINT 0 0 0 9 17 31 48 63 77 89 94 94.0 2A. INDIVIDUAL AGGREGATE GRADATIONS (AS SUBMITTED) % TYPE IN MIX 1 1/2 1 3/4 1/2 3/8 4 8 16 30 50 100 200 CS-1 20.00 0 0 0 46 80 93 96 97 97 97 97 97.0 CS-2 30.00 0 0 0 0 1 26 50 64 73 79 82 84.0 SSG 50.00 0 0 0 0 1 10 28 48 72 92 99 99.0 THEO COMB GRAD 0 0 0 9 17 31 48 63 77 89 94 94.1 D.O.T FORM 703

Page 23 / 28 5.3.2. 04/10
Project: 99-115 K 4615-01 Lab No. 9B99098A 3. DESIGN JOB MIX GRADING 1 1/2 1 3/4 1/2 3/8 4 8 16 30 50 100 200 SINGLE POINT 0 0 0 9 17 31 48 63 77 89 94 94.0 TOLERANCE 6 6 6 5 5 4 4 2 BM-2R3 LOWER 11 25 42 58 72 85 90 92.0 BM-2R3 UPPER 0 23 37 54 68 82 93 98 96.0 4. MASTER GRADING LIMITS 1 1/2 1 3/4 1/2 3/8 4 8 16 30 50 100 200 BM-2R3 LOWER 0 42 64 90 BM-2R3 UPPER 0 30 72 88 97 5. INDIVIDUAL AGGREGATE LIMITS % TYPE IN MIX 1 1/2 1 3/4 1/2 3/8 4 8 16 30 50 100 200 0 0 0 10 60 96 96 97 97 97 97 97 CS-1 20.00 0 0 0 28 77 99 99 99 99 99 99 100 0 0 0 0 0 22 45 60 70 77 80 81 CS-2 30.00 0 0 0 0 5 34 55 69 78 84 88 88 0 0 0 0 5 22 45 68 87 97 98 SSG 50.00 0 0 0 0 5 15 32 55 77 95 100 100 6. INDIVIDUAL AGGREGATE COMBINED LIMITS LOWER 0 0 2 12 28 44 60 74 86 92 93 UPPER 0 0 0 6 19 38 52 68 82 93 96 96 7. CHECK OF MIX SPECIFICATIONS SPECS DESIGN % CRUSHED AGGREGATE IN MIX 50 MIN. 50.00 % UNCRUSHED -200 30 MIN. 8.47 % -8 +200 NATURAL SAND 15 MIN. 35.50 SAND EQUIVALENT 45 MIN. 53 DESIGN JOB MIX SINGLE POINT MEETS THE SCREEN SPREAD LIMITS SPECIFICATION. D.O.T. FORM 704
Page 24 / 28 5.3.2. 04/10
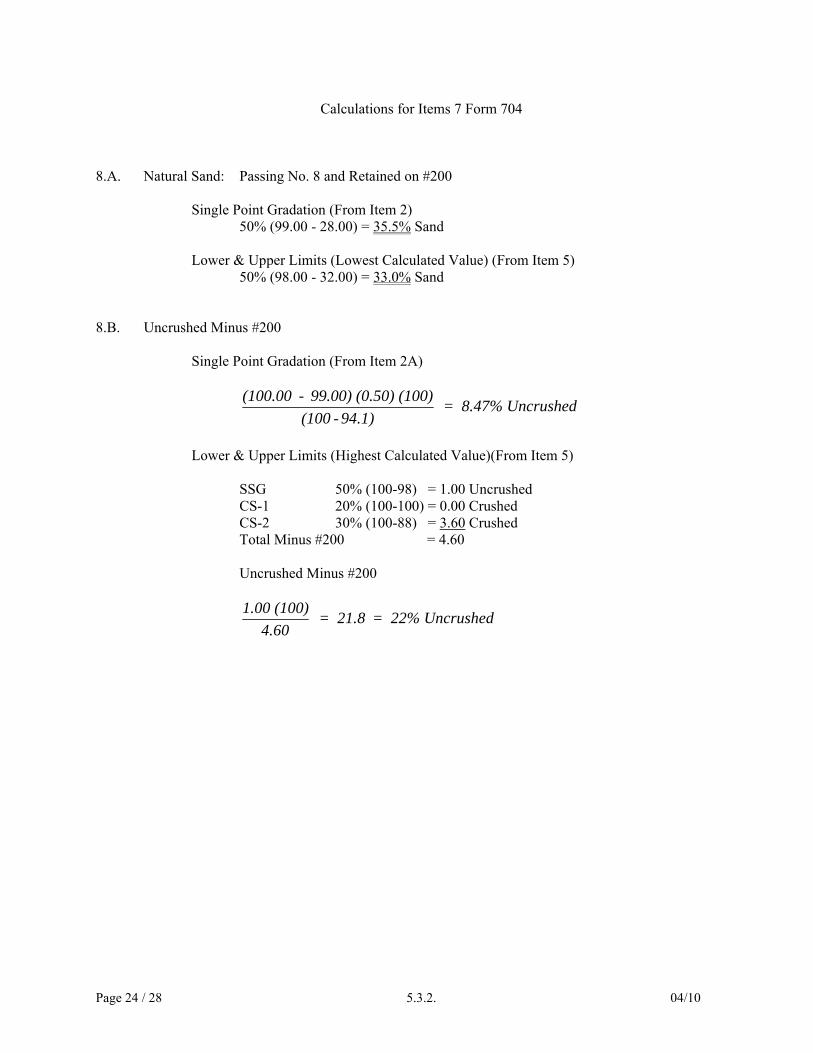
Calculations for Items 7 Form 704 8.A. Natural Sand: Passing No. 8 and Retained on #200
Single Point Gradation (From Item 2) 50% (99.00 - 28.00) = 35.5% Sand
Lower & Upper Limits (Lowest Calculated Value) (From Item 5)
50% (98.00 - 32.00) = 33.0% Sand 8.B. Uncrushed Minus #200
Single Point Gradation (From Item 2A)
(100.00 - 99.00) (0.50) (100)(100 - 94.1)
= 8.47% Uncrushed
Lower & Upper Limits (Highest Calculated Value)(From Item 5)
SSG 50% (100-98) = 1.00 Uncrushed CS-1 20% (100-100) = 0.00 Crushed CS-2 30% (100-88) = 3.60 Crushed Total Minus #200 = 4.60
Uncrushed Minus #200
1.00 (100)
4.60 = 21.8 = 22% Uncrushed

Page 25 / 28 5.3.2. 04/10
WORKSHEET FOR ANALYSIS OF COMPACTED PAVING MIXTURE Contract #: 594066008 Project Number: 99-115 K 4615-01 Date: March 21, 1995 Mix Designation: BM-2 Lab No.: 9B99099A % AC by Wt. Aggr. 4.50 5.00 5.50 6.00 6.50 7.00 Pb’ % AC by Wt. Mix 4.306 4.762 5.213 5.660 6.103 6.542 Pb=A % Aggr. by Wt. Mix 95.694 95.238 94.787 94.340 93.897 93.458 Ps=B S. G. of Asphalt 1.0180 1.0180 1.0180 1.0180 1.0180 1.0180 Gb=c S. G. of Aggr. (bulk) 2.566 2.566 2.566 2.566 2.566 2.566 Gsb=D Max. S. G. Mix (KT-39) 2.434 2.417 2.405 Gmm (computed) 2.434 2.418 2.403 2.387 2.372 2.358 E Theo. Max. PCF 151.88 150.88 149.95 148.95 148.01 147.14 F Eff. S. G. of Aggr. 2.597 2.597 2.597 2.597 2.597 2.597 Gse=G % Abs. Asphalt 0.474 0.474 0.474 0.474 0.474 0.474 Pba=H Eff. Asph. Content 3.852 4.311 4.764 5.213 5.658 6.099 Pbe=I % V. M. A. 14.49 14.45 14.15 14.41 14.78 15.43 VMA=J S. G. of plugs (KT-15) 2.293 2.305 2.323 2.328 2.329 2.322 Gmb=K Lab Plugs PCF 143.08 143.83 145.02 145.27 145.33 144.89 L % Air Voids 5.79 4.67 3.29 2.47 1.81 1.53 Pa=M % Voids Filled 59.88 67.55 76.86 82.73 87.58 90.16 VFA=N P’b Max 5.51 5.49 5.36 5.47 5.63 5.90 O Eff. Film Thickness 6.54 7.36 8.17 8.98 9.79 10.61 P Filler/Binder Ratio 1.33 1.20 1.09 1.00 0.92 0.86 Q P’B * 100 COMBINED AGGREGATE SP. GR. PB = A = ___________ APPARENT BULK % 100 + P’B +4 2.652 2.484 31 -4 2.669 2.578 69 PS = B = 100 - A Theo. Comb. 2.664 2.566 F = E*62.4 B GSE = G = ________________ L = K*62.4 100 A ____ - ___ E C E - K G - D P A = M = 100 * PBA = H = 100 * * C E D * G H I PBE = I = A - * B 100 * 100 C VFA = N = J K * B VMA = J = 100 - K D

Page 26 / 28 5.3.2. 04/10
KANSAS DEPARTMENT OF TRANSPORTATION HOT MIX DESIGN DATA (MARSHALL METHOD)
Contract: 594066008 Project: 99-115 K 4615-01 County: Zolan Date: March 21, 1995 Lab No. 9B99099A Mix Designation: BM-2 Asphalt Grade: AC-10 Sp. Gr. AC: 1.0180 Compaction, Blows/Side: 50 Deg.C Comapct Specimen Weight, Grams Water SP. GR. KG/ Water Stability Flow Bearing Temp. Height Dry In S.S.D S.S.D Absorbed Compact Cubic Bath Dial. Adjust (0.25) Capacity % AC (C) (MM) In Air Water In Air In Water % Mix Meter (C) Reading Corr. (N) (MM) (kPa) A 279 2.516 1175.1 661.7 2.289 139 117 1.00 1032 7.5 298 B 277 2.506 1183.8 669.2 2.300 139 143 1.00 1277 7.5 Error C 274 2.497 1174.2 661.5 2.290 141 122 1.00 1079 7.5 4.50 Average 2.293 143.08 1056 7.5 158 A 279 2.512 1185.0 671.3 2.307 140 105 1.00 919 7.5 298 B 278 2.500 1187.7 674.0 2.312 140 117 1.00 1032 7.5 C 276 2.487 1179.4 665.8 2.296 140 112 1.00 985 7.5 5.00 Average 2.305 143.83 979 7.5 147 A 272 2.493 1187.1 675.7 2.307 140 117 1.00 1032 8.0 298 B 272 2.487 1186.6 676.2 2.325 140 127 1.00 1126 9.0 C 274 2.476 1187.1 676.7 2.326 140 131 1.00 1164 9.5 5.50 Average 2.324 145.02 1107 8.8 140 A 276 2.492 1193.6 680.6 2.327 139 131 1.00 1164 10.5 298 B 276 2.468 1183.9 675.6 2.329 139 122 1.04 1122 9.5 C 276 2.492 1190.0 679.1 2.329 140 116 1.00 1022 9.5 6.00 Average 2.328 145.27 1103 9.8 124 A 279 2.469 1190.5 679.2 2.328 140 114 1.04 1044 12.5 298 B 277 2.478 1184.8 675.6 2.327 140 122 1.00 1079 11.5 C 278 2.486 1186.1 677.6 2.333 140 112 1.00 985 11.5 6.50 Average 2.329 145.33 1036 11.8 95 A 279 2.478 1184.5 674.7 2.323 139 119 1.00 1051 14.0 298 B 276 2.485 1184.3 672.9 2.316 140 105 1.00 919 13.5 C 274 2.503 1189.2 677.8 2.325 140 118 1.00 1041 13.5 7.00 Average 2.322 144.89 1004 13.7 78 Specific Gravity Method: I ERROR = PLUG OUT OF ALLOWED RANGE D.O.T. FORM 705

Page 27 / 28 5.3.2. 04/10
KANSAS DEPARTMENT OF TRANSPORTATION
THEORETICAL MAXIMUM SPECIFIC GRAVITY OF PAVING MIXTURES References: ASTM D 2041 (Rice’s Method) and Kansas Test Method KT-39 Date: March 21, 1995 Contract Number: 594066008 Project Number: 99-115 K 4615-01 County: Zolan Lab No: 9B99099A Bowl # Sample #
4.50 A
4.50 B
5.00 A
5.00 B
5.50 A
5.50 B
Mass of Sample & Bowl in Air, Grams
3646.5
3698.3
3720.3
3709.2
3681.9
3673.7
Mass of Bowl in Air, Grams
2144.0
2141.9
2173.7
2149.5
2114.6
2112.2
Mass of Sample in Air, Grams (A)
1502.5
1556.4
1546.6
1559.7
1567.3
1561.5
Temp. of Bath, Sample and Bowl after 10 Minutes
78.8
78.6
77.9
78.0
77.5
77.6
Mass of Sample and Bowl in Water, Grams
2240.4
2258.9
2270.3
2260.2
2251.9
2246.7
Mass of Bowl in Water, Grams
1368.2
1365.1
1386.9
1362.7
1337.8
1335.4
Mass of Sample in Water, Grams (C)
872.2
893.8
883.4
897.5
914.1
911.3
Maximum Sp. Gr. of Mix (Rice’s) A/(A-C)
2.3838
2.3489
2.3320
2.3553
2.3994
2.4015
Average Max. Sp. Gr. of Mix
2.366
2.344
2.400
D.O.T Form 706

Page 28 / 2
28
5.3.2. 04//10