Embed Size (px)
Citation preview

DG [Name]Unit [Name]
ICT Inception Report templateAssessment of ICT impacts of the [Name of the initiative]
Date: [Issue Date]
Doc. Version: [6.00]

ICT Inception Report template
This report was carried out for the European Commission by:
Disclaimer The information and views set out in this publication are those of the author(s) and do not necessarily reflect the
official opinion of the European Commission. The European Commission does not guarantee the accuracy of the
data included in this document. Neither the European Commission nor any person acting on the European
Commission’s behalf may be held responsible for the use which may be made of the information contained therein.
© European Union, 2015
Table of contents
Page 2 of 21

ICT Inception Report template
Disclaimer 21. Introduction 52. Methodology 62.1. Step I: Define the scope of the ICT assessment 6
2.1.1 Identify the ICT relevance of the policy problem and objectives 6
2.1.2 Define the technical scenarios 6
2.2. Step II: Prepare the ICT assessment 8
2.2.1 Analyse stakeholders 8
2.2.2 Build the ICT cost-benefit model 10
2.2.3 Define the data collection methods 12
2.2.4 Define the assessment criteria 13
2.3. Step III: Assess the ICT impacts 14
2.3.1 Collect and analyse data 14
2.3.2 Compare the technical scenarios and make recommendations on the policy options 15
3. Work Plan 164. Risks, Issues and Decisions 17
Page 3 of 21

ICT Inception Report template
Table of tablesTable 1 Link between ICT and the policy options.........................................................................................................6Table 2 Mapping between technical scenarios and policy options...............................................................................7Table 3 Summary of the stakeholder groups...............................................................................................................8Table 4 Regulatory costs and benefits per stakeholder group and technical scenario................................................9Table 5 Mapping requirements and ICT costs...........................................................................................................11Table 6 Benefits per technical scenario (and stakeholder group)..............................................................................11Table 7 Mapping of the data collection methods per stakeholder group....................................................................12Table 8 List of documents for desk research.............................................................................................................12Table 9 List of stakeholders to consult.......................................................................................................................13Table 10 Summary of the list of assessment criteria and related weightings.............................................................13Table 11 Comparison of the technical scenarios.......................................................................................................15Table 12 Risk Log......................................................................................................................................................17Table 13 Issue Log.....................................................................................................................................................18Table 14 Decision Log................................................................................................................................................18
Page 4 of 21

ICT Inception Report template
1. IntroductionThe ICT Inception Report template is developed to support the policy makers and ICT experts going through a
detailed ICT assessment. Pre-formatted so as to follow the Commission proposed methodology for assessing ICT
impacts, it serves as a starting point for defining the scope and preparing an ICT assessment.
As a result, this template should be filled-in by policy makers and ICT experts and ideally submitted for review to the
Inter-Service Steering group (including the initiative lead DG) before the actual assessment of ICT impacts
(including data collection activities).
[The introduction should include:
A summary of the context and background of the initiative going under the assessment of ICT impacts;
The purpose of any assessment of ICT impacts in general and in the particular case of the concerned
initiative;
The purpose of the document and how it is articulated.]
Page 5 of 21

ICT Inception Report template
2. Methodology
The proposed methodology for assessing ICT impacts comprises three (3) steps, namely: Step I: Define the scope
of the ICT assessment; Step II: Prepare the ICT assessment; Step III: Assess the ICT impacts.
2.1. Step I: Define the scope of the ICT assessment
The first step of the methodology aims to define the scope of the ICT assessment of a new Commission initiative:
[Include the name of the new Commission initiative and information on its context and background].
For this purpose, the following key elements should be identified prior the actual assessment of ICT impacts: the
ICT relevance of the policy problem and objectives (Section 2.1.1) and the technical scenarios (Section 2.1.2).
2.1.1 Identify the ICT relevance of the policy problem and objectives
[Describe the policy problem and objectives related to this new Commission initiative as identified in the regulatory
IA and explain how ICT or Internet drivers are linked to the problem and could contribute to achieving the objectives in an efficient and effective way.
In relation to the problem definition, you should address the following questions:
Are there insufficient/outdated ICT means influencing the problem?
Are there trends indicating that digital technology could change the nature of the problem?
How will the problem evolve over time if digital technologies are not used as needed?
Ensure that you set the objectives of the present study so that they are aligned and serve well the policy objectives.]
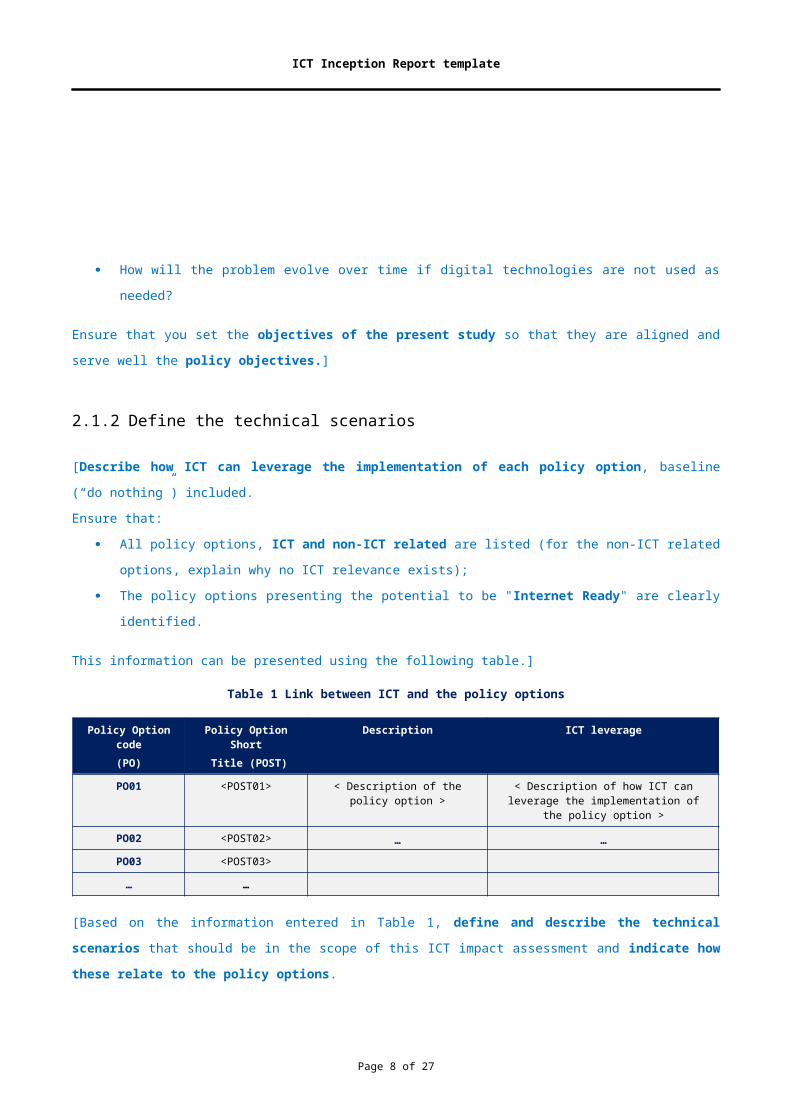
2.1.2 Define the technical scenarios
[Describe how ICT can leverage the implementation of each policy option, baseline (“do nothing”) included.
Ensure that:
All policy options, ICT and non-ICT related are listed (for the non-ICT related options, explain why no ICT
relevance exists);
The policy options presenting the potential to be "Internet Ready" are clearly identified.
Page 6 of 21

ICT Inception Report template
This information can be presented using the following table.]
Table 1 Link between ICT and the policy options
Policy Option code(PO)
Policy Option Short Title (POST)
Description ICT leverage
PO01 <POST01> < Description of the policy option > < Description of how ICT can leverage the implementation of the policy option >
PO02 <POST02> … …
PO03 <POST03>
… …
[Based on the information entered in Table 1, define and describe the technical scenarios that should be in the
scope of this ICT impact assessment and indicate how these relate to the policy options.
Table 2 can be used to facilitate the mapping between policy options and technical scenarios.
Table 2 Mapping between technical scenarios and policy options
Technical Scenariocode (TS)
Technical ScenarioShort Title (TSST)
Description Related Policy Option(code and Short Title)
TS01 <TSST01> < Description of the technical scenario, including a list of main
requirements1 >
< List of policy options for which the technical scenario can be used : PO-<POST>
TS02 <TSST02> … …
TS03 <TSST03>
… …
While one technical scenario can be defined for several policy options; one policy option can also be implemented
by different technical scenarios. The ultimate objective of the assessment of the costs and benefits of each technical
scenario is to provide an input to policy makers on the level of ICT impacts of each policy option.]
Figures and graphs can be added to illustrate the technical scenarios selected.
1 Requirements can be business, functional or non-functional, depending on the amount of detail available to perform the ICT assessment.
Page 7 of 21
ICT Inception Report template
2.2. Step II: Prepare the ICT assessment
The second step of the methodology aims to prepare the ICT assessment through the identification of four key
elements:
Stakeholders affected by the technical scenarios (Section 2.2.1);
ICT cost-benefit model related to the technical scenarios/requirements (Section 2.2.2);
Data collection methods to be employed (Section 2.2.3);
Assessment criteria to be used for choosing the preferred technical scenario (Section 2.2.4).
2.2.1 Analyse stakeholders
[Based on the different stakeholder groups affected (either positively or negatively) by the policy options, profile the ones who will be specifically affected by the technical scenarios defined in section 2.1.2 (e.g. size and role of
each stakeholder group, description of how they are affected by the technical scenarios).
The profile of each stakeholder group can be summarised using Table 3.
Table 3 Summary of the stakeholder groups
StakeholderGroup code
(SG)
Stakeholder Group Name (SGN)
Size of the stakeholder group Description of the stakeholder group
SG01 < SGN01 > < Size of the stakeholder group N°01 (in number of persons)>
< Description of the role of the stakeholder group N°01 and how they are affected by the technical scenarios.>
SG02 < SGN02 > … …
… …
At the end of this analysis, all potential impacts – positive or negative – should be mapped out according to the
specific parties that would be affected. For this purpose, the impacts identified in Table 3 should be mapped to the regulatory costs and benefits described in the Better Regulation guidelines 20152. A linkage between a
regulatory cost or benefit and the related stakeholder group affected can be denoted by ticking the concerned
cell.
The mapping can be performed using Table 4 (for each technical scenario).]
2 SWD(2015) 111 final, Commission Staff Working Document, Better Regulation Guidelines, {COM(2015) 215 final} {SWD(2015) 110 final}, Strasbourg, 19.5.2015.
Page 8 of 21

ICT Inception Report template
Table 4 Regulatory costs and benefits per stakeholder group and technical scenario
Technical Scenario code (TS) and Short Title (TSST): TS-<TSST>
Category Sub-categoryStakeholder Group code (SG) and Name (SGN)SG01-<SGN01> SG02-<SGN02> …
CO
STS
Direct Direct compliance costs
Regulatory charges
Substantive compliance costs
Administrative burdens
Hassle costs
Hassle costs
Enforcement One-off adaptation costs
Information costs and administrative burdens
Monitoring
Adjudication
Enforcement
Indirect Indirect compliance costs
Indirect compliance costs
Other indirect costs
Substitution effects
Transaction costs
Reduced competition and inefficient resource allocation
Reduced market access
Reduced investment and innovation
Uncertainty and investment
BEN
EFIT
S
Direct Improved well-being
Improved market efficiency
Indirect Benefits from third-party compliance with legal rules
Wider macroeconomic benefits
Other, non monetizable benefits
Assuming that ICT costs are mainly substantive compliance costs or indirect compliance costs (as
highlighted in Table 4), for the other categories of costs and for all categories of benefits, estimates should be
performed in accordance to the Better Regulation guidelines3 and toolbox4 2015.]
3 SWD(2015) 111 final, Commission Staff Working Document, Better Regulation Guidelines, {COM(2015) 215 final} {SWD(2015) 110 final}, Strasbourg, 19.5.2015.4 Better Regulation Toolbox, complementing SWD(2015) 111 final, Commission Staff Working Document, Better Regulation Guidelines, {COM(2015) 215 final} {SWD(2015) 110 final}, Strasbourg, 19.5.2015.
Page 9 of 21

ICT Inception Report template
2.2.2 Build the ICT cost-benefit model
ICT costs
[Map the main requirements5 related to each technical scenario to ICT costs, using VAST6 taxonomy and
taking into account whether these costs are one-off or ongoing. Following VAST, five categories of costs should be
analysed while defining the mapping between requirements and ICT costs:
1. Infrastructure costs provide the total (anticipated) cost of the hardware (e.g. network, servers, storage)
and software (e.g. licences, libraries) required to develop, support, operate and maintain the online
collection system;
2. Development costs provide the total (anticipated) cost (human resources) for the development of
the system (e.g. analysis and process re-engineering activity, coding activity, project management activity,
test activity, configuration & change management activity, deployment activity);
3. Maintenance costs provide the total (anticipated) cost (human resources) in person days per year to
maintain the system (e.g. activities related to both corrective maintenance and evolving maintenance);
4. Support costs provide the total (anticipated) cost (human resources) in person days per year to
support the system, its users and end-users;
5. Training costs are related to the costs to train systems’ users.
Table 5 can be used to perform this mapping. For one-off costs, a simple linkage between the requirement and the
category of costs can be denoted by ticking the concerned cell. For ongoing costs, the number of years during which the cost is foreseen should be added in the concerned cell.]
5 Requirements can be business, functional or non-functional, depending on the amount of detail available to perform the ICT assessment.6 Value Assessment Tool guidelines, European Commission, Directorate-General for Informatics, 2010.
Page 10 of 21

ICT Inception Report template
Table 5 Mapping requirements and ICT costs
Requirements Infrastructure Development Maintenance Support TrainingOne-off Ongoing One-off Ongoing One-off Ongoing One-off Ongoing One-off Ongoing
TS01 <Requirement n°01> <number
of years> <number
of years> <number
of years> <number
of years> <number
of years>
<Requirement n°02> … … … … …
… … … … … …
TS02 <Requirement n°01> … … … … …
<Requirement n°02> … … … … …
… … … … … …
…
<Requirement n°01> … … … … …
… … … … … …
At a later stage the ticks and number of years will be replaced by the ICT costs associated to each requirement.
These costs will provide an estimate of the Total Cost of Ownership7 (TCO) for each technical scenario assessed.
ICT benefits
[Identify all the benefits related to each technical scenario and for each stakeholder group and map them to their
corresponding category of regulatory benefits, as defined in the Better Regulation guidelines8 and toolbox9 2015.
Table 6 can then be used to describe each type of regulatory benefits, at least qualitatively and, when possible,
quantitatively.]
For more information on how to identify and estimate benefits, please refer to the ISA method.
Table 6 Benefits per technical scenario (and stakeholder group)
TECHNICAL SCENARIO
Qualitative description Quantitative description
Stakeholder group N°1Benefits Improved well-being
7 The TCO of an information system defines the total estimated cost to develop the system, to put it into production, to operate it, to support it, to maintain it, to phase it out at the end, etc. The cost estimation should be as comprehensive as possible and include all costs from the very inception of the system until its phase out.8 SWD(2015) 111 final, Commission Staff Working Document, Better Regulation Guidelines, {COM(2015) 215 final} {SWD(2015) 110 final}, Strasbourg, 19.5.2015.9 Better Regulation Toolbox, complementing SWD(2015) 111 final, Commission Staff Working Document, Better Regulation Guidelines, {COM(2015) 215 final} {SWD(2015) 110 final}, Strasbourg, 19.5.2015.
Page 11 of 21

ICT Inception Report template
TECHNICAL SCENARIOImproved market efficiency
Benefits from third-party compliance with legal rules
Wider macroeconomic benefits
Other, non monetizable benefits
Stakeholder group N°X
Benefits Improved well-being
Improved market efficiency
Benefits from third-party compliance with legal rules
Wider macroeconomic benefits
Other, non monetizable benefits
The assessment of the benefits will provide inputs when comparing the technical scenarios against a set of
assessment criteria (please refer to Section 2.3.2).
Page 12 of 21

ICT Inception Report template
2.2.3 Define the data collection methods
[Based on the stakeholder analysis results and on the specificities of each data collection method, define the most appropriate data collection method(s) to get inputs on the ICT impacts of the technical scenarios for each
stakeholder group, whether positive or negative, qualitative or quantitative.
Complete the following table to depict the mapping between the stakeholder groups and data collection methods to use.]
For more explanation on the specificities of each research method, please refer to the ISA method.
Table 7 Mapping of the data collection methods per stakeholder group
Stakeholder Group code (SG) and Name (SGN)
Des
k re
sear
ch
Inte
rvie
ws
Focu
s gr
oups
Que
stio
nnai
re
surv
eys
Wor
ksho
p
Oth
ers
SG01-<SGN01>
SG02-<SGN02>
…
[Define the list of documents that should be analysed with desk research.
This information can be presented using the following table.]
Table 8 List of documents for desk research
ID1 < Title > < Author(s) > < Year of publication > < Country, city of Publisher > < Hyperlink >
2 < Title > < Author(s) > < Year of publication > < Country, city of Publisher > < Hyperlink >
3 …
[Define the list of stakeholders who should be consulted, via e.g. interviews, questionnaire surveys and workshops as well as the purpose of these consultations.
This information can be presented using the following table.]
Table 9 List of stakeholders to consult
Stakeholder Group code (SG) and Name (SGN)
Name/ Surname Organisation Data Collection method
SG01-<SGN01>
SG02-<SGN02>
…
Page 13 of 21

ICT Inception Report template
Stakeholder Group code (SG) and Name (SGN)
Name/ Surname Organisation Data Collection method
2.2.4 Define the assessment criteria
[Define the list of criteria (e.g. efficiency, effectiveness, coherence) to be used to evaluate the technical scenarios.
In line with the Better Regulation guidelines 201510, the main assessment criteria against which the technical
scenarios should be compared are effectiveness and efficiency. Additional ones, such as the technical feasibility,
coherence, relevance and EU added value of the technical scenarios, may be introduced as needed.
Drill down each criterion into sub-criteria (when possible) and assign a weighting to each of these sub-criteria11. The sum of these weightings will provide the weighting at criterion level.
Table 10 can be used to display the list of criteria, sub-criteria and their related weightings.]
For more explanation on how to assign weightings to the different criteria, please refer to the ISA method.
Table 10 Summary of the list of assessment criteria and related weightings
Weighting(assessment
criteria)
Assessment criteria Weighting(sub-criteria)
Sub-criteria
W 1Efficiency N/A N/A
W 2=∑m=1
M 2
w2 , mEffectiveness w2,1 < Name and description of sub-criterion N°1 >
w2,2 < Name and description of sub-criterion N°2 >
w2 , M 2
< Name and description of sub-criterion N°M2>
W K=∑m=1
M k
wK ,m< Name and description of the assessment criterion N°K>
wK ,1 < Name and description of sub-criterion N°1 >
wK ,M k
< Name and description of sub-criterion N°Mk >
10 SWD(2015) 111 final, Commission Staff Working Document, Better Regulation Guidelines, {COM(2015) 215 final} {SWD(2015) 110 final}, Strasbourg, 19.5.2015.11 If sub-criteria cannot be defined, then weightings should be assigned to the assessment criteria directly.
Page 14 of 21

ICT Inception Report template
2.3. Step III: Assess the ICT impacts
The third and last phase of the methodology aims to conduct the ICT assessment. For this purpose, two key actions
have been identified, as listed below:
Page 15 of 21

ICT Inception Report template
Collect and analyse data (sub-section 2.3.1);
Compare the technical scenarios and make recommendations on the policy options (sub-section 2.3.2).
2.3.1 Collect and analyse data
[Explain how you intend to control the quality of the collected data. For instance, you can cross-check the
coherence, reliability and validity of the information/data collected, by applying different methods, using different
data sources and/or consulting different experts (triangulate).
RACER (Relevant, Accepted, Credible, Easy to monitor and Robust against manipulation) technique can also be
used to control data quality, as mentioned in the Better Regulation toolbox12.
Relevant: closely linked to the objectives to be reached (in this case, measured). Relevance indicators
should not be overambitious and should measure the right thing (e.g. a target indicator for health care could
be to reduce waiting times but without jeopardising the quality of care provided).
Accepted: The role and responsibilities for the indicator need to be well defined (e.g. if the indicator is the
handling time for a grant application and the administrative process is partly controlled by Member States
and partly by the EU then both sides would assume only partial responsibility).
Credible: Indicators should be simple and robust, unambiguous and easy to interpret. If necessary,
composite indicators might need to be used instead – such as country ratings, well-being indicators, but
also ratings of financial institutions and instruments. These often consist of aggregated data using
predetermined fixed weighting values. As they may be difficult to interpret, they should be used to assess
broad context only.
Easy to monitor (e.g. data collection should be possible at low cost).
Robust against manipulation: e.g. if the target is to reduce administrative burdens to businesses, the
burdens might not be reduced, but just shifted from businesses to public administration.
Explain how you will analyse the data so as to come up with an assessment of the (regulatory) costs and
benefits of each technical scenario, per group of stakeholders.]
For more information on how to design and address an interview guide or a questionnaire survey, or how to prepare and animate a workshop or focus group, please refer to the ISA method.
For more information on the quality controls, please refer to the ISA method.
12 Better Regulation Toolbox #35 Monitoring arrangements and indicators, complementing SWD(2015) 111 final, Commission Staff Working Document, Better Regulation Guidelines, {COM(2015) 215 final} {SWD(2015) 110 final}, Strasbourg, 19.5.2015.
Page 16 of 21

ICT Inception Report template
2.3.2 Compare the technical scenarios and make recommendations on the policy
options
[Explain that you will evaluate how well each technical scenario meets the assessment criteria defined in Section
2.2.4, taking into account the key findings from the data analysis and the weighting attributed to each assessment
criterion:
Assessment criteria could be of both types: quantitative and qualitative. For quantitative assessments, estimate the monetary value (monetised costs minus monetised
benefits). This is usually the case for efficiency, some or all of effectiveness, as well as for other
assessment criteria as appropriate.
In any case, use a scoring mechanism from 1 (lowest) to N (highest) in order to rank the technical
scenarios against each sub-criterion and criterion.
"N" corresponds to the number of scenarios assessed: if three (3) technical scenarios are compared, the scoring mechanism should go from 1 (lowest) to 3 (highest=most favoured); if four (4) technical scenarios are compared, the scoring mechanism should go from 1 (lowest) to 4 (highest).
The following table could be used for the scoring mechanism. Try to complete it, if possible, with some preliminary data. If this is not possible, the table will be used for the ICT Final Report.
Page 17 of 21

ICT Inception Report template
Table 11 Comparison of the technical scenarios
Assessment criteria Weighting Technical Scenario code (TS) and Short Title N°1TS01-<TSST>
… Technical Scenario code (TS) and Short Title N°NTSN-<TSST>
Quantitative criteria, e.g. efficiency, effectiveness, etc.
Assessment criterion N°1 (monetised) W 1 S1 ¿) S1 ¿)
Total monetary value (in EUR)
Qualitative criteria, e.g. effectiveness, technical feasibility, coherence, relevance, EU added value).
Assessment criterion N°2 W 2 S2(1) S2(N )Sub-criterion N°1 w2,1 S2,1(1) … S2,1(N )Sub-criterion N°2 w2,2 S2,2(1) S2,1(N )Sub-criterion N°M2 w2 , M 2
S2 , M 2(1) S2 , M 2
(N )Assessment criterion N°K W K SK (1) SK (N )Sub-criterion N°1 wK ,1 SK ,1(1) … SK ,1(N )Sub-criterion N°Mk wK ,M k
SK ,M k(1) SK ,M k
(N )Total Score
Finally, explain that you will determine the implications of these results on the policy options and make recommendations.]
For more explanation on the formula used to calculate the preferred technical scenario, please refer to the ISA method.
Page 18 of 21

ICT Inception Report template
3. Work Plan[Define the timeline of the assessment of ICT implications, specifying the starting dates and ending dates of each
of the activities mentioned above, the dependencies of the different activities and the key milestones to achieve.]
Page 19 of 21

ICT Inception Report template
4. Risks, Issues and Decisions[Log the risks, issues and key decisions made (if any) before starting the assessment and update them regularly along the exercise . Following project management
methodologies, such as PM², risks, issues and decisions should be documented (e.g. risks likelihood, level and impact, mitigation actions).
The following tables can be used to respectively log the risks, issues and decisions identified during the assessment.]
Table 12 Risk Log
Risk identification and description Risk Assessment Risk Response
ID Risk Name Risk Description & Details
Status Identification Date
Likelihood Impact Risk Level Risk Owner Risk mitigation
action
Mitigation action Details
RLO1 <Short title> <Detailed text 1> <Proposed> <Date XX/XX/XXX>
<from 1 to 5> <from 1 to 5> <Likehood*Impact>
<Name> <Avoid> <Detailed text>
RLO2 <Short title> <Detailed text 2> <Investigating> … … … … <Reduce> …
RLO3 <Short title> <Detailed text 3> <Waiting for Approval>
<Accept>
RLO4 <Short title> <Detailed text 4> <Approved> <Transfer/ Share>
RLO5 <Short title> <Detailed text 5> <Rejected>
RL06 <Short title> <Detailed text 6> <Closed>
Page 20 of 21

ICT Inception Report template
Table 13 Issue Log
Issue identification and Description Issue Assessment and Action Description
ID Issue name Issue Description & Details Status Identification Date
Urgency Impact Size Issue owner
ILO1 <Short title> <Detailed text 1> <Open> <Date XX/XX/XXX>
<from 1 to 5> <from 1 to 5> <from 1 to 5> <Name>
ILO2 <Short title> <Detailed text 2> <Postponed> … … … … …
ILO3 <Short title> <Detailed text 3> <Resolved>
ILO4 <Short title> <Detailed text 4>
ILO5 <Short title> <Detailed text 5>
Table 14 Decision Log
Decision identification Ownership Decision implementation
ID Decision name Decision description Decision owner Decision date
DLO1 <Short title> <Detailed text 1> <Name> <Date XX/XX/XXX>
DLO2 … … … …
DLO3
DLO4
DLO5
For more information on the content on how to complete these tables, please refer to PM² templates.
Page 21 of 21


![KS_SC9_D03.06_Final template · Web viewUnit [Name] ICT Final Report template Assessment of ICT impacts of the [Name of the initiative] Date: [Issue Date] Doc. Version: [5.00] This](https://img.pdfslide.us/doc/110x75/5f08de837e708231d4241e15/kssc9d0306final-template-web-view-unit-name-ict-final-report-template-assessment.jpg)


![School Specific ICT Equipment template v5 FINAL issued for ... Web viewOutput Specification. School-specific ICT Equipment Template Annex SS5. Version 6 [Insert full name of school]](https://img.pdfslide.us/doc/110x75/5a733b787f8b9ab1538e5d22/school-specific-ict-equipment-template-v5-final-issued-for-a-doc-fileaa.jpg)