Embed Size (px)
Citation preview

Deutsche Bank Markets Research
North America
United States
Industrials
Chemicals/Commodity
Periodical
Railcar & PetroChemical Update
Date
22 July 2016
Industry Update
US Chemical Shipments -0.7%. Ethane down 2 c/gal to 18 c/gal
Railcar loadings 4-week moving average down 0.7%. Weekly loadings up 2.9%
________________________________________________________________________________________________________________
Deutsche Bank Securities Inc.
Deutsche Bank does and seeks to do business with companies covered in its research reports. Thus, investors should be aware that the firm may have a conflict of interest that could affect the objectivity of this report. Investors should consider this report as only a single factor in making their investment decision. DISCLOSURES AND ANALYST CERTIFICATIONS ARE LOCATED IN APPENDIX 1. MCI (P) 057/04/2016.
David Begleiter
Research Analyst
(+1) 212 250-5473
Jermaine Brown
Research Associate
(+1) 212 250-3624
Top picks
Dow Chemical (DOW.N),USD52.50 Buy
DuPont (DD.N),USD67.85 Buy
Eastman Chemical (EMN.N),USD72.02 Buy
Source: Deutsche Bank
Weekly price performance
-15.0% -10.0% -5.0% 0.0% 5.0% 10.0%
FOE
SHW
CMP
ALB
ECL
FMC
VAL
POT
PX
APD
CBT
XLB
PPG
EVGN
GRA
S&PCOMP
CE
KRO
AXLL
EMN
OMN
FUL
DOW
DD
AXTA
HUN
WLKP
MON
OLN
LYB
MOS
TSE
CC
Source: Thomson Reuters, Deutsche Bank
K
We maintain our equal-weight stance on the sector Within the chemicals sector, our top
ideas are Dow Chemical (DOW,
$52.50, Buy, TP $64), Eastman
Chemical (EMN, $72.02, Buy, TP $85)
and DuPont (DD, $67.85, Buy, TP $80)
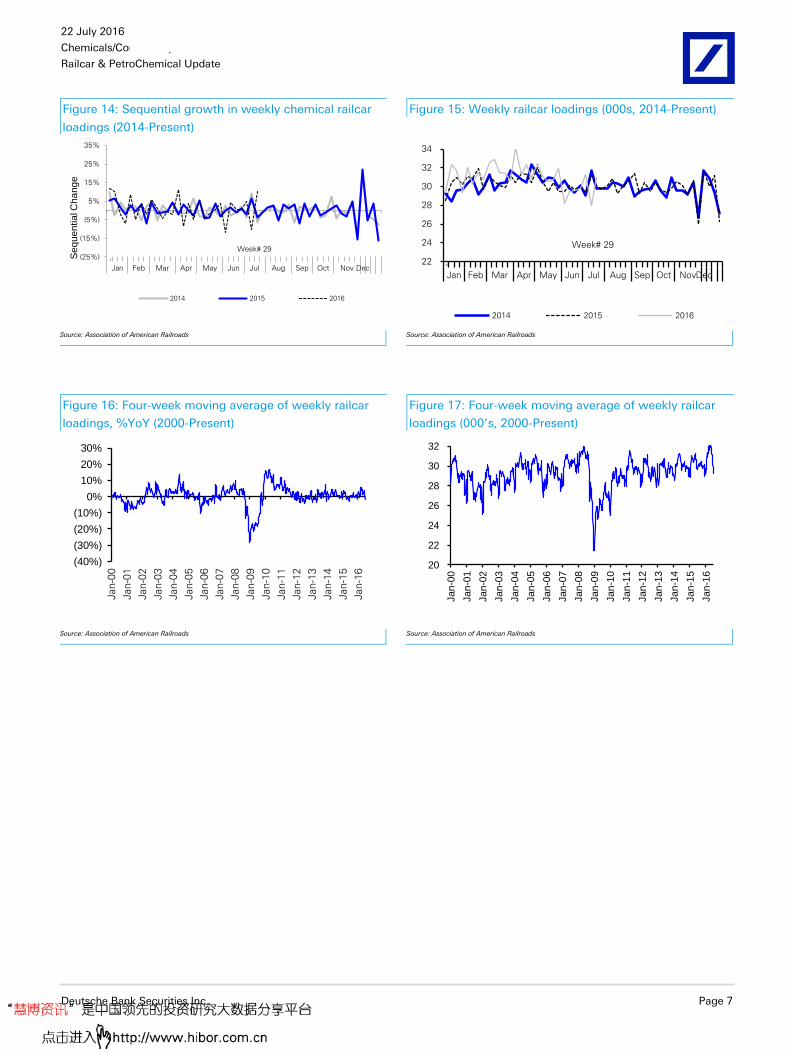
The 4-week moving average of chemical railcar loadings declined 0.7% in Week #29 (ended 07/16/2016) vs. a 1.5% decrease the prior week. Loadings YTD are up 1.9%. Chemical railcar loadings represent 30% of total US chemical shipment tonnage (followed by trucks, barges, and pipelines), offering a trend of broader chemical industry activity and demand. The more volatile measure of weekly loadings increased 2.9% YoY (vs a 10.3% decline in the prior week) and increased 10.4% sequentially (vs. a 10.3% decrease in the prior week).
Ethane prices down 2 c/gal to 18 c/gal. Propane down 1 c/gal to 47 c/gal Ethane prices fell 2 c/gal this week to 18 c/gal (vs its fuel value of 18 c/gal). While US ethane supply/demand fundamentals are currently loose (ethane rejection remains at near-record levels of 500-600k bpd), we expect ethane to trade at or near its fuel value, or 17-20 c/gal, in 2H16. However, starting in early ’17, we expect ethane supply/demand fundamentals to tighten due to increased exports (led by Enterprise Products’ new 200k bpd ethane export facility which is expected on-line Q3’16) and the start-up of 7 greenfield ethylene crackers in ’17-’18 (up to 540k bpd of demand). As the market tightens, we expect ethane to trade towards its historical value of fuel value plus 10 c/gal - with the premium accounting for fractionation, transportation and storage costs. Based on DB’s ’17 US Natural Gas price forecast of $3.13/MMBtu , this results in an ethane price of 30 c/gal.
Propane prices fell 1 c/gal this week to 47 c/gal. Propane inventories were flat this week at 87MM bbls and are 24% and 36% above their 3- and 5-year averages, respectively. Longer term, we expect propane inventories to decline due to higher exports (up 12% in ’15 vs 30% in ’14, expected to be up in ’16 vs ‘15).
Spot ethylene up 3 c/lb to 30 c/lb. Margins expand 4 c/lb to 19 c/lb Spot ethylene prices rose 3 c/lb this week to 30 c/lb (vs the June contract price of 30.25 c/b). The spring turnaround season continues with three crackers currently down for maintenance. Spot deals for July delivery were completed at 27.25 to 31.5 c/lb with deals for August ranging from 27.375 to 31.0 c/lb. Spot ethylene margins expanded 4 c/lb this week to 19 c/lb on lower feedstock prices. Polymer grade (PG) propylene spot prices were higher this week with deals for July delivery completed between 31.25-32.0 c/lb. July PG and CG contract prices settled up 0.5 c/lb to 33.5 c/lb and 32.0 c/lb, respectively. The major propylene price drivers are steam cracker turnarounds opposite weak global propylene prices and the return to operation of both US PDH units.
8.1% of North American ethylene capacity expected to be offline in July IHS expects 8.1% of North American (NA) ethylene capacity to be offline in July vs 7.4% in June. Per IHS, Chevron Phillips’ Sweeny 22, TX cracker (2.4% of NA ethylene capacity) returned to service early this week. Lyondell’s Corpus Christi, TX, cracker (2.2% of NA ethylene capacity) remains offline for planned maintenance/expansion, with the restart delayed until late September from mid-August due to the combined impacts of a wet spring and hot summer. Westlake Lake Charles Petro 1 (1.7% of NA ethylene capacity) is in the process of restarting following the completion of planned maintenance and expansion work. For ’16, IHS is forecasting NA ethylene production losses of 3.8B lbs, or 4.8%, of NA ethylene capacity. This compares to NA ethylene production loses of 3.1B lbs, or 4.1%, of NA ethylene capacity in ‘15.
Distributed on: 07/22/2016 19:44:58GMT

22 July 2016
Chemicals/Commodity
Railcar & PetroChemical Update
Page 2 Deutsche Bank Securities Inc.Deutsche Bank Securities Inc.
Figure 1: Chemicals railcar loadings for week ended July 16, 2016 (Week# 29)
% YoY % Sequential
4-week moving average (0.7%) 1.1%
Prior week (1.5%) (1.2%)
Week ended 2.9% 10.4%
Prior week (10.3%) (10.3%)
YTD 2016 1.95%
Source: Association of American Railroads and Deutsche Bank
Figure 2: U.S. Ethylene Production Cash Costs - Spot Co-Production Credits
Weekly Avg. Cents/ Pound Change from Last Week
Purity Ethane 10.0 (0.5)
Propane 11.2 (1.0)
Co-Prod. Int. Lt. Naphtha 16.0 1.0
Butane 11.9 (0.3)
Light Naphtha 21.4 0.4
Gas Oil 22.8 (1.3)
Weighted Avg. 10.9 (0.5)
Source: IHS Chemical
Figure 3: Mt. Belvieu Ethane Purity Prices (North America) Figure 4: Mt. Belvieu Propane Non-TET (North America)
10
14
18
22
26
Jul-
15
Aug-1
5
Aug-1
5
Sep-1
5
Sep-1
5
Sep-1
5
Oct-
15
Oct-
15
Oct-
15
Nov-1
5
Nov-1
5
Dec-1
5
Dec-1
5
Dec-1
5
Jan-1
6
Jan
-16
Feb-1
6
Feb-1
6
Feb-1
6
Mar-
16
Mar-
16
Apr-
16
Apr-
16
Apr-
16
May-1
6
May-1
6
Jun
-16
Jun
-16
Jun
-16
Jul-
16
Jul-16
c/ gallon
20
30
40
50
60
Jul-15
Aug-1
5
Aug-1
5
Sep-1
5
Sep-1
5
Sep-1
5
Oct-
15
Oct-
15
Nov-1
5
Nov-1
5
Dec-1
5
Dec-1
5
Dec-1
5
Jan-1
6
Jan-1
6
Feb-1
6
Feb-1
6
Mar-
16
Mar-
16
Mar-
16
Apr-
16
Apr-
16
May-1
6
May-1
6
Jun-1
6
Jun-1
6
Jun-1
6
Jul-16
c/ gallon
Source: Bloomberg
Source: Bloomberg
Figure 5: US Ethylene Pipeline Gulf Coast FOB Spot
Prices (c/lb)
Figure 6: US Chemical Grade Propylene Gulf Coast FOB
Spot Prices (c/lb)
10.00
20.00
30.00
40.00
50.00
60.00
70.00
80.00
Sep-1
1
Dec-1
1
Mar-
12
Jun-1
2
Sep-1
2
Dec-1
2
Mar-
13
Jun-1
3
Sep-1
3
Dec-1
3
Mar-
14
Jun-1
4
Sep-1
4
De
c-1
4
Mar-
15
Jun-1
5
Sep-1
5
Dec-1
5
Mar-
16
Jun-1
6
10.00
20.00
30.00
40.00
50.00
60.00
70.00
80.00
90.00
Sep-1
1
Dec-1
1
Mar-
12
Jun-1
2
Sep-1
2
Dec-1
2
Mar-
13
Jun-1
3
Sep-1
3
Dec-1
3
Mar-
14
Jun-1
4
Sep-1
4
Dec-1
4
Mar-
15
Jun-1
5
Sep-1
5
Dec-1
5
Mar-
16
Jun-1
6
Source: IHS Chemical
Source: IHS Chemical

22 July 2016
Chemicals/Commodity
Railcar & PetroChemical Update
Deutsche Bank Securities Inc. Page 3
Figure 7: Propane Export Capacity (MM bbls/month)
2012 2013 2014 2015
Enterprise 3.5-4 7.5 7.5 9
Targa 1-1.5 3-3.5 5-5.5 5-5.5
Total 4.5-5.5 10.5-11 12.5-13 14-14.5 Source: Deutsche Bank, Enterprise, Targa
Figure 8: China Acetic Acid Spot Prices (CNY/ton)
1000
1500
2000
2500
3000
3500
4000
4500
Jan-1
3
Mar-
13
May-1
3
Jul-13
Sep
-13
Nov-1
3
Jan-1
4
Mar-
14
May-1
4
Jul-14
Sep
-14
Nov-1
4
Jan-1
5
Mar-
15
May-1
5
Jul-15
Sep
-15
Nov-1
5
Jan-1
6
Mar-
16
May-1
6
Jul-16
Source: Bloomberg Finance LP
Figure 9: US ethane-based ethylene production costs are
advantaged vs other regions (c/lb)
Figure 10: US ethane supply has been increasing steadily
since 2005 (‘000 of bpd)
0
5
10
15
20
25
Saudi Arabia
Western Canada
US Ethane
US Weighted Average
US Coprod. Int. Light
Southeast Asia
Naphtha
Northeast Asia
Naphtha
US Light Naphtha
West Europe Naphtha
400
500
600
700
800
900
1,000
1,100
1,200
1,300
1,400
Jun
-2001
Jun
-2002
Jun
-2003
Jun
-2004
Jun-2
005
Jun-2
006
Jun
-2007
Jun
-2008
Jun
-2009
Jun
-2010
Jun
-2011
Jun
-2012
Jun
-2013
Jun
-2014
Jun
-2015
Source: IHS Chemical
Source: IHS Chemical
22 July 2016
Chemicals/Commodity
Railcar & PetroChemical Update
Page 4 Deutsche Bank Securities Inc.
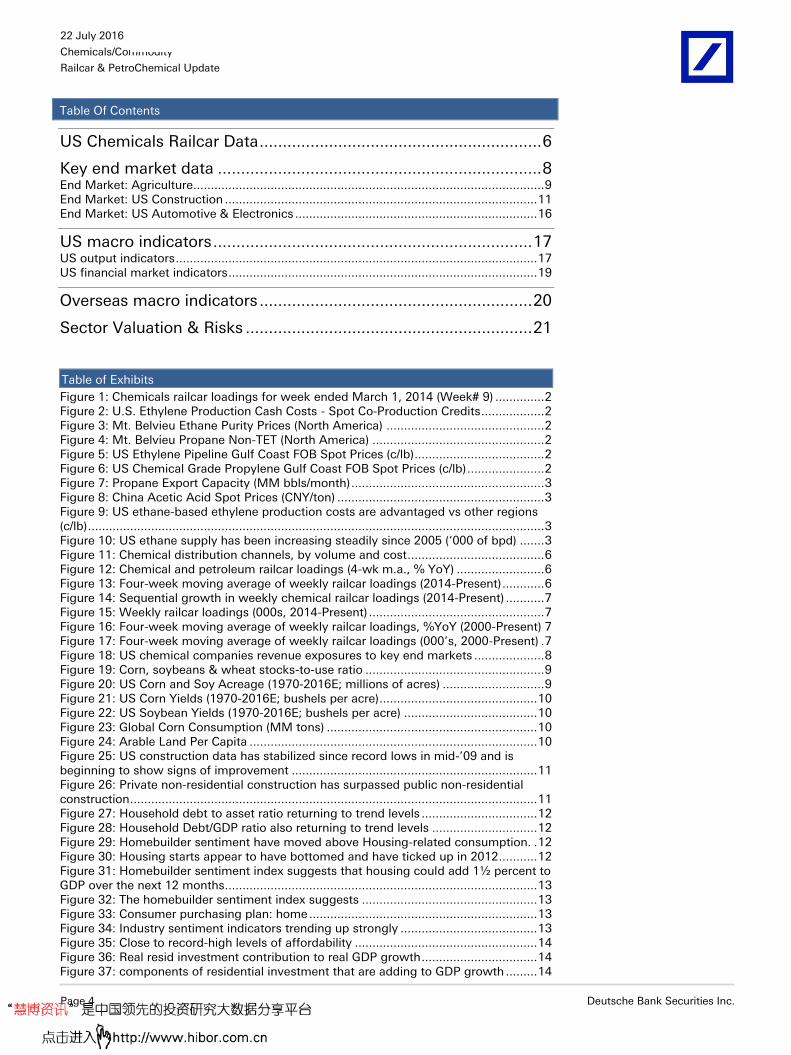
Table Of Contents
US Chemicals Railcar Data ............................................................. 6
Key end market data ...................................................................... 8 End Market: Agriculture.................................................................................................... 9 End Market: US Construction ......................................................................................... 11 End Market: US Automotive & Electronics ..................................................................... 16
US macro indicators ..................................................................... 17 US output indicators ....................................................................................................... 17 US financial market indicators ........................................................................................ 19
Overseas macro indicators ........................................................... 20
Sector Valuation & Risks .............................................................. 21
Table of Exhibits
Figure 1: Chemicals railcar loadings for week ended March 1, 2014 (Week# 9) .............. 2 Figure 2: U.S. Ethylene Production Cash Costs - Spot Co-Production Credits .................. 2 Figure 3: Mt. Belvieu Ethane Purity Prices (North America) ............................................. 2 Figure 4: Mt. Belvieu Propane Non-TET (North America) ................................................. 2 Figure 5: US Ethylene Pipeline Gulf Coast FOB Spot Prices (c/lb) ..................................... 2 Figure 6: US Chemical Grade Propylene Gulf Coast FOB Spot Prices (c/lb) ...................... 2 Figure 7: Propane Export Capacity (MM bbls/month) ....................................................... 3 Figure 8: China Acetic Acid Spot Prices (CNY/ton) ........................................................... 3 Figure 9: US ethane-based ethylene production costs are advantaged vs other regions (c/lb) .................................................................................................................................. 3 Figure 10: US ethane supply has been increasing steadily since 2005 (‘000 of bpd) ....... 3 Figure 11: Chemical distribution channels, by volume and cost ....................................... 6 Figure 12: Chemical and petroleum railcar loadings (4-wk m.a., % YoY) ......................... 6 Figure 13: Four-week moving average of weekly railcar loadings (2014-Present) ............ 6 Figure 14: Sequential growth in weekly chemical railcar loadings (2014-Present) ........... 7 Figure 15: Weekly railcar loadings (000s, 2014-Present) .................................................. 7 Figure 16: Four-week moving average of weekly railcar loadings, %YoY (2000-Present) 7 Figure 17: Four-week moving average of weekly railcar loadings (000’s, 2000-Present) . 7 Figure 18: US chemical companies revenue exposures to key end markets .................... 8 Figure 19: Corn, soybeans & wheat stocks-to-use ratio ................................................... 9 Figure 20: US Corn and Soy Acreage (1970-2016E; millions of acres) ............................. 9 Figure 21: US Corn Yields (1970-2016E; bushels per acre) ............................................. 10 Figure 22: US Soybean Yields (1970-2016E; bushels per acre) ...................................... 10 Figure 23: Global Corn Consumption (MM tons) ............................................................ 10 Figure 24: Arable Land Per Capita .................................................................................. 10 Figure 25: US construction data has stabilized since record lows in mid-’09 and is beginning to show signs of improvement ...................................................................... 11 Figure 26: Private non-residential construction has surpassed public non-residential construction .................................................................................................................... 11 Figure 27: Household debt to asset ratio returning to trend levels ................................. 12 Figure 28: Household Debt/GDP ratio also returning to trend levels .............................. 12 Figure 29: Homebuilder sentiment have moved above Housing-related consumption. . 12 Figure 30: Housing starts appear to have bottomed and have ticked up in 2012 ........... 12 Figure 31: Homebuilder sentiment index suggests that housing could add 1½ percent to GDP over the next 12 months ......................................................................................... 13 Figure 32: The homebuilder sentiment index suggests .................................................. 13 Figure 33: Consumer purchasing plan: home ................................................................. 13 Figure 34: Industry sentiment indicators trending up strongly ....................................... 13 Figure 35: Close to record-high levels of affordability .................................................... 14 Figure 36: Real resid investment contribution to real GDP growth ................................. 14 Figure 37: components of residential investment that are adding to GDP growth ......... 14

22 July 2016
Chemicals/Commodity
Railcar & PetroChemical Update
Deutsche Bank Securities Inc. Page 5
Figure 38: Traffic of prospective buyers of new homes .................................................. 14 Figure 39: Conference board consumer confidence survey: plans to buy a new home within six months ........................................................................................................... 15 Figure 40: US home prices rising steadily ...................................................................... 15 Figure 41: North American auto builds ........................................................................... 16 Figure 42: North American Rigid PCBs board book-to-bill ratio ..................................... 16 Figure 43: US Chemicals and Petroleum Shipments ...................................................... 17 Figure 44: Chemicals Railcar Loadings, Capacity Utilization, and Industrial Production 17 Figure 45: Growth in railcar loadings is ahead of industrial production .......................... 18 Figure 46: ECRI Leading Index vs. Industrial Production ................................................ 18 Figure 47: Industrial Production vs. ISM PMI Index ........................................................ 18 Figure 48: Industrial Production vs. ISM Mfg. New Orders ............................................ 18 Figure 49: Industrial Production vs. Conference Board Leading Indicators .................... 18 Figure 50: Conference Board Leading Indicators vs. Real GDP ..................................... 18 Figure 51: Chemicals sector multiples vs the yield curve ............................................... 19 Figure 52: A steeper yield curve has previously led rising chemicals IP ......................... 19 Figure 53: Eurozone confidence indicators ..................................................................... 20 Figure 54: ZEW German economic sentiment indicator (12mo m.avg.) ......................... 20 Figure 55: OECD Europe CLI vs Euro area Industrial Production .................................... 20

22 July 2016
Chemicals/Commodity
Railcar & PetroChemical Update
Page 6 Deutsche Bank Securities Inc.
US Chemicals Railcar Data
Figure 11: Chemical distribution channels, by volume and cost
By tonnage (882MM tons) By cost* ($40.0 billion)
Rail 30% 20%
Truck 48% 67%
Waterborne 18% 10%
Pipeline, Air & Other 4% 3%
Source: American Chemistry Council. *Cost is cost of transportation, not value of product, 2010 data
Year to date, chemical railcar loadings are down 1.9%
Year to date, chemical railcar loadings are down approximately 1.9%.
Figure 12: Chemical and petroleum railcar loadings (4-wk m.a., % YoY)
(30%)
(25%)
(20%)
(15%)
(10%)
(5%)
0%
5%
10%
2 4 6 8
10
12
14
16
18
20
22
24
26
28
30
32
34
36
38
40
42
44
46
48
50
52
Jan Feb Mar Apr May Jun Jul Aug Sep Oct Nov Dec
Week# 29
Chemicals railcar loadings (4-wk m.a. % YoY)Ethanol-driven Increase in loadings (estimated from blending, 4-wk m.a. %YoY)Petroleum Products Railcar Loadings (4-wk m.a. % YoY
Source: Association of American Railroads
Figure 13: Four-week moving average of weekly railcar loadings (2014-Present)
23,000
25,000
27,000
29,000
31,000
33,000
2 4 6 8
10
12
14
16
18
20
22
24
26
28
30
32
34
36
38
40
42
44
46
48
50
52
Jan Feb Mar Apr May Jun Jul Aug Sep Oct Nov Dec
Week# 29
2014 2015 2016
Source: Association of American Railroads
22 July 2016
Chemicals/Commodity
Railcar & PetroChemical Update
Deutsche Bank Securities Inc. Page 7
Figure 14: Sequential growth in weekly chemical railcar
loadings (2014-Present)
Figure 15: Weekly railcar loadings (000s, 2014-Present)
(25%)
(15%)
(5%)
5%
15%
25%
35%
-
Jan Feb Mar Apr May Jun Jul Aug Sep Oct Nov Dec
Se
qu
en
tia
l Ch
an
ge
Week# 29
2014 2015 2016
22
24
26
28
30
32
34
-
Jan Feb Mar Apr May Jun Jul Aug Sep Oct NovDec
Week# 29
2014 2015 2016
Source: Association of American Railroads
Source: Association of American Railroads
Figure 16: Four-week moving average of weekly railcar
loadings, %YoY (2000-Present)
Figure 17: Four-week moving average of weekly railcar
loadings (000’s, 2000-Present)
(40%)
(30%)
(20%)
(10%)
0%
10%
20%
30%
Jan-0
0
Jan-0
1
Jan-0
2
Jan-0
3
Jan-0
4
Jan-0
5
Jan-0
6
Jan-0
7
Jan-0
8
Jan-0
9
Jan-1
0
Jan-1
1
Jan-1
2
Jan-1
3
Jan-1
4
Jan-1
5
Jan-1
6
20
22
24
26
28
30
32 Jan
-00
Jan
-01
Jan
-02
Jan
-03
Jan
-04
Jan
-05
Jan
-06
Jan-0
7
Jan
-08
Jan
-09
Jan
-10
Jan
-11
Jan-1
2
Jan
-13
Jan
-14
Jan
-15
Jan
-16
Source: Association of American Railroads
Source: Association of American Railroads

22 July 2016
Chemicals/Commodity
Railcar & PetroChemical Update
Page 8 Deutsche Bank Securities Inc.
Key end market data
Figure 18: US chemical companies revenue exposures to key end markets
Company Auto & Transport Construction Electronics Comments
Air Products 15% Energy 24%, Gen'l Mfg 15%, Chemicals 17%, Metals 10%, Medical 7%, Food 3%, Others 10%
Airgas 2% 13% - Industrial & Mfg: 25% ; Repair & Maintenance: 27% Retail & Wholesale: 4% Other 3% Medical: 9% ; Food; 6%; Analytical: 2% Utilities: 2%, Petrochemical: 7% “Auto & Transport” is only Transport and no Auto
Albemarle 6% 9% 15% Refining 32%, Pharma/ Ag 12%, Industrial 10%, Packaging 9%, Oilfield 4%, Other 3%
Cabot 15% 10% 10% Tire 45% ; Others 20%
Celanese 11% 3% Filter Media 22%; Paints & Coatings 13%; Consumer & Medical Apps 12%; Consumer & Industrial Adhesives; Industrial Performance Apps 7%; Textiles 5% ; Food & Beverage 4%; Paper & Packaging 3%
DuPont 20% 10% 9% Agriculture/ food 21%; Food Ingred, Ref & packaging 8%; Other packaging 3%; Chemicals/ petchem 5%; Textile/ apparel 5%; Plastics 3%; Other industrial 7%; Aerospace 4%; Paper 1%; Healthcare 1%; Personal care 3%.“Construction” includes residential, commercial construction”
Dow Chemical 5% 18% 7% Consumer & Institutional 22%, Agriculture 15%
Ferro 10% 34% 21% Appliances 8%; Containers 8%; Household furnishings 7%; Industrial 6%; Others 6%
HB Fuller 10% Adhesives: 72%; Paints: 8%; Packaging: 4%; Insulating glass: 4%; Consumer: 2%
LyondellBasell 7% 10% Refining/Fuels: 35%; Packaging: 18%; Consumer: 12%; Coatings: 4%; Textiles/Furnishings:4%; Other:10%. “Auto & Transport” consists of Transportation only. “Construction” consists of “Building & Construction”.
PPG 30% 27% Consumer goods 21%; Industrial goods 10%; Chemical products: 5%; Aerospace 4%; Marine 3% (Auto consists of OEM 19%, Auto aftermarket 11%)
Praxair - - 7% Manufacturing 24%; Chemicals 10%; Energy 13%; Food and Beverage 7%; Aerospace 2%; Healthcare 10%; Metals 16%; Other 11%
Valspar 3% 30% - Industrial 36%, Packaging 21%, Other 10% “Auto & Transport” is automotive refinish and “Construction” is architectural paints
Source: Company data, Deutsche Bank estimates

22 July 2016
Chemicals/Commodity
Railcar & PetroChemical Update
Deutsche Bank Securities Inc. Page 9
End Market: Agriculture
Figure 19: Corn, soybeans & wheat stocks-to-use ratio
Source: Deutsche Bank, USDA
Figure 20: US Corn and Soy Acreage (1970-2016E; millions of acres)
35
45
55
65
75
85
95
105
70/7
1
73/7
4
76/7
7
79/8
0
82/8
3
85/8
6
88/8
9
91/9
2
94/9
5
97/9
8
00/0
1
03/0
4
06/0
7
09/1
0
12/1
3
15/1
6F
Corn Acres Planted Soybean Acres Planted
Source: Deutsche Bank, USDA

22 July 2016
Chemicals/Commodity
Railcar & PetroChemical Update
Page 10 Deutsche Bank Securities Inc.
Figure 21: US Corn Yields (1970-2016E; bushels per acre) Figure 22: US Soybean Yields (1970-2016E; bushels per
acre)
60
80
100
120
140
160
180
70/7
1
73/7
4
76/7
7
79/8
0
82/8
3
85/8
6
88/8
9
91/9
2
94/9
5
97/9
8
00/0
1
03/0
4
06/0
7
09/1
0
12/1
3
15/1
6F
20
25
30
35
40
45
50
70/7
1
73/7
4
76/7
7
79/8
0
82/8
3
85/8
6
88/8
9
91/9
2
94/9
5
97/9
8
00/0
1
03/0
4
06/0
7
09/1
0
12/1
3
15/1
6F
Source: Deutsche Bank, USDA
Source: Deutsche Bank, USDA
Figure 23: Global Corn Consumption (MM tons) Figure 24: Arable Land Per Capita
220
410
600
970
1090
0
200
400
600
800
1000
1200
1965 1980 2000 2020E 2030E
MM Tons
1.02
0.75
0.55
0.44 0.41
0
0.2
0.4
0.6
0.8
1
1.2
1961 1980 2000 2020E 2030E
Acres/Capita
Source: Global Insights
Source: Global Insights

22 July 2016
Chemicals/Commodity
Railcar & PetroChemical Update
Deutsche Bank Securities Inc. Page 11
End Market: US Construction
Figure 25: US construction data has stabilized since record lows in mid-’09 and is
beginning to show signs of improvement
(50%)
(40%)
(30%)
(20%)
(10%)
0%
10%
20%
30%
$0
$100
$200
$300
$400
$500
$600
$700
$800
$900
$1,000
'03
'04
'05
'06
'07
'08
'09
'10
'11
'12
'13
'14
'15
'16
Total non-res constr. May-16 = $685 Total res-constr. May-16 = $458
Total res-constr. %YOY; May-16 = 5.3% Total non-res constr. %YOY; May-16 = 1.2%
Source: Haver Analytics
Figure 26: Private non-residential construction has surpassed public non-residential
construction
-40%
-30%
-20%
-10%
0%
10%
20%
30%
40%
'02
'03
'04
'05
'06
'07
'08
'09
'10
'11
'12
'13
'14
'15
'16
Yo
Y c
han
ge
Mar-16 = 8.1%
May-16 = 8.1%
Private non-residential construction SAAR $ millions (% YoY, 3mo m.a.)
Public non-residential construction SAAR $ millions (% YoY, 3mo m.a.)
Source: Deutsche Bank, Haver Analytics, U.S. Census Bureau

22 July 2016
Chemicals/Commodity
Railcar & PetroChemical Update
Page 12 Deutsche Bank Securities Inc.
Figure 27: Household debt to asset ratio returning to
trend levels
Figure 28: Household Debt/GDP ratio also returning to
trend levels
Source: Federal Reserve Board, Haver Analytics, DB Global Market research
Source: Federal Reserve Board, Haver Analytics, DB Global Market research
Figure 29: Homebuilder sentiment have moved above
Housing-related consumption.
Figure 30: Housing starts ticked up in ’12 and have
continued to rise
-3%
-2%
-1%
0%
1%
2%
3%
4%
5%
6%
0
10
20
30
40
50
60
70
80
88
89
90
91
92
93
94
95
96
97
98
99
00
01
02
03
04
05
06
07
08
09
10
11
12
13
Homebuilders' sentiment (SA, All Good = 100, 1 qtr. lead (LHS)
Total housing-related consumption* % YOY (RHS)
0
20
40
60
80
100
300
700
1,100
1,500
1,900
2,300 '8
8'8
9'9
0'9
1'9
2'9
3'9
4'9
5'9
6'9
7'9
8'9
9'0
0'0
1'0
2'0
3'0
4'0
5'0
6'0
7'0
8'0
9'1
0'1
1'1
2'1
3'1
4'1
5'1
6
Housing Starts, 3mo m.a. (000s, LHS): May-16 = 1,134
Homebuilders Sentiment (SA, All Good = 100): 15
Source: NAHB, BEA *Furniture & household equipment, housing shelter and household operation
Source: Federal Reserve Board, Haver Analytics

22 July 2016
Chemicals/Commodity
Railcar & PetroChemical Update
Deutsche Bank Securities Inc. Page 13
Figure 31: Homebuilder sentiment index suggests that
housing could add 1½ percent to GDP over the next 12
months
Figure 32: The homebuilder sentiment index suggests
that home prices ticked up in ’14 and are rising
Source: NAHB, BEA , Haver Analytics, DB Global Markets Research
Source: NAHB, Fiserv, Marco Markets LLC, Haver Analytics, DB Global Markets Research
Figure 33: Consumer purchasing plan: home Figure 34: Industry sentiment indicators trending up
strongly
Source: Conference Board, Haver Analytics, DB Global Markets Research
Source: NAHB, Univ of Michigan, Haver Analytics, Bloomberg Finance LP, DB Global Markets Research

22 July 2016
Chemicals/Commodity
Railcar & PetroChemical Update
Page 14 Deutsche Bank Securities Inc.
Figure 35: Close to record-high levels of affordability Figure 36: Real resid investment contribution to real GDP
growth
Source: NAR, Haver Analytics, DB Global Markets Research
Source: BEA, Haver Analytics, DB Global Markets Research
Figure 37: components of residential investment that are
adding to GDP growth
Figure 38: Traffic of prospective buyers of new homes
Source: BEA, Haver Analytics, DB Global Markets Research
Source: NAHB, , Haver Analytics , DB Global Markets Research

22 July 2016
Chemicals/Commodity
Railcar & PetroChemical Update
Deutsche Bank Securities Inc. Page 15
Figure 39: Conference board consumer confidence
survey: plans to buy a new home within six months
Figure 40: US home prices rising steadily
Source: Census, Haver Analytics,DB Global Markets Research
Source: S&P, CoreLogic, FHFA, Haver Analytics, DB Global Markets Research

22 July 2016
Chemicals/Commodity
Railcar & PetroChemical Update
Page 16 Deutsche Bank Securities Inc.
End Market: US Automotive & Electronics
Figure 41: North American auto builds
0%
5%
10%
15%
20%
25%
30%
3,000
3,200
3,400
3,600
3,800
4,000
4,200
4,400
4,600
4,800
1Q
-2011
2Q
-2011
3Q
-2011
4Q
-2011
1Q
-2012
2Q
-2012
3Q
-2012
4Q
-2012
1Q
-2013
2Q
-2013
3Q
-2013
4Q
-2013
1Q
-2014
2Q
-2014
3Q
-2014
4Q
-2014
1Q
-2015
2Q
-2015
3Q
-2015
4Q
-2015
1Q
-2016E
2Q
-2016E
3Q
-2016E
4Q
-2016E
NA Light Vehicles Production (in '000) % Change YoY (RHS)
Source: Deutsche Bank, Wards, Deutsche Bank Autos Team
Figure 42: North American Rigid PCBs board book-to-bill ratio
0.8
0.9
1.0
1.1
1.2
'04
'05
'06
'07
'08
'09
'10
'11
'12
'13
'14
'15
'16
Rigid PCBs book to bill ratio; May-16 = 1.01
Source: IPC (Association Connecting Electronics Industries)
Front-end semiconductor bookings, which represent more chemicals-intensive
upstream processes (e.g. wafer fab, foundry…) are typically led by back-end bookings
which represent downstream test and packaging activities
NA PCB book-bill ratios give a view into consumer electronics demand, and particularly
demand for flame retardant plastic additives (e.g. ALB, CEM)

22 July 2016
Chemicals/Commodity
Railcar & PetroChemical Update
Deutsche Bank Securities Inc. Page 17
US macro indicators
US output indicators
Figure 43: US Chemicals and Petroleum Shipments
-25%
-20%
-15%
-10%
-5%
0%
5%
10%
15%
20%
Jan-0
2
Jan-0
3
Jan-0
4
Jan-0
5
Jan-0
6
Jan-0
7
Jan-0
8
Jan-0
9
Jan-1
0
Jan-1
1
Jan-1
2
Jan-1
3
Jun-14 (RHS) = 3.5%
Petroleum and Chemicals Railcar Loadings (%YoY of 4-wk m.a.)
Source: Waterborne Commerce Statistics Center, New Orleans, LA
Figure 44: Chemicals Railcar Loadings, Capacity Utilization, and Industrial Production
(25%)
(20%)
(15%)
(10%)
(5%)
0%
5%
10%
15%
20%
25%
(1,200)
(1,000)
(800)
(600)
(400)
(200)
-
200
400
600
'96
'97
'98
'99
'00
'01
'02
'03
'04
'05
'06
'07
'08
'09
'10
'11
'12
'13
'14
'15
'16
Chemicals % Capacity Utilization (bps YoY, 6mo m.a., LHS); May-16 = 127
Chem Railcar Loadings (%YoY, 6mo m.a., RHS); Jun-16 = 2.0%
Chemicals Ind. Production (%YoY, 6mo m.a., RHS); May-16 = 1.3%
Source: Waterborne Commerce Statistics Center, New Orleans, LA

22 July 2016
Chemicals/Commodity
Railcar & PetroChemical Update
Page 18 Deutsche Bank Securities Inc.
Figure 45: Growth in railcar loadings is ahead of industrial
production
Figure 46: ECRI Leading Index vs. Industrial Production
(15%)
(10%)
(5%)
0%
5%
10%
15%
(40%)
(30%)
(20%)
(10%)
0%
10%
20%
'90
'91
'92
'93
'94
'95
'96
'97
'98
'99
'00
'01
'02
'03
'04
'05
'06
'07
'08
'09
'10
'11
'12
'13
'14
'15
'16
Jun-16 (LHS) = (1.4%)
Feb-16 (LHS) = (0.9%)
Railcar loadings, ex-grain & coal (4-wk ma %YoY, shift fwd 1mo, LHS)
Industrial production (% YoY, RHS)
(15%)
(10%)
(5%)
(0%)
5%
10%
15%
(40%)(30%)(20%)(10%)
0%10%20%30%40%
'90
'91
'92
'93
'94
'95
'96
'97
'98
'99
'00
'01
'02
'03
'04
'05
'06
'07
'08
'09
'10
'11
'12
'13
'14
'15
'16
Jun-16 (RHS) = (0.8%)
Oct-13 (LHS) = 5.1%
ECRI Leading Index (% YoY, adv. 5 months, LHS)
Industrial production (% YoY, RHS)
`
Source: Association of American Railroads, Federal Reserve
Source: Federal Reserve, ECRI, Reuters
Figure 47: Industrial Production vs. ISM PMI Index Figure 48: Industrial Production vs. ISM Mfg. New Orders
(15%)
(10%)
(5%)
0%
5%
10%
15%
30
40
50
60
70
80
'90
'91
'92
'93
'94
'95
'96
'97
'98
'99
'00
'01
'02
'03
'04
'05
'06
'07
'08
'09
'10
'11
'12
'13
'14
'15
'16
Jun-16 (LHS) = 53.2
Jun-16 (RHS) = (0.8%)
ISM (Mfg.), shifted fwd 3 months (left axis)
Industrial production (% YoY, right axis)
(15%)
(10%)
(5%)
0%
5%
10%
15%
10
20
30
40
50
60
70
80
'90
'91
'92
'93
'94
'95
'96
'97
'98
'99
'00
'01
'02
'03
'04
'05
'06
'07
'08
'09
'10
'11
'12
'13
'14
'15
'16
May-16 (RHS) = 55.7
Jun-16 (RHS) = (0.8%)
ISM New Orders (Mfg.) shifted fwd 3 mos (LHS)
Industrial production (% YoY, RHS)
Source: Federal Reserve, ISM
Source: Federal Reserve, ISM
Figure 49: Industrial Production vs. Conference Board
Leading Indicators
Figure 50: Conference Board Leading Indicators vs. Real
GDP
(10%)
(5%)
0%
5%
10%
15%
20%
'80
'85
'90
'95
'00
'05
'10
'15
Apr-16 (RHS) = (1.3%)
May-16 = (0.7%)
Conf. Board leading indicators, (6-m % chg) shifted forward 3mos
Headline IP ex-mining, ex-utilities (6-m % chg)
(6%)
(4%)
(2%)
0%
2%
4%
6%
8%
10%
(10%)
(5%)
0%
5%
10%
15%
'80
'85
'90
'95
'00
'05
'10
'15
Mar-16 (RHS) = 2.1%
Dec-13 (LHS) = 5.7%
Conf. Board Leading Indicator, % YoY (LHS, shifted forward 2 qtrs)
Real GDP % YoY (RHS)
Source: Federal Reserve, Bloomberg
Source: Deutsche Bank, Reuters
22 July 2016
Chemicals/Commodity
Railcar & PetroChemical Update
Deutsche Bank Securities Inc. Page 19
US financial market indicators
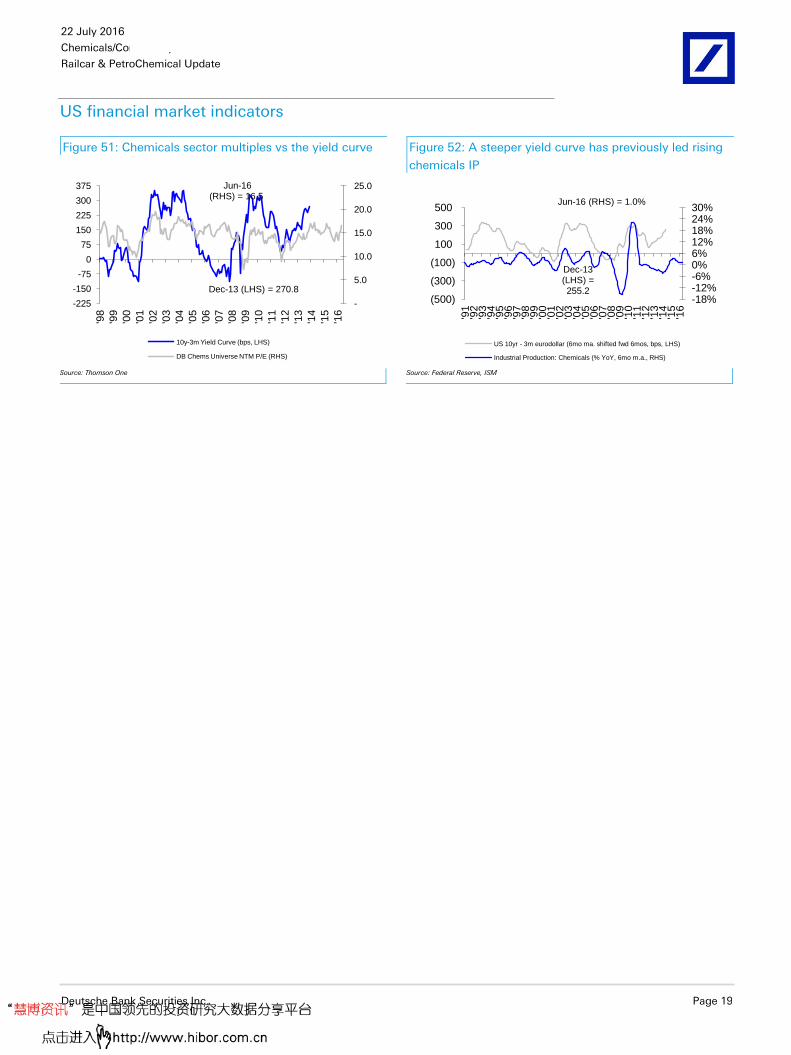
Figure 51: Chemicals sector multiples vs the yield curve Figure 52: A steeper yield curve has previously led rising
chemicals IP
-
5.0
10.0
15.0
20.0
25.0
-225
-150
-75
0
75
150
225
300
375
'98
'99
'00
'01
'02
'03
'04
'05
'06
'07
'08
'09
'10
'11
'12
'13
'14
'15
'16
Jun-16 (RHS) = 16.5
Dec-13 (LHS) = 270.8
10y-3m Yield Curve (bps, LHS)
DB Chems Universe NTM P/E (RHS)
-18%-12%-6%0%6%12%18%24%30%
(500)
(300)
(100)
100
300
500
'91
'92
'93
'94
'95
'96
'97
'98
'99
'00
'01
'02
'03
'04
'05
'06
'07
'08
'09
'10
'11
'12
'13
'14
'15
'16
Dec-13 (LHS) = 255.2
Jun-16 (RHS) = 1.0%
US 10yr - 3m eurodollar (6mo ma. shifted fwd 6mos, bps, LHS)
Industrial Production: Chemicals (% YoY, 6mo m.a., RHS)
Source: Thomson One
Source: Federal Reserve, ISM

22 July 2016
Chemicals/Commodity
Railcar & PetroChemical Update
Page 20 Deutsche Bank Securities Inc.
Overseas macro indicators
Figure 53: Eurozone confidence indicators Figure 54: ZEW German economic sentiment indicator
(12mo m.avg.)
40
44
48
52
56
60
85
90
95
100
105
110
115
'88
'91
'94
'97
'00
'03
'06
'09
'12
'15
Recession periods in Germany
European Commission Economic sentiment (36mo mv. avg.)
24 Month Moving Average B.Sector
Euro Zone PMI manufacturing (24mo mv. avg.)
-60
-40
-20
0
20
40
60
80
100
120
'90
'91
'92
'93
'94
'95
'96
'97
'98
'99
'00
'01
'02
'03
'04
'05
'06
'07
'08
'09
'10
'11
'12
'13
'14
'15
Recession periods in Germany
ZEW Economic Sentiment (12mo mv. avg.)
Source: Bloomberg Finance LP, European Commission, Ifo
Source: Bloomberg Finance LP, ZEW center for European Econ. Research
Figure 55: OECD Europe CLI vs Euro area Industrial Production
-25%
-20%
-15%
-10%
-5%
0%
5%
10%
-15.0%
-10.0%
-5.0%
0.0%
5.0%
10.0%
15.0%
'91
'93
'95
'97
'99
'01
'03
'05
'07
'09
'11
'13
'15
Dec-13 (LHS) = 1.0%
May-16 (RHS) = 1.4%
OECD Europe Composite Leading Indicators % chg. YoY, shifted fwd 4 mos (LHS)
Eurozone IP ex Construction (RHS 3mo avg YoY chg)
Source: Haver Analytics, OECD, Thomson One, Eurostat

22 July 2016
Chemicals/Commodity
Railcar & PetroChemical Update
Deutsche Bank Securities Inc. Page 21
Sector Valuation & Risks
Valuation: We value companies within the chemicals sector based on: 1) forward P/E multiples (vs.
historical ranges, and the overall market); 2) forward EV/EBITDA multiples (where
leverage diverges greatly from that of peers, also vs. historical averages); 3) our
adjusted calculation of cash return on cash invested (“ROIC”) and the strong correlation
(R2>70%) we have found between chemical sector valuations and returns on capital.
Risks: Chemicals volumes are tightly linked with industrial production, while input costs are
closely tied to energy prices (e.g., oil, natural gas). Accordingly, key risks to our
forecasts include a recession in overall GDP (domestic or international, depending on
company-specific overseas exposure), a surge in energy prices, and sharp deterioration
(or improvement, in select cases) in chemicals-intensive housing or automotive
production.
The author of this report wishes to acknowledge the contribution made by Aneesh
Agarwal and Manish Agrawal, employees of Evalueserve, a third-party provider to
Deutsche Bank of offshore research support services.

22 July 2016
Chemicals/Commodity
Railcar & PetroChemical Update
Page 22 Deutsche Bank Securities Inc.
Appendix 1
Important Disclosures
Additional information available upon request
*Prices are current as of the end of the previous trading session unless otherwise indicated and are sourced from local exchanges via Reuters, Bloomberg and other vendors . Other information is sourced from Deutsche Bank, subject companies, and other sources. For disclosures pertaining to recommendations or estimates made on securities other than the primary subject of this research, please see the most recently published company report or visit our global disclosure look-up page on our website at http://gm.db.com/ger/disclosure/DisclosureDirectory.eqsr
Analyst Certification
The views expressed in this report accurately reflect the personal views of the undersigned lead analyst about the subject issuers and the securities of those issuers. In addition, the undersigned lead analyst has not and will not receive any compensation for providing a specific recommendation or view in this report. David Begleiter
Equity rating key Equity rating dispersion and banking relationships
Buy: Based on a current 12- month view of total share-holder return (TSR = percentage change in share price from current price to projected target price plus pro-jected dividend yield ) , we recommend that investors buy the stock.
Sell: Based on a current 12-month view of total share-holder return, we recommend that investors sell the stock
Hold: We take a neutral view on the stock 12-months out and, based on this time horizon, do not recommend either a Buy or Sell.
Newly issued research recommendations and target prices supersede previously published research.
46 %52 %
3 %
53 % 42 %
17 %0
100
200
300
400
500
600
Buy Hold Sell
North American Universe
Companies Covered Cos. w/ Banking Relationship
Regulatory Disclosures
1.Important Additional Conflict Disclosures
Aside from within this report, important conflict disclosures can also be found at https://gm.db.com/equities under the
"Disclosures Lookup" and "Legal" tabs. Investors are strongly encouraged to review this information before investing.
2.Short-Term Trade Ideas
Deutsche Bank equity research analysts sometimes have shorter-term trade ideas (known as SOLAR ideas) that are
consistent or inconsistent with Deutsche Bank's existing longer term ratings. These trade ideas can be found at the
SOLAR link at http://gm.db.com.
22 July 2016
Chemicals/Commodity
Railcar & PetroChemical Update
Deutsche Bank Securities Inc. Page 23
Additional Information
The information and opinions in this report were prepared by Deutsche Bank AG or one of its affiliates (collectively
"Deutsche Bank"). Though the information herein is believed to be reliable and has been obtained from public sources
believed to be reliable, Deutsche Bank makes no representation as to its accuracy or completeness.
If you use the services of Deutsche Bank in connection with a purchase or sale of a security that is discussed in this
report, or is included or discussed in another communication (oral or written) from a Deutsche Bank analyst, Deutsche
Bank may act as principal for its own account or as agent for another person.
Deutsche Bank may consider this report in deciding to trade as principal. It may also engage in transactions, for its own
account or with customers, in a manner inconsistent with the views taken in this research report. Others within
Deutsche Bank, including strategists, sales staff and other analysts, may take views that are inconsistent with those
taken in this research report. Deutsche Bank issues a variety of research products, including fundamental analysis,
equity-linked analysis, quantitative analysis and trade ideas. Recommendations contained in one type of communication
may differ from recommendations contained in others, whether as a result of differing time horizons, methodologies or
otherwise. Deutsche Bank and/or its affiliates may also be holding debt or equity securities of the issuers it writes on.
Analysts are paid in part based on the profitability of Deutsche Bank AG and its affiliates, which includes investment
banking revenues.
Opinions, estimates and projections constitute the current judgment of the author as of the date of this report. They do
not necessarily reflect the opinions of Deutsche Bank and are subject to change without notice. Deutsche Bank research
analysts sometimes have shorter-term trade ideas that are consistent or inconsistent with Deutsche Bank's existing
longer term ratings. These trade ideas for equities can be found at the SOLAR link at http://gm.db.com. A SOLAR idea
represents a high conviction belief by an analyst that a stock will outperform or underperform the market and/or sector
delineated over a time frame of no less than two weeks. In addition to SOLAR ideas, the analysts named in this report
may have from time to time discussed with our clients, including Deutsche Bank salespersons and traders, or may
discuss in this report or elsewhere, trading strategies or ideas that reference catalysts or events that may have a near-
term or medium-term impact on the market price of the securities discussed in this report, which impact may be
directionally counter to the analysts' current 12-month view of total return as described herein. Deutsche Bank has no
obligation to update, modify or amend this report or to otherwise notify a recipient thereof if any opinion, forecast or
estimate contained herein changes or subsequently becomes inaccurate. Coverage and the frequency of changes in
market conditions and in both general and company specific economic prospects makes it difficult to update research at
defined intervals. Updates are at the sole discretion of the coverage analyst concerned or of the Research Department
Management and as such the majority of reports are published at irregular intervals. This report is provided for
informational purposes only. It is not an offer or a solicitation of an offer to buy or sell any financial instruments or to
participate in any particular trading strategy. Target prices are inherently imprecise and a product of the analyst’s
judgment. The financial instruments discussed in this report may not be suitable for all investors and investors must
make their own informed investment decisions. Prices and availability of financial instruments are subject to change
without notice and investment transactions can lead to losses as a result of price fluctuations and other factors. If a
financial instrument is denominated in a currency other than an investor's currency, a change in exchange rates may
adversely affect the investment. Past performance is not necessarily indicative of future results. Unless otherwise
indicated, prices are current as of the end of the previous trading session, and are sourced from local exchanges via
Reuters, Bloomberg and other vendors. Data is sourced from Deutsche Bank, subject companies, and in some cases,
other parties.
The Deutsche Bank Research Department is independent of other business areas divisions of the Bank. Details regarding
our organizational arrangements and information barriers we have to prevent and avoid conflicts of interest with respect
to our research is available on our website under Disclaimer found on the Legal tab.
Macroeconomic fluctuations often account for most of the risks associated with exposures to instruments that promise
to pay fixed or variable interest rates. For an investor who is long fixed rate instruments (thus receiving these cash
flows), increases in interest rates naturally lift the discount factors applied to the expected cash flows and thus cause a

22 July 2016
Chemicals/Commodity
Railcar & PetroChemical Update
Page 24 Deutsche Bank Securities Inc.
loss. The longer the maturity of a certain cash flow and the higher the move in the discount factor, the higher will be the
loss. Upside surprises in inflation, fiscal funding needs, and FX depreciation rates are among the most common adverse
macroeconomic shocks to receivers. But counterparty exposure, issuer creditworthiness, client segmentation, regulation
(including changes in assets holding limits for different types of investors), changes in tax policies, currency
convertibility (which may constrain currency conversion, repatriation of profits and/or the liquidation of positions), and
settlement issues related to local clearing houses are also important risk factors to be considered. The sensitivity of fixed
income instruments to macroeconomic shocks may be mitigated by indexing the contracted cash flows to inflation, to
FX depreciation, or to specified interest rates – these are common in emerging markets. It is important to note that the
index fixings may -- by construction -- lag or mis-measure the actual move in the underlying variables they are intended
to track. The choice of the proper fixing (or metric) is particularly important in swaps markets, where floating coupon
rates (i.e., coupons indexed to a typically short-dated interest rate reference index) are exchanged for fixed coupons. It is
also important to acknowledge that funding in a currency that differs from the currency in which coupons are
denominated carries FX risk. Naturally, options on swaps (swaptions) also bear the risks typical to options in addition to
the risks related to rates movements.
Derivative transactions involve numerous risks including, among others, market, counterparty default and illiquidity risk.
The appropriateness or otherwise of these products for use by investors is dependent on the investors' own
circumstances including their tax position, their regulatory environment and the nature of their other assets and
liabilities, and as such, investors should take expert legal and financial advice before entering into any transaction similar
to or inspired by the contents of this publication. The risk of loss in futures trading and options, foreign or domestic, can
be substantial. As a result of the high degree of leverage obtainable in futures and options trading, losses may be
incurred that are greater than the amount of funds initially deposited. Trading in options involves risk and is not suitable
for all investors. Prior to buying or selling an option investors must review the "Characteristics and Risks of Standardized
Options”, at http://www.optionsclearing.com/about/publications/character-risks.jsp. If you are unable to access the
website please contact your Deutsche Bank representative for a copy of this important document.
Participants in foreign exchange transactions may incur risks arising from several factors, including the following: ( i)
exchange rates can be volatile and are subject to large fluctuations; ( ii) the value of currencies may be affected by
numerous market factors, including world and national economic, political and regulatory events, events in equity and
debt markets and changes in interest rates; and (iii) currencies may be subject to devaluation or government imposed
exchange controls which could affect the value of the currency. Investors in securities such as ADRs, whose values are
affected by the currency of an underlying security, effectively assume currency risk.
Unless governing law provides otherwise, all transactions should be executed through the Deutsche Bank entity in the
investor's home jurisdiction.
United States: Approved and/or distributed by Deutsche Bank Securities Incorporated, a member of FINRA, NFA and
SIPC. Analysts employed by non-US affiliates may not be associated persons of Deutsche Bank Securities Incorporated
and therefore not subject to FINRA regulations concerning communications with subject companies, public appearances
and securities held by analysts.
Germany: Approved and/or distributed by Deutsche Bank AG, a joint stock corporation with limited liability incorporated
in the Federal Republic of Germany with its principal office in Frankfurt am Main. Deutsche Bank AG is authorized under
German Banking Law and is subject to supervision by the European Central Bank and by BaFin, Germany’s Federal
Financial Supervisory Authority.
United Kingdom: Approved and/or distributed by Deutsche Bank AG acting through its London Branch at Winchester
House, 1 Great Winchester Street, London EC2N 2DB. Deutsche Bank AG in the United Kingdom is authorised by the
Prudential Regulation Authority and is subject to limited regulation by the Prudential Regulation Authority and Financial
Conduct Authority. Details about the extent of our authorisation and regulation are available on request.
Hong Kong: Distributed by Deutsche Bank AG, Hong Kong Branch.
India: Prepared by Deutsche Equities India Pvt Ltd, which is registered by the Securities and Exchange Board of India
(SEBI) as a stock broker. Research Analyst SEBI Registration Number is INH000001741. DEIPL may have received

22 July 2016
Chemicals/Commodity
Railcar & PetroChemical Update
Deutsche Bank Securities Inc. Page 25
administrative warnings from the SEBI for breaches of Indian regulations.
Japan: Approved and/or distributed by Deutsche Securities Inc.(DSI). Registration number - Registered as a financial
instruments dealer by the Head of the Kanto Local Finance Bureau (Kinsho) No. 117. Member of associations: JSDA,
Type II Financial Instruments Firms Association and The Financial Futures Association of Japan. Commissions and risks
involved in stock transactions - for stock transactions, we charge stock commissions and consumption tax by
multiplying the transaction amount by the commission rate agreed with each customer. Stock transactions can lead to
losses as a result of share price fluctuations and other factors. Transactions in foreign stocks can lead to additional
losses stemming from foreign exchange fluctuations. We may also charge commissions and fees for certain categories
of investment advice, products and services. Recommended investment strategies, products and services carry the risk
of losses to principal and other losses as a result of changes in market and/or economic trends, and/or fluctuations in
market value. Before deciding on the purchase of financial products and/or services, customers should carefully read the
relevant disclosures, prospectuses and other documentation. "Moody's", "Standard & Poor's", and "Fitch" mentioned in
this report are not registered credit rating agencies in Japan unless Japan or "Nippon" is specifically designated in the
name of the entity. Reports on Japanese listed companies not written by analysts of DSI are written by Deutsche Bank
Group's analysts with the coverage companies specified by DSI. Some of the foreign securities stated on this report are
not disclosed according to the Financial Instruments and Exchange Law of Japan.
Korea: Distributed by Deutsche Securities Korea Co.
South Africa: Deutsche Bank AG Johannesburg is incorporated in the Federal Republic of Germany (Branch Register
Number in South Africa: 1998/003298/10).
Singapore: by Deutsche Bank AG, Singapore Branch or Deutsche Securities Asia Limited, Singapore Branch (One Raffles
Quay #18-00 South Tower Singapore 048583, +65 6423 8001), which may be contacted in respect of any matters
arising from, or in connection with, this report. Where this report is issued or promulgated in Singapore to a person who
is not an accredited investor, expert investor or institutional investor (as defined in the applicable Singapore laws and
regulations), they accept legal responsibility to such person for its contents.
Taiwan: Information on securities/investments that trade in Taiwan is for your reference only. Readers should
independently evaluate investment risks and are solely responsible for their investment decisions. Deutsche Bank
research may not be distributed to the Taiwan public media or quoted or used by the Taiwan public media without
written consent. Information on securities/instruments that do not trade in Taiwan is for informational purposes only and
is not to be construed as a recommendation to trade in such securities/instruments. Deutsche Securities Asia Limited,
Taipei Branch may not execute transactions for clients in these securities/instruments.
Qatar: Deutsche Bank AG in the Qatar Financial Centre (registered no. 00032) is regulated by the Qatar Financial Centre
Regulatory Authority. Deutsche Bank AG - QFC Branch may only undertake the financial services activities that fall
within the scope of its existing QFCRA license. Principal place of business in the QFC: Qatar Financial Centre, Tower,
West Bay, Level 5, PO Box 14928, Doha, Qatar. This information has been distributed by Deutsche Bank AG. Related
financial products or services are only available to Business Customers, as defined by the Qatar Financial Centre
Regulatory Authority.
Russia: This information, interpretation and opinions submitted herein are not in the context of, and do not constitute,
any appraisal or evaluation activity requiring a license in the Russian Federation.
Kingdom of Saudi Arabia: Deutsche Securities Saudi Arabia LLC Company, (registered no. 07073-37) is regulated by the
Capital Market Authority. Deutsche Securities Saudi Arabia may only undertake the financial services activities that fall
within the scope of its existing CMA license. Principal place of business in Saudi Arabia: King Fahad Road, Al Olaya
District, P.O. Box 301809, Faisaliah Tower - 17th Floor, 11372 Riyadh, Saudi Arabia.
United Arab Emirates: Deutsche Bank AG in the Dubai International Financial Centre (registered no. 00045) is regulated
by the Dubai Financial Services Authority. Deutsche Bank AG - DIFC Branch may only undertake the financial services
activities that fall within the scope of its existing DFSA license. Principal place of business in the DIFC: Dubai
International Financial Centre, The Gate Village, Building 5, PO Box 504902, Dubai, U.A.E. This information has been

22 July 2016
Chemicals/Commodity
Railcar & PetroChemical Update
Page 26 Deutsche Bank Securities Inc.
distributed by Deutsche Bank AG. Related financial products or services are only available to Professional Clients, as
defined by the Dubai Financial Services Authority.
Australia: Retail clients should obtain a copy of a Product Disclosure Statement (PDS) relating to any financial product
referred to in this report and consider the PDS before making any decision about whether to acquire the product. Please
refer to Australian specific research disclosures and related information at
https://australia.db.com/australia/content/research-information.html
Australia and New Zealand: This research, and any access to it, is intended only for "wholesale clients" within the
meaning of the Australian Corporations Act and New Zealand Financial Advisors Act respectively.
Additional information relative to securities, other financial products or issuers discussed in this report is available upon
request. This report may not be reproduced, distributed or published without Deutsche Bank's prior written consent.
Copyright © 2016 Deutsche Bank AG

David Folkerts-Landau Group Chief Economist and Global Head of Research
Raj Hindocha Global Chief Operating Officer
Research
Michael Spencer Head of APAC Research
Global Head of Economics
Steve Pollard Head of Americas Research
Global Head of Equity Research
Anthony Klarman Global Head of Debt Research
Paul Reynolds Head of EMEA
Equity Research
Dave Clark Head of APAC
Equity Research
Pam Finelli Global Head of
Equity Derivatives Research
Andreas Neubauer Head of Research - Germany
Stuart Kirk Head of Thematic Research
International locations
Deutsche Bank AG
Deutsche Bank Place
Level 16
Corner of Hunter & Phillip Streets
Sydney, NSW 2000
Australia
Tel: (61) 2 8258 1234
Deutsche Bank AG
Große Gallusstraße 10-14
60272 Frankfurt am Main
Germany
Tel: (49) 69 910 00
Deutsche Bank AG
Filiale Hongkong
International Commerce Centre,
1 Austin Road West,Kowloon,
Hong Kong
Tel: (852) 2203 8888
Deutsche Securities Inc.
2-11-1 Nagatacho
Sanno Park Tower
Chiyoda-ku, Tokyo 100-6171
Japan
Tel: (81) 3 5156 6770
Deutsche Bank AG London
1 Great Winchester Street
London EC2N 2EQ
United Kingdom
Tel: (44) 20 7545 8000
Deutsche Bank Securities Inc.
60 Wall Street
New York, NY 10005
United States of America
Tel: (1) 212 250 2500