Embed Size (px)
Citation preview
KRMAdonorCentrics ReviewFY 2010
Carol Rhine & David PrestonJanuary 2011
Carol Rhine | Page #2 © 2011 Blackbaud
donorCentrics Collaborative Benchmarking Service
Overview of FY10 donorCentrics report
• Overall Revenue & Donor • File Size• File Building• Renewals• Major Gifts• Mid-Level Giving
Techniques• Mail• Pledge• Web• Telemarketing• Sustained Giving
Agenda
Carol Rhine | Page #3 © 2011 Blackbaud
donorCentrics Collaborative Benchmarking Service
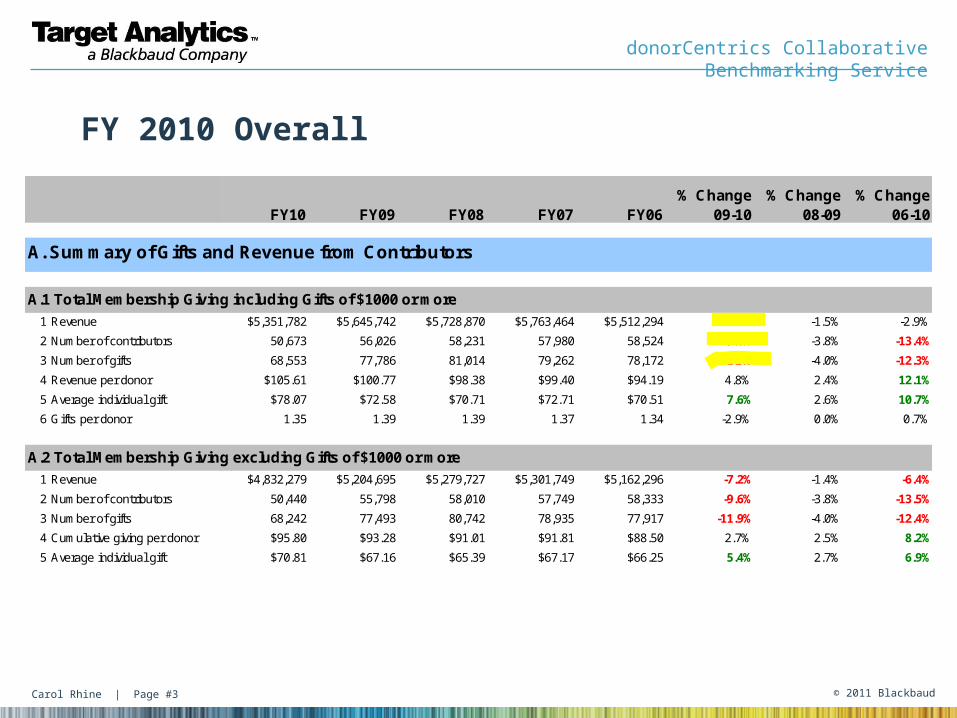
FY 2010 Overall
FY10 FY09 FY08 FY07 FY06% Change
09-10% Change
08-09% Change
06-10
A. Summary of Gifts and Revenue from Contributors
A.1 Total Membership Giving including Gifts of $1000 or more
1 Revenue $5,351,782 $5,645,742 $5,728,870 $5,763,464 $5,512,294 -5.2% -1.5% -2.9%
2 Number of contributors 50,673 56,026 58,231 57,980 58,524 -9.6% -3.8% -13.4%
3 Number of gifts 68,553 77,786 81,014 79,262 78,172 -11.9% -4.0% -12.3%
4 Revenue per donor $105.61 $100.77 $98.38 $99.40 $94.19 4.8% 2.4% 12.1%
5 Average individual gift $78.07 $72.58 $70.71 $72.71 $70.51 7.6% 2.6% 10.7%
6 Gifts per donor 1.35 1.39 1.39 1.37 1.34 -2.9% 0.0% 0.7%
A.2 Total Membership Giving excluding Gifts of $1000 or more
1 Revenue $4,832,279 $5,204,695 $5,279,727 $5,301,749 $5,162,296 -7.2% -1.4% -6.4%
2 Number of contributors 50,440 55,798 58,010 57,749 58,333 -9.6% -3.8% -13.5%
3 Number of gifts 68,242 77,493 80,742 78,935 77,917 -11.9% -4.0% -12.4%
4 Cumulative giving per donor $95.80 $93.28 $91.01 $91.81 $88.50 2.7% 2.5% 8.2%
5 Average individual gift $70.81 $67.16 $65.39 $67.17 $66.25 5.4% 2.7% 6.9%
Carol Rhine | Page #4 © 2011 Blackbaud
donorCentrics Collaborative Benchmarking Service
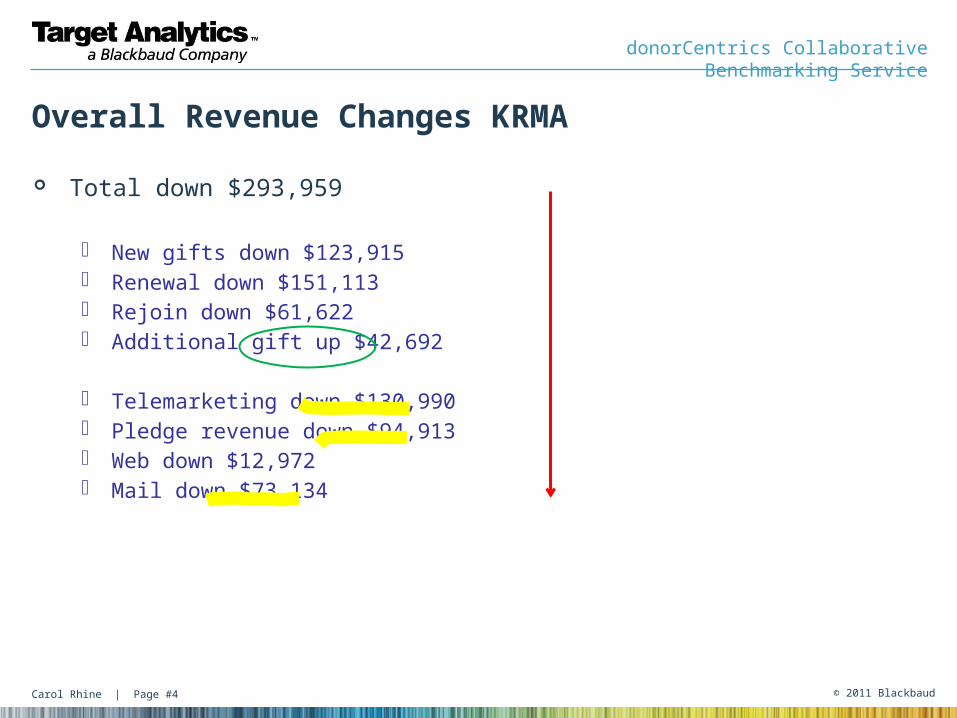
Total down $293,959
· New gifts down $123,915· Renewal down $151,113· Rejoin down $61,622· Additional gift up $42,692
· Telemarketing down $130,990· Pledge revenue down $94,913· Web down $12,972· Mail down $73,134
Overall Revenue Changes KRMA
Carol Rhine | Page #5 © 2011 Blackbaud
donorCentrics Collaborative Benchmarking Service
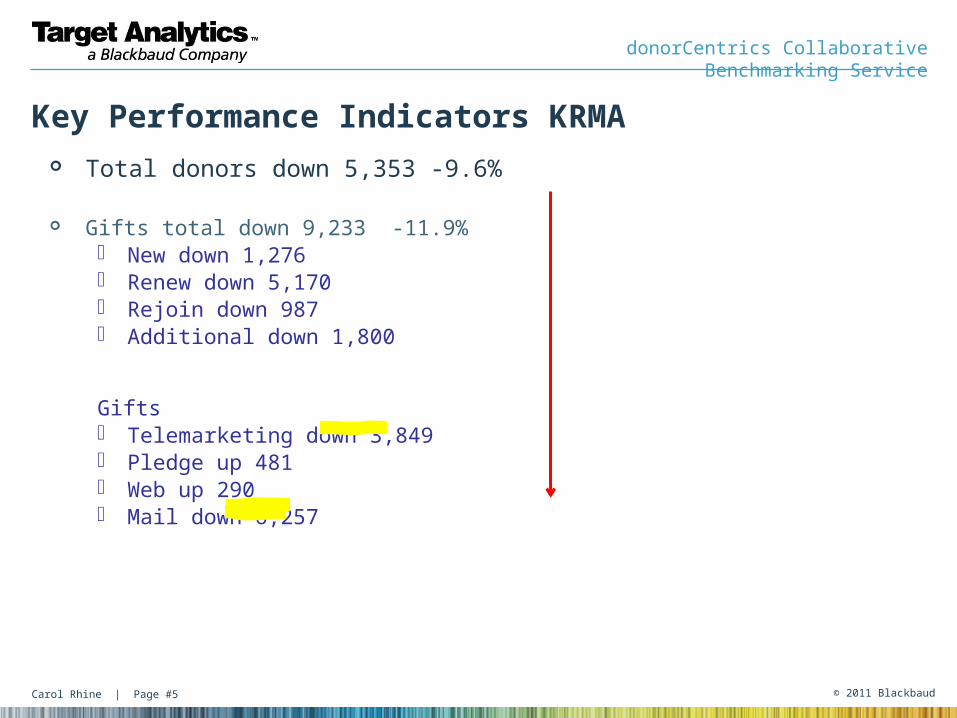
Total donors down 5,353 -9.6%
Gifts total down 9,233 -11.9%· New down 1,276· Renew down 5,170· Rejoin down 987· Additional down 1,800
Gifts· Telemarketing down 3,849· Pledge up 481· Web up 290· Mail down 6,257
Key Performance Indicators KRMA
Carol Rhine | Page #6 © 2011 Blackbaud
donorCentrics Collaborative Benchmarking Service
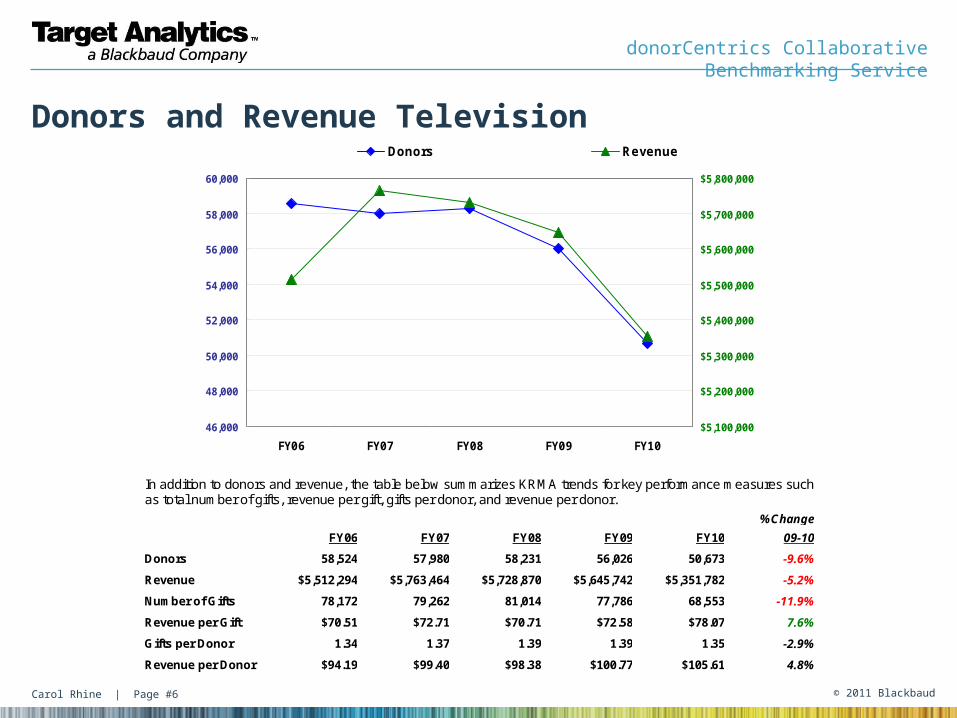
Donors and Revenue Television
46,000
48,000
50,000
52,000
54,000
56,000
58,000
60,000
FY06 FY07 FY08 FY09 FY10
$5,100,000
$5,200,000
$5,300,000
$5,400,000
$5,500,000
$5,600,000
$5,700,000
$5,800,000
Donors Revenue
In addition to donors and revenue, the table below summarizes KRMA trends for key performance measures such as total number of gifts, revenue per gift, gifts per donor, and revenue per donor.
%Change
FY06 FY07 FY08 FY09 FY10 09-10
Donors 58,524 57,980 58,231 56,026 50,673 -9.6%
Revenue $5,512,294 $5,763,464 $5,728,870 $5,645,742 $5,351,782 -5.2%
Number of Gifts 78,172 79,262 81,014 77,786 68,553 -11.9%
Revenue per Gift $70.51 $72.71 $70.71 $72.58 $78.07 7.6%
Gifts per Donor 1.34 1.37 1.39 1.39 1.35 -2.9%
Revenue per Donor $94.19 $99.40 $98.38 $100.77 $105.61 4.8%
Carol Rhine | Page #7 © 2011 Blackbaud
donorCentrics Collaborative Benchmarking Service
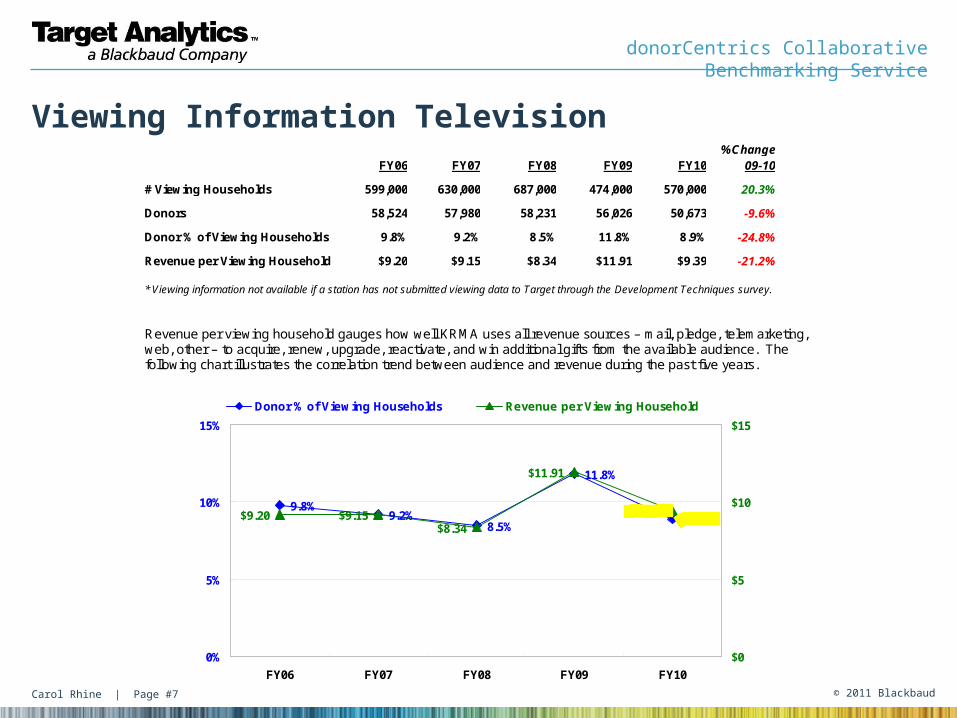
Viewing Information Television %Change FY06 FY07 FY08 FY09 FY10 09-10
# Viewing Households 599,000 630,000 687,000 474,000 570,000 20.3%
Donors 58,524 57,980 58,231 56,026 50,673 -9.6%
Donor % of Viewing Households 9.8% 9.2% 8.5% 11.8% 8.9% -24.8%
Revenue per Viewing Household $9.20 $9.15 $8.34 $11.91 $9.39 -21.2% * Viewing information not available if a station has not submitted viewing data to Target through the Development Techniques survey.
Revenue per viewing household gauges how well KRMA uses all revenue sources – mail, pledge, telemarketing, web, other – to acquire, renew, upgrade, reactivate, and win additional gifts from the available audience. The following chart illustrates the correlation trend between audience and revenue during the past five years.
9.8%9.2%
8.5%
11.8%
8.9%$9.20 $9.15$8.34
$11.91
$9.39
0%
5%
10%
15%
FY06 FY07 FY08 FY09 FY10
$0
$5
$10
$15
Donor % of Viewing Households Revenue per Viewing Household
Carol Rhine | Page #8 © 2011 Blackbaud
donorCentrics Collaborative Benchmarking Service
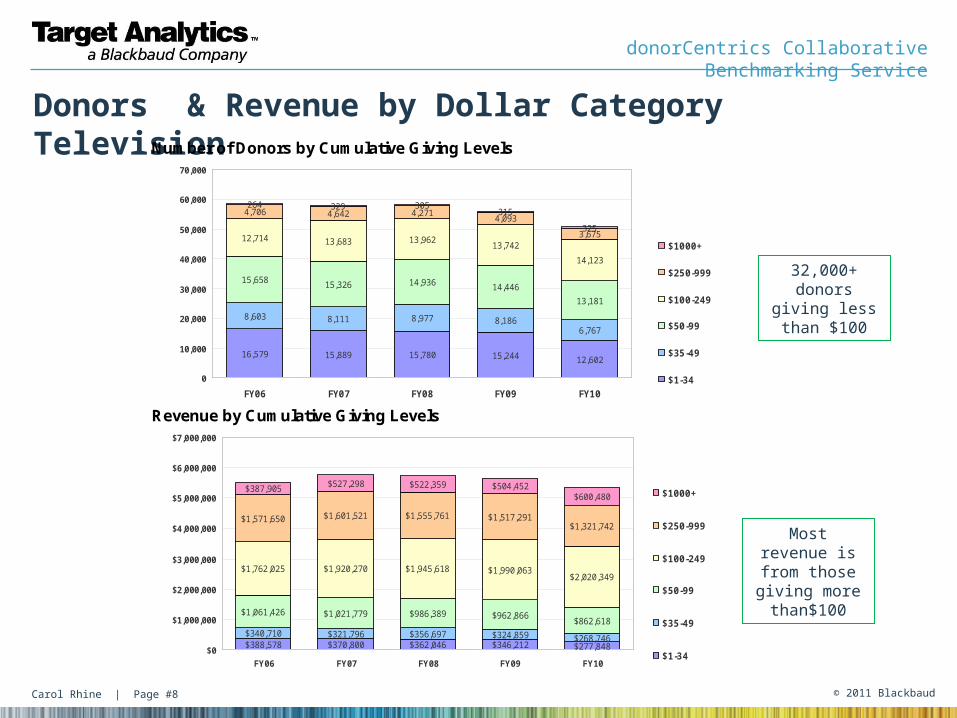
Donors & Revenue by Dollar Category Television
Number of Donors by Cumulative Giving Levels
16,579 15,889 15,780 15,244 12,602
8,603 8,111 8,977 8,1866,767
15,658 15,326 14,936 14,446
13,181
12,714 13,683 13,96213,742
14,123
4,706 4,642 4,2714,093
3,675
264 329 305315
325
0
10,000
20,000
30,000
40,000
50,000
60,000
70,000
FY06 FY07 FY08 FY09 FY10
$1000+
$250-999
$100-249
$50-99
$35-49
$1-34
Revenue by Cumulative Giving Levels
$388,578 $370,800 $362,046 $346,212 $277,848
$340,710 $321,796 $356,697 $324,859 $268,746
$1,061,426 $1,021,779 $986,389 $962,866$862,618
$1,762,025 $1,920,270 $1,945,618 $1,990,063$2,020,349
$1,571,650 $1,601,521 $1,555,761 $1,517,291$1,321,742
$387,905 $527,298 $522,359 $504,452$600,480
$0
$1,000,000
$2,000,000
$3,000,000
$4,000,000
$5,000,000
$6,000,000
$7,000,000
FY06 FY07 FY08 FY09 FY10
$1000+
$250-999
$100-249
$50-99
$35-49
$1-34
32,000+ donors giving less than
$100
Most revenue is from those giving more than$100
Carol Rhine | Page #9 © 2011 Blackbaud
donorCentrics Collaborative Benchmarking Service
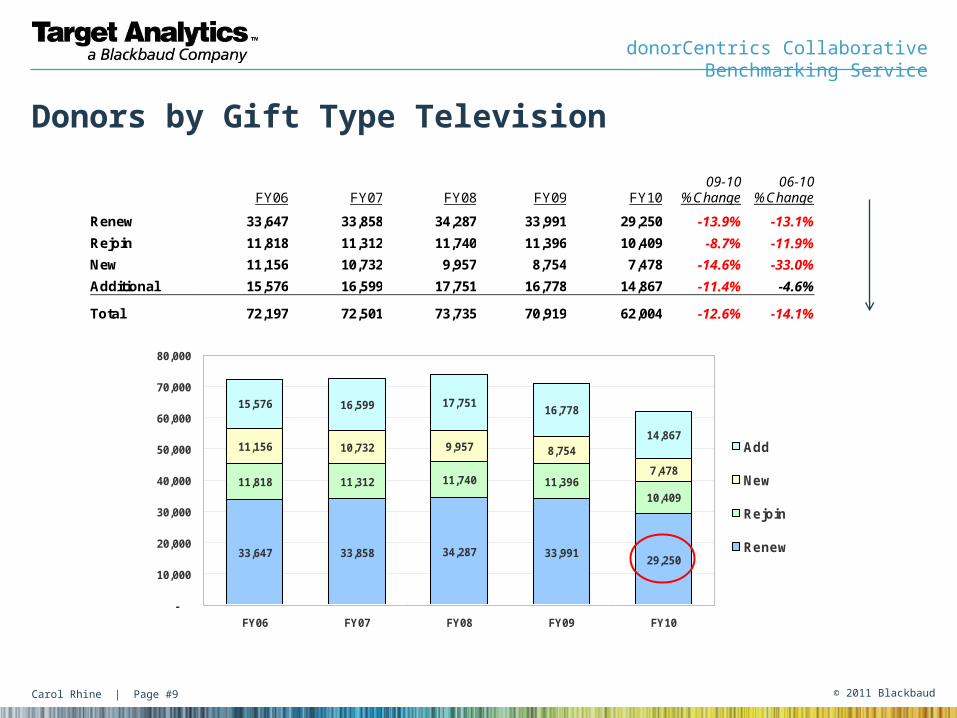
Donors by Gift Type Television
FY06 FY07 FY08 FY09 FY10 09-10
%Change 06-10
%Change
Renew 33,647 33,858 34,287 33,991 29,250 -13.9% -13.1%
Rejoin 11,818 11,312 11,740 11,396 10,409 -8.7% -11.9%
New 11,156 10,732 9,957 8,754 7,478 -14.6% -33.0%
Additional 15,576 16,599 17,751 16,778 14,867 -11.4% -4.6%
Total 72,197 72,501 73,735 70,919 62,004 -12.6% -14.1%
33,647 33,858 34,287 33,99129,250
11,312 11,740 11,39610,409
11,156 10,732 9,957 8,754
7,478
15,576 16,599 17,75116,778
14,867
11,818
-
10,000
20,000
30,000
40,000
50,000
60,000
70,000
80,000
FY06 FY07 FY08 FY09 FY10
Add
New
Rejoin
Renew
Carol Rhine | Page #10 © 2011 Blackbaud
donorCentrics Collaborative Benchmarking Service
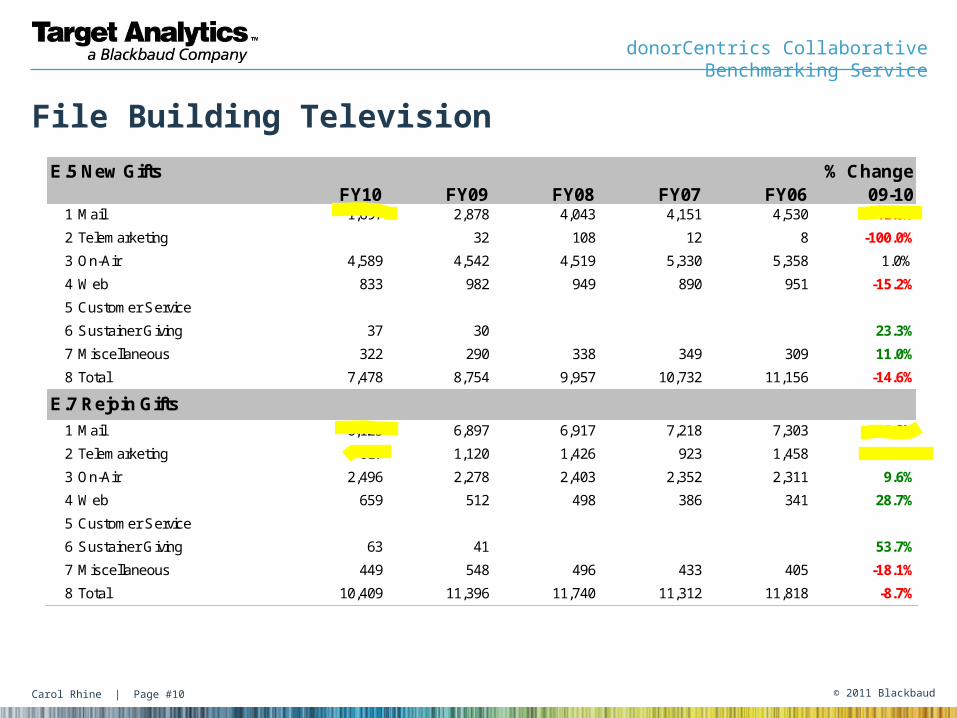
File Building Television
E.5 New GiftsFY10 FY09 FY08 FY07 FY06
% Change 09-10
1 Mail 1,697 2,878 4,043 4,151 4,530 -41.0%
2 Telemarketing 32 108 12 8 -100.0%
3 On-Air 4,589 4,542 4,519 5,330 5,358 1.0%
4 Web 833 982 949 890 951 -15.2%
5 Customer Service
6 Sustainer Giving 37 30 23.3%
7 Miscellaneous 322 290 338 349 309 11.0%
8 Total 7,478 8,754 9,957 10,732 11,156 -14.6%
E.7 Rejoin Gifts
1 Mail 6,125 6,897 6,917 7,218 7,303 -11.2%
2 Telemarketing 617 1,120 1,426 923 1,458 -44.9%
3 On-Air 2,496 2,278 2,403 2,352 2,311 9.6%
4 Web 659 512 498 386 341 28.7%
5 Customer Service
6 Sustainer Giving 63 41 53.7%
7 Miscellaneous 449 548 496 433 405 -18.1%
8 Total 10,409 11,396 11,740 11,312 11,818 -8.7%
Carol Rhine | Page #11 © 2011 Blackbaud
donorCentrics Collaborative Benchmarking Service
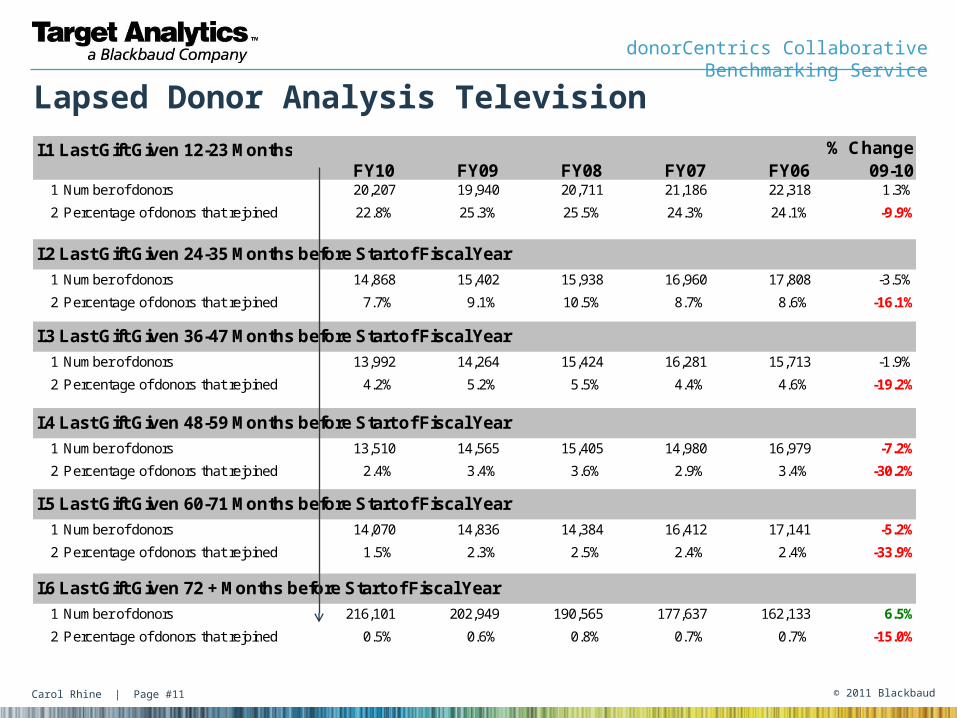
Lapsed Donor Analysis Television
I.1 Last Gift Given 12-23 MonthsFY10 FY09 FY08 FY07 FY06
% Change 09-10
1 Number of donors 20,207 19,940 20,711 21,186 22,318 1.3%
2 Percentage of donors that rejoined 22.8% 25.3% 25.5% 24.3% 24.1% -9.9%
I.2 Last Gift Given 24-35 Months before Start of Fiscal Year
1 Number of donors 14,868 15,402 15,938 16,960 17,808 -3.5%
2 Percentage of donors that rejoined 7.7% 9.1% 10.5% 8.7% 8.6% -16.1%
I.3 Last Gift Given 36-47 Months before Start of Fiscal Year
1 Number of donors 13,992 14,264 15,424 16,281 15,713 -1.9%
2 Percentage of donors that rejoined 4.2% 5.2% 5.5% 4.4% 4.6% -19.2%
I.4 Last Gift Given 48-59 Months before Start of Fiscal Year
1 Number of donors 13,510 14,565 15,405 14,980 16,979 -7.2%
2 Percentage of donors that rejoined 2.4% 3.4% 3.6% 2.9% 3.4% -30.2%
I.5 Last Gift Given 60-71 Months before Start of Fiscal Year
1 Number of donors 14,070 14,836 14,384 16,412 17,141 -5.2%
2 Percentage of donors that rejoined 1.5% 2.3% 2.5% 2.4% 2.4% -33.9%
I.6 Last Gift Given 72 + Months before Start of Fiscal Year
1 Number of donors 216,101 202,949 190,565 177,637 162,133 6.5%
2 Percentage of donors that rejoined 0.5% 0.6% 0.8% 0.7% 0.7% -15.0%

Carol Rhine | Page #12 © 2011 Blackbaud
donorCentrics Collaborative Benchmarking Service
Gift Source Trends Television
FY06 FY07 FY08 FY09 FY10 09-10
%Change 06-10
%Change
Mail $2,592,436 $2,738,022 $2,762,511 $2,687,435 $2,614,301 -2.7% 0.8%
On-Air $1,902,585 $1,947,163 $1,820,952 $1,850,059 $1,755,146 -5.1% -7.7%
Telemarketing $298,209 $255,598 $310,743 $212,175 $81,185 -61.7% -72.8%
Web $284,311 $295,524 $368,073 $401,268 $388,713 -3.1% 36.7%
On-Air + Web Pledge $2,127,055 $2,170,324 $2,045,687 $2,091,872 $1,935,511 -7.5% -9.0%
Total $5,077,541 $5,236,306 $5,262,279 $5,150,937 $4,839,346 -6.0% -4.7%
$0
$1,000,000
$2,000,000
$3,000,000
$4,000,000
$5,000,000
$6,000,000
Mail On-Air Telemarketing Web On-Air + WebPledge
Total
FY06 FY07 FY08 FY09 FY10
Carol Rhine | Page #13 © 2011 Blackbaud
donorCentrics Collaborative Benchmarking Service
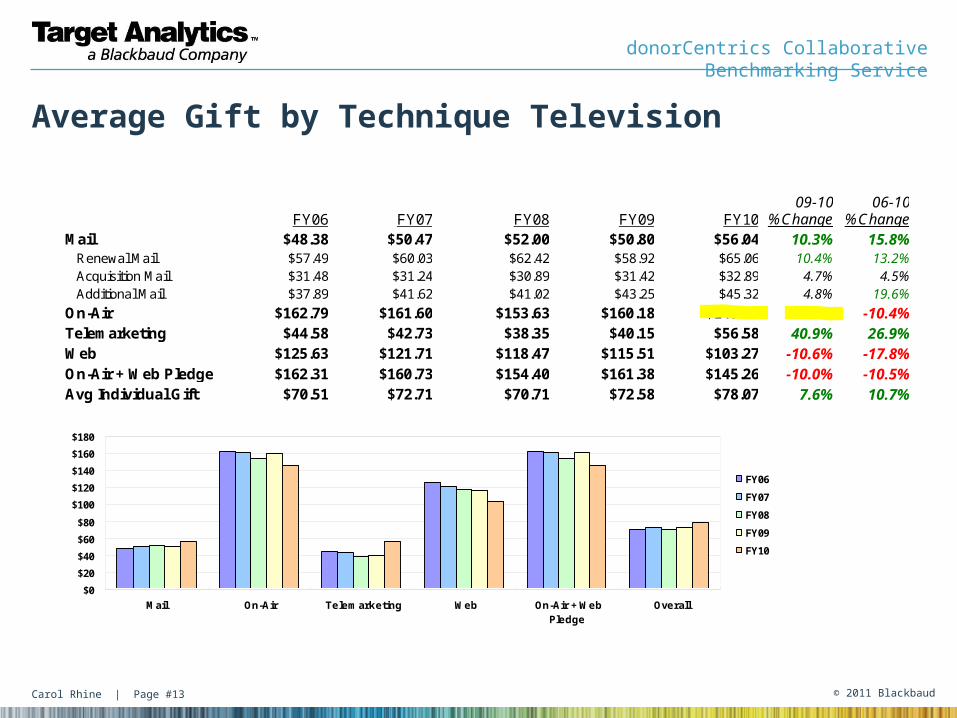
Average Gift by Technique Television
FY06 FY07 FY08 FY09 FY10 09-10
%Change 06-10
%Change Mail $48.38 $50.47 $52.00 $50.80 $56.04 10.3% 15.8% Renewal Mail $57.49 $60.03 $62.42 $58.92 $65.06 10.4% 13.2% Acquisition Mail $31.48 $31.24 $30.89 $31.42 $32.89 4.7% 4.5% Additional Mail $37.89 $41.62 $41.02 $43.25 $45.32 4.8% 19.6%
On-Air $162.79 $161.60 $153.63 $160.18 $145.89 -8.9% -10.4% Telemarketing $44.58 $42.73 $38.35 $40.15 $56.58 40.9% 26.9% Web $125.63 $121.71 $118.47 $115.51 $103.27 -10.6% -17.8% On-Air + Web Pledge $162.31 $160.73 $154.40 $161.38 $145.26 -10.0% -10.5% Avg Individual Gift $70.51 $72.71 $70.71 $72.58 $78.07 7.6% 10.7%
$0
$20
$40
$60
$80
$100
$120
$140
$160
$180
Mail On-Air Telemarketing Web On-Air + WebPledge
Overall
FY06
FY07
FY08
FY09
FY10
Carol Rhine | Page #14 © 2011 Blackbaud
donorCentrics Collaborative Benchmarking Service
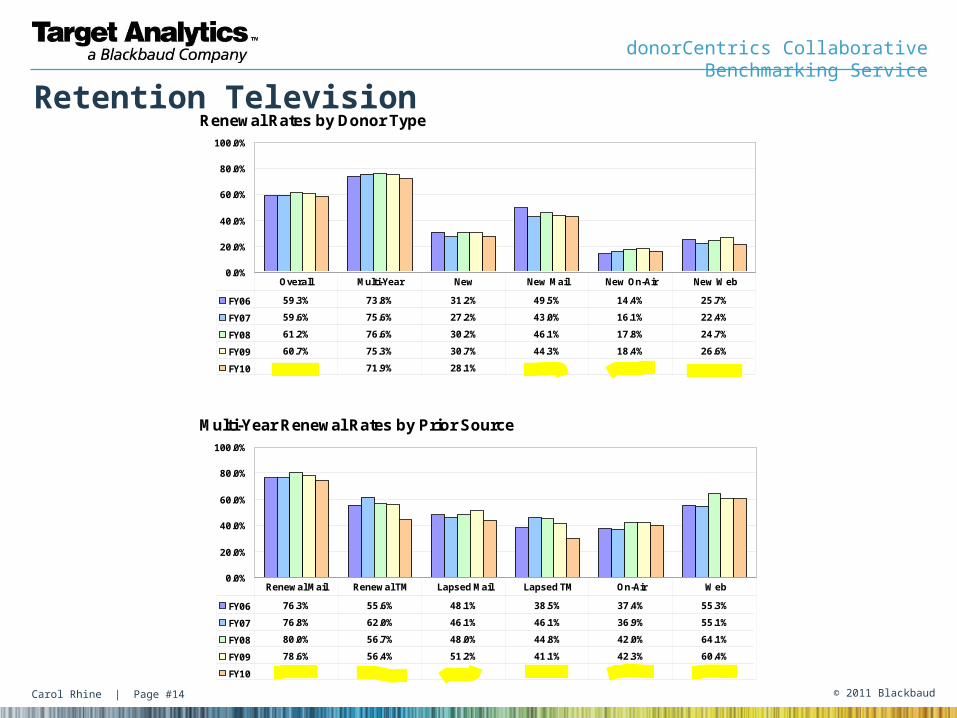
Retention TelevisionRenewal Rates by Donor Type
0.0%
20.0%
40.0%
60.0%
80.0%
100.0%
FY06 59.3% 73.8% 31.2% 49.5% 14.4% 25.7%
FY07 59.6% 75.6% 27.2% 43.0% 16.1% 22.4%
FY08 61.2% 76.6% 30.2% 46.1% 17.8% 24.7%
FY09 60.7% 75.3% 30.7% 44.3% 18.4% 26.6%
FY10 58.1% 71.9% 28.1% 42.9% 16.2% 21.8%
Overall Multi-Year New New Mail New On-Air New Web
Multi-Year Renewal Rates by Prior Source
0.0%
20.0%
40.0%
60.0%
80.0%
100.0%
FY06 76.3% 55.6% 48.1% 38.5% 37.4% 55.3%
FY07 76.8% 62.0% 46.1% 46.1% 36.9% 55.1%
FY08 80.0% 56.7% 48.0% 44.8% 42.0% 64.1%
FY09 78.6% 56.4% 51.2% 41.1% 42.3% 60.4%
FY10 74.6% 44.4% 43.9% 30.4% 40.4% 60.6%
Renewal Mail Renewal TM Lapsed Mail Lapsed TM On-Air Web
Carol Rhine | Page #15 © 2011 Blackbaud
donorCentrics Collaborative Benchmarking Service
Retention Television
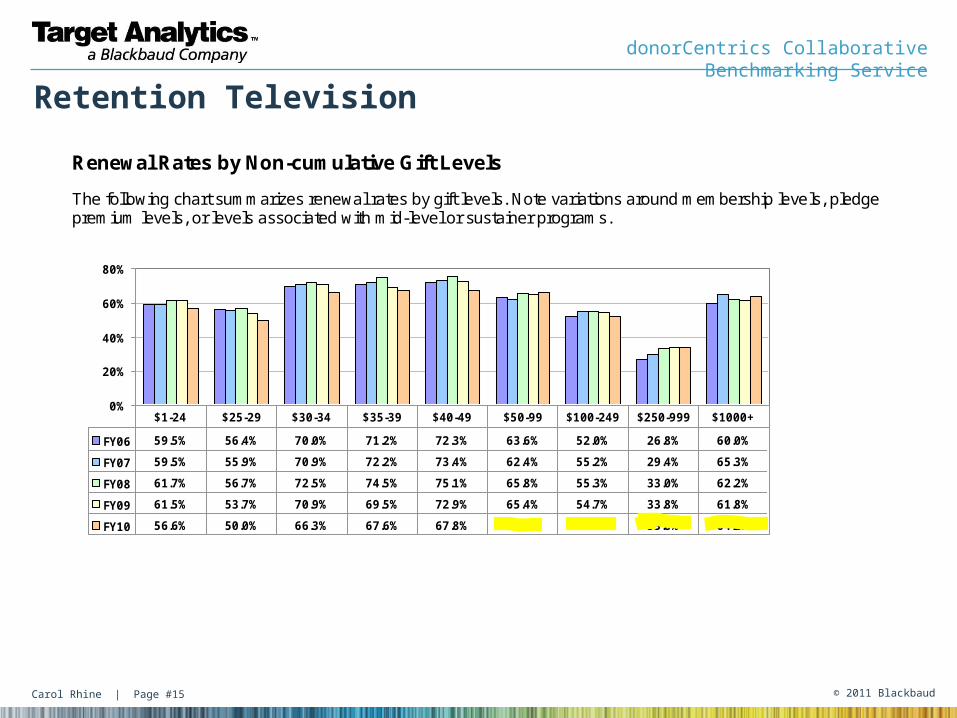
Renewal Rates by Non-cumulative Gift Levels
The following chart summarizes renewal rates by gift levels. Note variations around membership levels, pledge premium levels, or levels associated with mid-level or sustainer programs.
0%
20%
40%
60%
80%
FY06 59.5% 56.4% 70.0% 71.2% 72.3% 63.6% 52.0% 26.8% 60.0%
FY07 59.5% 55.9% 70.9% 72.2% 73.4% 62.4% 55.2% 29.4% 65.3%
FY08 61.7% 56.7% 72.5% 74.5% 75.1% 65.8% 55.3% 33.0% 62.2%
FY09 61.5% 53.7% 70.9% 69.5% 72.9% 65.4% 54.7% 33.8% 61.8%
FY10 56.6% 50.0% 66.3% 67.6% 67.8% 66.4% 52.3% 33.8% 64.2%
$1-24 $25-29 $30-34 $35-39 $40-49 $50-99 $100-249 $250-999 $1000+
Carol Rhine | Page #16 © 2011 Blackbaud
donorCentrics Collaborative Benchmarking Service
Retention Television
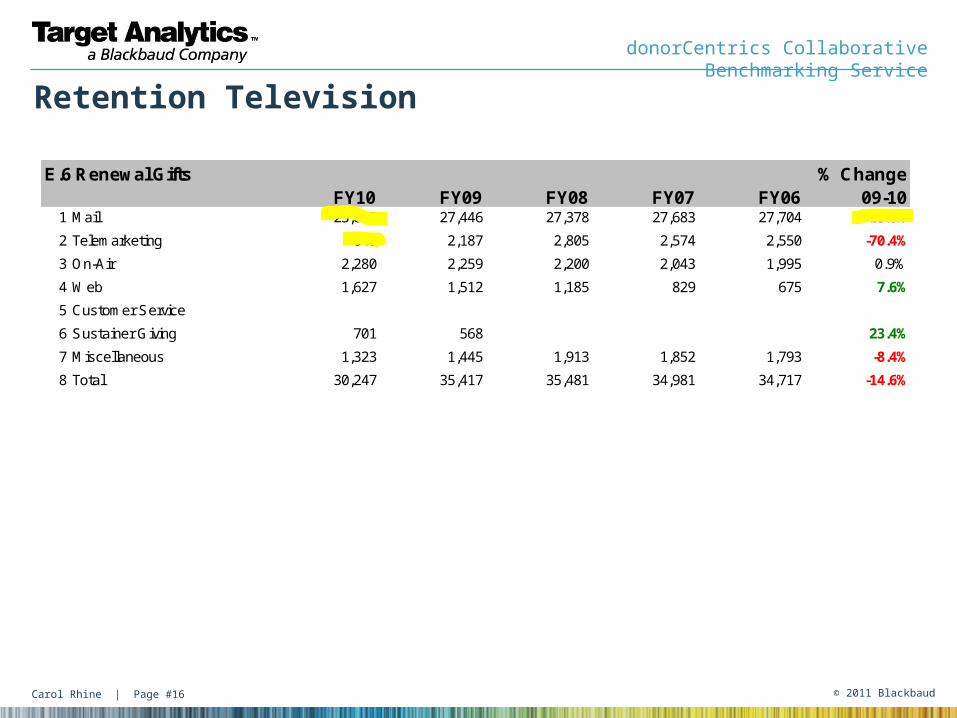
E.6 Renewal GiftsFY10 FY09 FY08 FY07 FY06
% Change 09-10
1 Mail 23,668 27,446 27,378 27,683 27,704 -13.8%
2 Telemarketing 648 2,187 2,805 2,574 2,550 -70.4%
3 On-Air 2,280 2,259 2,200 2,043 1,995 0.9%
4 Web 1,627 1,512 1,185 829 675 7.6%
5 Customer Service
6 Sustainer Giving 701 568 23.4%
7 Miscellaneous 1,323 1,445 1,913 1,852 1,793 -8.4%
8 Total 30,247 35,417 35,481 34,981 34,717 -14.6%
Carol Rhine | Page #17 © 2011 Blackbaud
donorCentrics Collaborative Benchmarking Service
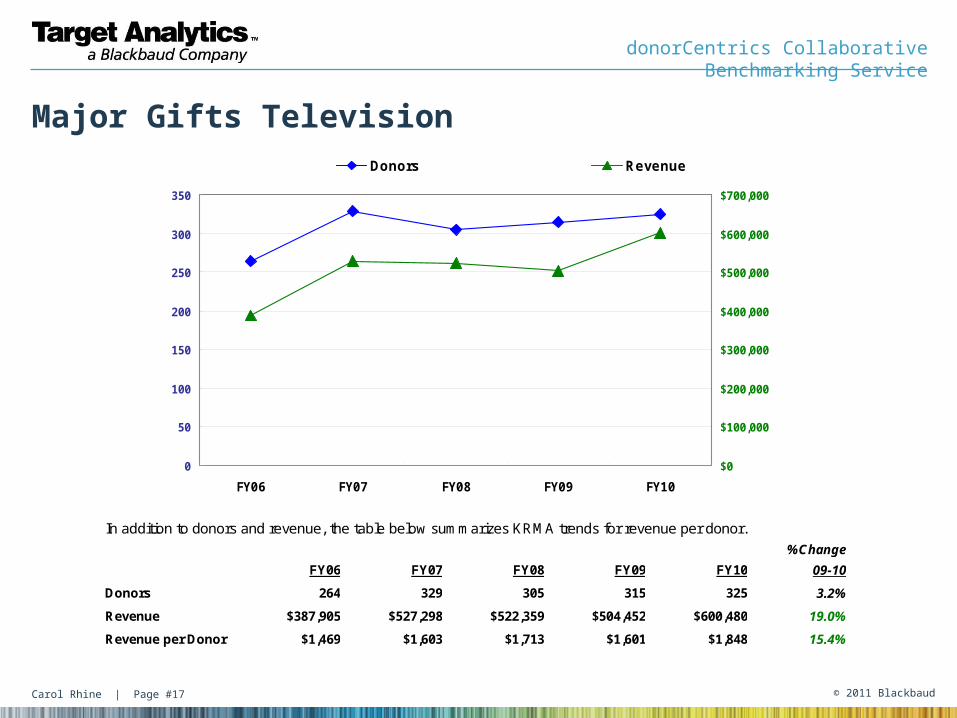
Major Gifts Television
0
50
100
150
200
250
300
350
FY06 FY07 FY08 FY09 FY10
$0
$100,000
$200,000
$300,000
$400,000
$500,000
$600,000
$700,000
Donors Revenue
In addition to donors and revenue, the table below summarizes KRMA trends for revenue per donor.
%Change
FY06 FY07 FY08 FY09 FY10 09-10
Donors 264 329 305 315 325 3.2%
Revenue $387,905 $527,298 $522,359 $504,452 $600,480 19.0%
Revenue per Donor $1,469 $1,603 $1,713 $1,601 $1,848 15.4%
Carol Rhine | Page #18 © 2011 Blackbaud
donorCentrics Collaborative Benchmarking Service
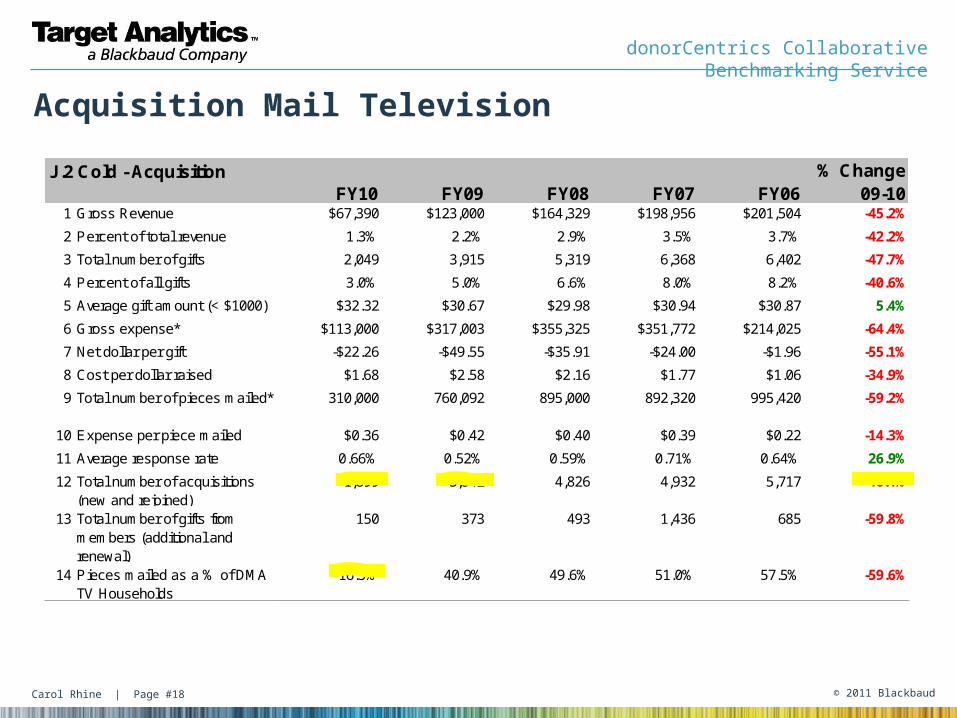
Acquisition Mail Television
J.2 Cold - AcquisitionFY10 FY09 FY08 FY07 FY06
% Change 09-10
1 Gross Revenue $67,390 $123,000 $164,329 $198,956 $201,504 -45.2%
2 Percent of total revenue 1.3% 2.2% 2.9% 3.5% 3.7% -42.2%
3 Total number of gifts 2,049 3,915 5,319 6,368 6,402 -47.7%
4 Percent of all gifts 3.0% 5.0% 6.6% 8.0% 8.2% -40.6%
5 Average gift amount (< $1000) $32.32 $30.67 $29.98 $30.94 $30.87 5.4%
6 Gross expense* $113,000 $317,003 $355,325 $351,772 $214,025 -64.4%
7 Net dollar per gift -$22.26 -$49.55 -$35.91 -$24.00 -$1.96 -55.1%
8 Cost per dollar raised $1.68 $2.58 $2.16 $1.77 $1.06 -34.9%
9 Total number of pieces mailed* 310,000 760,092 895,000 892,320 995,420 -59.2%
10 Expense per piece mailed $0.36 $0.42 $0.40 $0.39 $0.22 -14.3%
11 Average response rate 0.66% 0.52% 0.59% 0.71% 0.64% 26.9%
12 Total number of acquisitions (new and rejoined)
1,899 3,542 4,826 4,932 5,717 -46.4%
13 Total number of gifts from members (additional and renewal)
150 373 493 1,436 685 -59.8%
14 Pieces mailed as a % of DMA TV Households
16.5% 40.9% 49.6% 51.0% 57.5% -59.6%
Carol Rhine | Page #19 © 2011 Blackbaud
donorCentrics Collaborative Benchmarking Service
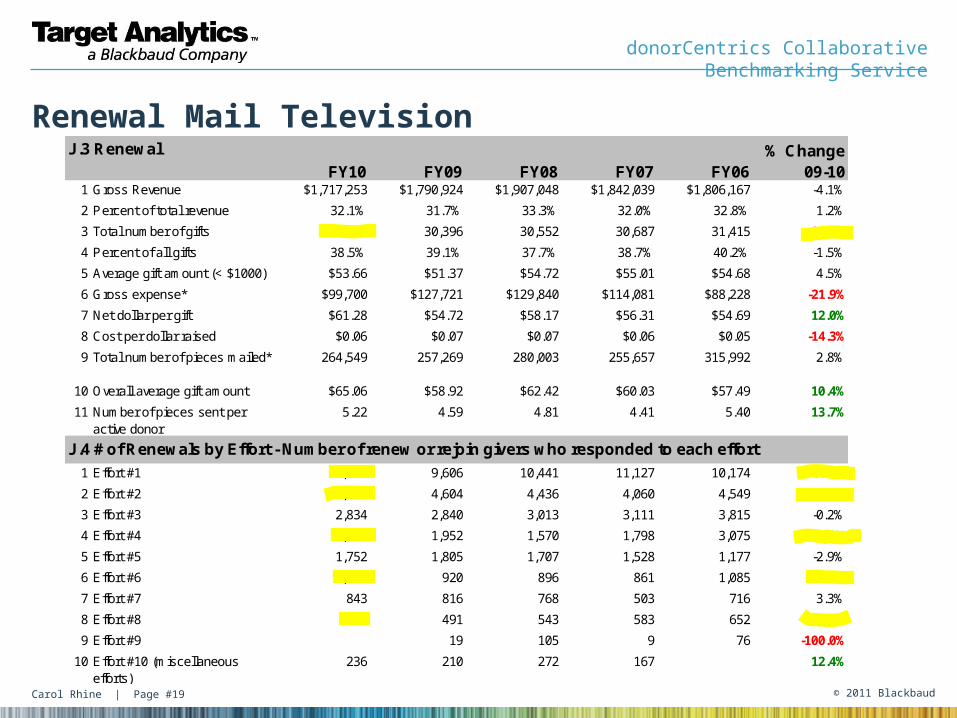
Renewal Mail TelevisionJ.3 Renewal
FY10 FY09 FY08 FY07 FY06% Change
09-101 Gross Revenue $1,717,253 $1,790,924 $1,907,048 $1,842,039 $1,806,167 -4.1%
2 Percent of total revenue 32.1% 31.7% 33.3% 32.0% 32.8% 1.2%
3 Total number of gifts 26,396 30,396 30,552 30,687 31,415 -13.2%
4 Percent of all gifts 38.5% 39.1% 37.7% 38.7% 40.2% -1.5%
5 Average gift amount (< $1000) $53.66 $51.37 $54.72 $55.01 $54.68 4.5%
6 Gross expense* $99,700 $127,721 $129,840 $114,081 $88,228 -21.9%
7 Net dollar per gift $61.28 $54.72 $58.17 $56.31 $54.69 12.0%
8 Cost per dollar raised $0.06 $0.07 $0.07 $0.06 $0.05 -14.3%
9 Total number of pieces mailed* 264,549 257,269 280,003 255,657 315,992 2.8%
10 Overall average gift amount $65.06 $58.92 $62.42 $60.03 $57.49 10.4%
11 Number of pieces sent per active donor
5.22 4.59 4.81 4.41 5.40 13.7%
J.4 # of Renewals by Effort - Number of renew or rejoin givers who responded to each effort
1 Effort #1 5,306 9,606 10,441 11,127 10,174 -44.8%
2 Effort #2 2,532 4,604 4,436 4,060 4,549 -45.0%
3 Effort #3 2,834 2,840 3,013 3,111 3,815 -0.2%
4 Effort #4 4,454 1,952 1,570 1,798 3,075 128.2%
5 Effort #5 1,752 1,805 1,707 1,528 1,177 -2.9%
6 Effort #6 1,065 920 896 861 1,085 15.8%
7 Effort #7 843 816 768 503 716 3.3%
8 Effort #8 786 491 543 583 652 60.1%
9 Effort #9 19 105 9 76 -100.0%
10 Effort #10 (miscellaneous efforts)
236 210 272 167 12.4%
Carol Rhine | Page #20 © 2011 Blackbaud
donorCentrics Collaborative Benchmarking Service
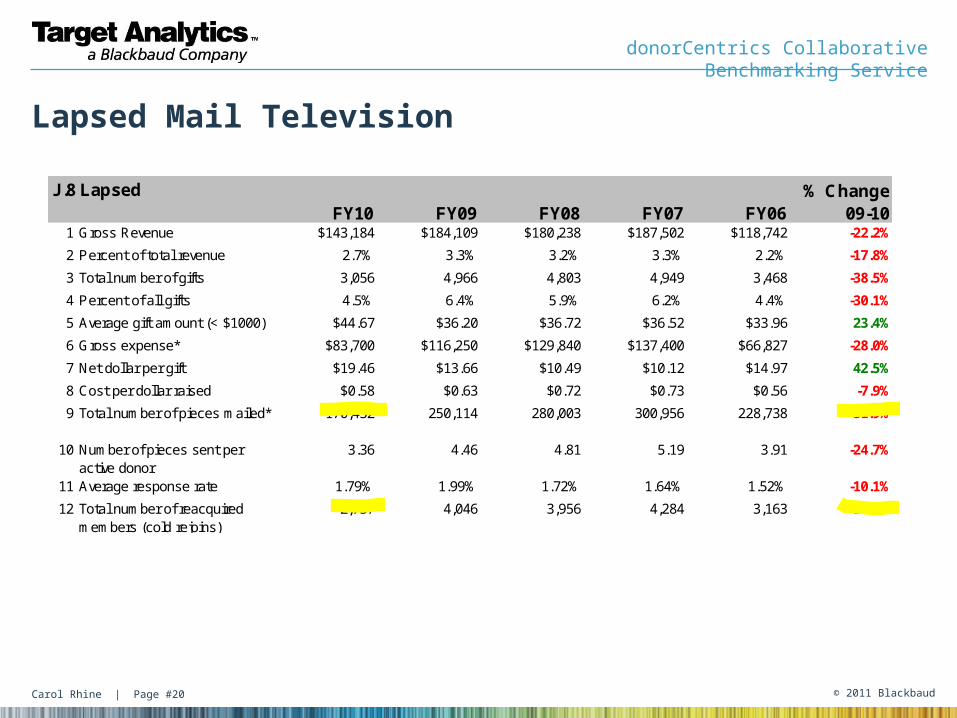
Lapsed Mail Television
J.8 LapsedFY10 FY09 FY08 FY07 FY06
% Change 09-10
1 Gross Revenue $143,184 $184,109 $180,238 $187,502 $118,742 -22.2%
2 Percent of total revenue 2.7% 3.3% 3.2% 3.3% 2.2% -17.8%
3 Total number of gifts 3,056 4,966 4,803 4,949 3,468 -38.5%
4 Percent of all gifts 4.5% 6.4% 5.9% 6.2% 4.4% -30.1%
5 Average gift amount (< $1000) $44.67 $36.20 $36.72 $36.52 $33.96 23.4%
6 Gross expense* $83,700 $116,250 $129,840 $137,400 $66,827 -28.0%
7 Net dollar per gift $19.46 $13.66 $10.49 $10.12 $14.97 42.5%
8 Cost per dollar raised $0.58 $0.63 $0.72 $0.73 $0.56 -7.9%
9 Total number of pieces mailed* 170,432 250,114 280,003 300,956 228,738 -31.9%
10 Number of pieces sent per active donor
3.36 4.46 4.81 5.19 3.91 -24.7%
11 Average response rate 1.79% 1.99% 1.72% 1.64% 1.52% -10.1%
12 Total number of reacquired members (cold rejoins)
2,737 4,046 3,956 4,284 3,163 -32.4%
Carol Rhine | Page #21 © 2011 Blackbaud
donorCentrics Collaborative Benchmarking Service
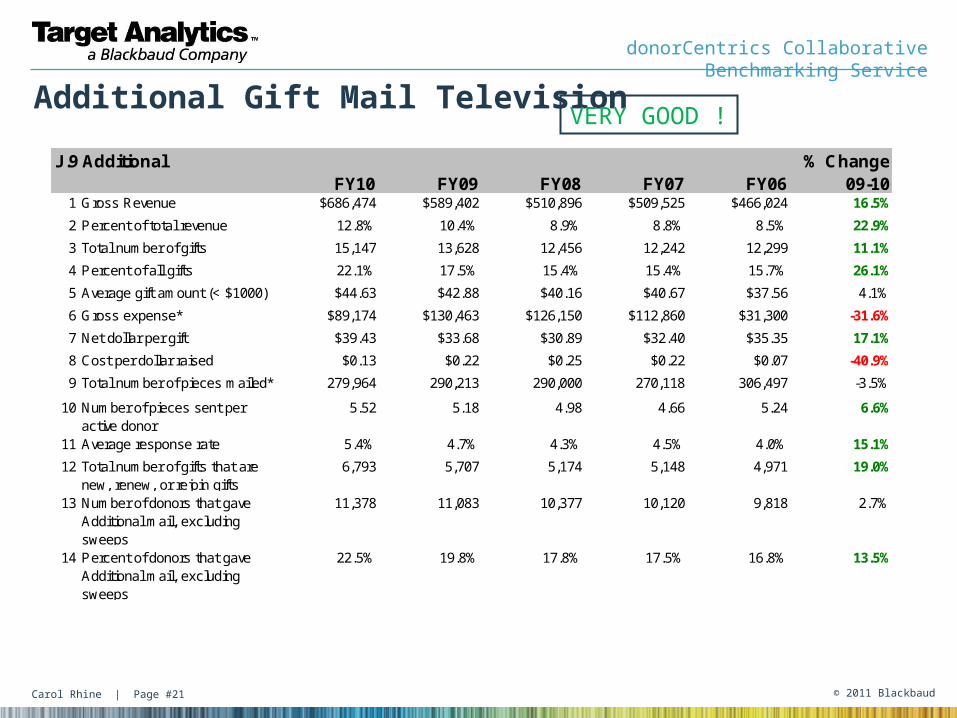
Additional Gift Mail Television
J.9 AdditionalFY10 FY09 FY08 FY07 FY06
% Change 09-10
1 Gross Revenue $686,474 $589,402 $510,896 $509,525 $466,024 16.5%
2 Percent of total revenue 12.8% 10.4% 8.9% 8.8% 8.5% 22.9%
3 Total number of gifts 15,147 13,628 12,456 12,242 12,299 11.1%
4 Percent of all gifts 22.1% 17.5% 15.4% 15.4% 15.7% 26.1%
5 Average gift amount (< $1000) $44.63 $42.88 $40.16 $40.67 $37.56 4.1%
6 Gross expense* $89,174 $130,463 $126,150 $112,860 $31,300 -31.6%
7 Net dollar per gift $39.43 $33.68 $30.89 $32.40 $35.35 17.1%
8 Cost per dollar raised $0.13 $0.22 $0.25 $0.22 $0.07 -40.9%
9 Total number of pieces mailed* 279,964 290,213 290,000 270,118 306,497 -3.5%
10 Number of pieces sent per active donor
5.52 5.18 4.98 4.66 5.24 6.6%
11 Average response rate 5.4% 4.7% 4.3% 4.5% 4.0% 15.1%
12 Total number of gifts that are new, renew, or rejoin gifts
6,793 5,707 5,174 5,148 4,971 19.0%
13 Number of donors that gave Additional mail, excluding sweeps
11,378 11,083 10,377 10,120 9,818 2.7%
14 Percent of donors that gave Additional mail, excluding sweeps
22.5% 19.8% 17.8% 17.5% 16.8% 13.5%
VERY GOOD !
Carol Rhine | Page #22 © 2011 Blackbaud
donorCentrics Collaborative Benchmarking Service
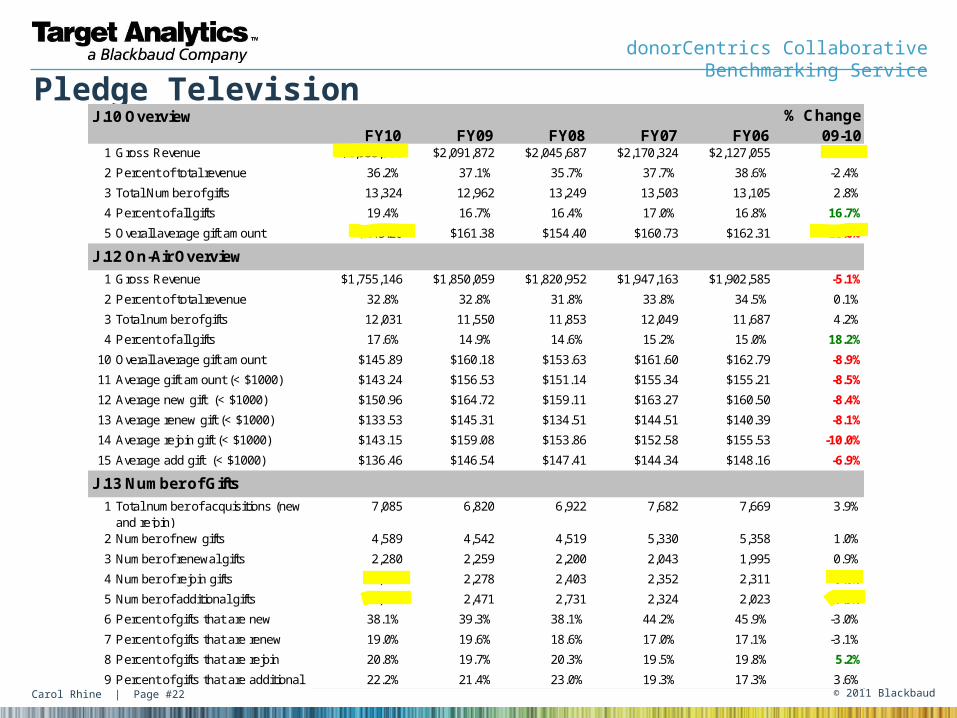
Pledge TelevisionJ.10 Overview
FY10 FY09 FY08 FY07 FY06% Change
09-101 Gross Revenue $1,935,511 $2,091,872 $2,045,687 $2,170,324 $2,127,055 -7.5%
2 Percent of total revenue 36.2% 37.1% 35.7% 37.7% 38.6% -2.4%
3 Total Number of gifts 13,324 12,962 13,249 13,503 13,105 2.8%
4 Percent of all gifts 19.4% 16.7% 16.4% 17.0% 16.8% 16.7%
5 Overall average gift amount $145.26 $161.38 $154.40 $160.73 $162.31 -10.0%
J.12 On-Air Overview
1 Gross Revenue $1,755,146 $1,850,059 $1,820,952 $1,947,163 $1,902,585 -5.1%
2 Percent of total revenue 32.8% 32.8% 31.8% 33.8% 34.5% 0.1%
3 Total number of gifts 12,031 11,550 11,853 12,049 11,687 4.2%
4 Percent of all gifts 17.6% 14.9% 14.6% 15.2% 15.0% 18.2%
10 Overall average gift amount $145.89 $160.18 $153.63 $161.60 $162.79 -8.9%
11 Average gift amount (< $1000) $143.24 $156.53 $151.14 $155.34 $155.21 -8.5%
12 Average new gift (< $1000) $150.96 $164.72 $159.11 $163.27 $160.50 -8.4%
13 Average renew gift (< $1000) $133.53 $145.31 $134.51 $144.51 $140.39 -8.1%
14 Average rejoin gift (< $1000) $143.15 $159.08 $153.86 $152.58 $155.53 -10.0%
15 Average add gift (< $1000) $136.46 $146.54 $147.41 $144.34 $148.16 -6.9%
J.13 Number of Gifts
1 Total number of acquisitions (new and rejoin)
7,085 6,820 6,922 7,682 7,669 3.9%
2 Number of new gifts 4,589 4,542 4,519 5,330 5,358 1.0%
3 Number of renewal gifts 2,280 2,259 2,200 2,043 1,995 0.9%
4 Number of rejoin gifts 2,496 2,278 2,403 2,352 2,311 9.6%
5 Number of additional gifts 2,666 2,471 2,731 2,324 2,023 7.9%
6 Percent of gifts that are new 38.1% 39.3% 38.1% 44.2% 45.9% -3.0%
7 Percent of gifts that are renew 19.0% 19.6% 18.6% 17.0% 17.1% -3.1%
8 Percent of gifts that are rejoin 20.8% 19.7% 20.3% 19.5% 19.8% 5.2%
9 Percent of gifts that are additional 22.2% 21.4% 23.0% 19.3% 17.3% 3.6%
Carol Rhine | Page #23 © 2011 Blackbaud
donorCentrics Collaborative Benchmarking Service
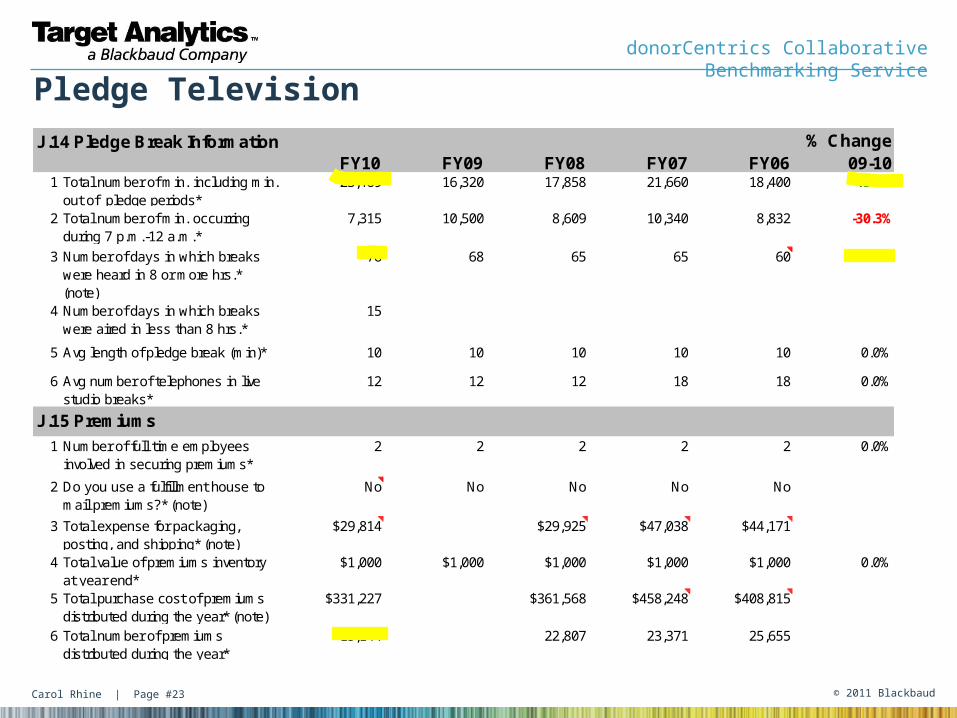
Pledge Television
J.14 Pledge Break InformationFY10 FY09 FY08 FY07 FY06
% Change 09-10
1 Total number of min. including min. out of pledge periods*
23,469 16,320 17,858 21,660 18,400 43.8%
2 Total number of min. occurring during 7 p.m.-12 a.m.*
7,315 10,500 8,609 10,340 8,832 -30.3%
3 Number of days in which breaks were heard in 8 or more hrs.* (note)
76 68 65 65 60 11.8%
4 Number of days in which breaks were aired in less than 8 hrs.*
15
5 Avg length of pledge break (min)* 10 10 10 10 10 0.0%
6 Avg number of telephones in live studio breaks*
12 12 12 18 18 0.0%
J.15 Premiums
1 Number of full time employees involved in securing premiums*
2 2 2 2 2 0.0%
2 Do you use a fulfillment house to mail premiums?* (note)
No No No No No
3 Total expense for packaging, posting, and shipping* (note)
$29,814 $29,925 $47,038 $44,171
4 Total value of premiums inventory at year end*
$1,000 $1,000 $1,000 $1,000 $1,000 0.0%
5 Total purchase cost of premiums distributed during the year* (note)
$331,227 $361,568 $458,248 $408,815
6 Total number of premiums distributed during the year*
15,144 22,807 23,371 25,655
Carol Rhine | Page #24 © 2011 Blackbaud
donorCentrics Collaborative Benchmarking Service
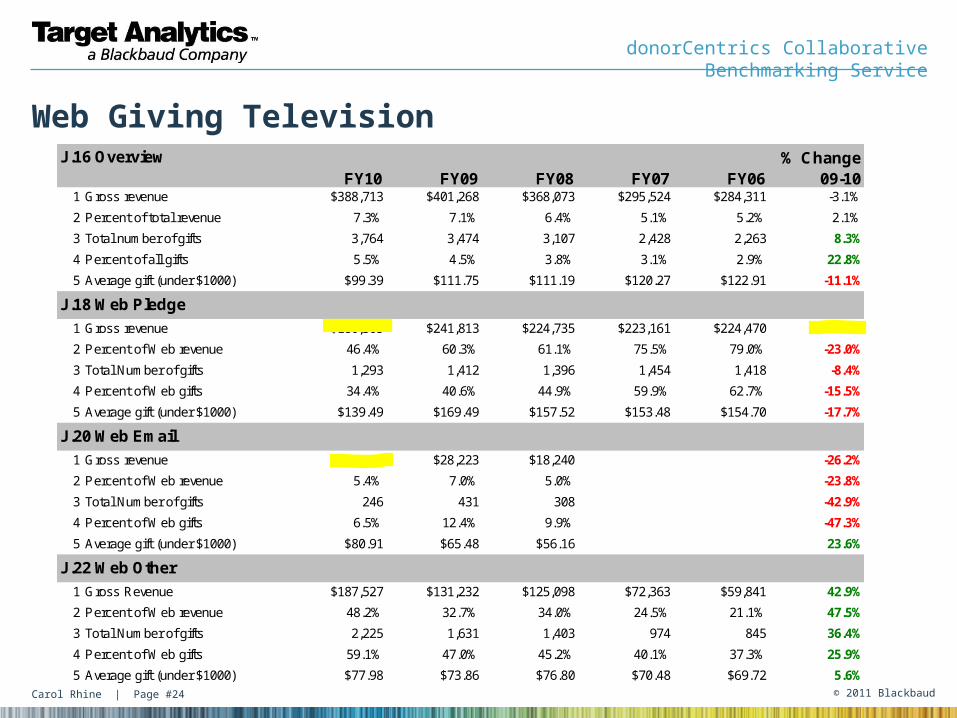
Web Giving TelevisionJ.16 Overview
FY10 FY09 FY08 FY07 FY06% Change
09-101 Gross revenue $388,713 $401,268 $368,073 $295,524 $284,311 -3.1%
2 Percent of total revenue 7.3% 7.1% 6.4% 5.1% 5.2% 2.1%
3 Total number of gifts 3,764 3,474 3,107 2,428 2,263 8.3%
4 Percent of all gifts 5.5% 4.5% 3.8% 3.1% 2.9% 22.8%
5 Average gift (under $1000) $99.39 $111.75 $111.19 $120.27 $122.91 -11.1%
J.18 Web Pledge
1 Gross revenue $180,365 $241,813 $224,735 $223,161 $224,470 -25.4%
2 Percent of Web revenue 46.4% 60.3% 61.1% 75.5% 79.0% -23.0%
3 Total Number of gifts 1,293 1,412 1,396 1,454 1,418 -8.4%
4 Percent of Web gifts 34.4% 40.6% 44.9% 59.9% 62.7% -15.5%
5 Average gift (under $1000) $139.49 $169.49 $157.52 $153.48 $154.70 -17.7%
J.20 Web Email
1 Gross revenue $20,822 $28,223 $18,240 -26.2%
2 Percent of Web revenue 5.4% 7.0% 5.0% -23.8%
3 Total Number of gifts 246 431 308 -42.9%
4 Percent of Web gifts 6.5% 12.4% 9.9% -47.3%
5 Average gift (under $1000) $80.91 $65.48 $56.16 23.6%
J.22 Web Other
1 Gross Revenue $187,527 $131,232 $125,098 $72,363 $59,841 42.9%
2 Percent of Web revenue 48.2% 32.7% 34.0% 24.5% 21.1% 47.5%
3 Total Number of gifts 2,225 1,631 1,403 974 845 36.4%
4 Percent of Web gifts 59.1% 47.0% 45.2% 40.1% 37.3% 25.9%
5 Average gift (under $1000) $77.98 $73.86 $76.80 $70.48 $69.72 5.6%
Carol Rhine | Page #25 © 2011 Blackbaud
donorCentrics Collaborative Benchmarking Service
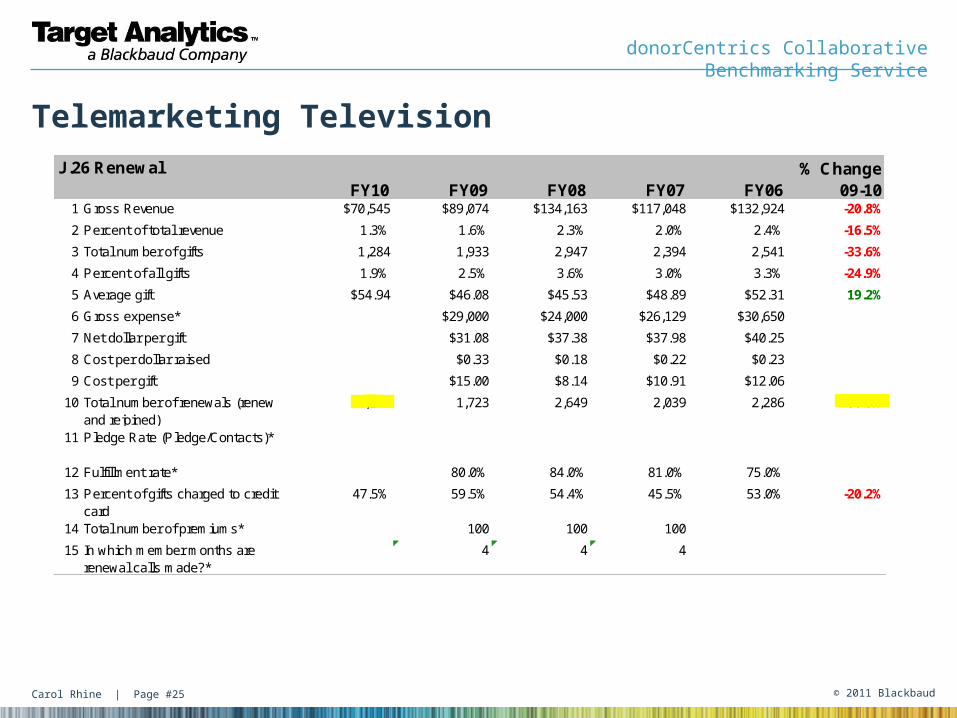
Telemarketing TelevisionJ.26 Renewal
FY10 FY09 FY08 FY07 FY06% Change
09-101 Gross Revenue $70,545 $89,074 $134,163 $117,048 $132,924 -20.8%
2 Percent of total revenue 1.3% 1.6% 2.3% 2.0% 2.4% -16.5%
3 Total number of gifts 1,284 1,933 2,947 2,394 2,541 -33.6%
4 Percent of all gifts 1.9% 2.5% 3.6% 3.0% 3.3% -24.9%
5 Average gift $54.94 $46.08 $45.53 $48.89 $52.31 19.2%
6 Gross expense* $29,000 $24,000 $26,129 $30,650
7 Net dollar per gift $31.08 $37.38 $37.98 $40.25
8 Cost per dollar raised $0.33 $0.18 $0.22 $0.23
9 Cost per gift $15.00 $8.14 $10.91 $12.06
10 Total number of renewals (renew and rejoined)
1,197 1,723 2,649 2,039 2,286 -30.5%
11 Pledge Rate (Pledge/Contacts)*
12 Fulfillment rate* 80.0% 84.0% 81.0% 75.0%
13 Percent of gifts charged to credit card
47.5% 59.5% 54.4% 45.5% 53.0% -20.2%
14 Total number of premiums* 100 100 100
15 In which member months are renewal calls made?*
4 4 4
Carol Rhine | Page #26 © 2011 Blackbaud
donorCentrics Collaborative Benchmarking Service
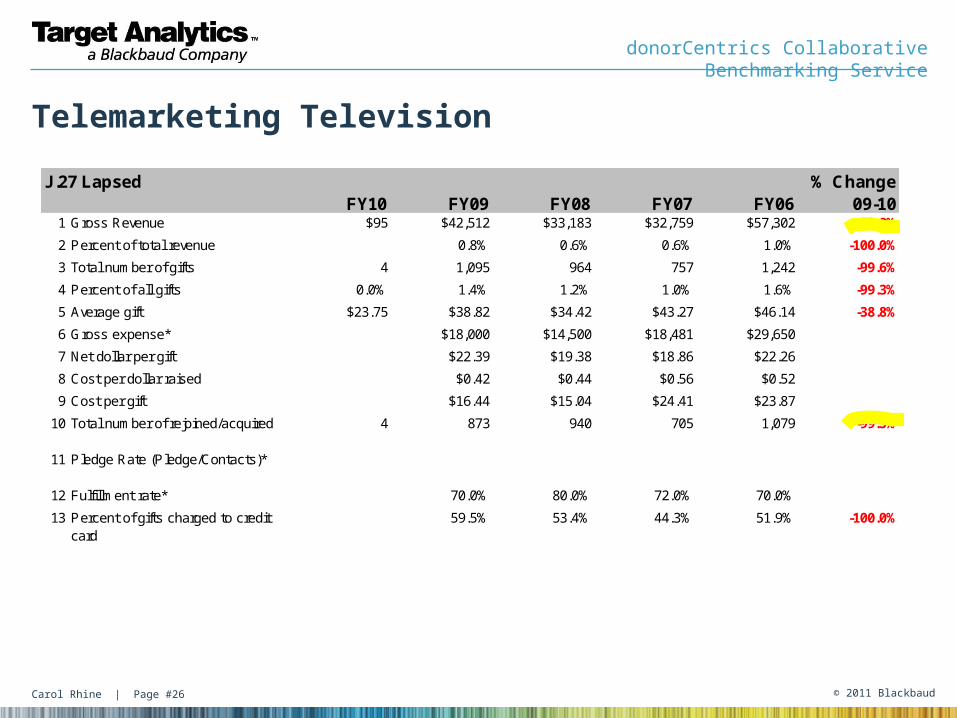
Telemarketing Television
J.27 LapsedFY10 FY09 FY08 FY07 FY06
% Change 09-10
1 Gross Revenue $95 $42,512 $33,183 $32,759 $57,302 -99.8%
2 Percent of total revenue 0.8% 0.6% 0.6% 1.0% -100.0%
3 Total number of gifts 4 1,095 964 757 1,242 -99.6%
4 Percent of all gifts 0.0% 1.4% 1.2% 1.0% 1.6% -99.3%
5 Average gift $23.75 $38.82 $34.42 $43.27 $46.14 -38.8%
6 Gross expense* $18,000 $14,500 $18,481 $29,650
7 Net dollar per gift $22.39 $19.38 $18.86 $22.26
8 Cost per dollar raised $0.42 $0.44 $0.56 $0.52
9 Cost per gift $16.44 $15.04 $24.41 $23.87
10 Total number of rejoined/acquired 4 873 940 705 1,079 -99.5%
11 Pledge Rate (Pledge/Contacts)*
12 Fulfillment rate* 70.0% 80.0% 72.0% 70.0%
13 Percent of gifts charged to credit card
59.5% 53.4% 44.3% 51.9% -100.0%
Carol Rhine | Page #27 © 2011 Blackbaud
donorCentrics Collaborative Benchmarking Service
Telemarketing Television
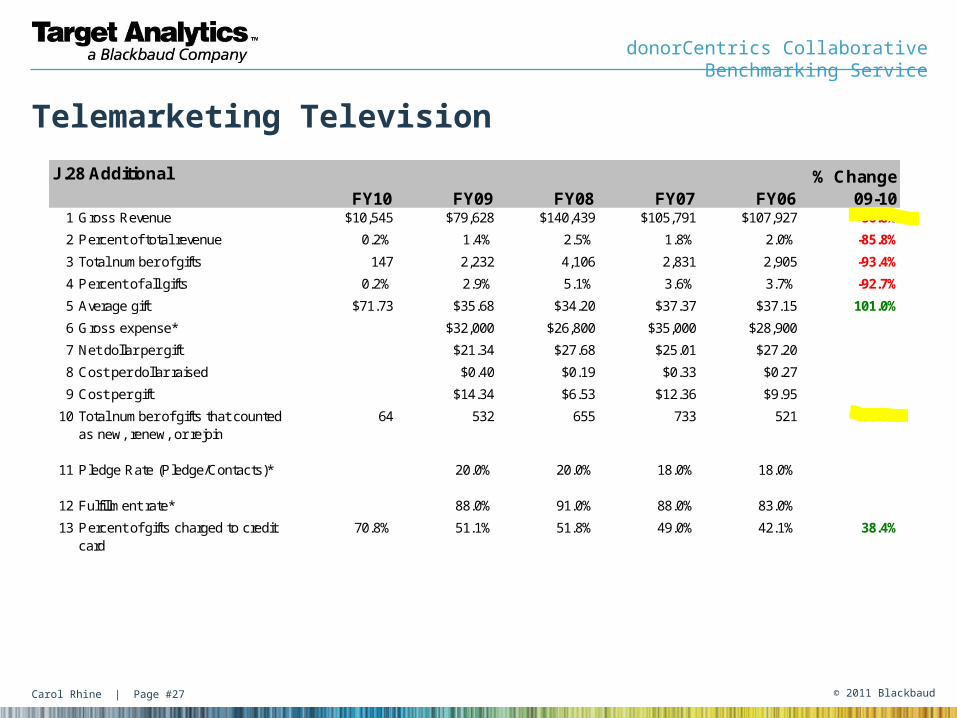
J.28 Additional
FY10 FY09 FY08 FY07 FY06% Change
09-101 Gross Revenue $10,545 $79,628 $140,439 $105,791 $107,927 -86.8%
2 Percent of total revenue 0.2% 1.4% 2.5% 1.8% 2.0% -85.8%
3 Total number of gifts 147 2,232 4,106 2,831 2,905 -93.4%
4 Percent of all gifts 0.2% 2.9% 5.1% 3.6% 3.7% -92.7%
5 Average gift $71.73 $35.68 $34.20 $37.37 $37.15 101.0%
6 Gross expense* $32,000 $26,800 $35,000 $28,900
7 Net dollar per gift $21.34 $27.68 $25.01 $27.20
8 Cost per dollar raised $0.40 $0.19 $0.33 $0.27
9 Cost per gift $14.34 $6.53 $12.36 $9.95
10 Total number of gifts that counted as new, renew, or rejoin
64 532 655 733 521 -88.0%
11 Pledge Rate (Pledge/Contacts)* 20.0% 20.0% 18.0% 18.0%
12 Fulfillment rate* 88.0% 91.0% 88.0% 83.0%
13 Percent of gifts charged to credit card
70.8% 51.1% 51.8% 49.0% 42.1% 38.4%
Carol Rhine | Page #28 © 2011 Blackbaud
donorCentrics Collaborative Benchmarking Service
Sustained Giving Television
0
100
200
300
400
500
600
700
800
900
1,000
FY06 FY07 FY08 FY09 FY10
$0
$20,000
$40,000
$60,000
$80,000
$100,000
$120,000
$140,000
Donors Revenue
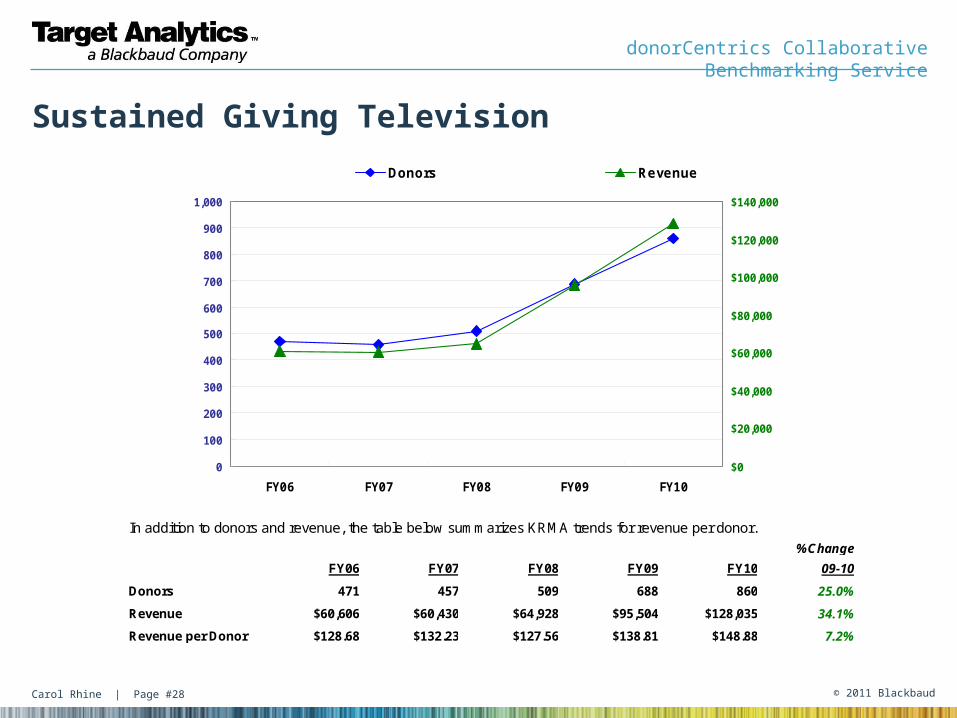
In addition to donors and revenue, the table below summarizes KRMA trends for revenue per donor.
%Change
FY06 FY07 FY08 FY09 FY10 09-10
Donors 471 457 509 688 860 25.0%
Revenue $60,606 $60,430 $64,928 $95,504 $128,035 34.1%
Revenue per Donor $128.68 $132.23 $127.56 $138.81 $148.88 7.2%
Carol Rhine | Page #29 © 2011 Blackbaud
donorCentrics Collaborative Benchmarking Service
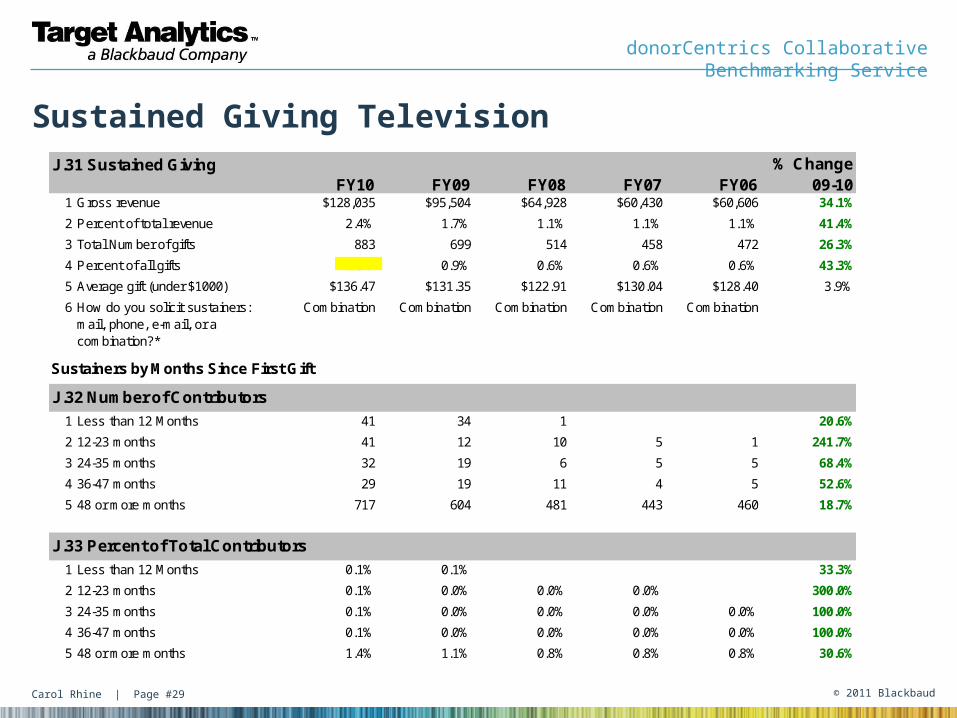
Sustained Giving TelevisionJ.31 Sustained Giving
FY10 FY09 FY08 FY07 FY06% Change
09-101 Gross revenue $128,035 $95,504 $64,928 $60,430 $60,606 34.1%
2 Percent of total revenue 2.4% 1.7% 1.1% 1.1% 1.1% 41.4%
3 Total Number of gifts 883 699 514 458 472 26.3%
4 Percent of all gifts 1.3% 0.9% 0.6% 0.6% 0.6% 43.3%
5 Average gift (under $1000) $136.47 $131.35 $122.91 $130.04 $128.40 3.9%
6 How do you solicit sustainers: mail, phone, e-mail, or a combination?*
Combination Combination Combination Combination Combination
Sustainers by Months Since First Gift
J.32 Number of Contributors
1 Less than 12 Months 41 34 1 20.6%
2 12-23 months 41 12 10 5 1 241.7%
3 24-35 months 32 19 6 5 5 68.4%
4 36-47 months 29 19 11 4 5 52.6%
5 48 or more months 717 604 481 443 460 18.7%
J.33 Percent of Total Contributors
1 Less than 12 Months 0.1% 0.1% 33.3%
2 12-23 months 0.1% 0.0% 0.0% 0.0% 300.0%
3 24-35 months 0.1% 0.0% 0.0% 0.0% 0.0% 100.0%
4 36-47 months 0.1% 0.0% 0.0% 0.0% 0.0% 100.0%
5 48 or more months 1.4% 1.1% 0.8% 0.8% 0.8% 30.6%