Embed Size (px)
Citation preview

Krista Bahm, Maryellen Hearn
Melissa Anson, Liza LePage, Tom Marcello, Woody Mawhinney, Leah Wang,
Phil Camill, Eileen Johnson
Bowdoin College
Environmental Studies
Spring 2011

Project Goals
� Address State of Maine Climate Adaptation Plan
� Analyze coastal vulnerability and sea level rise in the towns of Brunswick and Harpswell
� Develop a simplified methodology that can be replicated in other coastal communities
� 85% of New England coastal communities have a population of 50,000 or less
Address State of Maine Climate Adaptation Plan, “People and Nature Adapting to a
Changing Climate.”
Perform a preliminary analysis of coastal vulnerability and sea level rise in the towns of
Brunswick and Harpswell.
Develop a methodology that can be replicated in other coastal communities.
Communicate our findings to the town residents, town officials, and state planning.
2
Study Region
Light detection and ranging data (LiDAR): provided by FEMA, 2006

Sea Level Rise Scenarios: 2100
Highest Annual Tide (HAT)
HAT + 0.61 m
HAT + 1 m
HAT + 2 m
� 0.61 meters (2.00 feet)
� 1.00 meter (3.28 feet)
� 2.00 meters (6.56 feet)
Based on predictions by MDEP (coastal sand dune rules, chapter 355), IPCC, Maine SPO, and EPA.
HAT calculated for Cushing Island b/c it was the nearest station that said on the Tides and
Currents site that it recorded in NAVD88, calculated using the MGS Tide Calculator
4

Categories of data analysis:� Land
� Acreage
� Parcels
� Valuation
� Infrastructure
� Buildings
� Roads
� Piers
� Marshes
For the remainder of the presentation we’re going to dive into the data and present the
analysis we’ve completed for Brunswick and Harpswell specifically. For the sea level rise
and storm surge scenarios we have decided to group our data analysis into various
categories including: land, buildings, population, infrastructure and marshes
5

Categories of data analysis:� Land
� Acreage
� Parcels
� Valuation
� Infrastructure
� Buildings
� Roads
� Piers
� Marshes
For the remainder of the presentation we’re going to dive into the data and present the
analysis we’ve completed for Brunswick and Harpswell specifically. For the sea level rise
and storm surge scenarios we have decided to group our data analysis into various
categories including: land, buildings, population, infrastructure and marshes
6

Main Point: Acreage inundated increases dramatically with greater sea level rise
Updated
This graph, is representative of SLR graphs you will be seeing throughout the presentation.
Note that horizontal axis depicts each of our 3 sea level rise scenarios. The vertical axis is
scaled to show the percentage of total acreage inundated. Brunswick is representated by
the blue bars on the left and harpswell will always be represented by the red bars on the
right. From this graph we can see that between .3% and 1% of Brunswick’s total acreage is
unundated under the SLR scenarios. In Harpswell between 1.6% and 5.5% of total acreage
is inundated. This gives you a sense of the scale of affected areas.
7
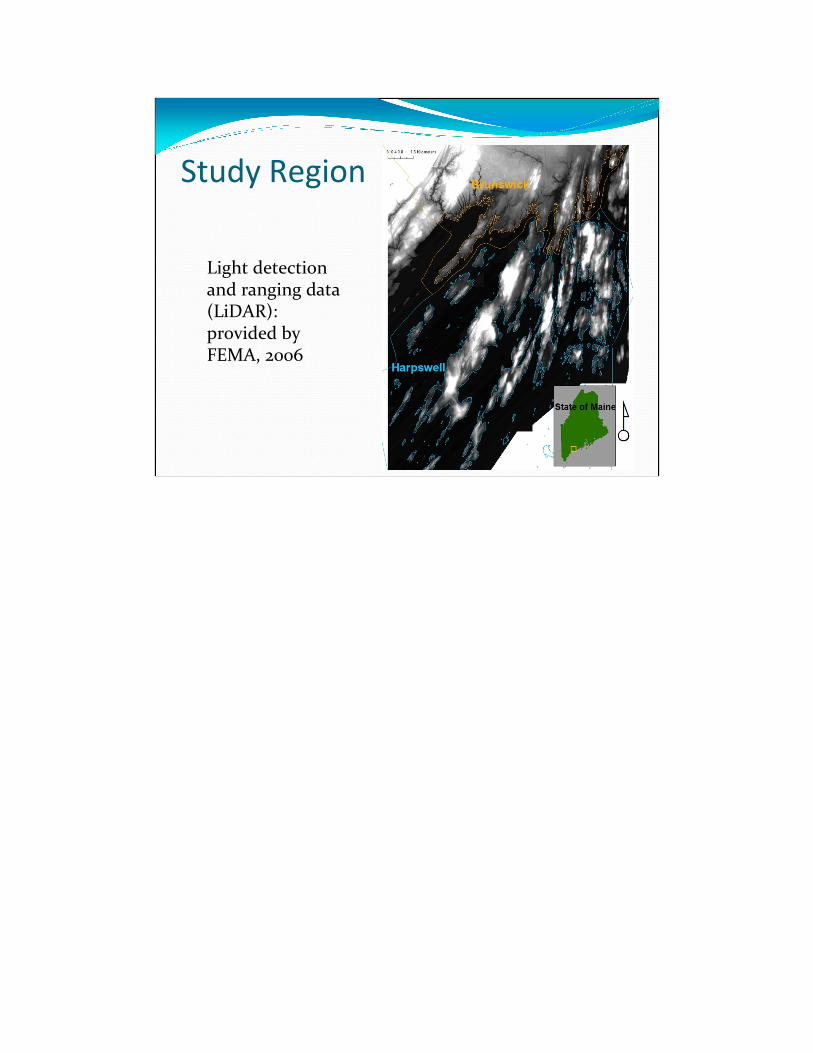
Main Point: The parcels affected do not increase significantly due to greater SLR, meaning
many of the same landowners will be affected, more severly
Still looking at SLR we broke down our land analysis in terms of parcel data we received
from the town offices. On the horizontal axis are the SLR scenarios. And on the vertical axis
lies a scale of percentage of total parcels affected. An important note on terminology, we
use the word “affected” to mean that a parcel has been touched by water due to SLR. We
can see that in Brunswick, the blue bars show us that in each scenario around 7% of the
parcels in the town are affected. Looking at the red bars, Harpswell, we see that around
50% of the total parcels are affected. This analysis is important because it tells us that
although more land area is inundated under increasingly greater SLR the number of parcels
does not increase much.
8

Sea Level Rise: Land Valuation Data
Main Point: Land value lost to inundation substantial and an important consideration for
tax assessment and revenue
METHODS:
Tax assessors value land based on lot size, current market prices, and neighborhood
characteristics
Obtained current parcel values from town offices, and joined this with our sea level rise
inundation data
Assumed a linear relationship between value and acreage
Estimated the total land value lost in each SLR scenario for Brunswick and Harpswell
9

Categories of data analysis:� Land
� Acreage
� Parcels
� Valuation
� Infrastructure
� Buildings
� Roads
� Piers
� Marshes
For the remainder of the presentation we’re going to dive into the data and present the
analysis we’ve completed for Brunswick and Harpswell specifically. For the sea level rise
and storm surge scenarios we have decided to group our data analysis into various
categories including: land, buildings, population, infrastructure and marshes
10

Sea Level Rise: Number of Buildings Affected
Main Point: Although these percentages do not appear large, keep in mind this is the
number of buildings that will be touched by sea level rise but a greater number of buildings
will become structurally vulnerable due SLR
Methods:
Building data combined with parcel data from the town tax assessors to attribute a
‘use type’ to each building
If water touches part of building, deemed “affected”
To determine valuation: the total tax assessor value of “improvements” to the land
were added for all affected buildings
How many buildings will be affected by SLR?
11

Sea Level Rise: Building Valuation
Main Point: The value of building affected but also requires money to repair
12

Categories of data analysis:� Land
� Acreage
� Parcels
� Valuation
� Infrastructure
� Buildings
� Roads
� Piers
� Marshes
For the remainder of the presentation we’re going to dive into the data and present the
analysis we’ve completed for Brunswick and Harpswell specifically. For the sea level rise
and storm surge scenarios we have decided to group our data analysis into various
categories including: land, buildings, population, infrastructure and marshes
13

Main Point: Significant road mileage will be cut off from the mainland due to SLR
METHODS
Mapped E911 roads and determined elevation of roads using LiDAR data
Observed inundated sections of roads
Will communities become isolated due to SLR?
14

.
Main Point: 10km/20km of water, substantial inundation that will be impassable. Also
water reducing structural integrity of roads (ex. 0.61m)
15

Sea Level Rise: Piers Affected
Main Point: Piers are important for livelihoods and will be greatly impacted
16

Categories of data analysis:� Land
� Acreage
� Parcels
� Valuation
� Infrastructure
� Buildings
� Roads
� Piers
� Marshes
For the remainder of the presentation we’re going to dive into the data and present the
analysis we’ve completed for Brunswick and Harpswell specifically. For the sea level rise
and storm surge scenarios we have decided to group our data analysis into various
categories including: land, buildings, population, infrastructure and marshes
17

Conservation Marsh Analysis
Main Point: Not much conservation marsh
Here is part of our ownership analysis. On the y-axis we’re seeing the number of acres
‘affected’ or becoming marsh under the different SLR. Orange designates public ownership,
or town-owned parcels, or land trust easements that have public access. Purple is all other
privately-owned open space. And there is a large effect on these parcels. An example of
how to react to these changes is to encourage private landowners to move to higher levels
of conservation of their land, like easements. The tax programs that exist for open space,
while they create incentives to keep land as such, can be changed at any time for
development, while an easement is a stronger agreement.
18
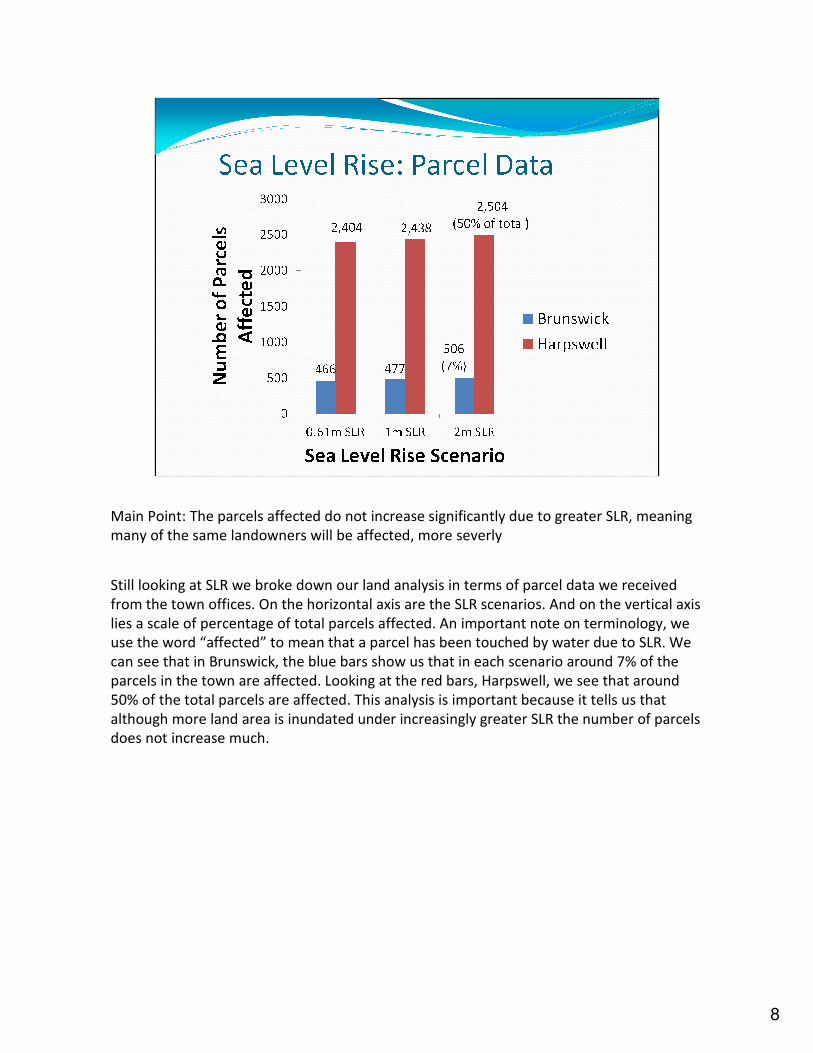
Sea Level Rise: Marsh Acreage Analysis
Main Point: Marsh Acreage decreases significantly with rising sea levels
Where will low and high marsh be found after sea level rise?
How is conservation land affected by the shift in marsh location and area?
Why is open space important in preparing for climate change and SLR?
We found that in both Brunswick and Harpswell, marshes did begin to creep up onto the
upland area of open spaces. Here we see that around 50 acres of open space in Brunswick,
and over 60 acres of open space in Harpswell became part of a marsh ecosystem under 2
meters of sea level rise.
19

Dark magenta: High MarshLight magenta: Low Marsh
Current Scenario 2m SLR Scenario
Main Point: Visual representation of decreasing marsh acreage
20

Conclusions
Sea Level Rise
Even though both of these towns have rocky coastlines sea level rise will cause substantial
damage to town economies, livelihoods, infrastructure and ecological communities.
Methodologies such at this, although not simple, can be completed with minimal town
resources on a local scale. Also, we suggest that data consistency and availability on a local
and sub-state level will be essential for further studies. Any questions?
21

Acknowledgments� Cathleen Donovan, Town of Brunswick
� Anna Breinich, Town of Brunswick
� Carol Tukey, Town of Harpswell
� Debbie Turner, Town of Harpswell
� Justin Hennessey, Town of Topsham
� Erik Nelson, Bowdoin College Department of Economics
� Bowdoin College Information Technology
� John Cannon, NOAA/NWS
� Steve Dickson, Maine Geologic Survey
� Doug Marcy, NOAA
� Pete Slovinsky, Maine Geological Survey

References� Adger, W.N., S. Agrawala, M.M.Q. Mirza, C. Conde, K. O’Brien, J. Pulhin, R. Pulwarty, B. Smit and K. Takahashi, 2007: Assessment of
adaptation practices, options, constraints and capacity. Climate Change 2007: Impacts, Adaptation and Vulnerability. Contribution of Working Group II to the Fourth Assessment Report of the Intergovernmental Panel on Climate Change, M.L. Parry, O.F. Canziani, J.P. Palutikof, P.J. van der Linden and C.E. Hanson, Eds., Cambridge University Press, Cambridge, UK, 717-743.
� Anticipatory Planning For Sea-Level Rise Along The Coast of Maine. Rep. no. EPA-230-R-95-900. U.S. EPA Office of Policy, Planning, and Evaluation, 1995. Print.
� Bertness, Mark D., P. Ewanchuck, B.R. Silliman (2001). Anthropogenic modification of New England salt marsh landscapes. Proceedings of the National Academy of Sciences, vol. 99, 1395-1398.
� Buzinde, Christine N., David Manuel-Navarrete, Deborah Kerstetter, and Michael Redclift. "Representations and Adaption to Climate Change." Annals of Tourism Research 37.3 (2009): 581-603. Print.
� Cannon, John. Top Ten Tides at Portland. Portland, Maine, 9 Dec. 2009. DOC.
� Cannon, John W. Norther New England Coastal Flooding. Dec. 2007. NOAA/National Weather Service Forecast Office, Gray, Maine.
� Coastal Storms Initiative—Florida Pilot Risk and Vulnerability Assessment Tool: Lessons Learned Report. Rep. National Oceanic and Atmospheric Administration, Coastal Services Center, 2004. Print.
� Costa, L., V. Tekken, and J. Kropp. "Threat of Sea Level Rise: Costs and Benefits of Adaptation in European Union Coastal Countries." Journal of Coastal Research 56 (2009): 223-27. Print.
� Costanza, R., et al. (1997), The value of the world’s ecosystem services and natural capital, Nature, 387, 253-260.
� Dickson, S. M. Storm Surges & Tides. Augusta, Maine: Maine Geological Survey, Nov. 2010. PPT.
� Dickson, S. M. Tidal Level Calculations and Notes. Augusta, Maine: Maine Geological Survey, 1 Mar. 2010. DOC.
� Dolan, A. H., and I. J. Walker. "Understanding Vulnerability of Coastal Communities to Climate Change Related Risks." Journal of Coastal Research SI.39 (2004). Print.
� Gillis, Justin. "As Glaciers Melt, Science Seeks Data on Rising Seas." The New York Times 13 Nov. 2010, A1 sec. 14 Nov. 2010. Web.
� Hofstede, Jacobus. "Climate Change and Coastal Adaptation Strategies: the Schleswig-Holstein Perspective." Baltica 21.1-2 (2008): 71-78. Print.
� Horstman, E.M., K.M. Wijnberg, A.J. Smale, and S.J.M.H. Hulscher. "Long-term Coastal Management Strategies: Useful or Useless?" Journal of Coastal Research SI.56 (2009): 233-37. Print.
� Horstman, Erik M., Kathelijne M. Wijnberg, Alfons J. Smale, and Suzanne J.M.H. Hulscher. "On the Consequences of a Long-term Perspective for Coastal Management." Ocean & Coastal Management 52 (2009): 593-611. Print.
� "Impacts of Sea Level Rise - Introduction - Maine Geological Survey." Maine.gov. Web. Oct. 2010. <http://maine.gov/doc/nrimc/mgs/explore/marine/sea-level/intro.htm>.

References� "Impacts of Sea Level Rise - Introduction - Maine Geological Survey." Maine.gov. Web. Oct. 2010.
<http://maine.gov/doc/nrimc/mgs/explore/marine/sea-level/intro.htm>.
� Kirshen, Paul, Chris Watson, Ellen Douglas, Allen Gontz, Jawon Lee, and Yong Tian. "Coastal Flooding in the Northeastern United States Due to Climate Change." Mitigation and Adaptation Strategies for Global Change 13.5-6 (2008): 437-51. Print.
� Kirwan, Matthew L. "A Coupled Geomorphic and Ecological Model of Tidal Marsh Evolution." PNAS 104.15 (2007): 6118-122. Print.
� Kirwan, Matthew L., and A. Brad Murray. "Tidal Marshes as Disequilibrium Landscapes? Lags between Morphology and Holocene Sea Level Change." Geophysical Research Letters 35 (2008). Print.
� Kirwan, Matthew L. "Temporary Vegetation Disturbance as an Explanation for Permanent Loss of Tidal Wetlands." Geophysical Research Letters 35 (2007). Print.
� "Maine Economics & Demographics Program - Coastline Population Trends, 1960-2008." Maine.gov. Maine State Planning Office. Web. Dec. 2010.
� Mayberry, B. C. (1991) TOWN OF HARPSWELL FISHING INDUSTRY PROFILE, 1-37. <http://www.harpswell.maine.gov/vertical/Sites/%7B3F690C92-5208-4D62-BAFB-2559293F6CAE%7D/uploads/%7BBC08842C-3AD7-49A0-B251-5DA6D367C7CF%7D.PDF>.
� Nicholls, Robert J., and Anny Cazenave. "Sea-Level Rise and Its Impact on Coastal Zones." Science 328 (2010): 1517-523. Print.
� Nicholls, Robert J., and Richard J.T Klein. "Climate Change and Coastal Management on Europe’s Coast." Managing European Coasts: Past, Present, and Future (2005): 199-225. Print.
� Nicholls, Robert J., Poh Poh Wong, Virginia Burkett, Colin D. Woodroffe, and John Hay. "Climate Change and Coastal Vulnerability Assessment: Scenarios for Integrated Assessment." Sustain Sci 3 (2008): 89-102. Print.
� NOAA/National Weather Service Forecast Office. Northern New England Coastal Flooding. By John W. Cannon. 2007 ed. Gray, Maine. Print. Ser. 03.
� Preparing for Climate Change: A Guidebook for Local, Regional, and State Governments. King County, Washington: Center for Science in the Earth System (The Climate Impacts Group), Joint Institute for the Study of the Atmosphere and Ocean, University of Washington, Sept. 2007. PDF.
� Reed, D.J. (1994), The response of coastal marshes to sea-level rise: survival or submergence?, Earth Surface Processes and Landforms, 20, 39-48.
� Romieu, E., T. Welle, S. Schneiderbauer, M. Pelling, and C. Vinchon. "Vulnerability Assessment within Climate Change and Natural Hazard Contexts: Revealing Gaps and Synergies through Coastal Applications." Sustain Sci 5 (2010): 159-70. Print.

References� Romieu, E., T. Welle, S. Schneiderbauer, M. Pelling, and C. Vinchon. "Vulnerability Assessment within Climate Change and Natural Hazard
Contexts: Revealing Gaps and Synergies through Coastal Applications." Sustain Sci 5 (2010): 159-70. Print.
� Titus, James G., and Charlie Richman. "Maps of Lands Vulnerable to Sea Level Rise: Modeled Elevations along the US Atlantic and Gulf Coasts." Climate Research 18 (2001): 205-28. Print.
� Titus, JG, DE Hudgens, DL Trescott, M. Craghan, WH Nuckols, CH Hershner, JM Kassakian, CJ Linn, PG Merritt, TM McCue, JF O'Connell, J. Tanski, and J. Wang. "State and Local Governments Plan for Development of Most Land Vulnerable to Rising Sea Level along the US Atlantic Coast." Environmental Research Letters 4 (2009): 1-8. Print.
� Torresan, Silvia, Andrea Critto, Matteo Dalla Valle, Nick Harvey, and Antonio Marcomini. "Assessing Coastal Vulnerability to Climate Change: Comparing Segmentation at Global and Regional Scales." Sustain Sci 3 (2008): 45-65. Print.
� United States. Oregon Department of Land Conservation and Development. Oregon Coastal Management Program. CLIMATE READY COMMUNITIES: A Strategy for Adapting to Impacts of Climate Change on the Oregon Coast. Salem, Oregon: Oregon Department of Land Conservation and Development, 2009. Print.
� Wardekker, J Arjan, Arie De Jong, Joost M. Knoop, and Jeroen P. Van Der Sluijs. "Operationalising a Resilience Approach to Adapting an Urban Delta to Uncertain Climate Changes." Technological Forcasting & Social Change 77 (2010): 987-98. Print.
� Watson, Chris. Coastal Flood Inundation Mapping and Climate Change. May 2009. PPT.


Storm Surge Analysis
Surge (ft) Ave. Occurrence
(yrs)
3.0 4.5-7
3.5 10-14
4.0 22-49
Portland Storm Surge Height Frequency
� Record surge at Portland: 4.3 feet
Rise (ft) MHHW (ft) MHHW+ 3.0 (ft) MHHW + 4.3 (ft)
None 4.59 7.59 8.89
2.00 6.59 9.59 10.89
3.28 7.87 10.87 12.17
6.56 11.15 14.15 15.45

Storm Surge Analysis� What is storm surge?
Storm surge is green, the observed-predicted, therefore, in modeling SS we added the SS
onto MHHW as it is more likely to coincide with MHHW than HAT
Storm surge can be associated with low pressure systems, high winds pile up the water so
it is higher than predicted sea level
28

Sea Level RiseHow do we map sea level rise?
� Highest Annual Tide
� Mean Higher High Water
� Mean High Water
� North American
Vertical Datum
� Mean Sea LevelNAVD88
MSL
MHW
MHHW
HAT
0.00
-0.32
4.16
4.59
6.61
(feet)
I think we should have a discussion about the 2.00 vs 2 ft thing…
1995 Executive Summary for sea level rise planning for Maine, published by U.S. EPA in
cooperation with Maine State Planning Office
NRCM is analyzing 6 meter SLR potential impacts
IPCC says 66cm is most likely, 1m and 2m come from EPA/MEStatePlanningOffice
Sand Dune
29

Visualizing the Marsh Shift
� How does the acreage of high marsh shrink?
HAT
MHW
MSL
HATMHW
MSL
High Marsh
High Marsh
Before SLR
After SLR