Embed Size (px)
Citation preview
Krish Vijayaraghavan, Prakash KaramchandaniChristian Seigneur
AERSan Ramon, CA
3rd Annual CMAS Models-3 ConferenceOctober 18-20, 2004
Chapel Hill, NC
Application of CMAQ-APT tothe Central California Ozone Study
Overview
• Limitations of 3-D grid modeling• CMAQ-APT: Plume-in-grid (PiG) air quality model
• State-of-the science treatment of stack plumes at the sub-grid scale
• 3-D grid host model - CMAQ• Reactive plume model – SCICHEM
• Impact of PiG treatment on ozone and HNO3 concentrations
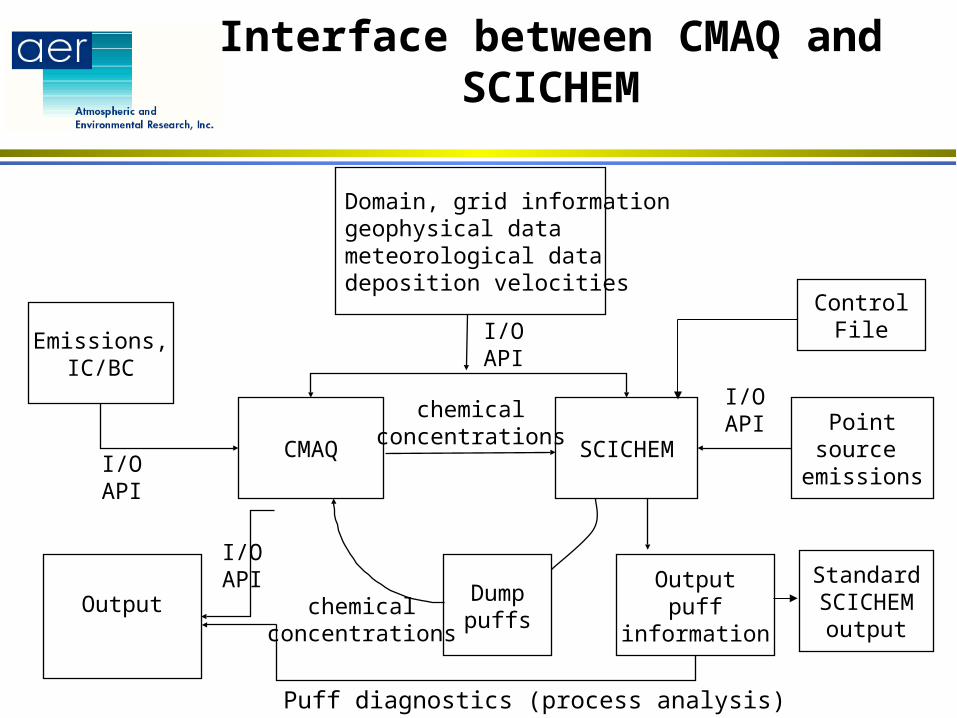
Interface between CMAQ and SCICHEM
Domain, grid informationgeophysical datameteorological datadeposition velocities
CMAQ SCICHEM
Emissions,IC/BC
OutputOutput
puffinformation
Pointsource
emissions
Dumppuffs
chemicalconcentrations
chemicalconcentrations
I/OAPI
I/OAPI
I/OAPI
I/OAPI
StandardSCICHEM
output
Puff diagnostics (process analysis)
ControlFile
Improvements to CMAQ-APT
• Optional treatment for the effects of building downwash on plume rise and dispersion (PRIME)
• Incorporation of CMAQ code updates released in September 2003 (version 4.3)
• Incorporation of modifications in SCICHEM version 1601 (January 2004 release)
• Young & Boris chemistry solver
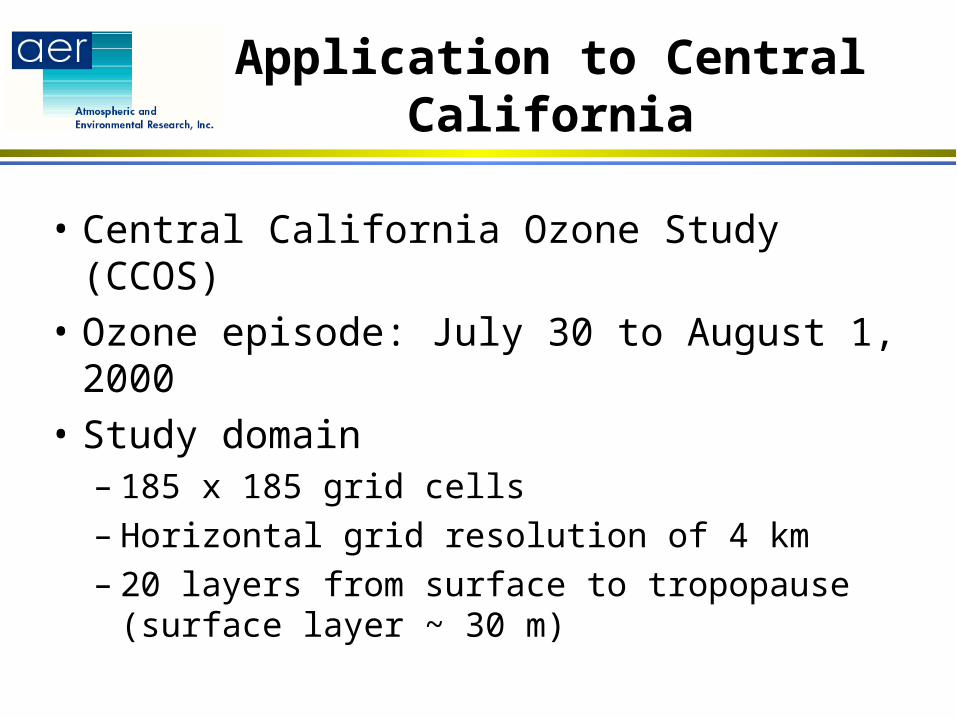
Application to Central California
• Central California Ozone Study (CCOS)
• Ozone episode: July 30 to August 1, 2000
• Study domain– 185 x 185 grid cells– Horizontal grid resolution of 4 km– 20 layers from surface to tropopause
(surface layer ~ 30 m)
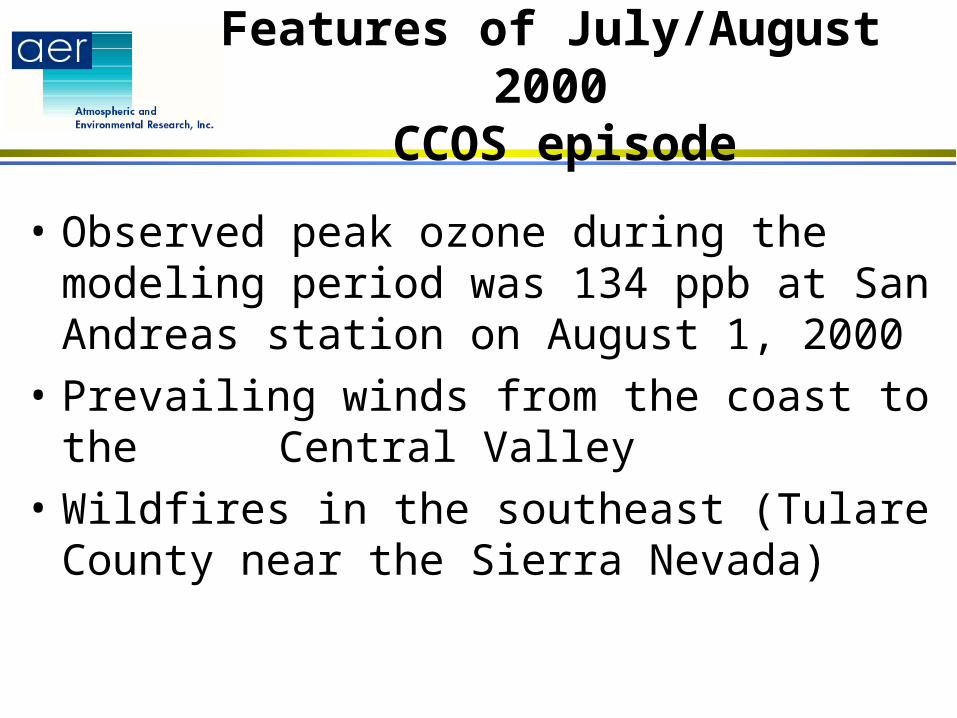
Features of July/August 2000 CCOS episode
• Observed peak ozone during the modeling period was 134 ppb at San Andreas station on August 1, 2000
• Prevailing winds from the coast to the Central Valley
• Wildfires in the southeast (Tulare County near the Sierra Nevada)
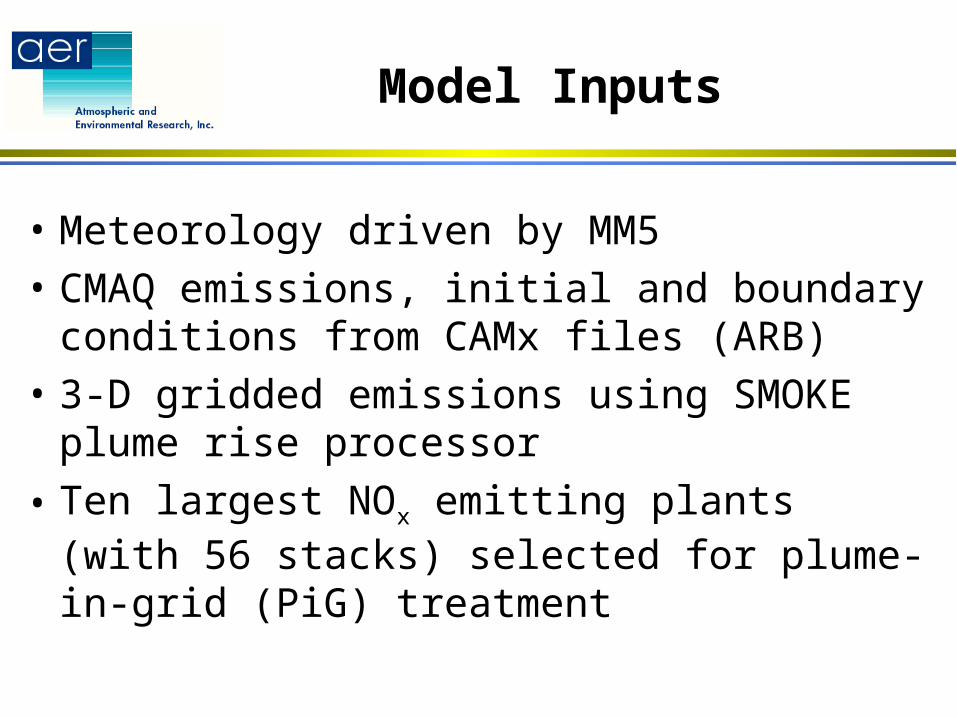
Model Inputs
• Meteorology driven by MM5
• CMAQ emissions, initial and boundary conditions from CAMx files (ARB)
• 3-D gridded emissions using SMOKE plume rise processor
• Ten largest NOx emitting plants (with 56 stacks) selected for plume-in-grid (PiG) treatment
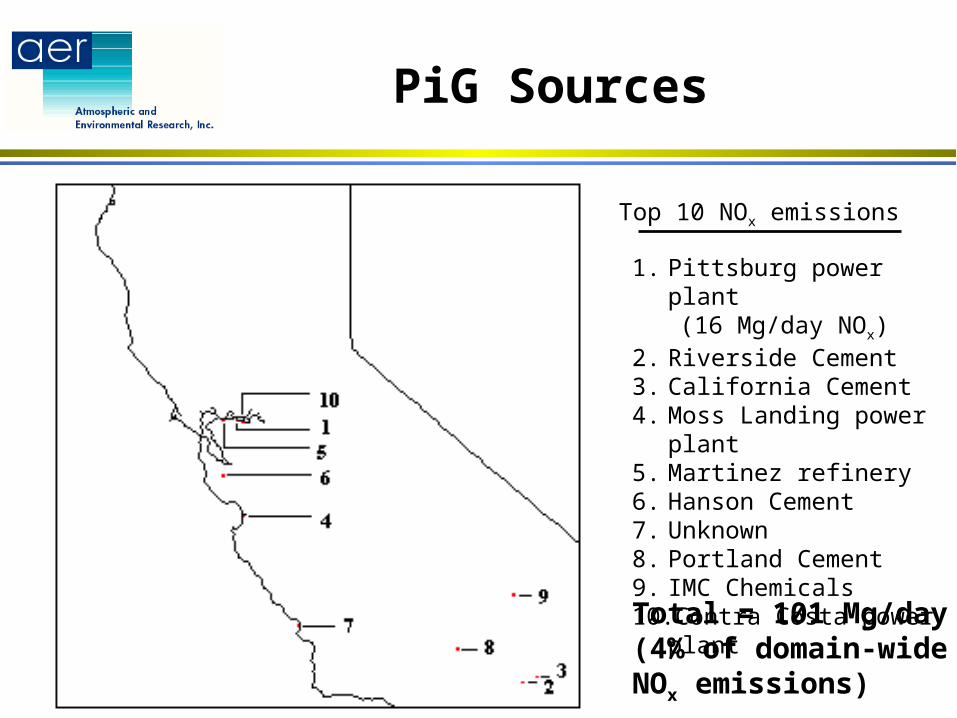
PiG Sources
Top 10 NOx emissions
1. Pittsburg power plant (16 Mg/day NOx)
2. Riverside Cement3. California Cement4. Moss Landing power plant5. Martinez refinery6. Hanson Cement7. Unknown8. Portland Cement9. IMC Chemicals10.Contra Costa power plant
Total = 101 Mg/day(4% of domain-wideNOx emissions)
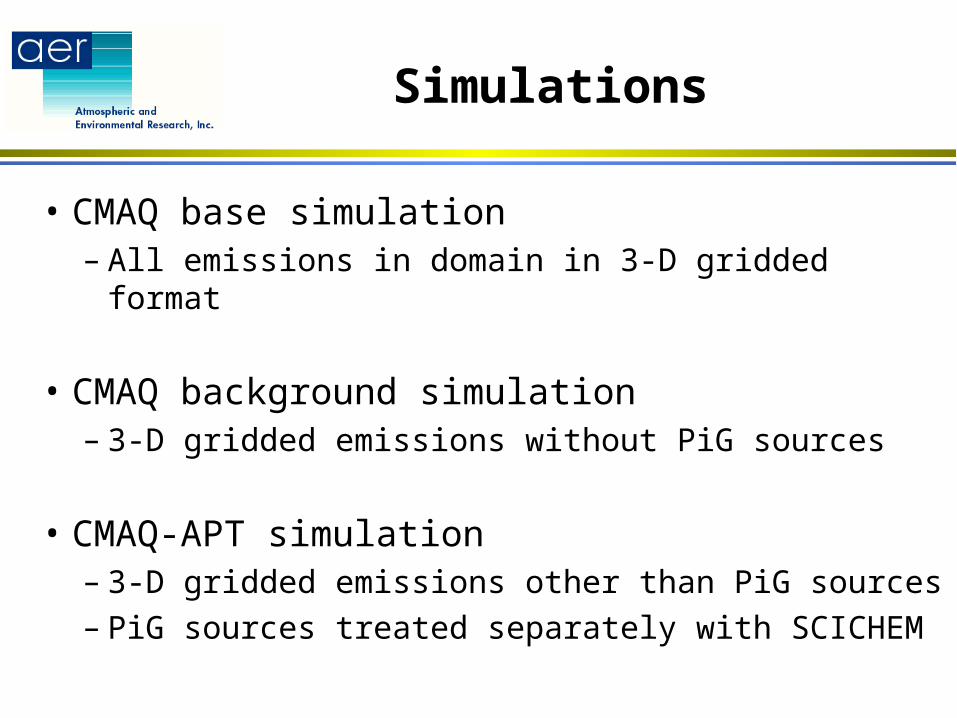
Simulations
• CMAQ base simulation
– All emissions in domain in 3-D gridded format
• CMAQ background simulation– 3-D gridded emissions without PiG sources
• CMAQ-APT simulation– 3-D gridded emissions other than PiG sources– PiG sources treated separately with SCICHEM
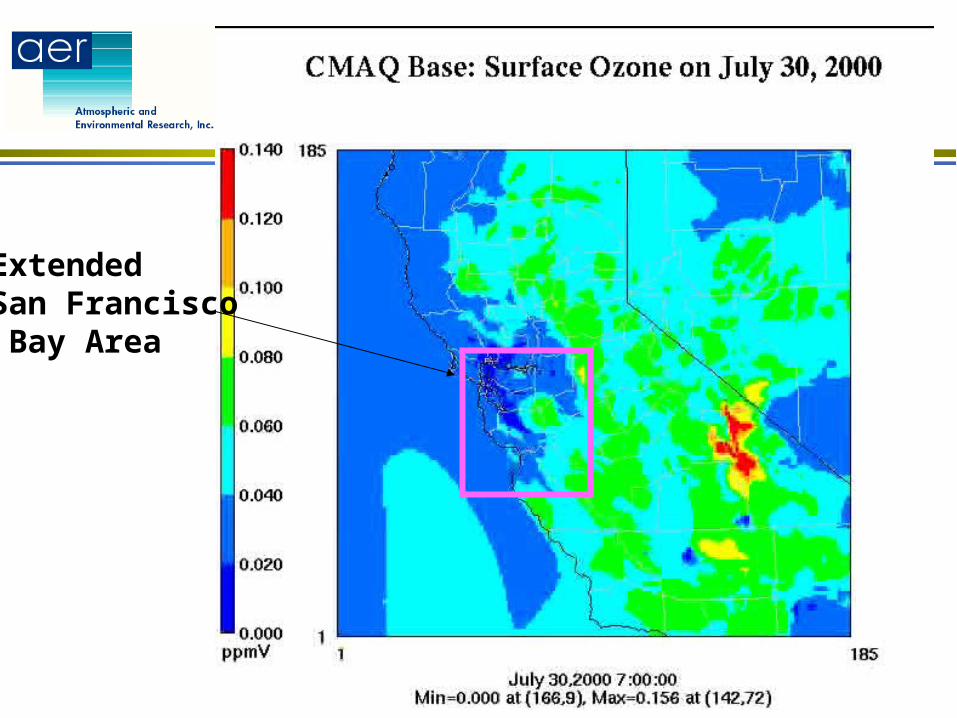
ExtendedSan Francisco Bay Area
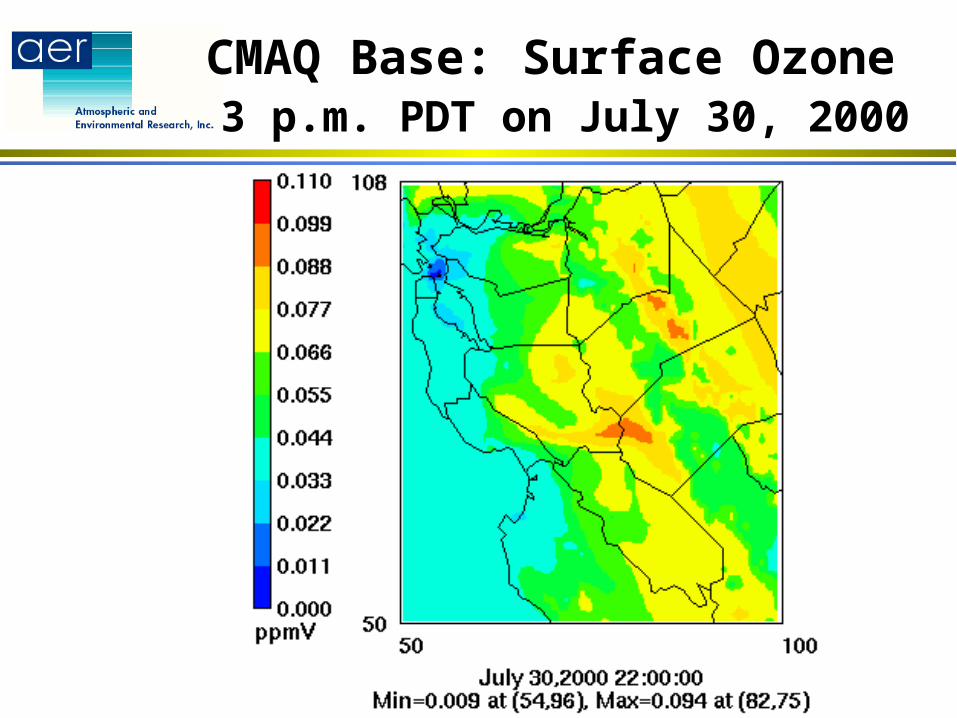
CMAQ Base: Surface Ozone 3 p.m. PDT on July 30, 2000
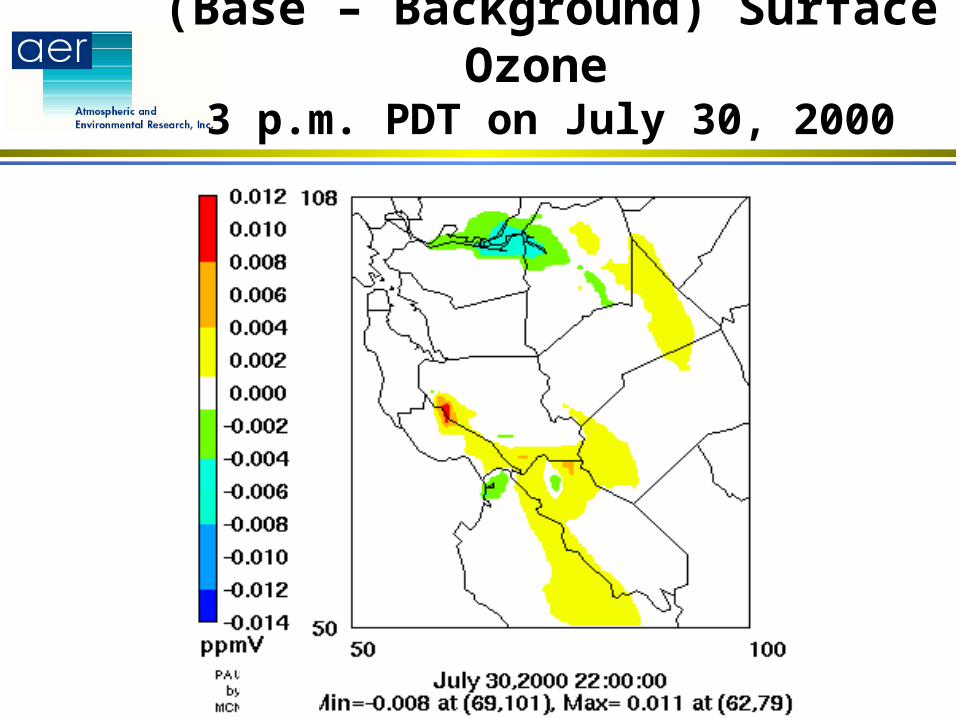
(Base – Background) Surface Ozone 3 p.m. PDT on July 30, 2000
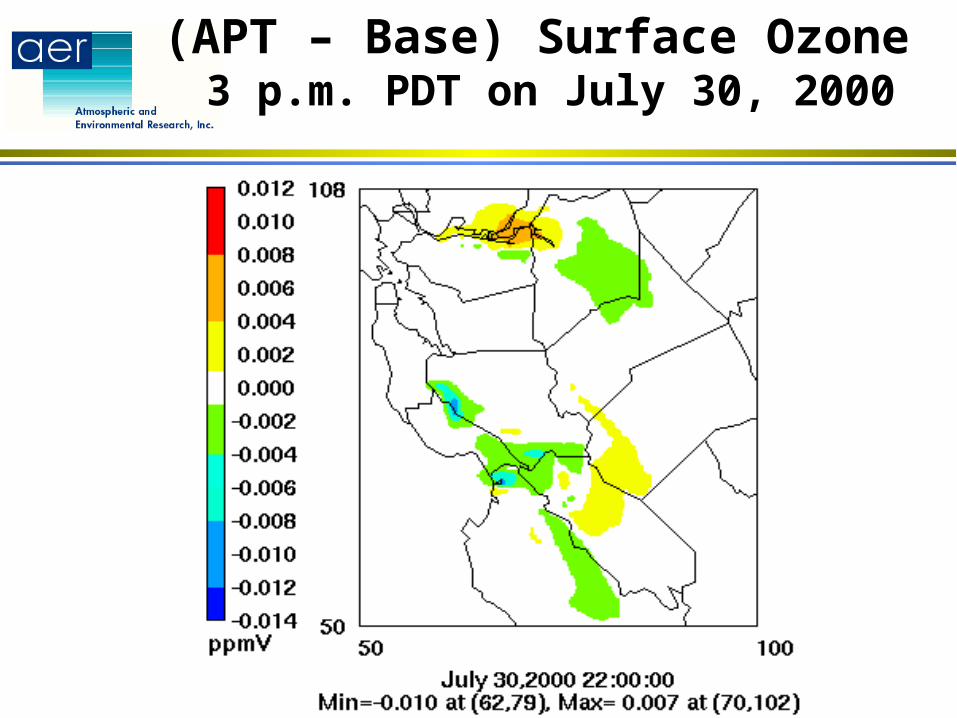
(APT – Base) Surface Ozone 3 p.m. PDT on July 30, 2000
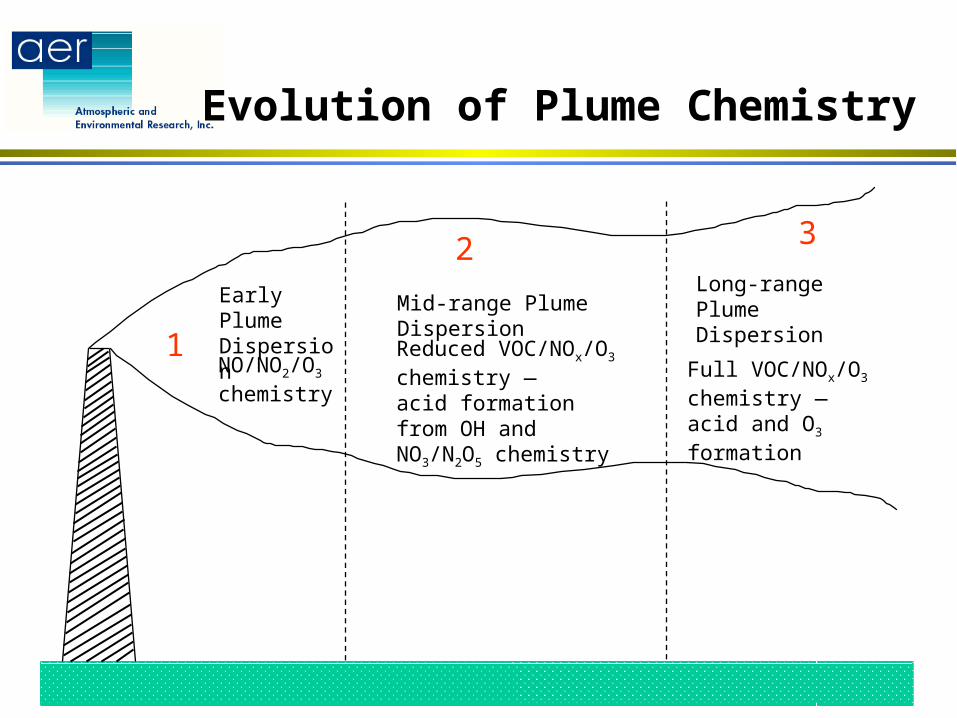
Evolution of Plume Chemistry
Early Plume Dispersion
NO/NO2/O3 chemistry
1
2
Mid-range Plume Dispersion
Reduced VOC/NOx/O3 chemistry — acid formation from OH and NO3/N2O5 chemistry
Long-range Plume Dispersion
3
Full VOC/NOx/O3 chemistry — acid and O3 formation
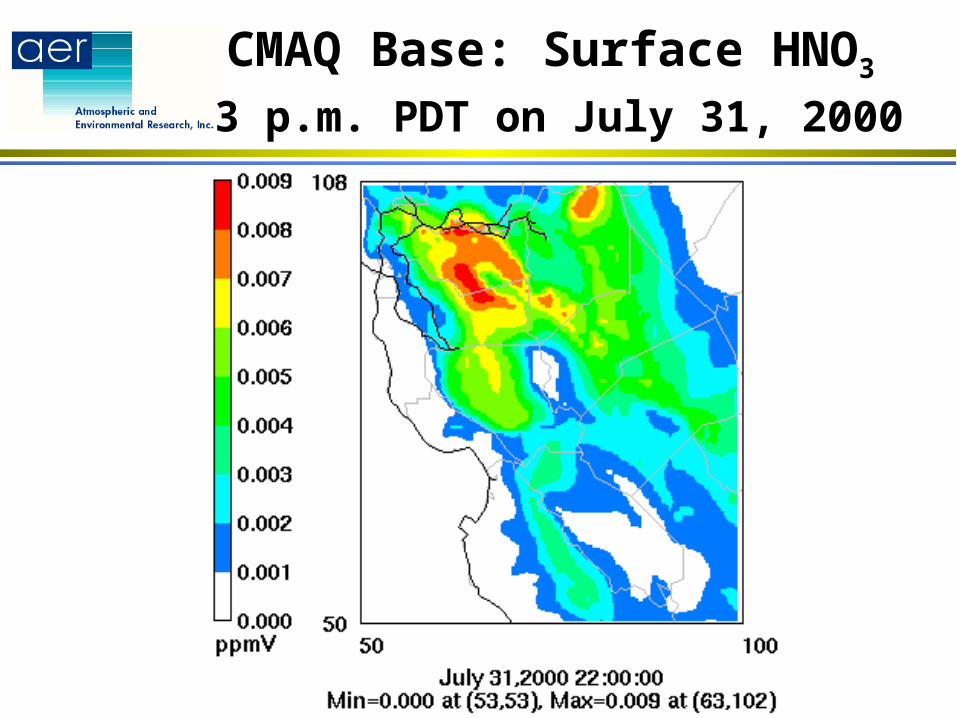
CMAQ Base: Surface HNO3
3 p.m. PDT on July 31, 2000
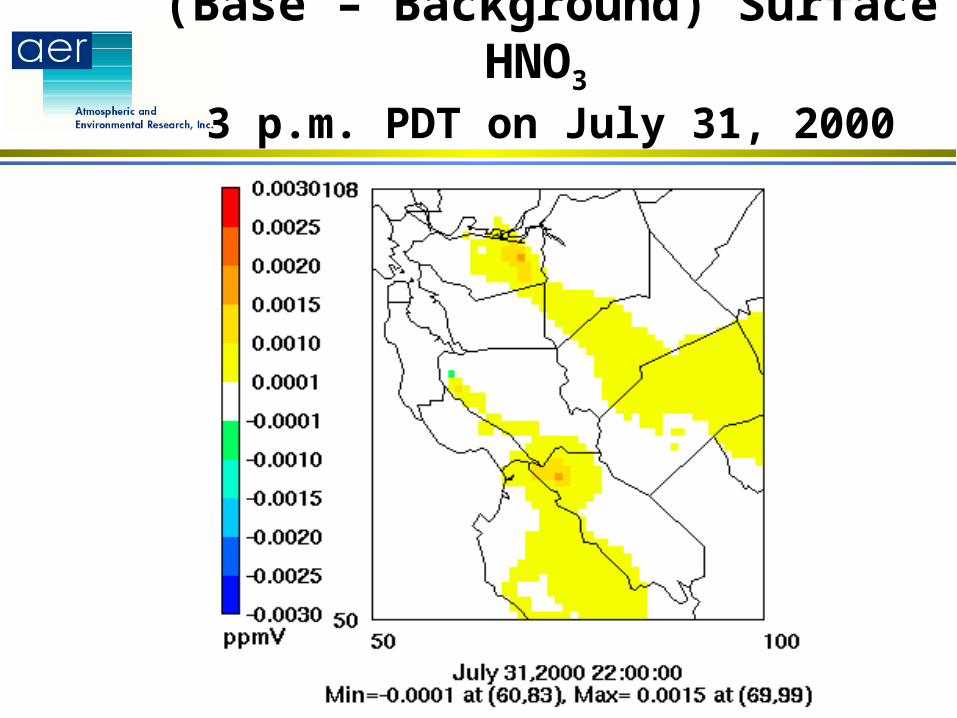
(Base – Background) Surface HNO3 3 p.m. PDT on July 31, 2000
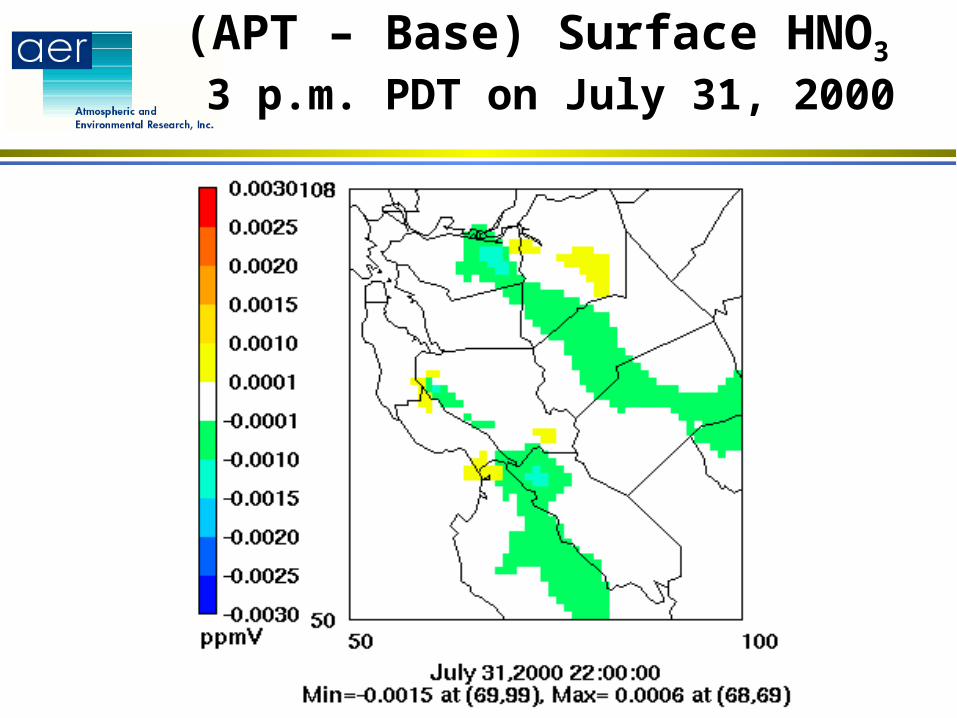
(APT – Base) Surface HNO3 3 p.m. PDT on July 31, 2000
Comparison of CMAQ-APT results in CCOS and NARSTO
• CCOS– APT produces up to 10 ppb lower ozone than Base
and up to 1.5 ppb lower HNO3
• NARSTO– APT produces up to 40 ppb lower ozone than Base
and up to 24 ppb lower HNO3
(Karamchandani et al., J. Geophys. Res.,107, 4403, 2002)
• NOx emissions from PiG sources are about 50 times higher in NARSTO than in CCOS
Conclusions
• CMAQ-APT applied to July/August 2000 CCOS episode
• O3 concentrations using APT show both decrements (up to 10 ppb) and increments (up to 6 ppb) with respect to the base
• The VOC vs. NOx limited nature of the background environment explains the differences in O3 production and destruction between the APT and base results
Conclusions
• Surface HNO3 concentrations are up to 1.5 ppb (about 10%) lower in the CCOS APT simulation and 24 ppb lower in the NARSTO APT simulation, compared to the base cases
• Effect of PiG treatment on HNO3 is important for PM nitrate and regional haze modeling.
• PiG treatment for PM (CMAQ-MADRID-APT) is currently being tested (Karamchandani et al., AWMA, October 2004)
Acknowledgements
• California Energy Commission
• California Air Resources Board
• EPRI
• Titan/ARAP