Embed Size (px)
Citation preview

1
1
Based in Santa Monica, CA, Activision Blizzard, Inc., renamed after the merger of Activision, Inc. and Vivendi S.A. in 2008, is a leading developer and publisher of interactive entertainment content and services. The company distributes content through different channels including gaming consoles, computers, and mobile platforms. There are three segments of the Company: Activision Publishing, Inc., Blizzard Entertainment, Inc., and King Digital Entertainment. Activision is responsible for developing interactive software and content. Blizzard is similar to Activision but primarily focuses on PC gaming, and King is a leading developer of mobile entertainment. Blizzard is the leader in mobile entertainment.
We recommend a buy rating for Activision Blizzard, Inc. because we believe the company is well positioned to take advantage of secular industry trends within the Interactive Home Entertainment industry due to its leading market share position in the video game publishing business, diverse revenue streams, and prominent franchises that possess entrenched customer bases. Drivers of Thesis • Strong sales ($500mm in its three day launch) of Call of Duty: Black Ops 4 and its threat to Fortnight with its new Blackout mode. • A strengthening recurring revenue model, as the Company was able to capture 78% of its net revenues through microtransactions, DLC, and other subscription based revenue. • A commanding footprint within the eSports market following its acquisition of Major League Gaming in 2016. Our team is very optimistic of the revenue opportunities the League possesses, including the sale of advertisements, franchise cash flows, ticket sales, sponsorships, and consumer product sales. • Industry leading initiatives towards mobile gaming following the acquisition of leading mobile game developer King Digital in 2016, which not only secured a new mobile gaming customer base, but also a bundle of talent and resources that gives them the opportunity to capture a large share of the mobile gaming market. Risks to Thesis • Heavy reliance on franchises for a significant portion of revenues which puts the Company at risk from small hiccups in key franchises. • Consumer preferences are cyclical and difficult to predict combined with very high customer expectations.
Activision Blizzard, Inc. (NASDAQ: ATVI) Communication Services – Interactive Home Entertainment -
Video Game Publishing
November 13th, 2018
Stock Rating:
Marcus Topping Taylor Kenworthy
[email protected] [email protected]
BUY
Investment Thesis
Target Price: $80-$90
Company Description
Earnings Estimates
Analysts
Stock Performance (Last 12 Months)
020406080
100
ATVI
Krause Fund Fall Research 2018

2
2
Real Gross Domestic Product (GDP)
Source: Bureau of Labor Statistics1
GDP is a significant driver within the video gaming industry as the fundamental outlook is highly correlated to consumer spending, which represents more than two-thirds of U.S. GDP. Consumer spending has a significant cyclical impact on consumer discretionary expenditures on gaming purchases. Activision Blizzard relies on discretionary consumer spending to drive sales for its content within the Activision, Blizzard, and King segments. While GDP has lagged under 3% growth since 2012 as shown above1, 2018 has showcased strong growth. A growth rate of 2.2% in the first quarter was followed by 4.2% in the second quarter, marking the strongest YoY quarter growth in almost 4 years, followed by a YoY increase of 3.5% in the third quarter1. Looking towards the next six months, we estimate a GDP annual YoY growth rate of 3.8%. We attribute this growth to rising consumer confidence coupled with consumers possessing higher discretionary income resulting from the recently passed tax cuts. In addition, companies will benefit from increased consumer spending along with a lower corporate tax rate of 21%, resulting in greater after-tax cash flow to invest in capital expenditures and fund core operations. Looking beyond Activision Blizzard’s forecast period, we estimate long-term GDP to grow at 2.5% for the aforementioned reasons.
Our strong economic growth estimate is a key driver in our forecast of Activision’s 2019 revenue growth of 5.95%.
Unemployment Rate
Source: Bureau of Labor Statistics2
The unemployment rate measures the number of people unemployed as a percentage of the labor force and is viewed as a critical rate in assessing the current stage of the business cycle and overall health of the economy. As the unemployment rate rises due to slower economic growth, consumers will see a decline in disposable income and consequently will spend less on discretionary expenses. Due to the discretionary nature of Activision Blizzard’s content, the Company’s top line benefits from low unemployment as consumers possess more disposable income to spend on gaming. As shown above, unemployment has hit records lows in recent quarters. Given that the U.S. achieved a 3.5% annual rate in GDP growth in the third quarter and after-tax profits rose 16.1% in the second quarter, the largest YoY gain in six years, we feel confident that the unemployment rate can further decline and help drive Activision’s revenue3. Stout corporate earnings behind a strong economic backdrop boosted by tax cuts is reason enough for us to set a 3.7% target within the next six months. Over the next 2-3 years, the tax cuts should continue to spur strong corporate earnings and consumer confidence; however, with the declining slack in
Economic Outlook

3
3
the labor market, we should see upward pressure in wages, driving labor costs higher and returning the unemployment rate to a 4.5% level. Within the video game publishing industry, Activision Blizzard and its peers will likely see increased labor costs as they compete for top developer talent. Attracting and retaining a talented workforce is one of the most significant factors companies compete on. Publishers and their in-house developers must be very educated and be able to effectively handle technical projects. Because these jobs require a large amount of skill, the labor pool is very limited and companies compete against each other on attracting the best talent.
PCE Price Index and Interest Rates
Source: The Wall Street Journal4
The personal consumption expenditures (PCE) price index reflects changes in the prices of goods and services purchased by consumers in the United States and is the indicator that the Federal Reserve monitors to track inflation. Rising inflation indicates that the Fed will raise interest rates which diminishes capital borrowing for companies due to the higher cost to service debt and hinders capital expenditures. The PCE currently sits at the Fed’s 2% target. Because the economy is currently in a rising rate environment, the Fed is expected to raise the federal funds rate to 2.25-2.50% next month and raise rates four times in 20195. Within a rising rate environment, the interactive home
entertainment industry typically outperforms the overall market as the economy expands and consumers possess higher wages and confidence. We believe the PCE Index will reach 2.15% in the next six months as the economy continues to grow and 1.9% in the next two to three years as the Fed’s rate hikes constrict inflation. Within the industry, companies should expect to see continued growth given the strong economic backdrop and increased consumer spending, specifically towards more discretionary outlays, and thus should outperform the market over the next 6-18 months.
Consumer Confidence
Source: Consumer Confidence Board6
Consumer confidence measures the optimism of consumers towards the health of the U.S. economy and their expectations on employment, business, and income. Consumer confidence is an economic indicator that is more significant to the performance of discretionary sectors, such as Interactive Home Entertainment. When consumers are optimistic about the outlooks of their employment, their income, and the overall economy, they are more likely to spend their disposable income on leisurely items, a big win for companies like Activision Blizzard. The Conference Board Consumer Confidence Index increased again in October, now standing at 137.96. With unemployment currently at the

4
4
lowest level in two decades, corporate profits with the highest YoY gain in six years, and consumers and corporations just beginning to benefit from the recently passed tax cuts, we feel that the Index can reach 140 by the end of 2018. This was an estimate that was strongly considered when we forecasted Activision Blizzard’s top line to increase 5.95% in 2019. Looking ahead 18-24 months from now as we reach full-employment in the U.S., we should begin to see the tight labor market putting increased pressure on wages. As the economy begins to tighten, the growth in the Consumer Confidence Index should stagnate to 125.
Interactive Home Entertainment
Interactive Home Entertainment consists of producers of interactive gaming products, including mobile gaming applications. It also includes educational software used primarily in the home. The video game publishing sub-industry resides within the broader overall interactive home entertainment industry. These companies in this sub-industry produce and distribute video games, including documentation, design, installation, and support services. We believe the video game publishing industry is currently in the growth stage of its industry life cycle, as a number of industry operators are increasing along with expansion into new market segments complemented with rapid technological advancement. The target demographic group for the video game publishing industry is both aging and growing. The industry has expanded its reach to women and seniors while also repeating sales to gamers who are aging and unwilling to drop their gaming habits. The average age of a video game player was 35 in 2016 and is expected to continue to rise as millennials age. Industry value added, an indicator measuring the industry’s contribution
to the overall economy, is expected to increase at an annualized rate of 7.3% over the 10 years to 2023. Comparatively, we forecast that GDP is to rise at an annualized rate of 2.5% during the same period7. Industry value added growth that exceeds GDP growth further establishes that this industry is in the growth stage of its life cycle. Source: IBISWorld US7
In addition to growing economic contribution, the industry is expanding in terms of businesses and employees due to low barriers to entry in the mobile gaming market causing a great amount of small-scale publishers. Video game software publishers are projected to increase at an annualized rate of 17.7% to 125,053 companies from 2013 to 2023. Much of this growth can be attributed to an increase in smartphone users enabling digital downloads and a greater number of mobile-only developers to release games7. Competitive Positioning The leaders in the video game publishing industry are poised for growth and Activision Blizzard is no exception. We analyzed Activision Blizzards’ total revenue as a percentage of the total market compared to their peers in the industry. The following graph shows Activision Blizzards’ market share in the video game
Industry Analysis

5
5
publishing industry based on contribution to total revenue. Source:IBIS World US7
In the video game publishing industry, we identified Microsoft Corporation and Electronic Arts Inc. as Activision Blizzards’ top competitors. Activision Blizzard has the top market share in the industry with 20.7% of the market. Microsoft Corporation captures 11.9% of the market whereas Electronic Arts captures 9.0%7. However, our analyst team does not view Microsoft as a significant competitor given the large difference in size and operations between the two companies. Microsoft is more of a hardware and software company whereas Activision Blizzard strictly focuses on publishing video games. We believe that Take-Two Interactive is a more relevant competitor to Activision with its similar size, operations, and content. Activision Blizzards’ market share is impressive with its ability to build on existing franchises and keep its loyal, entrenched customer base coming back for more interactive content.
Source: Form 10-K Activision Blizzard. (2018, February 27)8. The industry is also continuing to see a shift toward mobile games due to the continued emergence of social networks and technological advancement driving ubiquitous use of mobile devices. Activision Blizzard stands to capitalize on this shift with its diverse revenue channels coming from content across console, PC, and mobile platforms.
Source: Form 10-K Activision Blizzard. (2018, February 27)8. In comparison, Electronic Arts and Take-Two are heavily reliant on console-based games as shown below. Due to that fact that Activision Blizzard has lower console revenues as a percent of total sales, our analysts conclude that Activision has more diversified revenue channels than its competitors and relies less on one type of platform.
Source: Form 10-K Electronic Arts9. Form 10-K Take Two Interactive10. Form 10-K Activision Blizzard.8
The industry has also seen a rise in eSports where spectators watch professional gamers as

6
6
a form of entertainment. Our analyst team sees this trend as a tremendous opportunity for Activision Blizzard. The Company is behind the Overwatch League, a professional gaming league which is at the forefront of the eSports trend. Porter’s Five Forces
Threat of New Entrants: Moderate Large initial investment costs prevent new entrants from grabbing market share in the industry. The market is extremely competitive due to patents, hiring top talent, and evolving improvements to technology. Mature companies in the industry may make acquisitions in the industry to acquire top talent, intellectual content, or new distribution channel. In order to maintain or grow market share, companies must stay ahead of the curve with graphics and adapt games to new consoles which requires a strong relationship with console manufacturers. The four largest companies account for an estimated 46.8% of industry revenue in 2018. A new entrant will find it tough to attract customers because of unfamiliarity of their brand. However, Activision Blizzard’s market share is threatened the most by small smartphone game developers. There are extremely low barriers of entry for mobile game developers due to forgone distribution costs and only a computer needed to create a new smartphone game7. Competitive Rivalry: High One very competitive aspect to the industry is gaining the rights to publish newly developed games. Companies must have great relationships with top developers and patents on new games. In-house developer jobs require a lot of technical skill and with a limited labor pool, competition is fierce to hire top talent. Publishers must also have knowledge of new technologies to be ahead of competitors when new consoles are released. Franchising tactics play a major role in the competitive landscape where developers will either aggressively build on existing franchises or invest heavily in marketing for new games. For
example, Call of Duty is a major franchise for Activision whereas Super Mario and Madden are major franchises for Nintendo and Electronic Arts, respectively. Externally from the industry, competition comes from other forms of entertainment, such as movies, sports, or TV. Our analyst team believes that due to the essential nature of possessing a smartphone, mobile gaming will only decrease external competition forces as consumers become more attached to their mobile devices7. Bargaining Power of Suppliers: Low
As console manufacturers, Microsoft, Sony, or Nintendo control the manufacturing and compatibility of video game producers’ content. These suppliers may delay production of Activision’s new games and opt to produce their own content or competitors’ content. These hardware providers also have control of the pricing and fees for its digital content platform. Due to constrained digital shelf space, digital content distributors have favorable conditions to control the terms of sale. Another cost to the company’s mobile gaming division is the 30% fixed, non-negotiable fee taken by Apple and Google for payment processing of in-app purchases11. While our analysts believe this is a significant cost for mobile game developers, the Google Play Store and Apple App Store are the two most popular mobile game marketplaces for consumers, leaving developers with seemingly no choice. The costs associated with the manufacturing and distribution process are concerning to us as they are out of the company’s control; however, Electronic Arts and Take-Two are subject to the same supply chain limitations8.
Threat of Substitutes: Moderate
7
7
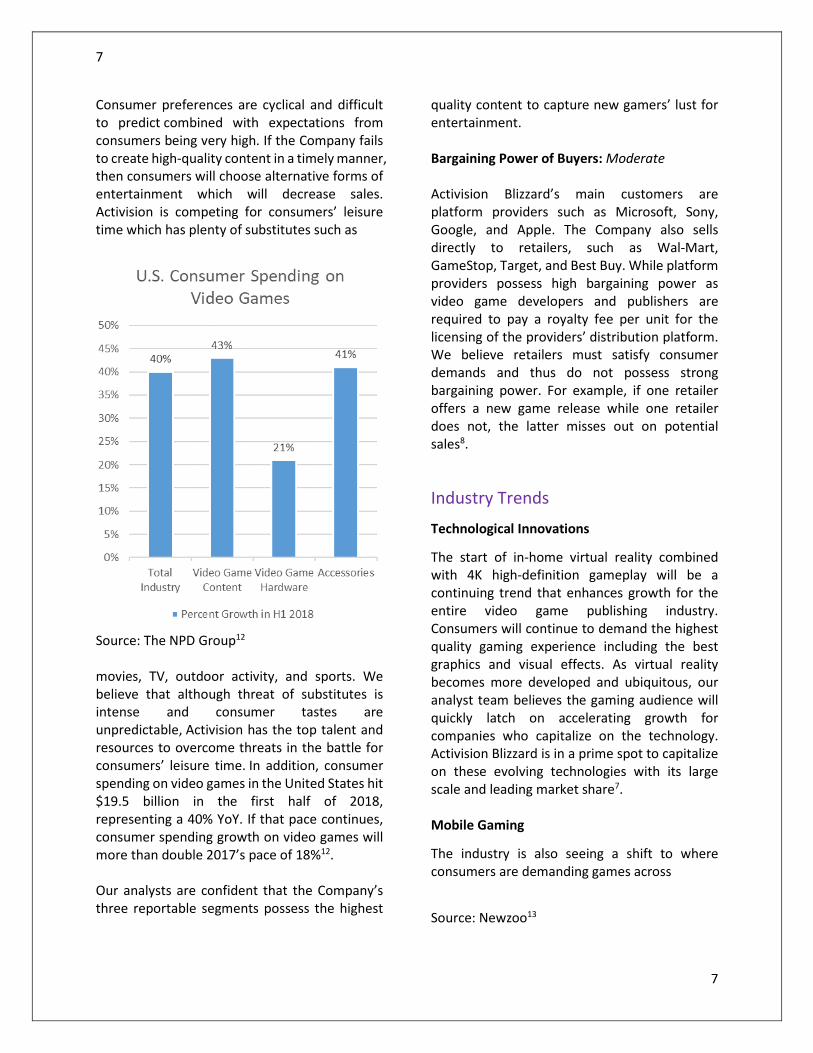
Consumer preferences are cyclical and difficult to predict combined with expectations from consumers being very high. If the Company fails to create high-quality content in a timely manner, then consumers will choose alternative forms of entertainment which will decrease sales. Activision is competing for consumers’ leisure time which has plenty of substitutes such as
Source: The NPD Group12 movies, TV, outdoor activity, and sports. We believe that although threat of substitutes is intense and consumer tastes are unpredictable, Activision has the top talent and resources to overcome threats in the battle for consumers’ leisure time. In addition, consumer spending on video games in the United States hit $19.5 billion in the first half of 2018, representing a 40% YoY. If that pace continues, consumer spending growth on video games will more than double 2017’s pace of 18%12. Our analysts are confident that the Company’s three reportable segments possess the highest
quality content to capture new gamers’ lust for entertainment. Bargaining Power of Buyers: Moderate Activision Blizzard’s main customers are platform providers such as Microsoft, Sony, Google, and Apple. The Company also sells directly to retailers, such as Wal-Mart, GameStop, Target, and Best Buy. While platform providers possess high bargaining power as video game developers and publishers are required to pay a royalty fee per unit for the licensing of the providers’ distribution platform. We believe retailers must satisfy consumer demands and thus do not possess strong bargaining power. For example, if one retailer offers a new game release while one retailer does not, the latter misses out on potential sales8.
Industry Trends
Technological Innovations The start of in-home virtual reality combined with 4K high-definition gameplay will be a continuing trend that enhances growth for the entire video game publishing industry. Consumers will continue to demand the highest quality gaming experience including the best graphics and visual effects. As virtual reality becomes more developed and ubiquitous, our analyst team believes the gaming audience will quickly latch on accelerating growth for companies who capitalize on the technology. Activision Blizzard is in a prime spot to capitalize on these evolving technologies with its large scale and leading market share7. Mobile Gaming
The industry is also seeing a shift to where consumers are demanding games across
Source: Newzoo13

8
8
multiple platforms such as mobile. Mobile gaming will continue to be the largest segment of the video game industry following 10 years of double-digit growth since the first iPhone was launched in 2007. According to Newzoo, mobile gaming will have grown from the smallest gaming segment in 2012 to a 100-billion-dollar segment in 202113. As companies in the industry embrace accessibility of multiplatform games, customers will have an option to switch between screens and play a greater amount on the go. Companies who are able to adapt to these new platforms and make gameplay easily compatible across mobile devices will be able to capitalize through increased user gameplay. We have already seen heavy investment in mobile gaming across the industry with Activision Blizzard acquiring King for $5.9 billion in 20168, Electronic Arts acquiring Chillingo for $20 million in 20109. and Take Two Interactive acquiring Social Point for $250 million in 201710.
Source: Form 10-K Activision Blizzard7, Form 10-K Electronic Arts8. Form 10-K Take Two Interactive9
Of these transactions, our analyst team believes Activision’s acquisition will result in the highest return on investment due to King having the most scale and technical expertise of the acquisition targets. King owns one of the leading mobile games, Candy Crush, and will allow Activision to expand its current popular franchises across all platforms. Most recently, Activision’s King Segment had YoY revenue growth of 13% and 5% in the 1st and 2nd quarters, respectively8. In comparison, Electronic Art’s mobile gaming segment revenues declined by 2% YoY in the 2nd quarter9. Gamers will benefit from the increased convenience of being able to play their favorite games on the go. Recurring Revenue As the industry looks for more stable revenue, the offering of downloadable content and microtransactions has become an industry norm. Downloadable content is additional in-game content that is bought following the initial

9
9
purchase of a full-game, such as additional maps or multiplayer modes along with their game releases, while microtransactions are relatively low price transactions that typically provide small pieces of additional in-game content or various enhancements to gameplay. The initial game purchase is now the beginning of a string of transactions between video game publishers and customers. These purchases are made through online console marketplaces or websites. Our analyst team believes that this trend will keep customers engaged and satisfied with games for a longer period of time and thus minimize churn. Additionally, the games themselves are now more commonly being sold through digital channels instead of retail channels which increases margins and the ease for customers to keep coming back for more content. We feel that this trend is beneficial to all companies in the industry, specifically Activision with its wide variety of genres such as Call of Duty, Overwatch, and Destiny. New Markets The industry has made a push towards appealing to new demographic groups such as females and older, less experienced gamers. As baby boomers retire, companies both inside and outside the industry will compete for their growing leisure time. This trend differs from previous years where gaming was seen as a youthful, male-dominated form of entertainment. Our analyst team feels that Activision Blizzard is in a unique position to reach these new target demographic groups. While the
Company has a more specific demographic target market of young adult males for its Activision and Blizzard segments, the King mobile gaming segment reaches all demographic groups with its Candy Crush and Farm Heroes franchises being friendly to all ages. With the rise of smartphones, the mobile gaming industry is the best way to engage with new demographic groups. Source: Statista14
General Information
Based in Santa Monica, CA, Activision Blizzard, Inc., renamed after the merger of Activision, Inc. and Vivendi S.A. in 2008, is a leading developer and publisher of interactive entertainment content and services. The company distributes content through different channels including gaming consoles, computers, and mobile platforms. There are three segments of the Company: Activision Publishing, Inc., Blizzard Entertainment, Inc., and King Digital Entertainment. Activision is responsible for developing interactive software and content. Blizzard is similar to Activision but primarily focuses on PC gaming, and King is a leading developer of mobile entertainment. Blizzard is the leader in mobile entertainment8.
Corporate Strategy
Source: Form 10-K Activision Blizzard. (2018, February 27). Retrieved November 13, 20187
0.50.
100.150.200.250.300.
Smartphone users in the US (in millions)
Company Analysis

10
10
Activision Blizzard possesses valuable intellectual property through its popular gaming franchises. The Company’s strategy is to continue to utilize its resources to bring these games to almost every country across game consoles, PCs, and mobile devices. The Company also utilizes these franchises to diversify revenue streams through in-game content purchases, subscription services, and in-game advertising. Activision Blizzard is also investing heavily in eSports. 2018 marked the beginning of its Overwatch League in which there are 20 teams. With media rights deals in place with Amazon and Disney, and the very first championship event at the Barclays Center selling out, eSports proves to be a major factor in the Company’s corporate strategy and growth initiatives15. Finally, the Company’s investment in mobile gaming will prove to expand games to a much broader audience. Mobile gaming opens up the opportunity to reach hundreds of millions of new players around the world. The Company’s emphasis on investment in mobile gaming was shown with the acquisition of King in 2016. King’s impressive mobile platform includes Candy Crush, Farm heroes, and Bubble Witch. King’s games are free to play but generate revenue through in-game purchases. King has had two of the top 10 highest grossing mobile games for the past 17 quarters in a row8.
Life Cycle
Activision Blizzard, Inc. is in the growth stage of the company lifecycle. Call of Duty remains the most popular gaming franchise on the globe with the latest version, Call of Duty: Black Ops 4, being the second highest grossing video game thus far in 201816. While Call of Duty and Candy Crush constituted ~40% of 2017 revenue, our analyst team is confident of the growth prospects of the other franchises, specifically Overwatch as it gains more recognition from the Overwatch League. The overall industry and company shift to digitalizing games has helped company
margins and will support profitability far into the future due to lower packaging costs8. This industry shift has already materialized for Activision, as operating margins for the second quarter increased from 20.8% to 26.4% compared to a year ago. Other reasons we believe the Company is in the growth stage are due to the Company’s heavy investment in eSports and mobile gaming. Per Newzoo, by 2020, more than 50% of industry revenues will come from mobile games and the eSports market will reach $1.4 billion by 2020. This industry shift to mobile gaming and digitalization are the primary drivers of the growth reasoning of Activision Blizzard and the video game publishing industry13.
Digital Channel Revenue Doubled Since 2015
Source: Form 10-K Activision Blizzard8.
Segments & Franchises
Segment Net Revenues ’15-‘17
Source: Source: Form 10-K Activision Blizzard8.
Segment Operating Income ’15-‘17
Source: Form 10-K Activision Blizzard8.
Blizzard Entertainment, Inc.

11
11
Historically, the Activision Publishing segment of the Company has constituted the majority of revenue mainly due to the popularity of the Call of Duty franchise. While we expect Call of Duty to continue to be one of the top performing video games on the market in the years to come, the Blizzard Entertainment, Inc. segment was the main driver of our valuation model. Blizzard’s key franchises include Overwatch, Major League Gaming, World of Warcraft, StarCraft, Diablo, Hearthstone, and Heroes of the Storm. In 2017, the Blizzard segment accounted for 30.21% of consolidated net revenues. By 2024, we estimate that number will rise to 38.87% due to increasing popularity of the Overwatch franchise along with the Company’s commanding footprint within the eSports market under its Overwatch League. The eSports market currently sits at 167mm people, larger than that of Major League Baseball and the National Hockey League. By 2022, the audience is estimated to rise to 276mm, on par with that of the National Football League. The 2017 revenue breakdown of eSports can be seen below13.
Source: NewZoo13
Another major driver that positions Activision Blizzard well in the eSports market is its two year, $90M deal with Twitch, the distribution channel that captures 84% of live-streaming viewership in North America, enabling the channel to distribute17 the Overwatch League in North America. We believe this contract enables audiences to get optimal exposure to the Overwatch franchise. Furthermore, the chart on the next page illustrates why our analyst team estimated that the Blizzard segment would be the primary revenue driver for the Company by 2024. Blizzard Entertainment, Inc. possessed four of the top eight eSports titles in 2017 with League of Legends, Hearthstone: Heroes of Warcraft, Overwatch, and Starcraft II. In addition, the Activision segment is home to the #5 title on that list, Call of Duty: Infinite Warfare. eSports not only helps to increase the audience of these games through “free” marketing on video platforms such as Twitch and YouTube, but it also helps drive player engagement through in-game purchases. So far, the majority of revenue that Activision Blizzard has generated from the league has come from the sale of team ownership to entrepreneurs across the world, the most notable being New England Patriots owner Robert Kraft. Last year in 2017, Activision Blizzard sold 12 teams for almost a quarter of a billion dollars, according to CEO Bobby Kotick in a letter to shareholders. In September, Activision confirmed the addition of eight new teams to the Overwatch League’s second season, making a total of 20 franchises. ESPN reported that owners paid anywhere in the $30-$60mm range for the second season’s new teams, compared to $20mm for the League’s first season, a sign of rising franchise value17. Because of the strong growth rate projections of the Overwatch League and eSports overall, we felt confident in forecasting Blizzard’s monthly active users (MAUs), the number of individuals who accessed

12
12
a particular game in a given month, to grow at a 7.08% CAGR from 2018 to 2014.
Source: NewZoo13
Activision Publishing, Inc.
The Activision segment is home to the juggernaut Call of Duty franchise that has dominated the video game market since the franchise’s inception in 2003. The recent release of Call of Duty: Black Ops 4 has been off to a fast start, and the Company announced that the new release is the biggest day-one digital release in the company’s history. This means that it sold more digital copies in a shorter amount of time on Xbox One, Playstation 4, and PC more than any other Activision game. In addition, Black Ops 4 became the best-selling day-one full game on the Playstation Store globally and also became the best-selling Activision day-one digital game on the Xbox Store. With sales of $500 million during its three-day launch weekend, it is the second largest video game launch of 2018 behind Take-Two’s Red Dead Redemption 2 $725 million three-day launch16. While Black Ops 4 has lagged behind thus far in sales compared to Red Dead Redemption 2, we like the positioning of the new installment with its new “Blackout” game mode, a direct spin off of the Battle Royale game mode made popular by Epic Game’s Fortnite .The game mode, which is when players are dropped into an increasingly shrinking map and must survive to be the last player standing, is the most popular genre that audiences enjoy watching according to SuperData, a games research company. The research company also found that Fortnite accounted for 83% of the 700
million hours of battle royale content that audiences watched on streaming platforms between May 2017 and May 2018. Fortnite, a free-to-play game that generates revenue through in-game transactions, has posed as a legitimate threat to the Call of Duty franchise as a high-quality, cheaper alternative. While this may be the case, we partly attribute the success of Fortnite to first-person shooter gamers seeking an alternative while they wait for a new Call of Duty release. Now that Call of Duty has released its own version of a battle royale game mode, Fortnite may see a declining user base. Due to Activision’s sheer scale, leading market share, and prominent brand name, our analysts believe Call of Duty is still the best positioned first-person shooter franchise going forward and is the main driver in our 2.85% revenue CAGR forecast for the Activision segment to 2024. Within the eSports market, Activision is well positioned relative to its peers. While Take-Two has an eSports presence with its NBA 2K franchise, its first-person shooter competitor Red Dead Redemption is nonexistent within the space. Regarding Fortnite, the free-to-play game did not make any noise in eSports in 2017. However, Epic Games announced in May that it will provide $100 million to fund prize pools for Fortnite tournaments in 2019 in what would be the biggest in eSports in terms of prize money and much larger than Call of Duty’s $4mm in prize money in 2017. The big advantage that we found that Activision possesses over Fortnite within eSports is the leverage that the Blizzard segment has with the Overwatch League. We like the new blackout mode as a significant driver of user engagement and Twitch viewership. This would be a critical foundation upon which Activision could construct a unique eSports business parallel to Blizzard’s Overwatch League. In addition, Epic Games has announced that they will not be selling teams or franchises for its Fortnite eSports. Activision, who announced in its 2017 annual report that it plans to launch

13
13
team sales for its Call of Duty World League in the near future, could potentially capitalize on Epic Game’s lack of initiative to launch team sales. Our analysts view the potential addition of franchises to the Call of Duty World League as a viable, revenue generating infrastructure that can closely mirror the Overwatch League. The initiative to launch team sales to the Call of Duty league could even rival traditional sports for advertisers, viewers, sponsors, and ticket and merchandise sales18.
King Digital Entertainment
Source: Form 10-K Activision Blizzard7.
Activision Blizzard, Inc. acquired King back in 2016 for $5.9B, providing Activision with an arm in the fast-growing, mobile gaming business. In 2017, King accounted for 28.47% of total revenues. While the mobile gaming industry is experiencing high growth, King has seen its monthly active users decline from 285 million in Q1 to 262 million in Q3. We attribute this decline to users facing little to no switching costs to different mobile games, as these games are typically purchased for less than a few dollars. In addition, the barriers to entry within mobile gaming are low due to low capital investment. We forecasted King’s monthly active users to decline at a 0.05% rate to 2024 due to the mobile gaming space becoming more saturated with developers combined with the minimal switching costs users face with different apps. Even with King facing a decline in monthly active users, our analysts estimate the segment to grow at a 5% CAGR over the explicit forecast period driven by a 5% annual increase in revenue per active user. We attribute this rise in revenue per user to developers increasingly adopting the freemium monetization model, which generates revenue through in-app purchases. According to Newzoo, mobile game advertising is projected to
expand 97% from 2014-201919. Due to the success of King’s Candy Crush franchise, we believe that the segment is in a strong position to generate significant advertising fees as companies will be eager to advertise their brand through an established franchise. This reasoning is showcased through King’s 64.58% increase in revenue per MAU in 20178.
Source: FactSet20
Manufacturing and Distribution
Manufacturing Process and Costs
Activision Blizzard, Inc. prepares master copies for each release platform. All manufacturing tasks including disk duplication, packaging, printing, and warehousing is performed by a third-party subcontractor in facilities owned by Activision. Microsoft, Sony, and Nintendo generally control the manufacturing process and license its hardware technology to Activision in return for a royalty on each unit created. Due to Activision’s heavy reliance on third-party hardware platform providers, fees associated with manufacturing as well as the schedule of releases can be strongly influenced by the hardware providers such as Microsoft, Sony, and Nintendo. While these manufacturing contracts leave developers and publishers with little power, we believe Activision Blizzard’s strong franchises enable them with some leverage over
1,389735
76862
636415
821,425
500 1,000 1,500
- Call of Duty- Destiny
- Skylanders- Overwatch.
- World of Warcraft- Hearthstone
- Heroes of the Storm- Candy Crush Family
Sales (in millions)Fr
anch
ise T
itle
2017 Sales by Franchise
14
14
manufacturers and ensures that the schedule of new releases is not disrupted significantly. Furthermore, due to the success of the Company’s console franchises, console manufacturers are eager to license their technology to an established developer and publisher like Activision. This entrenched customer relationship Activision possesses with its manufacturers creates a barrier to entry for unestablished developers8.
Suppliers and Raw Materials
Inventories for the Company include materials, royalties to console manufacturers, labor, and freight costs. Activision in 2017 saw an increase in labor costs due to the increased growth in the business and the continued demand for top developer and engineer talent. We believe this is an industry wide trend affecting all publishers the demand for the high quality content has never been higher. Due to the growth of digitalization and users purchasing less physical copies, we believe the current supply chain process will become more obsolete, ultimately resulting in higher margins for developers and publishers8.
Significant Customers
In 2017 Activision displayed mild customer concentration, as its top three customers Apple, Sony, and Google accounted for 16%, 14%, and 10% of net revenues, respectively. Activision possesses a more diverse customer base than Electronic Arts, whose top three customers accounted for 39%, 21%, and 10% of 2017 revenue, respectively8. Take-Two Interactive did not report its top three customers as a % of revenue as Activision and EA did; however, they reported that their top five customers accounted for 70% of 2017 revenue, meaning that Electronic Arts is as reliant on three customers as Take-Two is five9. Out of the three publishers, Activision possesses the most diverse customer base, leaving us to believe that the Company’s
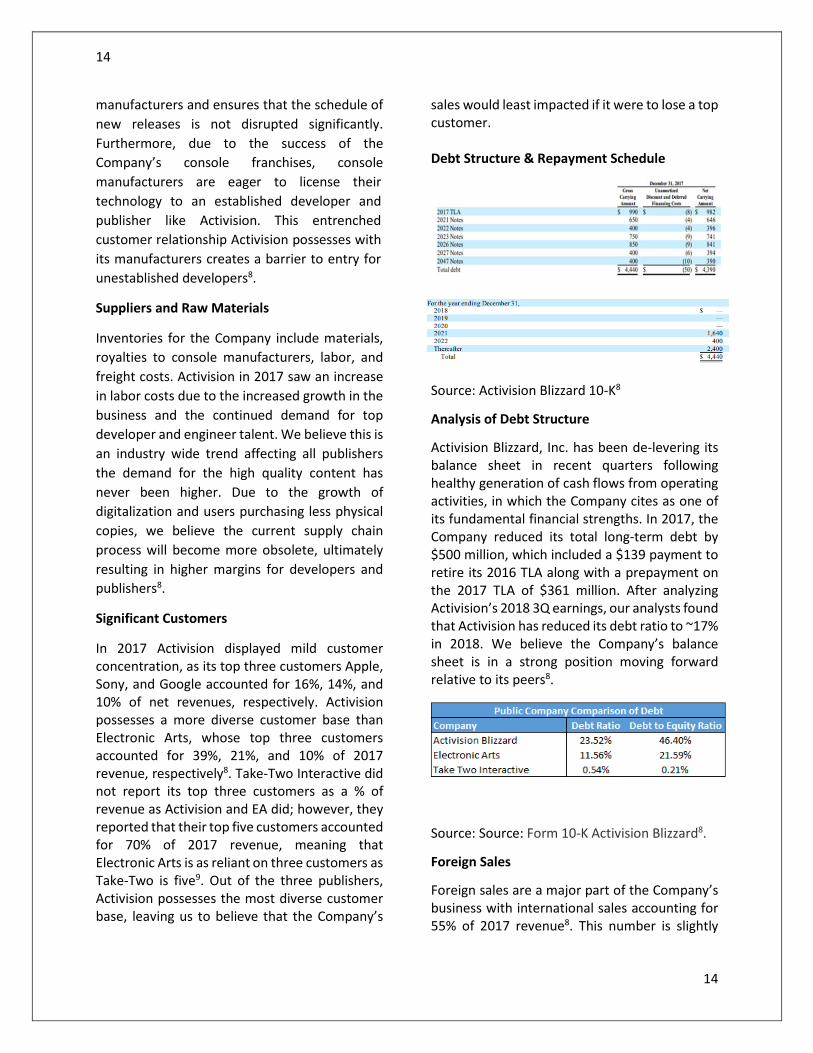
sales would least impacted if it were to lose a top customer. Debt Structure & Repayment Schedule
Source: Activision Blizzard 10-K8
Analysis of Debt Structure
Activision Blizzard, Inc. has been de-levering its balance sheet in recent quarters following healthy generation of cash flows from operating activities, in which the Company cites as one of its fundamental financial strengths. In 2017, the Company reduced its total long-term debt by $500 million, which included a $139 payment to retire its 2016 TLA along with a prepayment on the 2017 TLA of $361 million. After analyzing Activision’s 2018 3Q earnings, our analysts found that Activision has reduced its debt ratio to ~17% in 2018. We believe the Company’s balance sheet is in a strong position moving forward relative to its peers8.
Source: Source: Form 10-K Activision Blizzard8.
Foreign Sales
Foreign sales are a major part of the Company’s business with international sales accounting for 55% of 2017 revenue8. This number is slightly

15
15
larger than Take-Two’s, whose international sales accounted for 41.3% of last fiscal year’s revenue10. Activision’s foreign presence is similar to Electronic Arts Inc., whose foreign sales comprised 59% of total net revenue for its fiscal year ended March 31, 20189. We believe that the Company’s international presence is an overall positive sign due to diversified sources of revenue and opportunities for growth. As Activision Blizzard builds out its global eSports league, the league will only accelerate international revenue growth.
Source: Form 10-K Activision Blizzard7, Form 10-K Electronic Arts8. Form 10-K Take Two Interactive9
Analysis of Recent Earnings
Activision Blizzard, Inc. recently reported 3Q earnings and saw mixed reactions from investors. While the Company beat revenue and GAAP EPS estimates, the Company’s stock fell ~10% following the earnings announcement amid disappointing Q4 revenue and EPS guidance and a decline in monthly active users. Although Activision’s $0.43 Q4 EPS guidance fell below market expectations, these estimates are right in line with our analyst team’s FY 2018 forecast of $1.97/share. Furthermore, we believe the sell-off does not change the long-term, fundamental outlook on the video game publisher. Management noted on the 3Q conference call the Company’s movement to a higher-margin business through new engagement models
driven by in-game content and community-style models such as Blizzard’s Overwatch League and the Call of Duty World League. Despite the short-term setback, our analysts still issue a buy rating for Activision Blizzard, Inc. as we believe the Company is in a great spot to reap the benefits of the secular industry trends going forward21.
Catalysts for Growth and Change
Activision Blizzard has the opportunity with its prominent franchises and resources to expand popular brands to mobile gaming. With Activision’s acquisition of King Digital in 2016, they acquired the talent and resources to capitalize on the robust growth of mobile gaming. By creating the highest-quality mobile gaming experience with already well-received franchises, Activision will be poised for high growth. Another opportunity for growth comes from the Company’s investment in eSports with Blizzard’s Overwatch League. eSports is just beginning to take off among gamers and Activision will benefit as the owner of the Overwatch League which now consists of 20 teams in which 9 are internationally based heading into 2019. The international exposure of the league will serve as a catalyst to both the league and company’s growth as they will be able to reach a much wider audience.
Key Investment Positives
• Strong sales ($500mm in its three day launch) of Call of Duty: Black Ops 4 and its threat to Fortnite with its new Blackout mode.
• A strengthening recurring revenue model, as the Company was able to capture 78% of its net revenues through microtransactions, DLC, and other subscription based revenue8.
• A commanding footprint within the eSports market following its acquisition of Major League Gaming in 2016. Our team is very optimistic of the revenue

16
16
opportunities the League possesses, including the sale of advertisements, franchise cash flows, ticket sales, sponsorships, and consumer product sales.
• Industry leading initiatives towards mobile gaming following the acquisition of leading mobile game developer King Digital in 2016, which not only secured a new mobile gaming customer base, but also a bundle of talent and resources that gives them the opportunity to capture a large share of the mobile gaming market.
Key Investment Negatives
• Heavy reliance on franchises for a significant portion of revenues which puts the Company at risk from small hiccups in key franchises.
• Consumer preferences are cyclical and difficult to predict combined with very high customer expectations. If the company fails to create high-quality content in a timely manner, then consumers may choose alternative forms of entertainment.
• The Company’s key growth initiatives into mobile gaming and eSports may have negative impacts. The ambitious expansion of new business models may result in diverting resources and attention from its core business model.
• The industry is seeing a shift away from traditional content delivery to strictly digital content delivery which poses a risk to Activision due to the less capital intensive nature of digital content. The lower barriers to entry will increase competition for Activision8.
Introduction
Our analysts arrived at our implied target stock price range by conducting three valuation methodologies: discounted cash flow analysis, economic profit analysis, and relative valuation. Our inputs into each of these valuation techniques not only reflect our expectations of the future performance of Activision Blizzard, Inc., but also the overall video game publishing industry. We carefully considered how each of Activision Blizzard’s operating segments would perform relative to its peers in the industry and how these segments could capitalize on overall, secular industry trends. The team believes that the discounted cash flow analysis most accurately captures Activision Blizzard’s intrinsic value due to the fact that we were able to construct various operating scenarios regarding growth in monthly active users, revenue per active user, and certain expenditures as a % of net revenues. With the discounted cash flow analysis, we projected Activision Blizzard’s future free cash flows out to 2024, which is the year we assume the Company grows at a constant rate into perpetuity.
Revenue Decomposition
We forecasted Activision Blizzard’s consolidated net revenues to grow at a 4.95% CAGR from 2018 to 2024. This forecast was done by projecting out Activision’s revenues for each of its three operating segments: Activision, Blizzard, and King. To arrive at forecasted segment revenues, we further broke down segment revenues into monthly active users per segment and revenue per monthly active users. Monthly active users (MAUs) are the number of individuals who accessed a particular game in a given month and is a key measure of the overall size of each segment’s user base. After forecasting the growth in MAUs and revenue per MAU for each of the three segments, we multiplied the forecasted number of MAUs by the forecasted
Valuation Analysis
17
17
revenue per MAU to arrive at total segment revenue.
Activision Revenue Forecast
To more accurately forecast each segment’s revenue, we forecasted the growth in MAUs per segment and revenue per MAU for three different operating scenarios: worst case, realistic case, and best case. Going forward in this report, any forecasted number that is not specified to be estimated within the best or worst case can be assumed to be forecasted under the realistic case. We forecasted Activision’s segment revenue to grow at a realistic case of 3.02% to 2023, followed by a 2.01% increase in the 2024 continuing value period. We arrived at this figure by assuming Activision grows its MAUs by 1% each year within the forecast period and grows its revenue per MAU at 2%. Due to Activision’s ability to continually build and improve off of its impressive franchise list, specifically Call of Duty, and the potential team sales for the Call of Duty World League, we believe this is a realistic assumption. Our best case estimated the segment to grow at 4.04% over the forecast period, which assumes that the Call of Duty franchise increases its market share among first-person shooters and sees no increased competition. Our worst case assumes that Activision grows at a modest 1.50% as a result of stagnant economic growth and Call of Duty losing popularity due to saturation within the first-person shooter market.
Blizzard Revenue Forecast
Blizzard Entertainment is projected to grow at an impressive 10.19% rate over the next seven years as a result of the rapid growth of monthly active users driven by the increasing popularity behind the Overwatch League and eSports. We also believe that Blizzard will increase revenue per MAU at 2.50% over the same period due to the monetization of its eSport business, which includes advertising, sponsorships, apparel sales, and team cash flows. In addition, we are estimating that the Overwatch game itself gains
popularity as a result of the broader eSports league, resulting in more frequent microtransactions and DLC.
King Revenue Forecast
The King segment is forecasted to grow at 4.48% over the explicit forecast period as a result of a 5% annual increase in revenue per MAU. The increasing monetization of mobile game users is part of a broader, secular trend and we feel confident of the technical expertise King possesses to capitalize on this opportunity. While MAU’s are forecasted to decline by .5% per year due to the low barrier to entry mobile game market becoming more saturated, King can make up for the lost by significant advertising.
Product Development Expense as % of Sales & Operating Income
Product development expense as a % of sales is forecasted to decrease from 15.23% of 2017 sales to 12.5% of sales throughout the entire forecast period. We believe Activision Blizzard is well positioned to capitalize on the digitalization trend within the gaming industry, resulting in less purchases of tangible copies of games by users and more purchases of new games online through console manufacturers’ online store in conjunction with microtransactions and DLC. Digitalization results in decreased product costs for publishers like Activision Blizzard due to lower packaging and distribution costs and is the primary driver our analyst team has forecasted Activision Blizzard to increase operating margins to nearly 24% throughout the forecast period, a significant jump from 18.65% in 2017. Under a worst case scenario, the digitalization does not materialize as projected and product development costs rise to 13.5% of sales.
Sales and Marketing Expense as % of Sales
We forecasted sales and marketing expense to realistically constitute 18% of net revenues, the highest expense that Activision Blizzard faces in the forecast period. While this is slightly lower than 2017’s 19.64% of sales, we believe that the

18
18
growth of Blizzard’s Overwatch League and overall eSports business will result in high advertising costs for the league. With an audience base already larger than the National Hockey League, Major League Baseball, and projected to surpass the National Football League by 2022, Activision Blizzard will need to invest heavily in sales and marketing for the projected growth to materialize.
General Administrative Expense as % of Sales
General and administrative expense as a % of sales is estimated to stay near 2017 levels at 11%, with potential to rise in the future as the demand for top developer and engineer talent requires higher labor costs to retain such talent. In addition, we also estimated general and administrative expense to constitute 12.5% of sales in a worse-case scenario, which we believe would be due to the rapid growth of eSports and Activision Blizzard finding itself unable to achieve economies of scale within eSports.
Continuing Value (CV) Growth
We forecasted that Activision Blizzard’s steady state period would begin at 2024 and grow at 4.92%, 2.42% higher than our long-term GDP forecast. Our analysts believe this is a sustainable number due to the increasingly recurring nature of game revenue combined with the fact that Blizzard will likely have more than thirty Overwatch League franchises generating consistent cash flows by 2024.
Weighted Average Cost of Capital (WACC)
We estimated Activision Blizzard’s weighted average cost of capital to be 7.44%, calculated from a 7.84% cost of equity and a pre-tax cost of debt of 3.61%. Activision Blizzard’s WACC is significantly lower than Electronic Arts and Take-Two Interactive’s WACCs of 11.62% and 12.36%, respectively. We believe this lowered cost of capital for Activision Blizzard can be attributed to Activision being a more established video game publisher possessing franchises that are less cyclical in nature due to their entrenched customer base.
Cost of Debt
We calculated Activision Blizzard’s pre-tax cost of debt by finding the YTM on its most recently issued, publicly traded debt, which was 3.6148%. The Company’s market weight of debt totaled out to $5.06 billion, which included the PV of operating leases and its long-term debt on the balance sheet. The Company’s marginal tax rate of 10% created a tax shield on the debt interest, lowering the cost of debt after-tax to be 3.25%.
Cost of Equity
Our analysts utilized the capital asset pricing model to determine Activision Blizzard’s cost of equity. We used the 10-year treasury yield to determine the risk-free rate used in the CAPM and used Bloomberg to find the Company’s raw, unadjusted beta. These figures were 3.083% and 0.991, respectively.
Valuation Models
Our discounted cash flow model and economic profit model determined the adjusted target price of Activision Blizzard, Inc. to be $84.167 based off of the aforementioned drivers. When constructing the DCF analysis, our team forecasted Activision Blizzard’s free cash flows into a seven-year forecast period and discounted these future free cash flows back to the present value using the 7.44% weighted average cost of capital. Following this, we projected the Company’s free cash flows into perpetuity to grow at a steady state rate of 4.92% and then discounted the present value of this continuing value back to the present value. We summed the present values of the forecast period and continuing value period to arrive at an implied price per share of $79.167. Finally, we then adjusted the stock price for the partial-year period, resulting in a partial-year adjusted target price of $84.167. Our dividend discount model provided us with a target price of $40.62; however, we do not feel this methodology fully captures all of Activision Blizzard’s value drivers

19
19
in determining a price. We also conducted relative valuation by using the fundamental P/E ratio and EV/EBITDA ratio to come up with an implied price for Activision Blizzard, Inc. of $94.47 and an enterprise value of $47,504.7 billion. While we only used two direct competitors when conducting the relative valuation, we believe this accurately captures Activision Blizzard’s main threats going forward. We discussed potentially including Microsoft as a direct competitor, but were dissuaded due to Microsoft’s market cap that is more than 10x of Activision. We believe that Take-Two Interactive and Electronic Arts are the two main companies that directly compete for users’ leisure time and game unit sales and also possess similar operating segments.
Sensitivity Analysis
We utilized sensitivity analysis in conjunction with operating scenarios to test different combinations of revenue growth, WACC inputs, and cost of game operations and distribution costs and their variability against the implied stock price.
Equity Risk Premium vs. Beta
We ran an analysis on how changing the WACC inputs of the equity risk premium and Beta would affect the implied stock price. We found the stock price was very sensitive to minor changes, primarily due to the fact that the Company is weighted with 91.26% equity.
CV Growth vs. CV ROIC
We found it important to test how changes in the long-term, continuing growth rate and return on invested capital would affect the intrinsic value of the stock. Not surprisingly, we found the target price sensitive to minor changes in CV growth due to the high value that the continuing value makes up towards the value of operating assets.
CV Growth vs. WACC
Similar to above, we wanted to test the sensitivity of the long-term growth rate against the cost of capital that discounts Activision Blizzard’s future cash flows.
Operating Scenarios and Target Price
Best Case
Our best case operating scenario calculated an adjusted target price of $144.497. While we do not view this as a likely scenario, we believe this outcome would result from rapid growth from the Overwatch and Call of Duty eSports leagues. In addition, the Company would need to generate high growth in revenue per MAU’s from microtransactions, DLC, and advertising through its mobile franchises.
Realistic Case
As previously noted, our realistic case operating scenario implies that Activision Blizzard’s intrinsic value lies at $84.167 per share, ultimately driving our buy rating for the video game developer and publisher.
Worst Case
The worst case operating scenario for Activision computed the target price at $50.283. We view this scenario with higher probability than the best case scenario due to the fact that the Company’s stock currently hovers below $60 amid the recent tech-sell off. This scenario would possibly occur if the King segment failed to capitalize on in-game advertising revenue, the Activision segment saw its Call of Duty franchise decline, or the Blizzard segment failing to capture viewers in its Overwatch League.

20
20
Activision Blizzard, Inc. (n.d.). Retrieved November 13, 2018, from https://company-security.apps.factset.com/snapshot/ATVI-US20
Ballard, J. (2018, June 10). Esports Is Already Nearing $1 Billion in Revenue for Activision Blizzard. Retrieved from https://www.fool.com/investing/2018/06/10/esports-is-already-nearing-1-billion-in-revenue-fo.aspx15
Bureau of Labor Statistics Data. (n.d.). Retrieved November 13, 2018, from https://data.bls.gov/timeseries/LNS14000000 1
Bureau of Labor Statistics Data. (n.d.). Retrieved November 13, 2018, from https://data.bls.gov/timeseries/LNS14000000 2
Call of Duty Dominates Twitch, Could it be the Next Fortnite? (2018, October 17). Retrieved November 13, 2018, from https://esportsobserver.com/call-of-duty-dominates-twitch/ 17
Cotter, J. (2018, November 12). Activision Blizzard: Shift To Digital Engagement Offers Interesting Valuation. Retrieved from https://seekingalpha.com/article/4221165-activision-blizzard-shift-digital-engagement-offers-interesting-valuation22
Fed Funds Rate. (n.d.). Retrieved November 13, 2018, from https://www.bankrate.com/rates/interest-rates/federal-funds-rate.aspx5
Form 10-K Activision Blizzard. (2018, February 27). Retrieved November 13, 2018, from https://investor.activision.com/static-files/cc07336f-b729-4e40-9e79-b93992eab5468
Form 10-K Electronic Arts. (2018, May 23). Retrieved November 13, 2018, from https://d18rn0p25nwr6d.cloudfront.net/CIK-0000712515/0af5a713-3ae8-4092-a88b-f1a102422b2a.pdf 9
Form 10-K Take Two Interactive. (2018, May 17). Retrieved November 13, 2018, from file:///C:/Users/mtopping/Downloads/T2 2018 Annual Report (2).pdf10
Hadad, J. (2018, July). Video Game Software Publishing in the US. Retrieved November 13, 2018, from http://clients1.ibisworld.com/reports/us/industry/default.aspx?entid=19935
Hassan, A. (2018, October 12). The battle royale of battle royales: Call of Duty vs. Fortnite. Retrieved from https://qz.com/quartzy/1422707/the-battle-royale-of-battle-royales-call-of-duty-vs-fortnite/23
Kiernan, P. (2018, August 30). Core Inflation Hits Fed's 2% Target as Spending Heats Up. Retrieved November 13, 2018, from https://www.wsj.com/articles/core-inflation-hits-feds-2-target-as-spending-heats-up-1535636758?mod=searchresults&page=1&pos=34
References

21
21
Kim, T. (2018, May 22). Epic makes 'Fortnite' biggest esport in the world with $100 million in prize money. Retrieved from https://www.cnbc.com/2018/05/21/epic-makes-fornite-biggest-esport-with-100-million-in-prize-money.html18
Kim, T. (2018, November 08). Activision Blizzard Stock Is Plunging After a Weak Outlook, and Destiny Disappointment. Retrieved from https://www.barrons.com/articles/activision-blizzard-stock-is-plunging-after-a-weak-outlook-and-destiny-disappointment-1541717461 21
Mackenzie, T. (n.d.). App store fees, percentages, and payouts: What developers need to know. Retrieved from https://www.techrepublic.com/blog/software-engineer/app-store-fees-percentages-and-payouts-what-developers-need-to-know/11
(n.d.). Retrieved from https://www.conference-board.org/data/consumerconfidence.cfm 6
Noonan, K. (2018, November 13). Take-Two's Latest Video Game Is on Track to Be One of the Most Successful Entertainment Releases Ever. Retrieved November 13, 2018, from https://finance.yahoo.com/news/two-apos-latest-video-game-110400912.html16
NPDGroup-Video-Game-Spending-Growth-in-H1-Sept2018. (n.d.). Retrieved from https://www.marketingcharts.com/charts/us-consumer-spending-growth-video-games-h1-2018/attachment/npdgroup-video-game-spending-growth-in-h1-sept201812
Price level comparison for household final consumption expenditures. (2018). Retrieved from https://www.conference-board.org/data/consumerconfidence.cfm3
Statista. (n.d.). Number of smartphone users in the United States from 2010 to 2022 (in millions)*. In Statista - The Statistics Portal. Retrieved November 13, 2018, from https://www.statista.com/statistics/201182/forecast-of-smartphone-users-in-the-us/.\14
Takahashi, D. (2018, May 11). Newzoo: Top 25 game companies captured 77% of $121.7 billion market. Retrieved from https://venturebeat.com/2018/05/09/newzoo-top-25-game-companies-captured-77-of-121-7-billion-market/13
Torry, H., & Francis, T. (2018, August 29). U.S. Corporate Profits Soared in Second Quarter, Boosted by Tax Cuts and Economic Growth. Retrieved November 13, 2018, from https://www.wsj.com/articles/u-s-corporate-profits-soared-in-second-quarter-boosted-by-tax-cuts-and-economic-growth-1535559230 3
3 game monetization trends that are transforming the mobile app economy. (n.d.). Retrieved November 13, 2018, from https://www.gamesindustry.biz/articles/2018-05-21-3-game-monetization-trends-that-are-transforming-the-mobile-app-economy 19

22
22
This report was created by students enrolled in the Security Analysis (FIN:4250) class at the University of Iowa. The report was originally created to offer an internal investment recommendation for the University of Iowa Krause Fund and its advisory board. The report also provides potential employers and other interested parties an example of the students’ skills, knowledge and abilities. Members of the Krause Fund are not registered investment advisors, brokers or officially licensed financial professionals. The investment advice contained in this report does not represent an offer or solicitation to buy or sell any of the securities mentioned. Unless otherwise noted, facts and figures included in this report are from publicly available sources. This report is not a complete compilation of data, and its accuracy is not guaranteed. From time to time, the University of Iowa, its faculty, staff, students, or the Krause Fund may hold a financial interest in the companies mentioned in this report.
Disclaimer

Activision Blizzard, Inc.Revenue Decomposition
Fiscal Years Ending Dec. 31 2015 2016 2017 2018E 2019E 2020E 2021E 2022E 2023E CV 2024ESegment Revenues
Activision 2,700 2,220 2,628 2,707 2,789 2,873 2,960 3,050 3,142 3,205YoY growth % 0.52% -17.78% 18.38% 3.02% 3.02% 3.02% 3.02% 3.02% 3.02% 2.01%
Blizzard 1,565 2,439 2,120 2,336 2,574 2,836 3,125 3,443 3,794 4,084YoY growth % -9.01% 55.85% -13.08% 10.19% 10.19% 10.19% 10.19% 10.19% 10.19% 7.62%
King - 1,586 1,998 2,087 2,181 2,278 2,380 2,487 2,598 2,714YoY growth % 0.00% 0.00% 25.98% 4.48% 4.47% 4.47% 4.48% 4.48% 4.48% 4.48%Total Segment Revenues 4,266 6,246 6,747 7,131 7,544 7,988 8,466 8,980 9,534 10,003
Other 399 363 271 286 303 321 340 361 383 402Consolidated Net Revenues 4,664 6,608 7,017 7,417 7,847 8,309 8,806 9,341 9,917 10,405
YoY growth % 5.81% 41.68% 6.19% 5.70% 5.79% 5.89% 5.98% 6.08% 6.17% 4.92%Average Monthly Active Users (MAUs)
Activision 49 50 50 51 51 52 52 53 53 54YoY growth % 2.04% 0.00% 1.00% 1.00% 1.00% 1.00% 1.00% 1.00% 1.00%
Blizzard 26 36 42 45 49 52 56 60 65 68YoY growth % 38.46% 16.67% 7.50% 7.50% 7.50% 7.50% 7.50% 7.50% 5.00%
King 494 405 310 308 307 305 304 302 301 299YoY growth % -18.02% -23.46% -0.50% -0.50% -0.50% -0.50% -0.50% -0.50% -0.50%Total 569 491 402 404 406 409 412 415 419 421
Annual Revenue Per MAUActivision 55.10 44.40 52.56 53.6 54.7 55.8 56.9 58.0 59.2 59.8
YoY growth % -19.42% 18.38% 2.00% 2.00% 2.00% 2.00% 2.00% 2.00% 1.00%Blizzard 60.19 67.75 50.48 51.7 53.0 54.4 55.7 57.1 58.5 60.0
YoY growth % 12.56% -25.50% 2.50% 2.50% 2.50% 2.50% 2.50% 2.50% 2.50%King - 3.92 6.45 6.8 7.1 7.5 7.8 8.2 8.6 9.1
YoY growth % 64.58% 5.00% 5.00% 5.00% 5.00% 5.00% 5.00% 5.00%Total 115.29 116.07 109.48 112.12 114.82 117.60 120.44 123.37 126.37 128.85
Revenue DecompositionFiscal Years Ending Dec. 31 2015 2016 2017 2018E 2019E 2020E 2021E 2022E 2023E CV 2024ESelect an operating scenario
Growth of Activision Monthly Active Users (MAUs) 1.0% 1.0% 1.0% 1.0% 1.0% 1.0% 1.0%Growth of Activison Revenue per MAU 2.0% 2.0% 2.0% 2.0% 2.0% 2.0% 1.0%Growth of Blizzard Monthly Active Users (MAUs) 7.5% 7.5% 7.5% 7.5% 7.5% 7.5% 5.0%Growth of Blizzard Revenue per MAU 2.5% 2.5% 2.5% 2.5% 2.5% 2.5% 2.5%Growth of King Monthly Active Users (MAUs) -0.50% -0.50% -0.50% -0.50% -0.50% -0.50% -0.50%Growth of King Revenue per MAU 5.0% 5.0% 5.0% 5.0% 5.0% 5.0% 5.0%Product Development Expense % of Sales 12.5% 12.5% 12.5% 12.5% 12.5% 12.5% 12.5%Sales and Marketing Expense % of Sales 18.0% 18.0% 18.0% 18.0% 18.0% 18.0% 18.0%General & Administrative Expense % of Sales 11.0% 11.0% 11.0% 11.0% 11.0% 11.0% 11.0%
Growth of Activision Monthly Active Users (MAUs)Best Case 1.5% 1.5% 1.5% 1.5% 1.5% 1.5% 1%Realistic Case 1% 1% 1% 1% 1% 1% 1%Worst Case 0.5% 0.5% 0.5% 0.5% 0.5% 0.5% 0.5%
Growth of Activison Revenue per MAUBest Case 2.5% 2.5% 2.5% 2.5% 2.5% 2.5% 1.0%Realistic Case 2.0% 2.0% 2.0% 2.0% 2.0% 2.0% 1.0%Worst Case 1.0% 1.0% 1.0% 1.0% 1.0% 1.0% 1.0%
Growth of Blizzard Monthly Active Users (MAUs)Best Case 8.5% 8.5% 8.5% 8.5% 8.5% 8.5% 5.0%Realistic Case 7.5% 7.5% 7.5% 7.5% 7.5% 7.5% 5.0%Worst Case 6.0% 6.0% 6.0% 6.0% 6.0% 6.0% 6.0%
Growth of Blizzard Revenue per MAUBest Case 3.5% 3.5% 3.5% 3.5% 3.5% 3.5% 2.5%Realistic Case 2.5% 2.5% 2.5% 2.5% 2.5% 2.5% 2.5%Worst Case 1.8% 1.8% 1.8% 1.8% 1.8% 1.8% 1.8%
Growth of King Monthly Active Users (MAUs)Best Case 1.0% 1.0% 1.0% 1.0% 1.0% 1.0% 0.0%Realistic Case 0.0% 0.0% 0.0% 0.0% 0.0% 0.0% 0.0%Worst Case -0.3% -0.3% -0.3% -0.3% -0.3% -0.3% -0.3%
Growth of King Revenue per MAUBest Case 6.0% 6.0% 6.0% 6.0% 6.0% 6.0% 5.0%Realistic Case 5.0% 5.0% 5.0% 5.0% 5.0% 5.0% 5.0%Worst Case 4.0% 4.0% 4.0% 4.0% 4.0% 4.0% 4.0%
Product Development Expense % of SalesBest Case 11.0% 11.0% 11.0% 11.0% 11.0% 11.0% 11.0%Realistic Case 12.5% 12.5% 12.5% 12.5% 12.5% 12.5% 12.5%Worst Case 13.5% 13.5% 13.5% 13.5% 13.5% 13.5% 13.5%
Sales and Marketing Expense % of SalesBest Case 16.0% 16.0% 16.0% 16.0% 16.0% 16.0% 16.0%Realistic Case 18.0% 18.0% 18.0% 18.0% 18.0% 18.0% 18.0%Worst Case 20.0% 20.0% 20.0% 20.0% 20.0% 20.0% 20.0%
General & Administrative Expense % of SalesBest Case 8.5% 8.5% 8.5% 8.5% 8.5% 8.5% 8.5%Realistic Case 11.0% 11.0% 11.0% 11.0% 11.0% 11.0% 11.0%Worst Case 12.5% 12.5% 12.5% 12.5% 12.5% 12.5% 12.5%

Activision Blizzard, Inc.Income Statement
Fiscal Years Ending Dec. 31 2015 2016 2017 2018E 2019E 2020E 2021E 2022E 2023E 2024E (CV)(in millions)Net revenuesTotal net revenues 4664 6608 7017 7,417 7,847 8,309 8,806 9,341 9,917 10,405
Growth 5.81% 41.68% 6.19% 5.70% 5.79% 5.89% 5.98% 6.08% 6.17% 4.92%Costs and expenses
Cost of product sales - product costs 872 741 733 705 745 789 837 887 942 988Cost of sales - online subscriptions 224 - - - - - - - - - Cost of sales - software royalties & amortization 412 - - - - - - - - - Cost of product sales - software royalties, amortization & intellectual property licenses - 331 300 344 364 386 409 434 460 483Cost of subscription, licensing & other revenues - game operations & distribution costs - 851 984 998 1,055 1,118 1,184 1,256 1,334 1,399Cost of subscription licensing & other revenues - software royalties, amortization & intellectual property licenses - 471 484 520 550 583 618 655 695 730Cost of sales - intellectual property licenses 28 - - - - - - - - - Product development expense 646 958 1069 927 981 1,039 1,101 1,168 1,240 1,301Sales and marketing expense 734 1210 1378 1,335 1,412 1,496 1,585 1,681 1,785 1,873General & administrative expense 380 634 760 816 863 914 969 1,027 1,091 1,145Restructuring expense - - - - - - - - - -
Total cost & expenses 3345 5196 5708 5,645 5,972 6,323 6,702 7,109 7,547 7,918Operating income 1319 1412 1309 1,772 1,875 1,985 2,104 2,232 2,370 2,486
% of sales 28.28% 21.37% 18.65% 23.89% 23.89% 23.89% 23.89% 23.89% 23.89% 23.89%Interest & other expense (income), net 198 214 146 118 58 4 (49) (101) (157) (214)Loss on extinguishment of debt - 92 12 - - - - - - - Income before income tax expense 1121 1106 1151 1,654 1,817 1,982 2,153 2,333 2,526 2,700Income tax expense (benefit) 229 140 878 165 182 198 215 233 253 270
Net income (loss) 892$ 966$ 273$ 1,489$ 1,635$ 1,783$ 1,937$ 2,100$ 2,274$ 2,430$
Earnings per common shareBasic 1.21$ 1.30$ 0.36$ 1.97$ 2.15$ 2.34$ 2.53$ 2.73$ 2.95$ 3.14$
Weighted-averge number of shares outstandingBasic 728 740 754 757 760 763 766 769 771 774
Dividends per common share 0.23$ 0.26$ 0.30$ 0.34$ 0.38$ 0.42$ 0.46$ 0.52$ 0.57$ 0.64$

Activision Blizzard, Inc.Balance Sheet
Fiscal Years Ending Dec. 31 2015 2016 2017 2018E 2019E 2020E 2021E 2022E 2023E CV 2024E(in millions)Assets
Current assets:Cash & cash equivalents 1,823 3,245 4,713 5,537 7,306 9,109 11,021 13,106 15,405 17,905 Short-term investments 8 13 62 97 158 268 462 804 1406 2458Accounts receivable, net 679 732 918 985 1043 1104 1170 1241 1318 1382Inventories, net 128 49 46 52 55 58 62 65 69 73Software development 336 412 367 388 410 435 461 489 519 544Intellectual property licenses 30 - - - - - - - - - Deferred income taxes, net - - - - - - - - - - Other current assets 383 392 476 404 404 404 404 404 404 404
Total current assets 3,387 4,843 6,520 7,366 9,218 11,110 13,118 15,305 17,715 20,308
Cash in escrow 3,561 - - - - - - - - - Long-term investments 9 - - - - - - - - - Software development 80 54 86 91 97 102 109 115 122 128Property & equipment, net 189 258 294 274 274 283 297 313 332 349Deferred income taxes, net 275 283 459 277 305 332 361 391 424 453Other assets 173 401 440 458 484 513 543 576 612 642Intangible assets, net 482 1,858 1,106 737 527 458 447 440 435 430Trademark & trade names 433 - - - - - - - - - Goodwill 7,095 9,768 9,763 9,763 9,763 9,763 9,763 9,763 9,763 9,763
Total assets 15,251$ 17,452$ 18,668$ 18,967$ 20,667$ 22,561$ 24,637$ 26,904$ 29,403$ 32,074$ Liabilities and Shareholders' Equity
Current liabilities:Accounts payable 284 222 323 295 312 331 351 372 395 414Deferred revenues 1,702 1,628 1,929 1,933 2,045 2,166 2,295 2,434 2,585 2,712Accured expense & other liabilities 625 806 1,411 1,071 1,133 1,199 1,271 1,348 1,431 1,502Current portion of long-term debt - - - - - - - - - -
Total current liabilities 2,611 2,656 3,663 3,299 3,490 3,696 3,917 4,155 4,411 4,628Long-term debt, net 4079 4887 4390 3,818 3,815 3,872 3,973 4,121 4,347 4,692Deferred income taxes, net 10 44 21 40 44 48 52 56 61 65Other liabilities 483 746 1132 1,017 1,076 1,139 1,207 1,281 1,360 1,427
Total liabilities 7183 8333 9206 8,173 8,425 8,754 9,149 9,612 10,179 10,812
Shareholders' Equity
Common Equity 10242 10442 10747 10,847 10,948 11,048 11,148 11,249 11,349 11,450Less: Treasury stock, at cost (5,637) (5,563) (5,563) (5,563) (5,563) (5,563) (5,563) (5,563) (5,563) (5,563)Retained earnings (accumulated deficit) 4096 4869 4916 6,147 7,496 8,960 10,541 12,244 14,076 16,014Accumulated other comprehensive income (loss) (633) (629) (638) (638) (638) (638) (638) (638) (638) (638)
Total shareholders' equity 8068 9119 9462 10,794 12,242 13,807 15,488 17,292 19,224 21,262Total liabilities and shareholders' equity 15,251$ 17,452$ 18,668$ 18,967$ 20,667$ 22,561$ 24,637$ 26,904$ 29,403$ 32,074$

Activision Blizzard, Inc.Cash Flow Statement
Fiscal Years Ending Dec. 31 2015 2016 2017 2018E 2019E 2020E 2021E 2022E 2023E CV 2024E(in millions)Cash flows from operating activities:
Net income (loss) 892 966 273 1,489 1,635 1,783 1,937 2,100 2,274 2,430Adjustments to reconcile net income (loss) to net cash provided by operating activities
Depreciation & amortization 95 829 888 534 364 223 170 173 181 191Changes in operating assets and liabilities:
Accounts receivable, net (40) 84 (165) (67) (57) (61) (66) (71) (77) (65)Inventories, net (54) 32 (26) (6) (3) (3) (3) (4) (4) (3)Software development & intellectual property licenses (350) (362) (301) (26) (28) (30) (32) (35) (37) (32)Other current assets 21 (10) (97) 72 0 0 0 0 0 0Deferred income taxes - Assets - - - 182 (27) (28) (29) (30) (32) (29)Deferred income taxes - Liabilities - - - 19 4 4 4 4 5 4Deferred revenues (27) (35) 220 4 112 120 129 139 150 127Accounts payable (25) (50) 85 (28) 17 18 20 21 23 19Accured expenses & other liabilities 233 83 945 (340) 62 67 72 77 83 70
Net cash flows from operating activities 1,192 2,155 2,213 1,831 2,079 2,094 2,202 2,376 2,565 2,713
Cash flows from investing activities:Proceeds from maturities of available-for-sale investments 145 - 80 - - - - - - - Change in short-term investments 2 (5) (49) - - - - - - - Change in other assets (88) (228) (39) (18) (27) (28) (31) (33) (36) (30)Change in intangible assets, net (453) (1,376) 752 - - - - - - - Change in other liabilities 122 263 386 (115) 59 63 68 73 79 67Proceeds from auction rate securities called at par - - - - - - - - - - Proceeds from sale of available-for-sale investments - - - - - - - - - - Purchases of available-for-sale investments (145) - (135) - - - - - - - Acquisition of business, net of cash acquired (46) (4,588) - - - - - - - - Release (deposit) of cash in escrow (3,561) 3,561 - - - - - - - - Payment of contingent consideration - - - - - - - - - - Capital expenditures (111) (136) (155) (145) (154) (163) (172) (183) (194) (204)Decrease (increase) in restricted cash 2 - - - - - - - - - Other cash flows from investing activities - (14) 13 - - - - - - -
Net cash flows from investing activities (3,716) (1,177) (197) (278) (121) (128) (135) (143) (151) (167)
Cash flows from financing activites:Proceeds from issuance of common stock to employees 106 106 178 100 100 100 100 100 100 100Tax payment related to net share settlements of restricted stock rights (83) (115) (56) - - - - - - - Excess tax benefits from stock option exercises - - - - - - - - - - Dividends paid (170) (195) (226) (257) (287) (320) (356) (397) (442) (492)Excess tax benefits from stock awards 67 - - - - - - - - - Proceeds from debt issuances, net of discounts - 6,878 3,741 - - - - - - - Repayment of long-term debt (250) (6,104) (4,251) - - - - - - - Proceeds (repayment) of long-term debt - - - (572) (2) 57 101 148 226 345 Premium payment for early redemption of note - (63) - - - - - - - - Debt financing costs related to debt issuances (7) (7) - - - - - - - - Repurchase of common stock - - - - - - - - - - Proceeds from issuance of long-term debt - - - - - - - - - - Proceeds received from shareholder settlement 202 - - - - - - - - - Other financing activities - - (10) - - - - - - - Net cash flows from financing activities (135) 500 (624) (729) (189) (163) (154) (148) (115) (47)
Effect of exchange rate changes on cash & cash equivalents (366) (56) 76 - - - - - - - Net increase (decrease) in cash & cash equivalents (3,025) 1,422 1,468 824 1,769 1,803 1,912 2,085 2,299 2,500Cash & cash equivalents at beginning of period 4,848 1,823 3,245 4,713 5,537 7,306 9,109 11,021 13,106 15,405Cash & cash equivalents at end of period 1,823$ 3,245$ 4,713$ 5,537 7,306 9,109 11,021 13,106 15,405 17,905

Activision Blizzard, Inc.Income Statement
Fiscal Years Ending Dec. 31 2015 2016 2017 2018E 2019E 2020E 2021E 2022E 2023E2024E
(CV)(in millions)Net revenuesTotal net revenues 100.00% 100.00% 100.00% 100.00% 100.00% 100.00% 100.00% 100.00% 100.00% 100.00%
Growth 0.00% 0.00% 0.00% 0.00% 0.00% 0.00% 0.00% 0.00% 0.00% 0.00%Costs and expenses 0.00% 0.00% 0.00% 0.00% 0.00% 0.00% 0.00%
Cost of product sales - product costs 18.70% 11.21% 10.45% 9.50% 9.50% 9.50% 9.50% 9.50% 9.50% 9.50%Cost of sales - online subscriptions 4.80% 0.00% 0.00% 0.00% 0.00% 0.00% 0.00% 0.00% 0.00% 0.00%Cost of sales - software royalties & amortization 8.83% 0.00% 0.00% 0.00% 0.00% 0.00% 0.00% 0.00% 0.00% 0.00%Cost of product sales - software royalties, amortization & intellectual pr 0.00% 5.01% 4.28% 4.64% 4.64% 4.64% 4.64% 4.64% 4.64% 4.64%Cost of subscription, licensing & other revenues - game operations & dis 0.00% 12.88% 14.02% 13.45% 13.45% 13.45% 13.45% 13.45% 13.45% 13.45%Cost of subscription licensing & other revenues - software royalties, amortization & intellectual property licenses 0.00% 7.13% 6.90% 7.01% 7.01% 7.01% 7.01% 7.01% 7.01% 7.01%Cost of sales - intellectual property licenses 0.60% 0.00% 0.00% 0.00% 0.00% 0.00% 0.00% 0.00% 0.00% 0.00%Product development expense 13.85% 14.50% 15.23% 12.50% 12.50% 12.50% 12.50% 12.50% 12.50% 12.50%Sales and marketing expense 15.74% 18.31% 19.64% 18.00% 18.00% 18.00% 18.00% 18.00% 18.00% 18.00%General & administrative expense 8.15% 9.59% 10.83% 9.24% 10.10% 10.69% 11.25% 11.68% 12.97% 13.19%Restructuring expense 0.00% 0.00% 0.00% 0.00% 0.00% 0.00%
Total cost & expenses 71.72% 78.63% 81.35% 74.35% 75.21% 75.79% 76.36% 76.79% 78.08% 78.29%Operating income 28.28% 21.37% 18.65% 25.65% 24.79% 24.21% 23.64% 23.21% 21.92% 21.71%
Interest & other expense (income), net 4.25% 3.24% 2.08% 1.59% 0.74% 0.04% -0.55% -1.09% -1.58% -2.06%Loss on extinguishment of debt 0.00% 1.39% 0.17% 0.00% 0.00% 0.00% 0.00% 0.00% 0.00% 0.00%Income before income tax expense 24.04% 16.74% 16.40% 24.06% 24.05% 24.16% 24.20% 24.30% 23.50% 23.77%Income tax expense (benefit) 4.91% 2.12% 12.51% 2.41% 2.40% 2.42% 2.42% 2.43% 2.35% 2.38%
Net income (loss) 19.13% 14.62% 3.89% 21.65% 21.64% 21.75% 21.78% 21.87% 21.15% 21.39%

Activision Blizzard, Inc.Balance Sheet
Fiscal Years Ending Dec. 31(in millions)Assets
Current assets:Cash & cash equivalents 39.09% 49.11% 67.17% 74.65% 93.10% 109.63% 125.16% 140.32% 155.34% 172.09%Short-term investments 0.17% 0.20% 0.88% 1.31% 2.01% 3.22% 5.25% 8.61% 14.18% 23.62%Accounts receivable, net 14.56% 11.08% 13.08% 13.29% 13.29% 13.29% 13.29% 13.29% 13.29% 13.29%Inventories, net 2.74% 0.74% 0.66% 0.70% 0.70% 0.70% 0.70% 0.70% 0.70% 0.70%Software development 7.20% 6.23% 5.23% 5.23% 5.23% 5.23% 5.23% 5.23% 5.23% 5.23%Intellectual property licenses 0.64% 0.00% 0.00% 0.00% 0.00% 0.00% 0.00% 0.00% 0.00% 0.00%Deferred income taxes, net 0.00% 0.00% 0.00% 0.00% 0.00% 0.00% 0.00% 0.00% 0.00% 0.00%Other current assets 8.21% 5.93% 6.78% 5.45% 5.15% 4.87% 4.59% 4.33% 4.08% 3.89%
Total current assets 72.62% 73.29% 92.92% 99.32% 117.47% 133.71% 148.97% 163.86% 178.63% 195.19%
Cash in escrow 76.35% 0.00% 0.00% 0.00% 0.00% 0.00% 0.00% 0.00% 0.00% 0.00%Long-term investments 0.19% 0.00% 0.00% 0.00% 0.00% 0.00% 0.00% 0.00% 0.00% 0.00%Software development 1.72% 0.82% 1.23% 1.23% 1.23% 1.23% 1.23% 1.23% 1.23% 1.23%Intellectual property licenses 0.00% 0.00% 0.00% 0.00% 0.00% 0.00% 0.00% 0.00% 0.00% 0.00%Property & equipment, net 4.05% 3.90% 4.19% 3.70% 3.49% 3.41% 3.37% 3.35% 3.35% 3.36%Deferred income taxes, net 5.90% 4.28% 6.54% 3.74% 3.88% 4.00% 4.10% 4.19% 4.27% 4.35%Other assets 3.71% 6.07% 6.27% 6.17% 6.17% 6.17% 6.17% 6.17% 6.17% 6.17%Intangible assets, net 1.05% 28.12% 15.76% 9.94% 6.72% 5.51% 5.08% 4.71% 4.39% 4.13%Trademark & trade names 9.28% 0.00% 0.00% 0.00% 0.00% 0.00% 0.00% 0.00% 0.00% 0.00%Goodwill 152.12% 147.82% 139.13% 131.63% 124.42% 117.50% 110.87% 104.52% 98.45% 93.83%
Total assets 326.99% 264.10% 266.04% 255.72% 263.38% 271.53% 279.79% 288.04% 296.49% 308.27%Liabilities and Shareholders' Equity
Current liabilities:Accounts payable 6.09% 3.36% 4.60% 3.98% 3.98% 3.98% 3.98% 3.98% 3.98% 3.98%Deferred revenues 36.49% 24.64% 27.49% 26.06% 26.06% 26.06% 26.06% 26.06% 26.06% 26.06%Accured expense & other liabilities 13.40% 12.20% 20.11% 14.43% 14.43% 14.43% 14.43% 14.43% 14.43% 14.43%Current portion of long-term debt 0.00% 0.00% 0.00% 0.00% 0.00% 0.00% 0.00% 0.00% 0.00% 0.00%
Total current liabilities 55.98% 40.19% 52.20% 44.48% 44.48% 44.48% 44.48% 44.48% 44.48% 44.48%Long-term debt, net 87.46% 73.96% 62.56% 51.47% 48.62% 46.60% 45.12% 44.12% 43.84% 45.10%Deferred income taxes, net 0.21% 0.67% 0.30% 0.54% 0.56% 0.57% 0.59% 0.60% 0.61% 0.62%Other liabilities 10.36% 11.29% 16.13% 13.71% 13.71% 13.71% 13.71% 13.71% 13.71% 13.71%
Total liabilities 154.01% 126.10% 131.20% 110.20% 107.37% 105.36% 103.90% 102.91% 102.64% 103.91%
Shareholders' Equity

Activision Blizzard, Inc.Weighted Average Cost of Capital (WACC) Estimation
Cost of EquityRisk Free 3.083%Expected Market Risk Premium 4.80%Expected Market Return 7.883%Raw Beta (1Y) 0.991Market Value of Equity 52794Cost of Equity (CAPM) 7.840%
Cost of DebtPre-Tax Cost of Debt 3.6148%Market Value of Debt 5059Tax Shield on Interest Expense 10%
WACCEquity Weighting 91.26%Debt Weighting 8.74%WACC 7.44%

Activision Blizzard, Inc.Discounted Cash Flow (DCF) and Economic Profit (EP) Valuation Models
Key Inputs: CV Growth 4.92% CV ROIC 74.75% WACC 7.44% Cost of Equity 7.84%
Fiscal Years Ending Dec. 31 2018E 2019E 2020E 2021E 2022E 2023E 2024E
DCF ModelForecast PeriodNOPLAT 1,885 1,754 1,853 1,959 2,073 2,195 2,302Change in Invested Capital -540 -143 33 112 131 146 130Free Cash Flow 2,426 1,897 1,820 1,847 1,942 2,048 2,173Discount Periods 1 2 3 4 5 6 6Discount Rate 1.07 1.07 1.07 1.07 1.07 1.07 1.07Present Value of FCF 2258 1644 1468 1386 1356 1332 1413PV of Forecast Period 9443Continuing Value PeriodNOPLAT 2302FCF 2151Continuing Value 2023 85274Discount Periods 6Discount Rate 1.07Present Value of CV 55443.60
Enterprise Value 64,887
Enterprise Value to Equity ValueValue of Operations 64,887Plus: Excess Cash 1,823Plus: Short-Term Investments 62Less: Long-Term Debt (4,390)Less: PV of Operating Leases (669)Less: Other Liabilities (1,132)Less: ESOPs (889)Value of Equity 59,692Shares Outstanding 754Implied Price Per Share (t = 0) 79.167Partial-Year Adjusted Price Per Share 84.167
EP Model
Forecast PeriodEconomic Profit 1637 1546 1655 1759 1864 1976 2073Discount Periods 1 2 3 4 5 6 6Discount Rate 1.07 1.07 1.07 1.07 1.07 1.07 1.07Present Value of EP 1,523 1,339 1,335 1,320 1,302 1,285 1,348PV of Forecast Period 8,104
Continuing Value PeriodEconomic Profit 2073Discount Periods 1 2 3 4 5 6Discount Rate 1.07 1.07 1.07 1.07 1.07 1.07 1.07Continuing Value 2023 82194PV of Continuing Value 53,441
Enterprise Value 61,545Plus: Value of IC 2017 3,342Value of Operating Assets 64,887
Value of Operations 64,887Plus: Excess Cash 1,823Plus: Short-Term Investments 62Less: Long-Term Debt (4,390)Less: PV of Operating Leases (669)Less: Other Liabilities (1,132)Less: ESOPs (889)Value of Equity 59,692Shares Outstanding 754Implied Price Per Share (t = 0) 79.167Partial-Year Adjusted Price Per Share 84.167
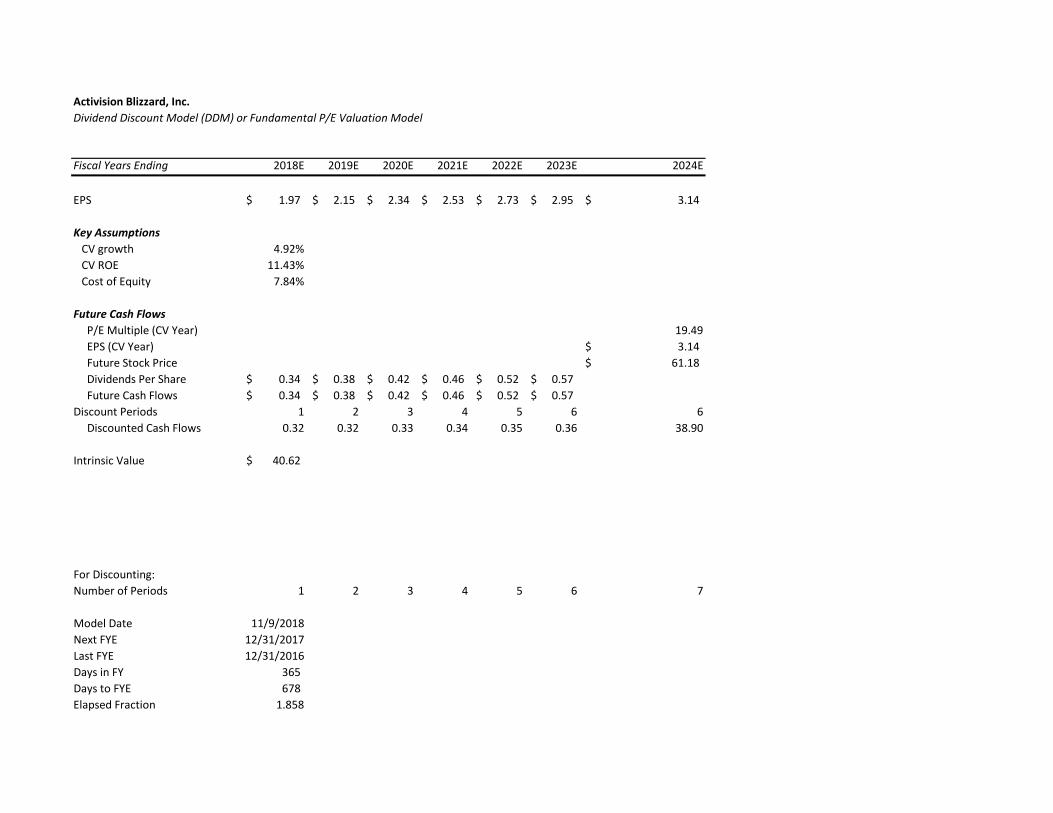
Activision Blizzard, Inc.Dividend Discount Model (DDM) or Fundamental P/E Valuation Model
Fiscal Years Ending 2018E 2019E 2020E 2021E 2022E 2023E 2024E
EPS 1.97$ 2.15$ 2.34$ 2.53$ 2.73$ 2.95$ 3.14$
Key Assumptions CV growth 4.92% CV ROE 11.43% Cost of Equity 7.84%
Future Cash Flows P/E Multiple (CV Year) 19.49 EPS (CV Year) 3.14$ Future Stock Price 61.18$ Dividends Per Share 0.34$ 0.38$ 0.42$ 0.46$ 0.52$ 0.57$ Future Cash Flows 0.34$ 0.38$ 0.42$ 0.46$ 0.52$ 0.57$ Discount Periods 1 2 3 4 5 6 6 Discounted Cash Flows 0.32 0.32 0.33 0.34 0.35 0.36 38.90
Intrinsic Value 40.62$
For Discounting:Number of Periods 1 2 3 4 5 6 7
Model Date 11/9/2018Next FYE 12/31/2017Last FYE 12/31/2016Days in FY 365 Days to FYE 678 Elapsed Fraction 1.858
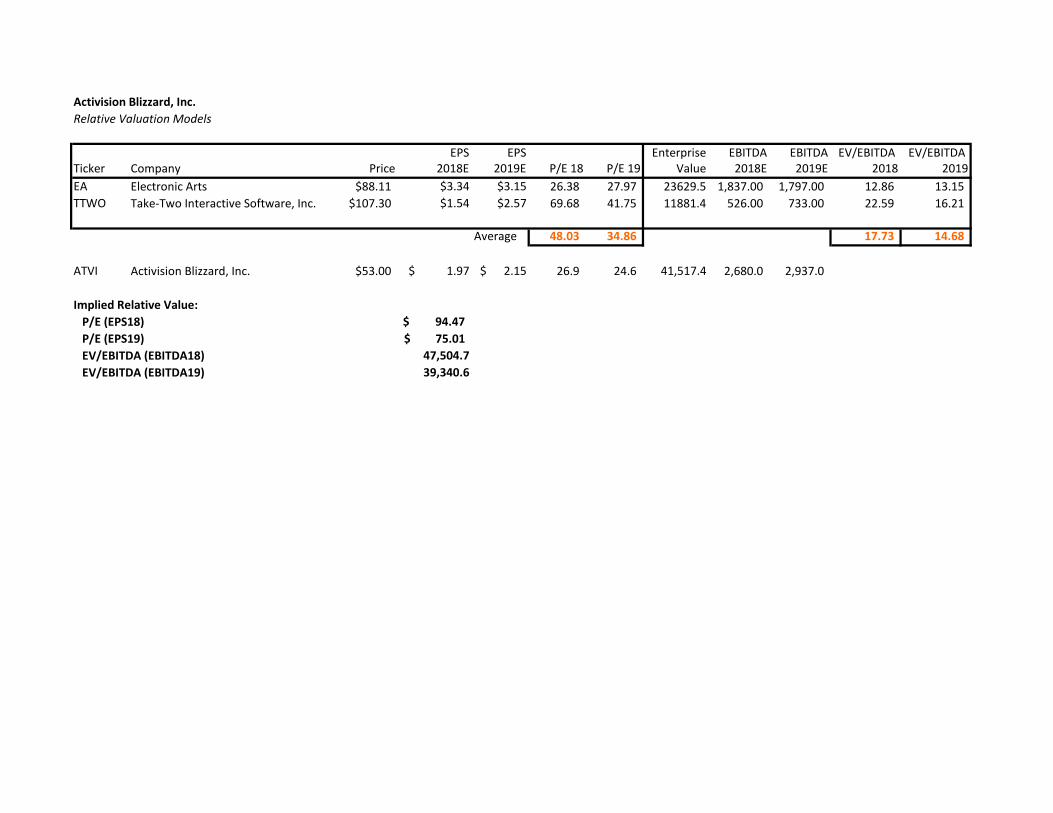
Activision Blizzard, Inc.Relative Valuation Models
EPS EPS Enterprise EBITDA EBITDA EV/EBITDA EV/EBITDA Ticker Company Price 2018E 2019E P/E 18 P/E 19 Value 2018E 2019E 2018 2019EA Electronic Arts $88.11 $3.34 $3.15 26.38 27.97 23629.5 1,837.00 1,797.00 12.86 13.15 TTWO Take-Two Interactive Software, Inc. $107.30 $1.54 $2.57 69.68 41.75 11881.4 526.00 733.00 22.59 16.21
Average 48.03 34.86 17.73 14.68
ATVI Activision Blizzard, Inc. $53.00 $ 1.97 $ 2.15 26.9 24.6 41,517.4 2,680.0 2,937.0
Implied Relative Value: P/E (EPS18) $ 94.47 P/E (EPS19) 75.01$ EV/EBITDA (EBITDA18) 47,504.7 EV/EBITDA (EBITDA19) 39,340.6

Activision Blizzard, Inc.Key Management Ratios
Fiscal Years Ending Definition 2015 2016 2017 2018E 2019E 2020E 2021E 2022E 2023E CV 2024E
Liquidity RatiosCurrent Ratio Current Assets/Current Liabilites 1.30 1.82 1.78 2.23 2.64 3.01 3.35 3.68 4.02 4.39Quick Ratio (Current Assets-Inventory)/Current Liabilities 1.25 1.80 1.77 2.22 2.63 2.99 3.33 3.67 4.00 4.37Cash Ratio (Cash+Marketable Securities)/Current Liabilities 0.70 1.23 1.30 1.71 2.14 2.54 2.93 3.35 3.81 4.40
Activity or Asset-Management RatiosReceivables Turnover Sales/Average Accounts Receiveable 6.61 8.01 7.37 7.31 7.31 7.31 7.30 7.30 7.35 15.05Days Receivables Receivables Turnover/365 55.21 45.57 49.51 49.90 49.92 49.95 49.97 49.99 49.69 24.25Total Asset Turnover Sales/Average Total Assets 0.31 0.38 0.38 0.39 0.38 0.37 0.36 0.35 0.34 0.32Financial Leverage RatiosDebt to Equity Long-term Debt/Total Shareholders Equity 50.56% 53.59% 46.40% 35.37% 31.17% 28.04% 25.65% 23.83% 22.61% 22.07%Equity Multiplier Total Shareholders Equity/Total Assets 52.90% 52.25% 50.69% 56.91% 59.23% 61.20% 62.87% 64.27% 65.38% 66.29%Debt Ratio Total Liabilities/Total Assets 47.10% 47.75% 49.31% 43.09% 40.77% 38.80% 37.13% 35.73% 34.62% 33.71%
Profitability RatiosReturn on Assets 5.85% 5.54% 1.46% 7.85% 7.91% 7.91% 7.86% 7.81% 7.73% 7.58%Return on Equity 11.06% 10.59% 2.89% 13.79% 13.35% 12.92% 12.51% 12.14% 11.83% 11.43%Profit Margin 19.13% 14.62% 3.89% 20.07% 20.84% 21.47% 22.00% 22.48% 22.93% 23.36%
Payout Policy RatiosDividend Payout Ratio 0.19 0.20 0.83 0.17 0.18 0.18 0.18 0.19 0.19 0.20

Price 84.17 4.3% 4.4% 4.5% 4.6% 4.7% 4.8% 4.9% 5.0% 5.1% 5.2% 5.3%0.5 $1,545.52 $1,171.79 $943.31 $789.19 $678.21 $594.47 $529.05 $476.52 $433.42 $397.41 $366.880.6 $411.08 $372.61 $340.67 $313.73 $290.69 $270.77 $253.37 $238.04 $224.43 $212.28 $201.350.7 $235.66 $220.23 $206.67 $194.66 $183.94 $174.32 $165.63 $157.76 $150.58 $144.01 $137.970.8 $164.46 $155.64 $147.69 $140.50 $133.95 $127.98 $122.50 $117.45 $112.80 $108.48 $104.470.9 $125.87 $119.92 $114.50 $109.53 $104.96 $100.74 $96.84 $93.21 $89.84 $86.69 $83.75
Beta 1.0 $103.45 $98.95 $94.81 $90.99 $87.45 $84.17 $81.11 $78.26 $75.59 $73.08 $70.731.1 $85.03 $81.59 $78.40 $75.43 $72.68 $70.10 $67.70 $65.44 $63.32 $61.32 $59.441.2 $72.92 $70.10 $67.48 $65.04 $62.76 $60.63 $58.62 $56.74 $54.96 $53.29 $51.701.3 $63.70 $61.32 $59.11 $57.04 $55.11 $53.29 $51.58 $49.96 $48.44 $47.00 $45.631.4 $56.44 $54.39 $52.48 $50.69 $49.01 $47.43 $45.94 $44.53 $43.20 $41.94 $40.741.5 $50.57 $48.78 $47.10 $45.53 $44.05 $42.65 $41.33 $40.08 $38.90 $37.78 $36.71
Price 84.17 4.6% 4.7% 4.8% 4.9% 5.0% 5.1% 5.2% 5.3% 5.4% 5.5% 6.0%50% $73.50 $75.82 $78.30 $80.98 $83.89 $85.71 $90.47 $94.22 $98.34 $102.89 $135.0955% $74.13 $76.47 $79.00 $81.72 $84.67 $86.53 $91.36 $95.17 $99.36 $103.98 $136.6960% $74.64 $77.02 $79.58 $82.34 $85.33 $87.21 $92.10 $95.96 $100.20 $104.88 $138.0365% $75.08 $77.49 $80.07 $82.86 $85.88 $87.78 $92.73 $96.63 $100.92 $105.65 $139.1670% $75.46 $77.89 $80.50 $83.31 $86.36 $88.27 $93.27 $97.21 $101.54 $106.31 $140.12
CV ROIC 75% $75.78 $78.23 $80.86 $83.69 $86.76 $88.70 $93.73 $97.70 $102.06 $106.87 $140.9580% $76.07 $78.53 $81.18 $84.04 $87.13 $89.08 $94.14 $98.14 $102.53 $107.38 $141.7085% $76.32 $78.80 $81.46 $84.34 $87.45 $89.41 $94.51 $98.53 $102.94 $107.82 $142.3490% $76.54 $79.04 $81.71 $84.60 $87.73 $89.70 $94.83 $98.87 $103.31 $108.21 $142.9295% $76.74 $79.25 $81.94 $84.84 $87.99 $89.96 $95.11 $99.18 $103.64 $108.56 $143.43
100% $76.92 $79.44 $82.14 $85.06 $88.21 $90.20 $95.37 $99.45 $103.93 $108.87 $143.90
Price 84.17 4.6% 4.7% 4.8% 4.9% 5.0% 5.1% 5.2% 5.3% 5.4% 5.5% 6.0%6.2% $140.14 $148.90 $158.93 $170.51 $184.04 $193.13 $219.29 $242.86 $272.39 $310.49 $1,102.496.4% $120.26 $126.63 $133.78 $141.85 $151.05 $157.10 $173.90 $188.34 $205.54 $226.41 $473.036.7% $105.13 $109.95 $115.28 $121.20 $127.83 $132.11 $143.75 $153.42 $164.60 $177.66 $299.706.9% $93.24 $96.99 $101.10 $105.61 $110.59 $113.77 $122.25 $129.15 $136.95 $145.83 $218.567.2% $83.64 $86.64 $89.89 $93.43 $97.28 $99.73 $106.16 $111.30 $117.02 $123.42 $171.51
WACC 7.4% $75.77 $78.21 $80.84 $83.68 $86.75 $88.68 $93.71 $97.68 $102.04 $106.85 $140.927.7% $69.10 $71.12 $73.29 $75.60 $78.09 $79.64 $83.66 $86.80 $90.21 $93.94 $119.167.9% $63.47 $65.16 $66.96 $68.89 $70.94 $72.22 $75.49 $78.03 $80.77 $83.73 $103.108.2% $58.61 $60.05 $61.58 $63.19 $64.91 $65.97 $68.69 $70.78 $73.01 $75.41 $90.718.4% $54.39 $55.63 $56.93 $58.30 $59.76 $60.65 $62.93 $64.68 $66.53 $68.51 $80.868.7% $50.69 $51.75 $52.88 $54.06 $55.30 $56.07 $58.00 $59.47 $61.03 $62.69 $72.83
Price 84.17 0.5% 0.6% 0.7% 0.8% 0.9% 1.0% 1.1% 1.2% 1.3% 1.4% 1.5%6.19% $155.36 $158.47 $161.74 $165.17 $168.78 $172.58 $176.57 $180.79 $185.25 $189.97 $194.966.44% $131.04 $133.28 $135.62 $138.06 $140.61 $143.28 $146.06 $148.98 $152.04 $155.25 $158.626.69% $113.08 $114.78 $116.54 $118.36 $120.26 $122.24 $124.29 $126.43 $128.66 $130.98 $133.416.94% $99.29 $100.62 $101.99 $103.40 $104.87 $106.39 $107.97 $109.60 $111.30 $113.06 $114.897.19% $88.36 $89.42 $90.52 $91.66 $92.82 $94.03 $95.28 $96.57 $97.91 $99.29 $100.72
WACC 7.44% $79.53 $80.40 $81.30 $82.23 $83.18 $84.17 $85.18 $86.23 $87.31 $88.42 $89.577.69% $72.13 $72.87 $73.62 $74.39 $75.18 $76.00 $76.83 $77.70 $78.59 $79.50 $80.447.94% $65.95 $66.57 $67.20 $67.86 $68.53 $69.21 $69.92 $70.64 $71.39 $72.16 $72.948.19% $60.67 $61.20 $61.75 $62.31 $62.88 $63.47 $64.07 $64.69 $65.32 $65.97 $66.648.44% $56.11 $56.57 $57.05 $57.53 $58.03 $58.53 $59.05 $59.59 $60.13 $60.69 $61.278.69% $52.13 $52.54 $52.95 $53.38 $53.81 $54.26 $54.71 $55.17 $55.65 $56.13 $56.63
Price 84.17 6.25% 6.50% 6.75% 7.00% 7.25% 7.50% 7.75% 8.00% 8.25% 8.50% 8.75%6.19% $159.19 $161.73 $164.33 $167.01 $169.75 $172.58 $175.48 $178.46 $181.53 $184.68 $187.936.44% $133.39 $135.28 $137.21 $139.18 $141.20 $143.28 $145.40 $147.57 $149.80 $152.08 $154.426.69% $114.57 $116.04 $117.54 $119.07 $120.63 $122.24 $123.87 $125.54 $127.25 $128.99 $130.786.94% $100.22 $101.41 $102.62 $103.85 $105.11 $106.39 $107.70 $109.04 $110.40 $111.79 $113.207.19% $88.93 $89.92 $90.92 $91.94 $92.98 $94.03 $95.11 $96.21 $97.33 $98.46 $99.63
WACC 7.44% $79.86 $80.69 $81.54 $82.40 $83.28 $84.17 $85.07 $86.00 $86.94 $87.90 $88.877.69% $72.30 $73.01 $73.74 $74.48 $75.23 $76.00 $76.77 $77.56 $78.37 $79.18 $80.017.94% $65.99 $66.61 $67.25 $67.89 $68.55 $69.21 $69.89 $70.58 $71.27 $71.98 $72.708.19% $60.63 $61.18 $61.74 $62.30 $62.88 $63.47 $64.06 $64.67 $65.28 $65.90 $66.538.44% $56.00 $56.50 $56.99 $57.50 $58.01 $58.53 $59.06 $59.60 $60.15 $60.70 $61.268.69% $51.98 $52.42 $52.87 $53.33 $53.79 $54.26 $54.73 $55.21 $55.70 $56.19 $56.70
Price 84.17 10.0% 10.5% 11.0% 11.5% 12.0% 12.5% 13.0% 13.5% 14.0% 14.5% 15.0%6.19% $191.72 $187.89 $184.06 $180.23 $176.40 $172.58 $168.75 $164.92 $161.09 $157.26 $153.436.44% $159.27 $156.07 $152.87 $149.67 $146.47 $143.28 $140.08 $136.88 $133.68 $130.48 $127.296.69% $135.96 $133.22 $130.47 $127.73 $124.98 $122.24 $119.49 $116.74 $114.00 $111.25 $108.516.94% $118.42 $116.01 $113.61 $111.20 $108.80 $106.39 $103.99 $101.58 $99.18 $96.77 $94.377.19% $104.73 $102.59 $100.45 $98.31 $96.17 $94.03 $91.89 $89.76 $87.62 $85.48 $83.34
WACC 7.44% $93.80 $91.87 $89.95 $88.02 $86.09 $84.17 $82.24 $80.31 $78.39 $76.46 $74.537.69% $84.75 $83.00 $81.25 $79.50 $77.75 $76.00 $74.24 $72.49 $70.74 $68.99 $67.247.94% $77.24 $75.63 $74.03 $72.42 $70.82 $69.21 $67.61 $66.00 $64.40 $62.79 $61.198.19% $70.87 $69.39 $67.91 $66.43 $64.95 $63.47 $61.98 $60.50 $59.02 $57.54 $56.068.44% $65.41 $64.04 $62.66 $61.29 $59.91 $58.53 $57.16 $55.78 $54.41 $53.03 $51.668.69% $60.67 $59.39 $58.11 $56.82 $55.54 $54.26 $52.97 $51.69 $50.40 $49.12 $47.84
Growth of Activision Monthly Active Users
Growth of Blizzard Monthly Active Users
Equity Risk Premium
CV Growth
CV Growth
Product Development Expense % of Sales

Present Value of Operating Lease Obligations (2017) Present Value of Operating Lease Obligations (2016) Present Value of Operating Lease Obligations (2015)
Operating Operating OperatingFiscal Years Ending Dec. 31 Leases Fiscal Years Ending Dec. 31 Leases Fiscal Years Ending Leases2017 314 2016 253 2016 2612018 234 2017 90 2017 362019 53 2018 45 2018 312020 44 2019 27 2019 262021 32 2020 19 2020 24Thereafter 92 Thereafter 37 Thereafter 25Total Minimum Payments 769 Total Minimum Payments 471 Total Minimum Payments 403Less: Interest 100 Less: Interest 53 Less: Interest 43PV of Minimum Payments 669 PV of Minimum Payments 418 PV of Minimum Payments 360
Capitalization of Operating Leases Capitalization of Operating Leases Capitalization of Operating Leases
Pre-Tax Cost of Debt 6.00% Pre-Tax Cost of Debt 6.00% Pre-Tax Cost of Debt 6.00%Number Years Implied by Year 6 Payment 2.9 Number Years Implied by Year 6 Payment 1.9 Number Years Implied by Year 6 Payment 1.0
Lease PV Lease Lease PV Lease Lease PV LeaseYear Commitment Payment Year Commitment Payment Year Commitment Payment1 314 296.2 1 253 238.7 1 261 246.22 234 208.3 2 90 80.1 2 36 32.03 53 44.5 3 45 37.8 3 31 26.04 44 34.9 4 27 21.4 4 26 20.65 32 23.9 5 19 14.2 5 24 17.96 & beyond 32 61.5 6 & beyond 19 25.4 6 & beyond 24 17.6PV of Minimum Payments 669.2 PV of Minimum Payments 417.5 PV of Minimum Payments 360.4