Embed Size (px)
Citation preview
First Quarter Results 2012
24 April 2012

Safe harbor
Non-GAAP measures and management estimatesThis financial report contains a number of non-GAAP figures, such as EBITDA and free cash flow. These non-GAAP figures should not be viewed as a substitute for KPN’s GAAP figures. KPN defines EBITDA as operating result before depreciation and impairments of PP&E and amortization and impairments of intangible assets. Note that KPN’s definition of EBITDA deviates from the literal definition of earnings before interest, taxes,depreciation and amortization and should not be considered in isolation or as a substitute for analyses of the results as reported under IFRS. In the net debt / EBITDA ratio, KPN defines EBITDA as a 12 month rolling total excluding book gains, release of pension provisions and restructuring costs, when over € 20m. Free cash flow is defined as cash flow from operating activities plus proceeds from real estate, minus capital expenditures (Capex), being expenditures on PP&E and software and excluding tax recapture regarding E-Plus.Underlying revenues and other income and underlying EBITDA are derived from revenues and other income and EBITDA, respectively, and are adjusted for the impact of MTA and roaming (regulation), changes in the composition of the group (acquisitions and disposals), restructuring costs and incidentals.The term service revenues refers to wireless service revenues.All market share information in this financial report is based on management estimates based on externally available information, unless indicated otherwise. For a full overview on KPN’s non-financial information, reference is made to KPN’s quarterly factsheets available on www.kpn.com/ir
Forward-looking statementsCertain statements contained in this financial report constitute forward-looking statements. These statements may include, without limitation, statements concerning future results of operations, the impact of regulatory initiatives on KPN’s operations, KPN’s and its joint ventures' share of new and existing markets, general industry and macro-economic trends and KPN’s performance relative thereto and statements preceded by, followed by or including the words “believes”, “expects”, “anticipates” or similar expressions.These forward-looking statements rely on a number of assumptions concerning future events and are subject to uncertainties and other factors, many of which are outside KPN’s control that could cause actual results to differ materially from such statements. A number of these factors are described (not exhaustively) in the Annual Report 2011.
2
3
Contents
1 Chairman’s review Eelco Blok
2 Group financial review Eric Hageman
3 Group operating review Eelco Blok
4 Concluding remarks Eelco Blok

Highlights Q1 ’12Transition year on track
• Financial results according to plan in first quarter of transition year
• EBITDA and FCF impacted by phasing and accelerated investments in The Netherlands
• Further improving Dutch mobile propositions and expanding distribution
• Increasing TV market share and start of regionalization Consumer Residential
• Revenue growth at good EBITDA margin in Germany, strong underlying growth in Belgium
• Confirming outlook
• 2011 dividend of € 0.85 approved by AGM, final dividend of € 0.57 paid today
4
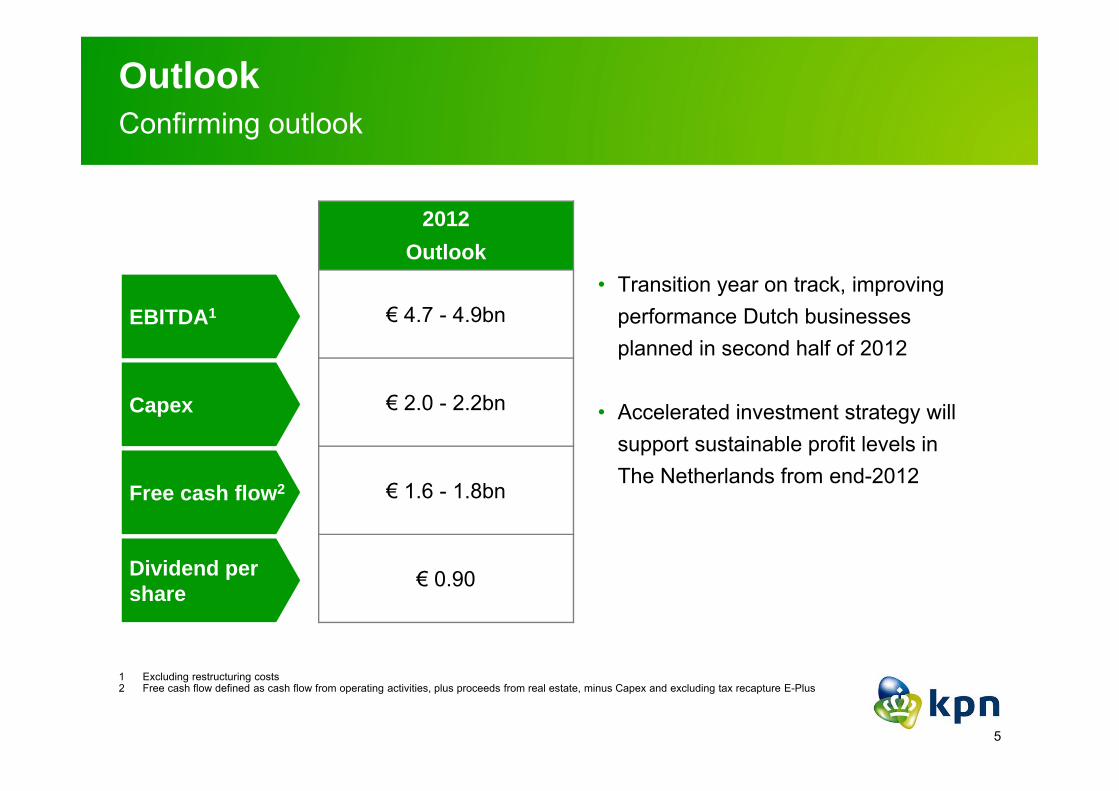
OutlookConfirming outlook
• Transition year on track, improving performance Dutch businesses planned in second half of 2012
• Accelerated investment strategy will support sustainable profit levels in The Netherlands from end-2012
5
2012 Outlook
€ 4.7 - 4.9bn
€ 2.0 - 2.2bn
€ 1.6 - 1.8bn
€ 0.90
Capex
Free cash flow2
Dividend per share
1 Excluding restructuring costs 2 Free cash flow defined as cash flow from operating activities, plus proceeds from real estate, minus Capex and excluding tax recapture E-Plus
EBITDA1
6
Contents
1 Chairman’s review Eelco Blok
2 Group financial review Eric Hageman
3 Group operating review Eelco Blok
4 Concluding remarks Eelco Blok
Group results Q1 ’12
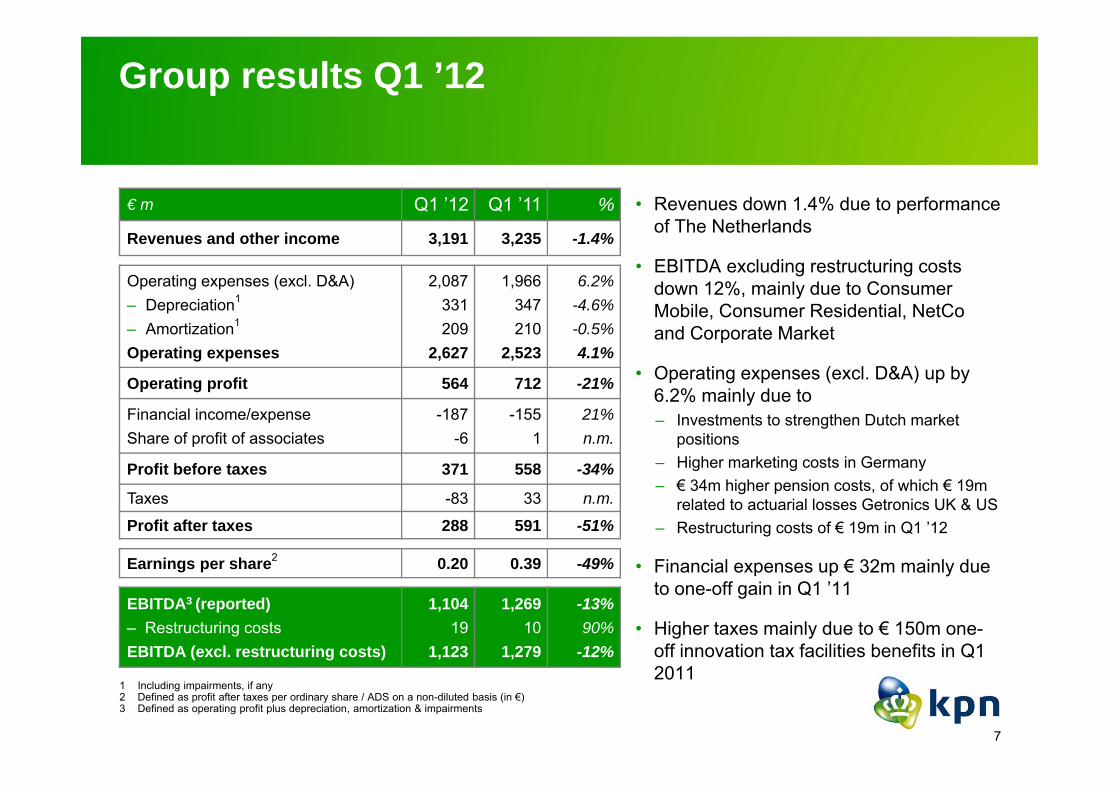
• Revenues down 1.4% due to performance of The Netherlands
• EBITDA excluding restructuring costs down 12%, mainly due to Consumer Mobile, Consumer Residential, NetCo and Corporate Market
• Operating expenses (excl. D&A) up by 6.2% mainly due to‒ Investments to strengthen Dutch market
positions‒ Higher marketing costs in Germany‒ € 34m higher pension costs, of which € 19m
related to actuarial losses Getronics UK & US‒ Restructuring costs of € 19m in Q1 ’12
• Financial expenses up € 32m mainly due to one-off gain in Q1 ’11
• Higher taxes mainly due to € 150m one-off innovation tax facilities benefits in Q1 2011
7
€ m Q1 ’12 Q1 ’11 %
Revenues and other income 3,191 3,235 -1.4%
Operating expenses (excl. D&A)– Depreciation1
– Amortization1
Operating expenses
2,087331209
2,627
1,966347210
2,523
6.2%-4.6%-0.5%4.1%
Operating profit 564 712 -21%
Financial income/expenseShare of profit of associates
-187-6
-1551
21%n.m.
Profit before taxes 371 558 -34%
Taxes -83 33 n.m.
Profit after taxes 288 591 -51%
Earnings per share2 0.20 0.39 -49%
EBITDA3 (reported)‒ Restructuring costsEBITDA (excl. restructuring costs)
1,10419
1,123
1,26910
1,279
-13%90%
-12%
1 Including impairments, if any2 Defined as profit after taxes per ordinary share / ADS on a non-diluted basis (in €)3 Defined as operating profit plus depreciation, amortization & impairments
Group cash flow Q1 ’12
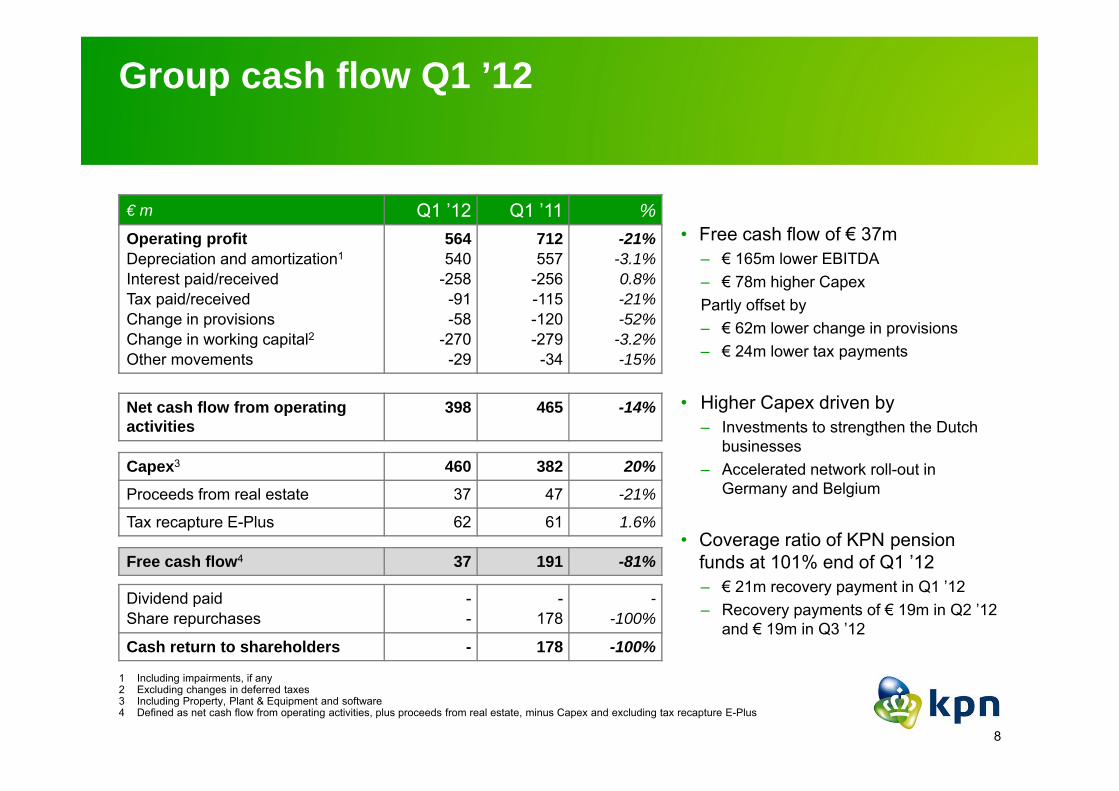
• Free cash flow of € 37m‒ € 165m lower EBITDA‒ € 78m higher CapexPartly offset by‒ € 62m lower change in provisions‒ € 24m lower tax payments
• Higher Capex driven by‒ Investments to strengthen the Dutch
businesses‒ Accelerated network roll-out in
Germany and Belgium
• Coverage ratio of KPN pension funds at 101% end of Q1 ’12‒ € 21m recovery payment in Q1 ’12 ‒ Recovery payments of € 19m in Q2 ’12
and € 19m in Q3 ’12
8
€ m Q1 ’12 Q1 ’11 %Operating profitDepreciation and amortization1
Interest paid/receivedTax paid/receivedChange in provisionsChange in working capital2Other movements
564540
-258-91-58
-270-29
712557
-256-115-120-279-34
-21%-3.1%0.8%-21%-52%
-3.2%-15%
Net cash flow from operating activities
398 465 -14%
Capex3 460 382 20%
Proceeds from real estate 37 47 -21%
Tax recapture E-Plus 62 61 1.6%
Free cash flow4 37 191 -81%
Dividend paidShare repurchases
--
-178
--100%
Cash return to shareholders - 178 -100%
1 Including impairments, if any2 Excluding changes in deferred taxes3 Including Property, Plant & Equipment and software 4 Defined as net cash flow from operating activities, plus proceeds from real estate, minus Capex and excluding tax recapture E-Plus
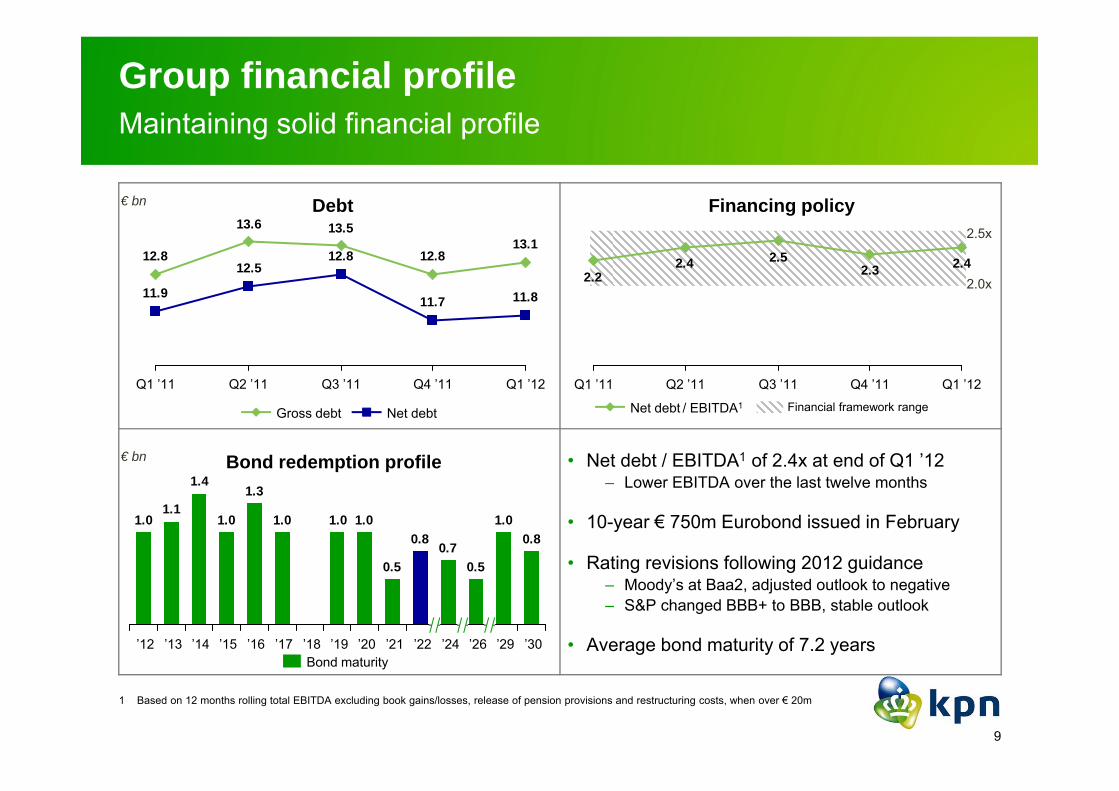
Group financial profileMaintaining solid financial profile
• Net debt / EBITDA1 of 2.4x at end of Q1 ’12 – Lower EBITDA over the last twelve months
• 10-year € 750m Eurobond issued in February
• Rating revisions following 2012 guidance– Moody’s at Baa2, adjusted outlook to negative – S&P changed BBB+ to BBB, stable outlook
• Average bond maturity of 7.2 years
9
Bond redemption profile€ bn
13.112.8
13.513.6
12.8
11.811.7
12.812.5
11.9
Q1 ’11 Q2 ’11 Q1 ’12Q4 ’11Q3 ’11
Net debtGross debt
Debt€ bn
0.81.0
0.50.70.8
0.5
1.01.01.0
1.3
1.0
1.4
1.11.0
’24 ’29 ’30’26’22’21’20’19’18’17’16’15’14’13’12Bond maturity
2.42.32.52.4
2.2
Q3 ’11Q2 ’11Q1 ’11 Q1 ’12Q4 ’11
Net debt / EBITDA1
Financing policy
2.0x
2.5x
Financial framework range
1 Based on 12 months rolling total EBITDA excluding book gains/losses, release of pension provisions and restructuring costs, when over € 20m

Financial review – Dutch Telco
• Revenues and other income down 4.6% y-on-y
– Regulatory impact of € 24m (1.4%)– Lower revenues mainly in Consumer Mobile,
Consumer Residential and NetCo
• EBITDA excluding restructuring costs down 12% y-on-y
– € 78m lower revenues– Regulatory impact of € 7m (0.8%)– € 7m net positive impact from incidentals
• EBITDA margin excluding restructuring costs in Q1 at 48.8% impacted by
– Investments to strengthen domestic market positions
– Decline of traditional high margin services
10
-4.6%
Q1 ’12
1,626
Q4 ’11
1,704
Q3 ’11
1,651
Q2 ’11
1,705
Q1 ’11
1,704
Revenues and other income€ m
781
48.8%
Q4 ’11
866
852
50.8%
Q3 ’11
882
880
53.4%
Q2 ’11
892
892
52.3%
Q1 ’11
898
897
52.7%
-12%
Q1 ’12
794
EBITDA and EBITDA margin€ m
EBITDA margin (excl. restructuring costs) EBITDARestructuring costs

Financial review – Dutch Telco (cont’d)
11
49 46 47 50 49
120 130 120 145 144
3.3%
Q1 ’12
833
79-17
337
241
Q4 ’11
837
82-18
338
240
Q3 ’11
767
75-15
336
204
Q2 ’11
811
75-16
350
226
Q1 ’11
806
72-15
351
229
Intercompany
Other operating expenses
Own work capitalized
Work contracted out and other expenses
Cost of materials
Employee benefits
• Operating expenses (excluding D&A and restructuring costs) up 3.3% y-on-y driven by investments to strengthen Dutch market positions
– Employee benefits up € 12m (higher expenses per FTE including pensions and increased number of customer facing staff)
– Cost of materials up € 24m (e.g. high end handsets)– Work contracted out € 14m lower (lower traffic costs
partly offset by higher TV content costs, distribution commissions, marketing and additional shops)
• Improvements in underlying cost structure planned, main cost savings related to
– Outsourcing, off-shoring and efficiency resulting in FTE reduction
– Announced FTE reduction program accelerated by 2 years, completion expected by end 2013
Breakdown operating expenses(excl. D&A and restructuring costs)
€ m
Financial review – Dutch Telco by segment
12
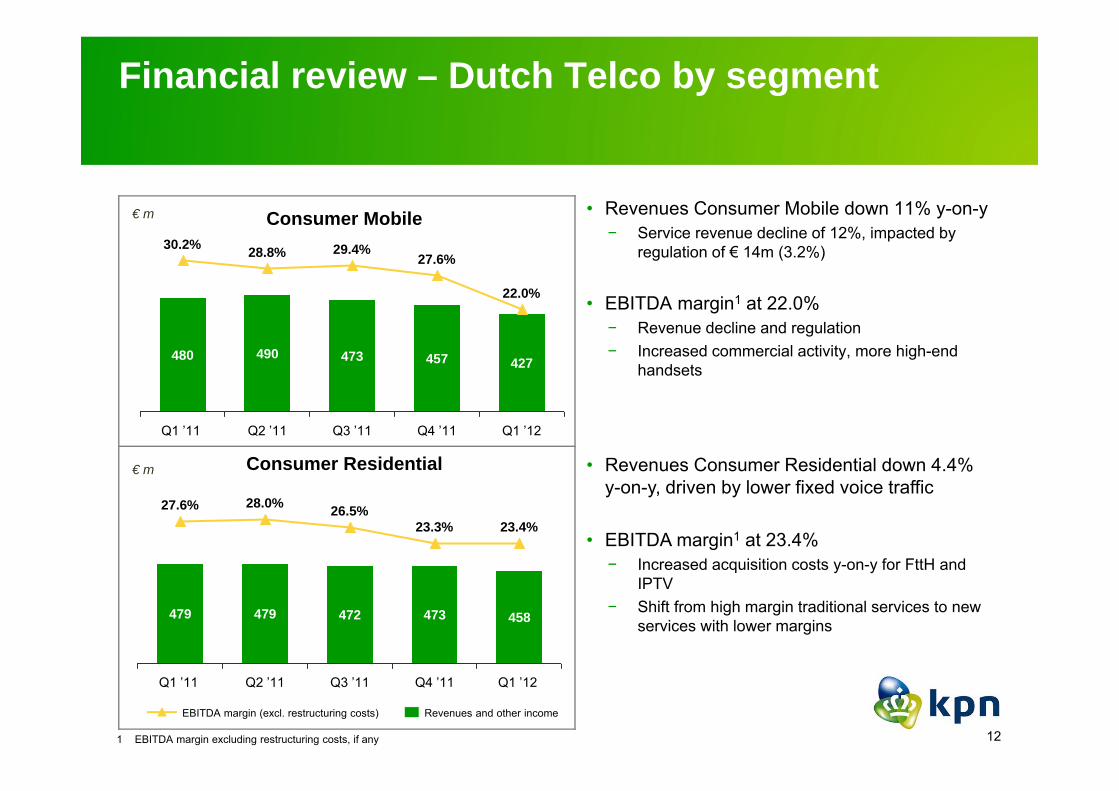
Q1 ’12
458
23.4%
Q4 ’11
473
23.3%
Q3 ’11
472
26.5%
Q2 ’11
479
28.0%
Q1 ’11
479
27.6%
Q1 ’12
427
22.0%
Q4 ’11
457
27.6%
Q3 ’11
473
29.4%
Q2 ’11
490
28.8%
Q1 ’11
480
30.2%
Consumer Mobile
Consumer Residential
• Revenues Consumer Mobile down 11% y-on-y − Service revenue decline of 12%, impacted by
regulation of € 14m (3.2%)
• EBITDA margin1 at 22.0% − Revenue decline and regulation − Increased commercial activity, more high-end
handsets
• Revenues Consumer Residential down 4.4% y-on-y, driven by lower fixed voice traffic
• EBITDA margin1 at 23.4% − Increased acquisition costs y-on-y for FttH and
IPTV− Shift from high margin traditional services to new
services with lower margins
Revenues and other incomeEBITDA margin (excl. restructuring costs)
1 EBITDA margin excluding restructuring costs, if any
€ m
€ m

Financial review – Dutch Telco by segment (cont’d)
13
Q1 ’12
598
34.8%
Q4 ’11
604
30.1%
Q3 ’11
600
35.0%
Q2 ’11
615
32.8%
Q1 ’11
614
31.8%
Q1 ’12
664
58.3%
Q4 ’11
734
61.6%
Q3 ’11
664
62.0%
Q2 ’11
684
61.7%
Q1 ’11
698
61.3%
Business
NetCo
• Revenues Business down by 2.6% y-on-y− Regulatory impact € 5m (1.0%)− Traditional services decline and price pressure
partly offset by good performance wireless data
• EBITDA margin1 higher y-on-y at 34.8%− Supported by number of smaller incidentals− Good progress restructuring program, € 11m
provision taken in Q1
• Revenues NetCo down by 4.9% y-on-y− Lower traffic Consumer Mobile, Consumer
Residential and Business− Line loss due to decline traditional services
• EBITDA margin1 lower y-on-y at 58.3%− Net positive impact incidentals € 7m− Lower revenues of € 34m− Higher costs related to the uptake of FttH
activations
Revenues and other incomeEBITDA margin (excl. restructuring costs)
1 EBITDA margin excluding restructuring costs, if any
€ m
€ m

Financial review – Corporate Market & iBasis
14
Q1 ’12
428
1.6%
Q4 ’11
499
9.6%
Q3 ’11
424
6.1%
Q2 ’11
439
5.0%
Q1 ’11
449
8.0%
Q1 ’11
226
3.1%
4.1%
Q1 ’12
255
2.7%
Q4 ’11
249
2.8%
Q3 ’11
256
2.7%
Q2 ’11
246
EBITDA margin (excl. restructuring costs) Revenues and other income
Corporate Market
iBasis
• Revenues Corporate Market down 4.7% y-on-y− Continued price pressure− Clients postponing investments in IT
• EBITDA margin2 at 1.6% in Q1− Supported by € 10m positive incidental− Lower revenues − Increasing pressure on gross margins
• Revenues iBasis up 13% y-on-y − Including ~2.4% positive currency effect
• EBITDA margin relatively stable at 2.7%
1 EBITDA margin excluding impact Getronics International classification as asset held for sale 2 EBITDA margin excluding restructuring costs, if any
1€ m
€ m
Financial review – Mobile International by segment
15
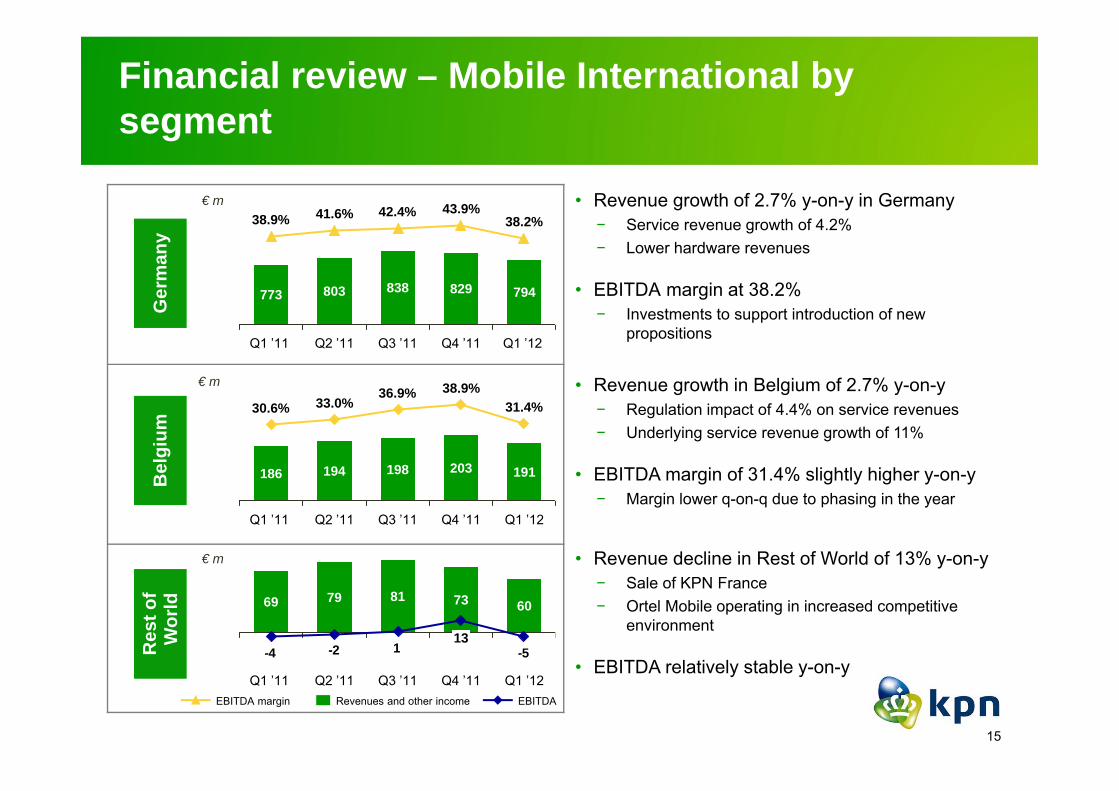
• Revenue growth of 2.7% y-on-y in Germany− Service revenue growth of 4.2% − Lower hardware revenues
• EBITDA margin at 38.2%− Investments to support introduction of new
propositions
• Revenue growth in Belgium of 2.7% y-on-y− Regulation impact of 4.4% on service revenues − Underlying service revenue growth of 11%
• EBITDA margin of 31.4% slightly higher y-on-y− Margin lower q-on-q due to phasing in the year
€ m
€ m
€ m
Q1 ’11
773
38.9%
Q1 ’12
794
38.2%
Q4 ’11
829
43.9%
Q3 ’11
838
42.4%
Q2 ’11
803
41.6%
Q1 ’12
191
31.4%
Q4 ’11
203
38.9%
Q3 ’11
198
36.9%
Q2 ’11
194
33.0%
Q1 ’11
186
30.6%
-51-2-4
Q1 ’12
60
Q4 ’11
73
13
Q3 ’11
81
Q2 ’11
79
Q1 ’11
69
Revenues and other incomeEBITDA margin EBITDA
Res
t of
Wor
ldG
erm
any
Bel
gium
• Revenue decline in Rest of World of 13% y-on-y− Sale of KPN France− Ortel Mobile operating in increased competitive
environment
• EBITDA relatively stable y-on-y

16
Contents
1 Chairman’s review Eelco Blok
2 Group financial review Eric Hageman
3 Group operating review Eelco Blok
4 Concluding remarks Eelco Blok
17
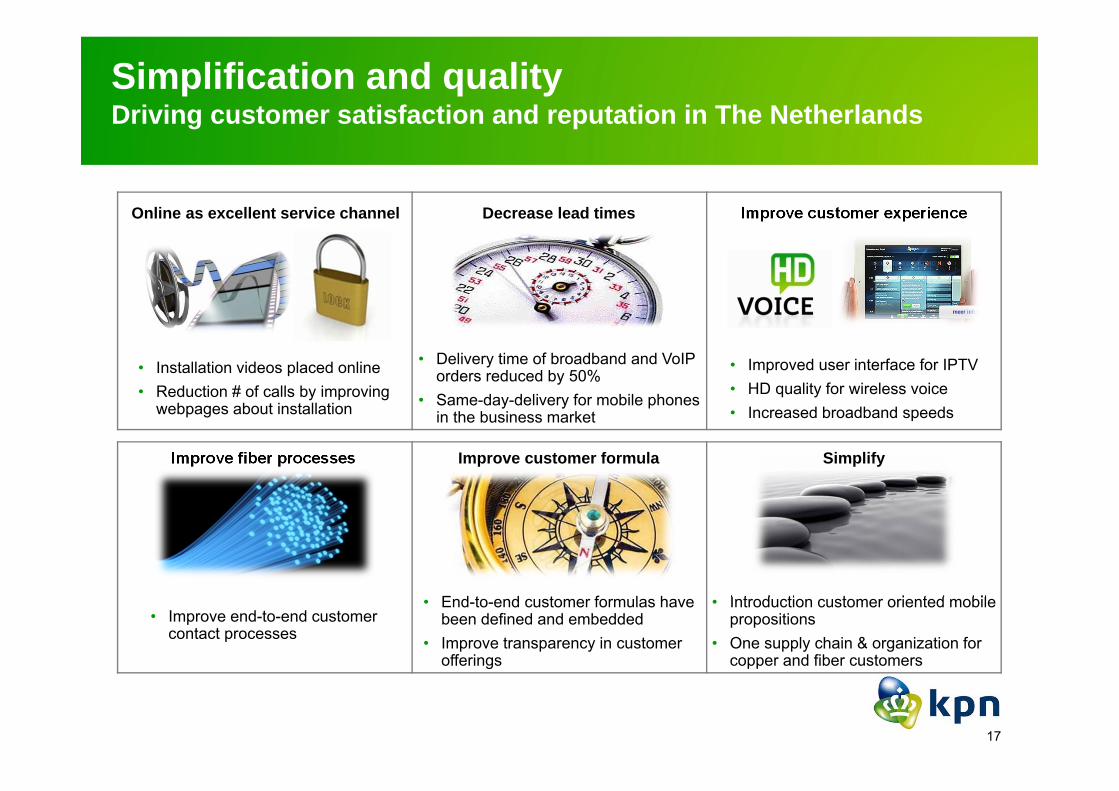
Simplification and qualityDriving customer satisfaction and reputation in The Netherlands
• Installation videos placed online• Reduction # of calls by improving
webpages about installation
• Introduction customer oriented mobile propositions
• One supply chain & organization forcopper and fiber customers
• Improve end-to-end customer contact processes
Improve fiber processes
Improve customer experienceOnline as excellent service channel
Simplify
• Delivery time of broadband and VoIP orders reduced by 50%
• Same-day-delivery for mobile phones in the business market
Decrease lead times
• End-to-end customer formulas have been defined and embedded
• Improve transparency in customer offerings
Improve customer formula
• Improved user interface for IPTV• HD quality for wireless voice• Increased broadband speeds

Product developmentsInnovation in portfolio and customer service
18
Business / Corporate Market• Cloud services
• Future proof integrated mobile propositions
• Next steps in improving services− SME reachability scan− Equipment delivery times
reduced
• Joint portfolio management Business and Corporate Market
Consumer Mobile• Launch new mobile propositions
− Hi: unlimited messaging− Telfort: calling for free
after 10 minutes
• Strategic partnerships key retailers
• Easy to use KPN smartphone− Android based− MB-metering
• Enhanced value added services
Consumer Residential• Enriched triple play propositions
− Increased broadband speed
• IPTV upgrades− New user interface and low
cost set top box− HD channels in standard
IPTV proposition− HBO channels added
• Bundle for fixed to mobile calls
First KPN full service concept store introduced (XL store)• Purchase, advice and product service available in one store
• Broad portfolio (Consumer Mobile, Residential and Business products and services)
Operating review – Consumer Mobile
19
% committed postpaid retail ARPU
3436373938
Q1 ’12Q4 ’11Q3 ’11Q2 ’11Q1 ’11
~54% ~55% ~59%
Q1 ’12
387
345
45%
Q4 ’11
406
364
44%
Q3 ’11
430
386
45%
Q2 ’11
446
397
46%
Q1 ’11
442
388
47%
RetailWholesaleTotal market share NL2
~62%
Serv
ice
reve
nues
1N
et a
dds1
Post
paid
reta
il A
RPU ~65%
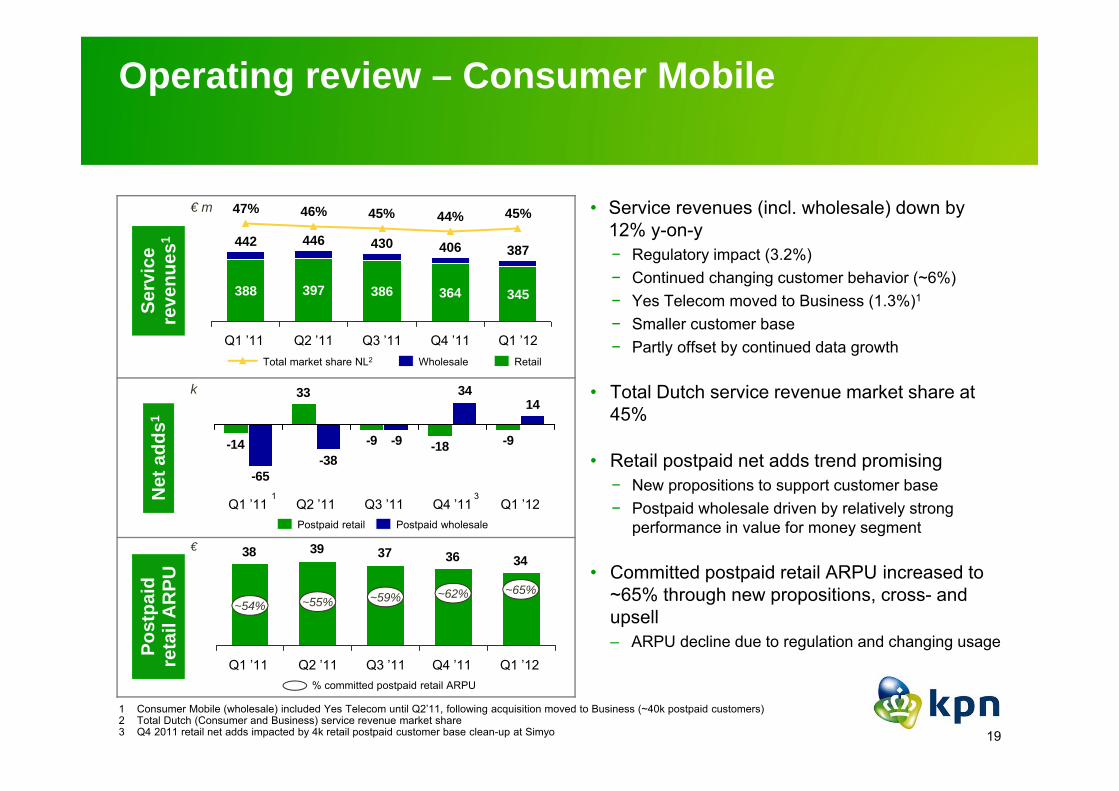
• Service revenues (incl. wholesale) down by 12% y-on-y− Regulatory impact (3.2%)− Continued changing customer behavior (~6%)− Yes Telecom moved to Business (1.3%)1
− Smaller customer base− Partly offset by continued data growth
• Total Dutch service revenue market share at 45%
• Retail postpaid net adds trend promising− New propositions to support customer base− Postpaid wholesale driven by relatively strong
performance in value for money segment
• Committed postpaid retail ARPU increased to ~65% through new propositions, cross- and upsell‒ ARPU decline due to regulation and changing usage
-9-18-9
33
-14
1434
-9-38
-65
Q1 ’12Q4 ’11Q3 ’11Q2 ’11Q1 ’11Postpaid retail Postpaid wholesale
1 Consumer Mobile (wholesale) included Yes Telecom until Q2’11, following acquisition moved to Business (~40k postpaid customers)2 Total Dutch (Consumer and Business) service revenue market share3 Q4 2011 retail net adds impacted by 4k retail postpaid customer base clean-up at Simyo
1 3
€ m
k
€

Operating review – Consumer Mobile (cont’d)Transparent, simplified and flexible propositions introduced
20
Simplified three-step data centric bundle
Choose data bundle
Choose smartphone
Choose voice and / or SMS bundle
Premium smartphone repair service within 4 hours
Introduction of value added services (e.g. Spotify)
Customer in control of costs (insight into usage & costs)
1
2
3
Always online, unlimited access to
social media
Simplified three-step bundle€ 0 subscription with € 0.20 per min/SMS, no charge after 10 minutes calling Dutch fixed / mobile
Choose voice, SMS and / or data bundle
Choose smartphone
Customer in control of costs (insight into usage & costs)
No forced bundles, customer only pays for what he needs
Smartphone repair service within 24 hours
Long phone calls without fear of
bill shockTelfort Basis
Handset Internet
Extra’s
SMS
Voice
Road to new customer oriented propositions1. Actively approach high value customers of Hi by upselling to higher bundles (April ’11)
2. Launch of new integrated data / voice / SMS propositions KPN and Hi (September ’11)
3. Introduction of transparent, simplified and flexible propositions for Hi (March ’12) and Telfort (April ’12)
1
2
3

RG
Us
per
cust
omer
AR
PU p
er
cust
omer
Operating review – Consumer Residential
21
40%
Q1 ’12
2,516
39%
Q4 ’11
2,538
Q3 ’11
2,547
41%
2,569
40%
Q2 ’11
2,558
41%
Q1 ’11
1.941.921.891.871.85
Q4 ’11
4.9%
Q1 ’12Q3 ’11Q2 ’11Q1 ’11
Broadband market share Broadband ISP customers (k)
Bro
adba
nd
mar
ket s
hare
1
1 Source: Telecompaper, management estimates for Q1 ’12
• RGUs per customer are steadily increasing‒ Triple play customers as percentage of total
customer base increasing‒ Net line loss of 50k in line with Q1 ’11
• Broadband market share remains under pressure at 39% in Q1‒ Improved churn on triple play offset by increased
churn in single / dual play market‒ Continued growth of FttH activations and IPTV
• Churn reducing actions in copper areas‒ Network upgrades‒ Regional market approach‒ Triple play upsell‒ Churn reduction program on ADSL only‒ Proposition enrichment‒ Distribution management optimization
• ARPU per customer increased y-on-y due to increased upsell
3939393838
Q3 ’11 Q1 ’12Q2 ’11Q1 ’11 Q4 ’11
Blended ARPU (€)
#
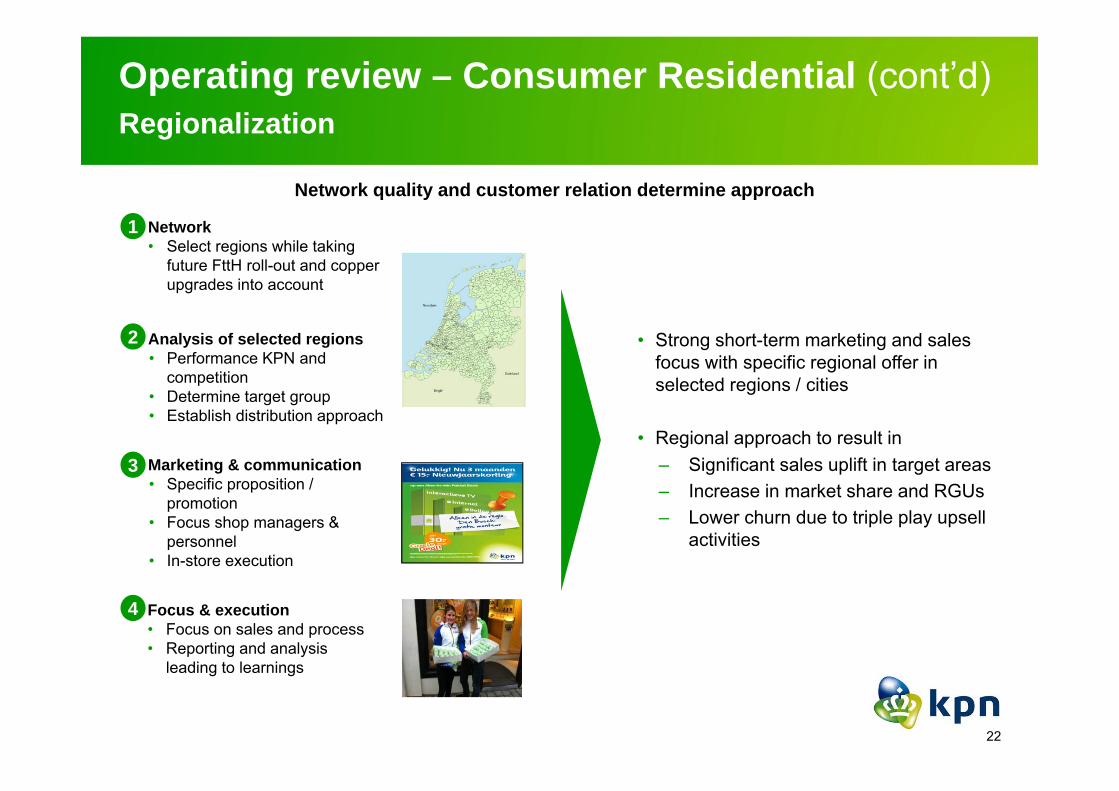
• Strong short-term marketing and sales focus with specific regional offer in selected regions / cities
• Regional approach to result in‒ Significant sales uplift in target areas‒ Increase in market share and RGUs‒ Lower churn due to triple play upsell
activities
Network• Select regions while taking
future FttH roll-out and copper upgrades into account
Analysis of selected regions• Performance KPN and
competition• Determine target group• Establish distribution approach
Marketing & communication• Specific proposition /
promotion• Focus shop managers &
personnel• In-store execution
Focus & execution• Focus on sales and process• Reporting and analysis
leading to learnings
Operating review – Consumer Residential (cont’d) Regionalization
1
2
3
4
22
Network quality and customer relation determine approach
FttH
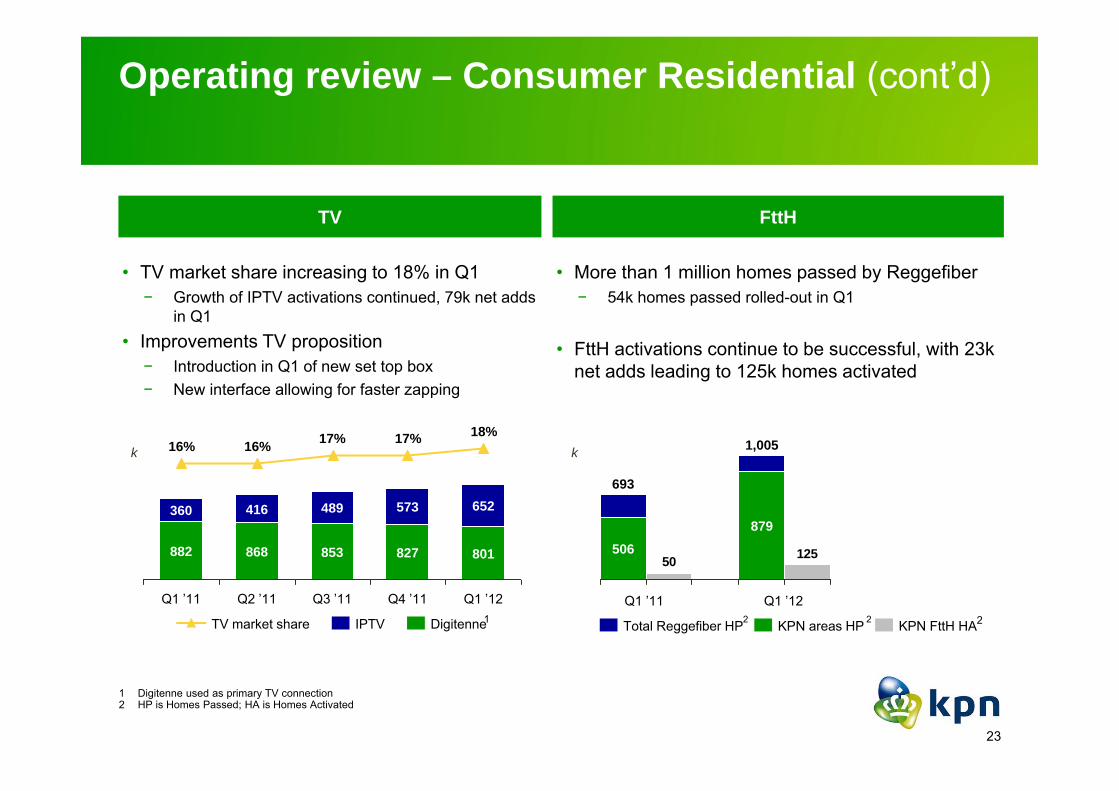
• More than 1 million homes passed by Reggefiber− 54k homes passed rolled-out in Q1
• FttH activations continue to be successful, with 23k net adds leading to 125k homes activated
Operating review – Consumer Residential (cont’d)
23
TV
• TV market share increasing to 18% in Q1− Growth of IPTV activations continued, 79k net adds
in Q1• Improvements TV proposition
− Introduction in Q1 of new set top box− New interface allowing for faster zapping
Q4 ’11
Q4 ’11
853
489 652
827
573
17% 17%
Q3 ’11
18%
Q1 ’12
801
Q2 ’11
882
360
16%
Q1 ’11
16%
868
416
IPTV DigitenneTV market share
k
1
1 Digitenne used as primary TV connection2 HP is Homes Passed; HA is Homes Activated
k
2
12550
1,005
693
879506
KPN areas HPTotal Reggefiber HP KPN FttH HA22
Q1 ’11 Q1 ’12

Operating review – Business wireless
24
% data users
€ m
m
non-voice as % of ARPU
2.9%
Q1 ’12
252
Q4 ’11
254
Q3 ’11
254
Q2 ’11
253
Q1 ’11
245
2.04
Q1 ’12
2.15
Q4 ’11
2.11
Q3 ’11Q2 ’11
1.99
Q1 ’11
1.94
57% 59%65%
3941424342
Q1 ’12Q4 ’11Q3 ’11Q2 ’11Q1 ’11
33% 30%2 35%
Voice & SMS Data (excl. SMS)
62%
43%2
Serv
ice
reve
nues
1C
usto
mer
ba
se1
AR
PU1,
2
• Service revenues 2.9% higher y-on-y− Impact from regulation € 5m (2.0%)− Increased customer base and usage leading to
data revenue growth
• Higher customer base leading to increasing market share− 68% of customers use data services
• Good performance of new portfolio introduced in Q4 2011, 77% take data plan
• Challenger brands showed stable growth in Q1
• ARPU decreased to € 39 impacted by regulation, M2M growth and data mix effect
1 Business wireless figures include Yes Telecom as of Q2 20112 Q2 and Q3 2011 data ARPU included one-off items; normalized ARPU shows stable increasing trend of non-voice as % of ARPU
68%
37%
€
Operating review – Business wireline
25
€ m
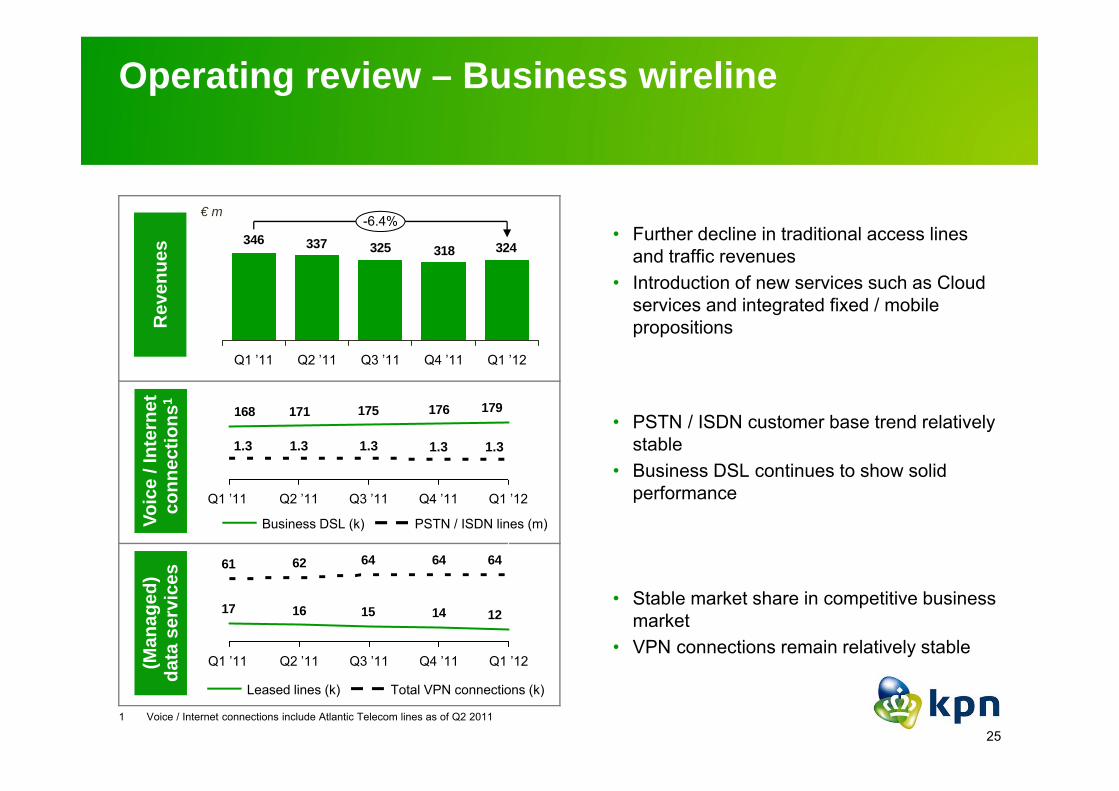
324318325337346-6.4%
Q1 ’12Q4 ’11Q3 ’11Q2 ’11Q1 ’11
179176175171168
Q1 ’12
1.3
Q4 ’11
1.3
Q3 ’11
1.3
Q2 ’11
1.3
Q1 ’11
1.3
1214151617
6464646261
Q1 ’12Q4 ’11Q3 ’11Q2 ’11Q1 ’11
PSTN / ISDN lines (m)Business DSL (k)
Leased lines (k) Total VPN connections (k)
Rev
enue
sVo
ice
/ Int
erne
t co
nnec
tions
1(M
anag
ed)
data
ser
vice
s
• Further decline in traditional access lines and traffic revenues
• Introduction of new services such as Cloud services and integrated fixed / mobile propositions
• PSTN / ISDN customer base trend relatively stable
• Business DSL continues to show solid performance
• Stable market share in competitive business market
• VPN connections remain relatively stable
1 Voice / Internet connections include Atlantic Telecom lines as of Q2 2011
Operating review – Corporate Market
26
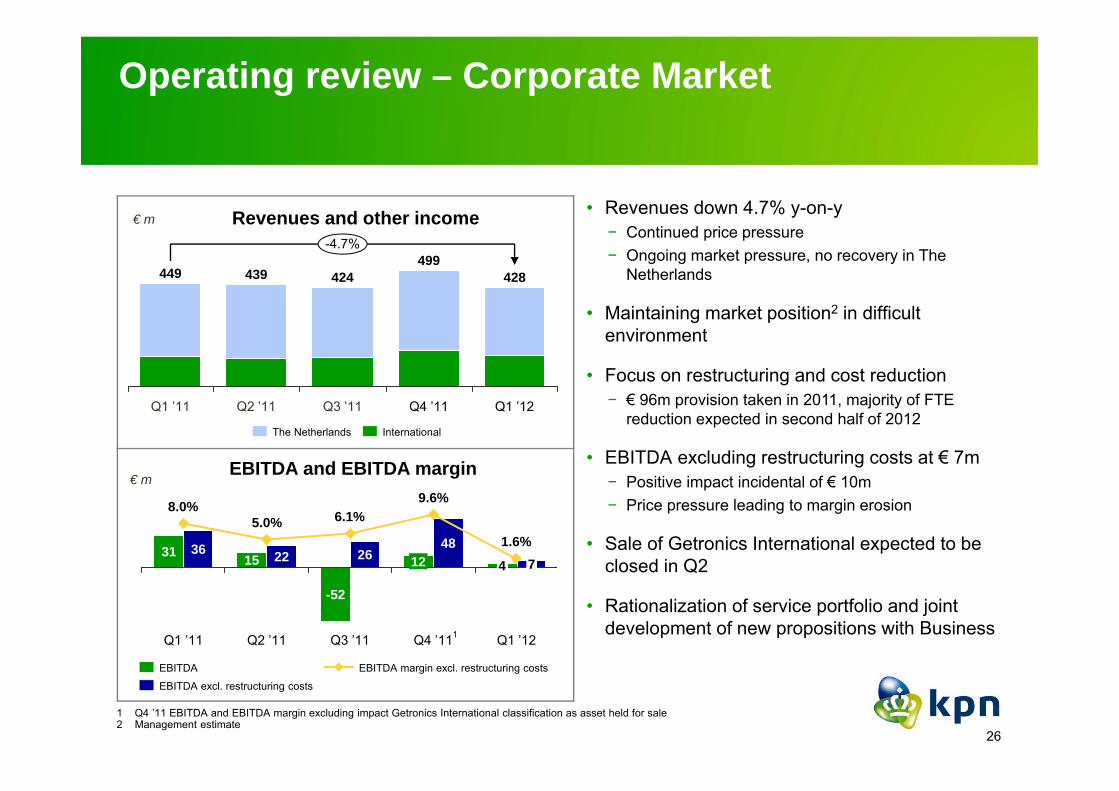
€ m Revenues and other income
€ mEBITDA and EBITDA margin
-4.7%
Q1 ’12
428
Q4 ’11
499
Q3 ’11
424
Q2 ’11
439
Q1 ’11
449
InternationalThe Netherlands
1 Q4 ’11 EBITDA and EBITDA margin excluding impact Getronics International classification as asset held for sale2 Management estimate
• Revenues down 4.7% y-on-y− Continued price pressure− Ongoing market pressure, no recovery in The
Netherlands
• Maintaining market position2 in difficult environment
• Focus on restructuring and cost reduction− € 96m provision taken in 2011, majority of FTE
reduction expected in second half of 2012
• EBITDA excluding restructuring costs at € 7m− Positive impact incidental of € 10m− Price pressure leading to margin erosion
• Sale of Getronics International expected to be closed in Q2
• Rationalization of service portfolio and joint development of new propositions with Business
Q1 ’12
1.6%74
Q4 ’11
9.6%
4812
Q3 ’11
6.1%
26
-52
Q2 ’11
5.0%
2215
Q1 ’11
8.0%
3631
1
EBITDA margin excl. restructuring costs
EBITDA excl. restructuring costs
EBITDA

Operating review – iBasis
27
€ m
Q1 ’12
255
2.7%
Q4 ’11
249
2.8%
Q3 ’11
256
2.7%
Q2 ’11
246
4.1%
Q1 ’11
226
3.1%
4.03.93.93.83.6
Q1 ’12
6.3
Q4 ’11
6.3
Q3 ’11
6.6
Q2 ’11
6.4
Q1 ’11
6.3
Revenues and other incomeEBITDA margin
Average revenue per minute (€ ct) Total minutes (bn)
Financial
Operational
• Revenue growth of 13% y-on-y− Including ~2.4% positive currency effect− Revenue per minute increased 11% y-on-y
• Focus remains on balancing revenue growth with maintaining profitability and generating free cash flow− EBITDA margin relatively stable at 2.7%
• Maintaining top-5 position in international wholesale voice market
Operating review – Germany
28
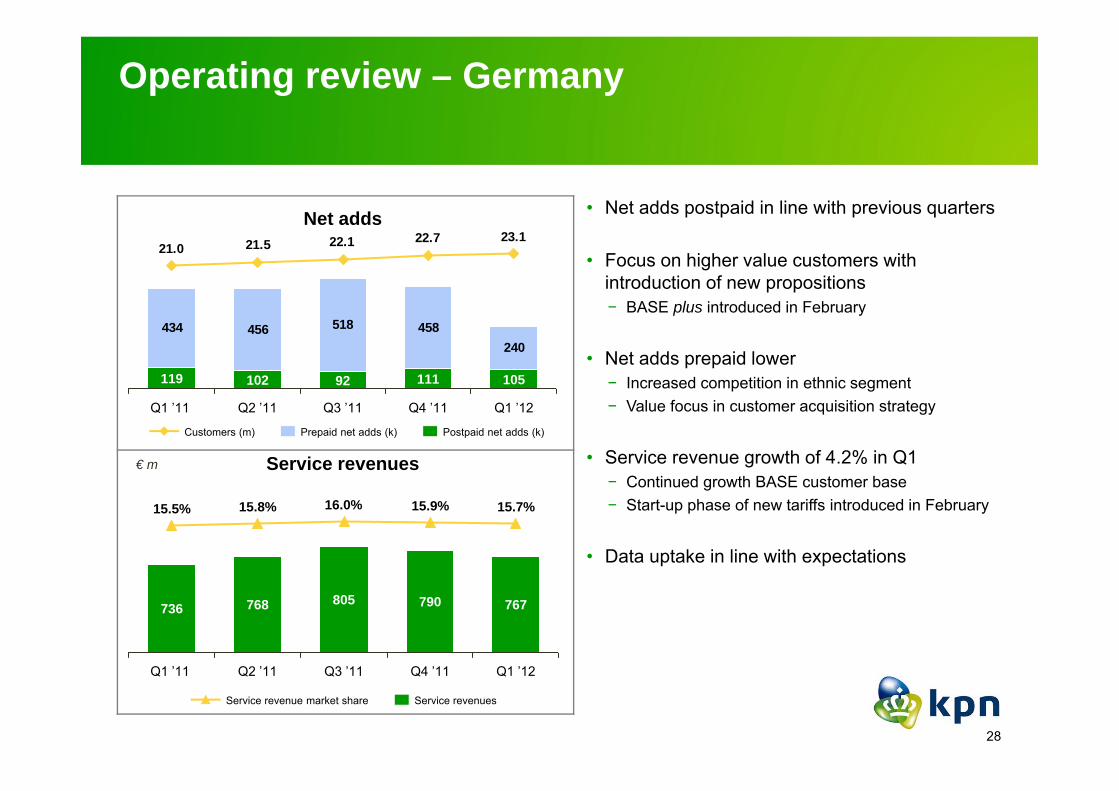
434 456 518 458240
23.122.722.121.521.0
Q1 ’12
105
Q4 ’11
111
Q3 ’11
92
Q2 ’11
102
Q1 ’11
119
Q1 ’12
767
15.7%
Q4 ’11
790
15.9%
Q3 ’11
805
16.0%
Q2 ’11
768
15.8%
Q1 ’11
736
15.5%
Postpaid net adds (k)Prepaid net adds (k)Customers (m)
Service revenuesService revenue market share
Net adds
Service revenues
• Net adds postpaid in line with previous quarters
• Focus on higher value customers with introduction of new propositions− BASE plus introduced in February
• Net adds prepaid lower− Increased competition in ethnic segment− Value focus in customer acquisition strategy
• Service revenue growth of 4.2% in Q1 − Continued growth BASE customer base− Start-up phase of new tariffs introduced in February
• Data uptake in line with expectations
€ m

Operating review – Germany (cont’d)
29
High speed data network roll-out continuesHigh speed data network roll-out continues
• Roll-out of HSPA+ with speeds of up to 42 Mbps
• On track to reach the target of >80% population coverage at the end of 2012
2012
HSPA / HSPA+ coverageEDGE coverage
New BASE plus proposition introducedNew BASE plus proposition introduced
• Highly attractive, value for money leadership
• Focus on customer value and postpaid
• Supporting further growth in data service revenue
Traditional postpaid market
No-frills
Postpaid Prepaid
E-Plus positioning and brands
Challenger New opportunity
Market leader
Targeting new market segmentTargeting new market segment
• New no-frills postpaid brand within multi-brand strategy
• Proposition based on simplicity and transparency
• Value for money all-net flat proposition
• Online as key distribution channel
Operating review – Belgium
30
136 152
40
133
Q1 ’12
9
4.3
Q4 ’11
21
4.1
Q3 ’11
11
4.1
Q2 ’11
209
3.9
Q1 ’11
14
3.9
Q1 ’12
170
>19%
Q4 ’11
180
>19%
Q3 ’11
176
~19%
Q2 ’11
171
~19%
Q1 ’11
160
~19%
Prepaid net adds (k) Postpaid net adds (k)Customers (m)
Service revenuesService revenue market share
Net adds
Service revenues
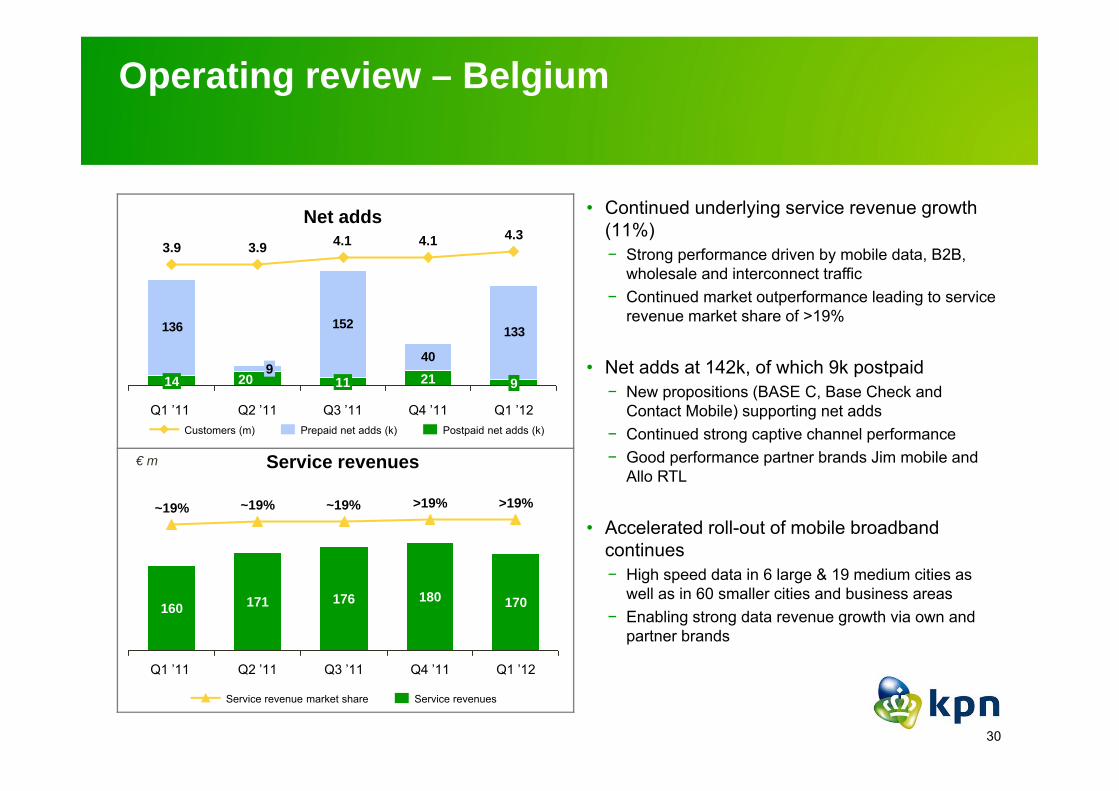
• Continued underlying service revenue growth (11%)− Strong performance driven by mobile data, B2B,
wholesale and interconnect traffic− Continued market outperformance leading to service
revenue market share of >19%
• Net adds at 142k, of which 9k postpaid − New propositions (BASE C, Base Check and
Contact Mobile) supporting net adds− Continued strong captive channel performance − Good performance partner brands Jim mobile and
Allo RTL
• Accelerated roll-out of mobile broadband continues− High speed data in 6 large & 19 medium cities as
well as in 60 smaller cities and business areas− Enabling strong data revenue growth via own and
partner brands
€ m
31
Contents
1 Chairman’s review Eelco Blok
2 Group financial review Eric Hageman
3 Group operating review Eelco Blok
4 Concluding remarks Eelco Blok
Concluding remarks
• Financial results according to plan in first quarter of transition year
• EBITDA and FCF impacted by phasing and accelerated investments in The Netherlands
• Further improving Dutch mobile propositions and expanding distribution
• Increasing TV market share and start of regionalization Consumer Residential
• Revenue growth at good EBITDA margin in Germany, strong underlying growth in Belgium
• Confirming outlook
• 2011 dividend of € 0.85 approved by AGM, final dividend of € 0.57 paid today
32

33
Q&A

Annex
For further information please contactKPN Investor RelationsTel: +31 70 44 60986
Annex

35
Analysis of resultsImpact regulation, incidentals and restructuring
€ m Q1 ’12 Q1 ’11Revenue effectMTA reduction Regulation Group -30 -127Roaming tariff reduction Regulation Group -1 -6
EBITDA effectMTA reduction Regulation Group -10 -53Roaming tariff reduction Regulation Group -1 -3Release of provisions Incidental NetCo 9 -Release of provisions Incidental Corporate Market 10 10Restructuring costs Restructuring Group -19 -10
Revenue & EBITDA effectBook gain on sale of business Incidental Corporate Market - 5Book gain on sale of towers & real estate Incidental NetCo 31 33

36
Restructuring costs
€ m Q1 ’12 Q1 ’11Germany BelgiumRest of World
---
---
Mobile International - -
Consumer MobileConsumer Residential1BusinessNetCoOther
--1
-11-
-1
--1---
Dutch Telco -13 -1
Corporate Market -3 -5
The Netherlands -16 -6
Other -3 -4
KPN Group -19 -10
1 Q1 ’11 adjusted due to better insights
37
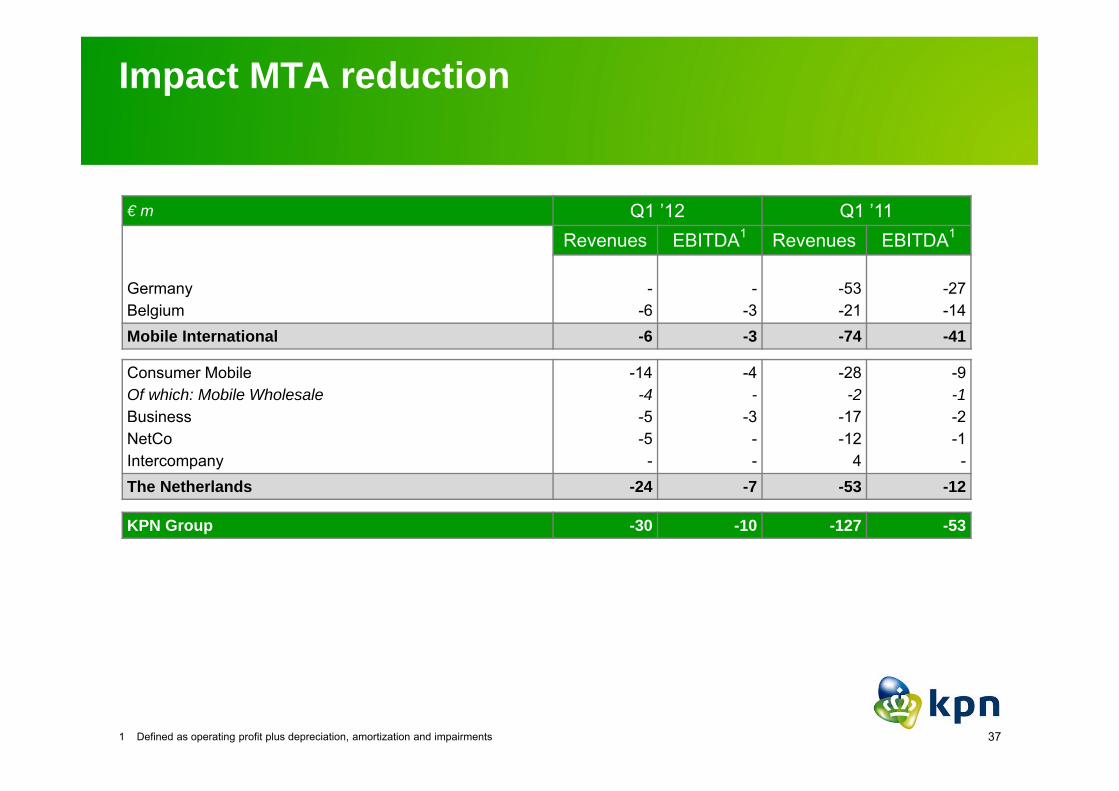
Impact MTA reduction
€ m Q1 ’12 Q1 ’11Revenues EBITDA1 Revenues EBITDA1
GermanyBelgium
--6
--3
-53-21
-27-14
Mobile International -6 -3 -74 -41
Consumer MobileOf which: Mobile WholesaleBusinessNetCoIntercompany
-14-4-5-5-
-4-
-3--
-28-2
-17-12
4
-9-1-2-1-
The Netherlands -24 -7 -53 -12
KPN Group -30 -10 -127 -53
1 Defined as operating profit plus depreciation, amortization and impairments
38
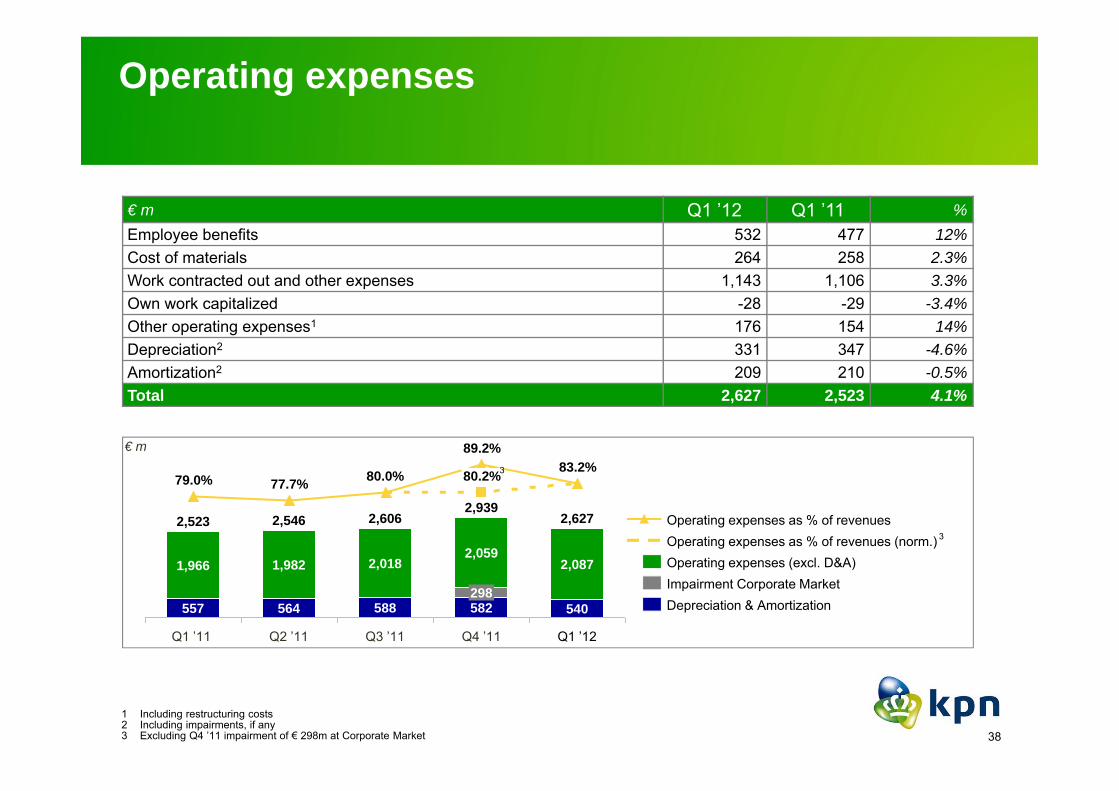
Operating expenses
€ m Q1 ’12 Q1 ’11 %Employee benefits 532 477 12%Cost of materials 264 258 2.3%Work contracted out and other expenses 1,143 1,106 3.3%Own work capitalized -28 -29 -3.4%Other operating expenses1 176 154 14%Depreciation2 331 347 -4.6%Amortization2 209 210 -0.5%Total 2,627 2,523 4.1%
€ m
1 Including restructuring costs2 Including impairments, if any3 Excluding Q4 ’11 impairment of € 298m at Corporate Market
2,087
Q1 ’12
2,627
540298
80.2%
89.2%83.2%
Q4 ’11
2,939
582
2,059
Q3 ’11
2,606
588
2,018
80.0%
Q2 ’11
2,546
564
1,982
77.7%
Q1 ’11
2,523
557
1,966
79.0%
Depreciation & AmortizationImpairment Corporate MarketOperating expenses (excl. D&A)Operating expenses as % of revenues (norm.)Operating expenses as % of revenues
3
3

Y-on-Y increase• Higher pension costs mainly relating to UK and US
Getronics pension funds (€ 19m) and The Netherlands (€ 15m)
• Increase in remuneration relating to CLA1
• Increase in number of FTEs at Mobile InternationalQ-on-Q increase• Higher pension costs mainly relating to UK and US
Getronics pension funds (€ 19m)• Increase in remuneration relating to CLA1
• Increase in number of FTEs at Mobile International
39
Operating expenses - analysis Employee benefits & Cost of materials
Cost of materials
Employee benefits€ m
€ m Y-on-Y increase• Higher costs due to increased high end smartphone
sales in The Netherlands• Partly offset by lower hardware costs in Germany
due to handset lease model
Q-on-Q decrease• Lower customer driven expenses at Corporate
Market
Q1 ’12
532
16.8%
Q4 ’11
480
14.6%
Q3 ’11
446
13.7%
Q2 ’11
471
14.4%
Q1 ’11
477
14.9%
Q1 ’12
264
8.4%
Q4 ’11
285
8.6%
Q3 ’11
230
7.1%
Q2 ’11
232
7.1%
Q1 ’11
258
8.1%
Employee benefits% of Revenues
Cost of materials% of Revenues
1 Collective Labor Agreement (“CLA”)
40
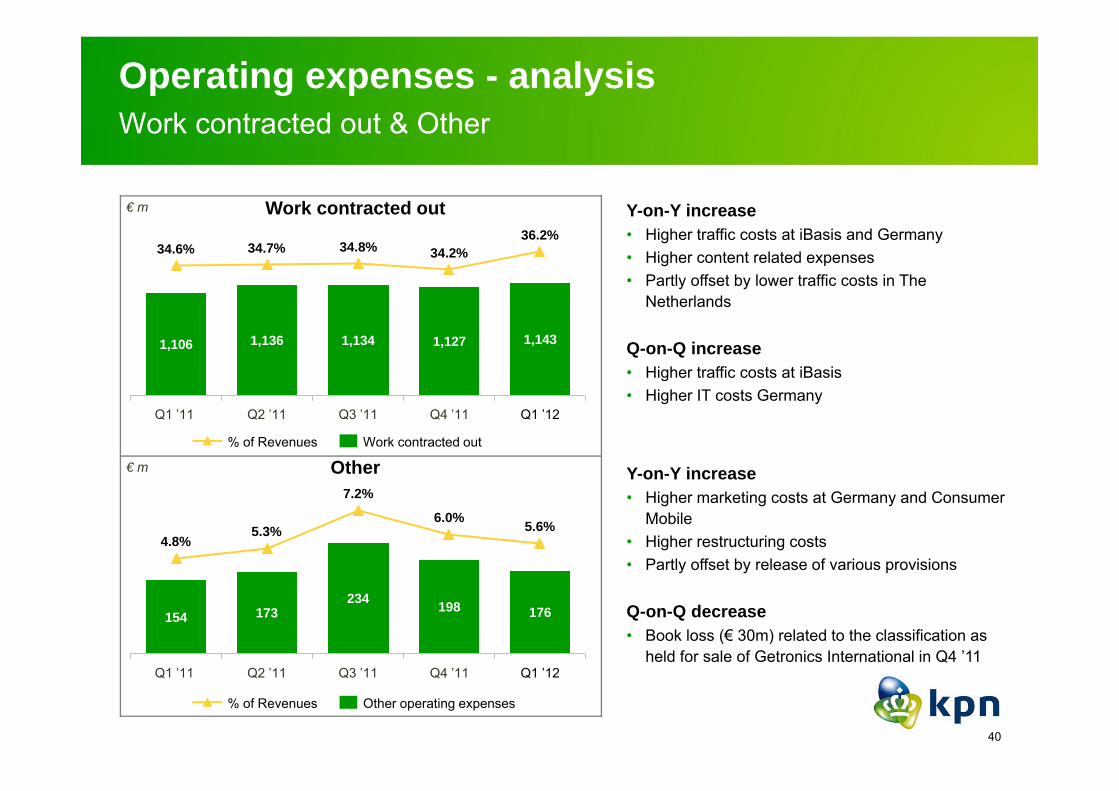
Operating expenses - analysis Work contracted out & Other
Other
Work contracted out€ m
€ m
Y-on-Y increase• Higher traffic costs at iBasis and Germany• Higher content related expenses• Partly offset by lower traffic costs in The
Netherlands
Q-on-Q increase• Higher traffic costs at iBasis• Higher IT costs Germany
Y-on-Y increase• Higher marketing costs at Germany and Consumer
Mobile • Higher restructuring costs• Partly offset by release of various provisions
Q-on-Q decrease• Book loss (€ 30m) related to the classification as
held for sale of Getronics International in Q4 ’11
Q1 ’12
1,143
36.2%
Q4 ’11
1,127
34.2%
Q3 ’11
1,134
34.8%
Q2 ’11
1,136
34.7%
Q1 ’11
1,106
34.6%
Q1 ’12
176
5.6%
Q4 ’11
198
6.0%
Q3 ’11
234
7.2%
Q2 ’11
173
5.3%
Q1 ’11
154
4.8%
Work contracted out% of Revenues
Other operating expenses% of Revenues
41
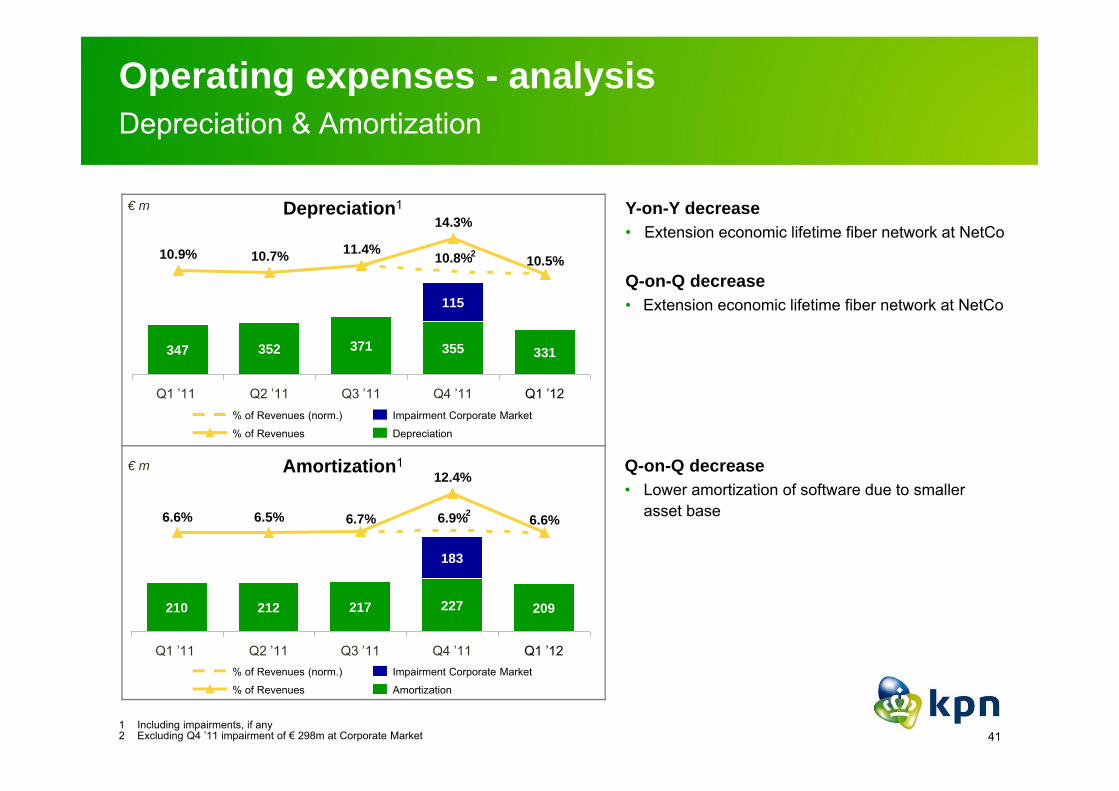
Operating expenses - analysis Depreciation & Amortization
Amortization1
Depreciation1€ m
€ m
1 Including impairments, if any2 Excluding Q4 ’11 impairment of € 298m at Corporate Market
Q-on-Q decrease• Lower amortization of software due to smaller
asset base
Y-on-Y decrease• Extension economic lifetime fiber network at NetCo
Q-on-Q decrease• Extension economic lifetime fiber network at NetCo
Q1 ’12
331
10.5%
Q4 ’11
355
115
14.3%
10.8%
Q3 ’11
371
11.4%
Q2 ’11
352
10.7%
Q1 ’11
347
10.9%
Q1 ’11
210
6.6%
209
Q1 ’12
6.6%
Q4 ’11
227
183
12.4%
6.9%
Q3 ’11
217
6.7%
Q2 ’11
212
6.5%
Depreciation
Impairment Corporate Market
% of Revenues
% of Revenues (norm.)
Amortization
Impairment Corporate Market
% of Revenues
% of Revenues (norm.)
2
2
42
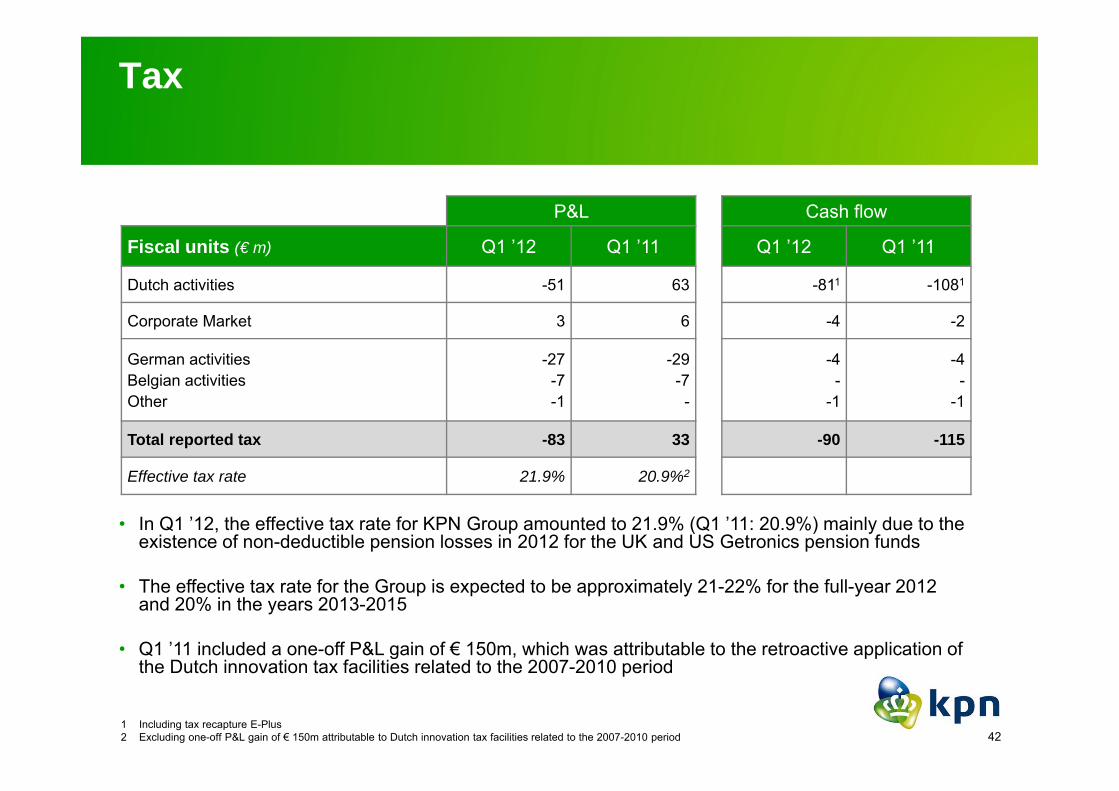
Tax
P&L Cash flow
Fiscal units (€ m) Q1 ’12 Q1 ’11 Q1 ’12 Q1 ’11
Dutch activities -51 63 -811 -1081
Corporate Market 3 6 -4 -2
German activitiesBelgian activitiesOther
-27-7-1
-29-7-
-4-
-1
-4-
-1
Total reported tax -83 33 -90 -115
Effective tax rate 21.9% 20.9%2
• In Q1 ’12, the effective tax rate for KPN Group amounted to 21.9% (Q1 ’11: 20.9%) mainly due to the existence of non-deductible pension losses in 2012 for the UK and US Getronics pension funds
• The effective tax rate for the Group is expected to be approximately 21-22% for the full-year 2012 and 20% in the years 2013-2015
• Q1 ’11 included a one-off P&L gain of € 150m, which was attributable to the retroactive application of the Dutch innovation tax facilities related to the 2007-2010 period
1 Including tax recapture E-Plus2 Excluding one-off P&L gain of € 150m attributable to Dutch innovation tax facilities related to the 2007-2010 period
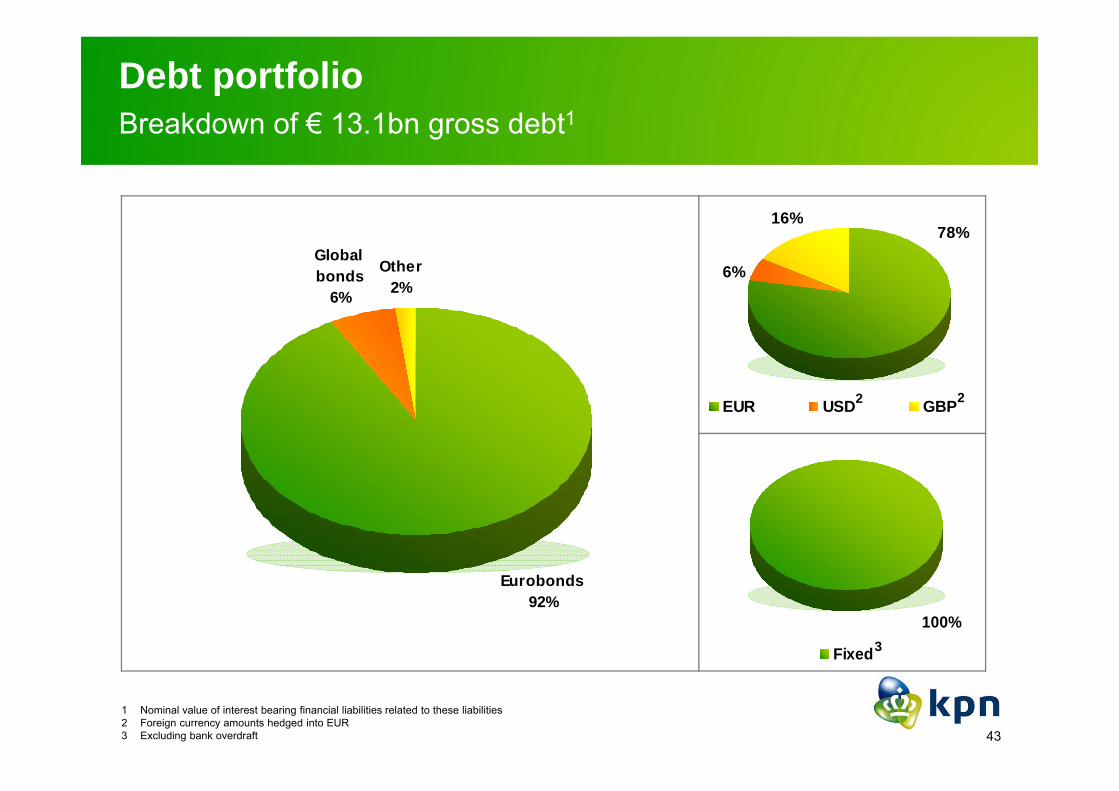
Global bonds
6%
Eurobonds92%
Other2%
100%
Fixed
78%16%
6%
EUR USD GBP
Debt portfolioBreakdown of € 13.1bn gross debt1
43
1 Nominal value of interest bearing financial liabilities related to these liabilities2 Foreign currency amounts hedged into EUR3 Excluding bank overdraft
3
22
44
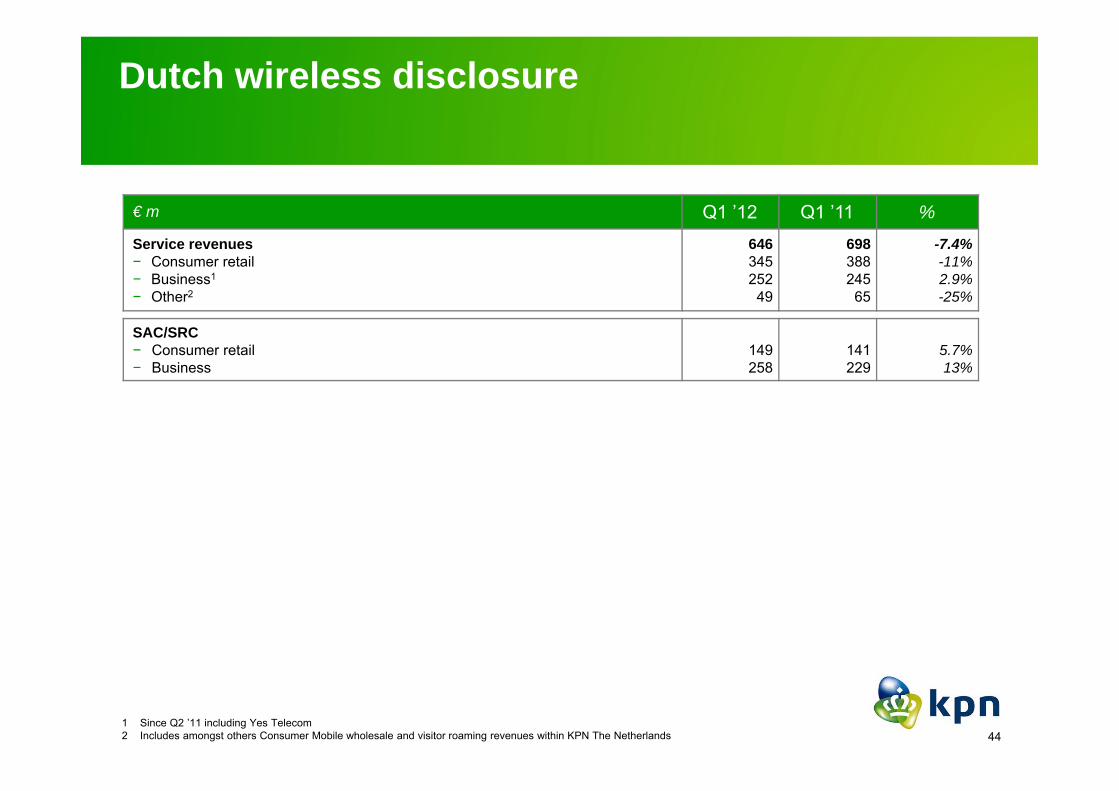
Dutch wireless disclosure
€ m Q1 ’12 Q1 ’11 %Service revenues− Consumer retail− Business1
− Other2
646345252
49
698388245
65
-7.4%-11%2.9%-25%
SAC/SRC− Consumer retail− Business
149258
141229
5.7%13%
1 Since Q2 ’11 including Yes Telecom2 Includes amongst others Consumer Mobile wholesale and visitor roaming revenues within KPN The Netherlands

45
Market growth Belgium2, 3
Mobile International wireless disclosure
Service revenues growth BelgiumService revenues growth Germany
Q1 ’12
4.2%4.2%
Q4 ’11
7.2%
1.2%
Q3 ’11
8.1%
-0.6%
Q2 ’11
7.5%
-0.5%
Q1 ’11
7.9%
1.0%
Q1 ’12
11.1%
6.3%
Q4 ’11
15.0%
7.8%
Q3 ’11
11.4%
3.5%
Q2 ’11
8.9%
-3.9%
Q1 ’11
8.1%
-5.3%
UnderlyingReported UnderlyingReported
Market growth Germany2
Service revenues growth BelgiumService revenues growth Germany
1 The definition of underlying is explained in the safe harbor of this presentation2 Management estimates for market service revenues growth, based on equity research3 Market growth of Q2 ’11 has been amended due to better insights of service revenues of competitor
Q1 ’12
2.5 - 3.5%
Q4 ’11
0.2%
Q3 ’11
-0.9%
Q2 ’11
-1.2%
Q1 ’11
-0.6%
Q1 ’12
1.0 - 2.0%
Q4 ’11
-0.5%
Q3 ’11
-0.9%
Q2 ’11
-4.4%
Q1 ’11
-5.7%
1 1

46
RegulationMTA reductions
MTA reductions implemented across the Group
• The Dutch Court overruled OPTAs MTA tariff decision and determined a new tariff as of 1 September 2012 of € 2.40 cent per minute instead of € 1.20 cent per minute
• The EC published a serious doubt letter, indicating that the level should be € 1.20 cent. Consequences are not clear yet
• Legal proceedings against the MTA decisions are ongoing
• KPN’s suspension request has been rejected, decision in annulment procedure is expected in Q2 2012
€ ct / min Until 7 July 7 July ’10 Sep ’10 Jan ’11 Sep ’11 Sep ’12MTA rate 7.00 5.60 5.60 4.20 2.70 2.40
€ ct / min Until Aug Aug ’10 Jan ’11 Jan ’12 Jan ’13
MTA rate 11.43 5.68 4.76 2.92 1.08
€ ct / min Until 1 Dec ’10 1 Dec ’10 – 30 Nov ’12MTA rate 7.14 3.36
NL
GER
BE
MTA impact on Group revenues & EBITDA
€ m 2010 2011 2012ERevenues 180 459 ~ 110EBITDA 62 192 ~ 45
•
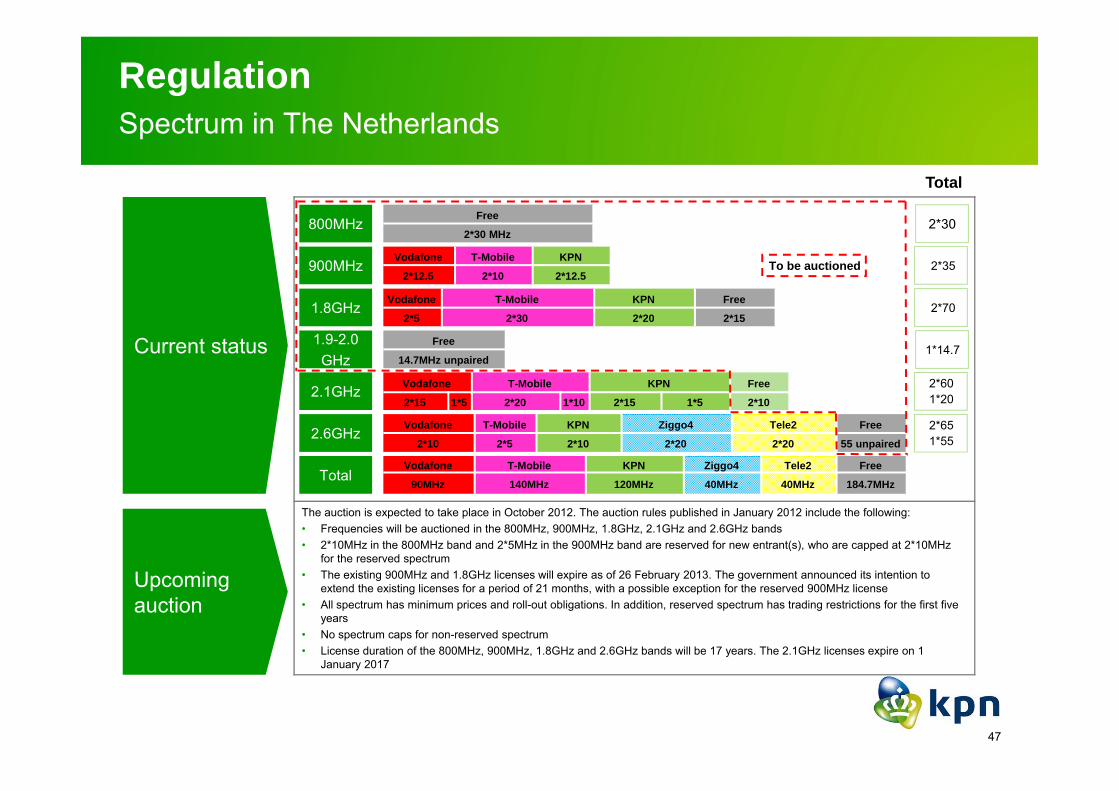
The auction is expected to take place in October 2012. The auction rules published in January 2012 include the following:• Frequencies will be auctioned in the 800MHz, 900MHz, 1.8GHz, 2.1GHz and 2.6GHz bands • 2*10MHz in the 800MHz band and 2*5MHz in the 900MHz band are reserved for new entrant(s), who are capped at 2*10MHz
for the reserved spectrum• The existing 900MHz and 1.8GHz licenses will expire as of 26 February 2013. The government announced its intention to
extend the existing licenses for a period of 21 months, with a possible exception for the reserved 900MHz license• All spectrum has minimum prices and roll-out obligations. In addition, reserved spectrum has trading restrictions for the first five
years• No spectrum caps for non-reserved spectrum• License duration of the 800MHz, 900MHz, 1.8GHz and 2.6GHz bands will be 17 years. The 2.1GHz licenses expire on 1
January 2017
Total
47
RegulationSpectrum in The Netherlands
Current status
Upcoming auction
1.8GHz
2.1GHz
Total
900MHzVodafone T-Mobile KPN
2*12.5 2*10 2*12.5
Vodafone T-Mobile KPN Free
2*5 2*30 2*20 2*15
Vodafone T-Mobile KPN Free
2*15 1*5 2*20 1*10 2*15 1*5 2*10
2.6GHz
800MHz
1.9-2.0GHz
Free
2*30 MHz
Free
14.7MHz unpaired
Vodafone T-Mobile KPN Ziggo4 Tele2 Free
2*10 2*5 2*10 2*20 2*20 55 unpaired
Vodafone T-Mobile KPN Ziggo4 Tele2 Free
90MHz 140MHz 120MHz 40MHz 40MHz 184.7MHz
2*30
2*35
2*70
1*14.7
2*60 1*20
2*65 1*55
To be auctioned
48
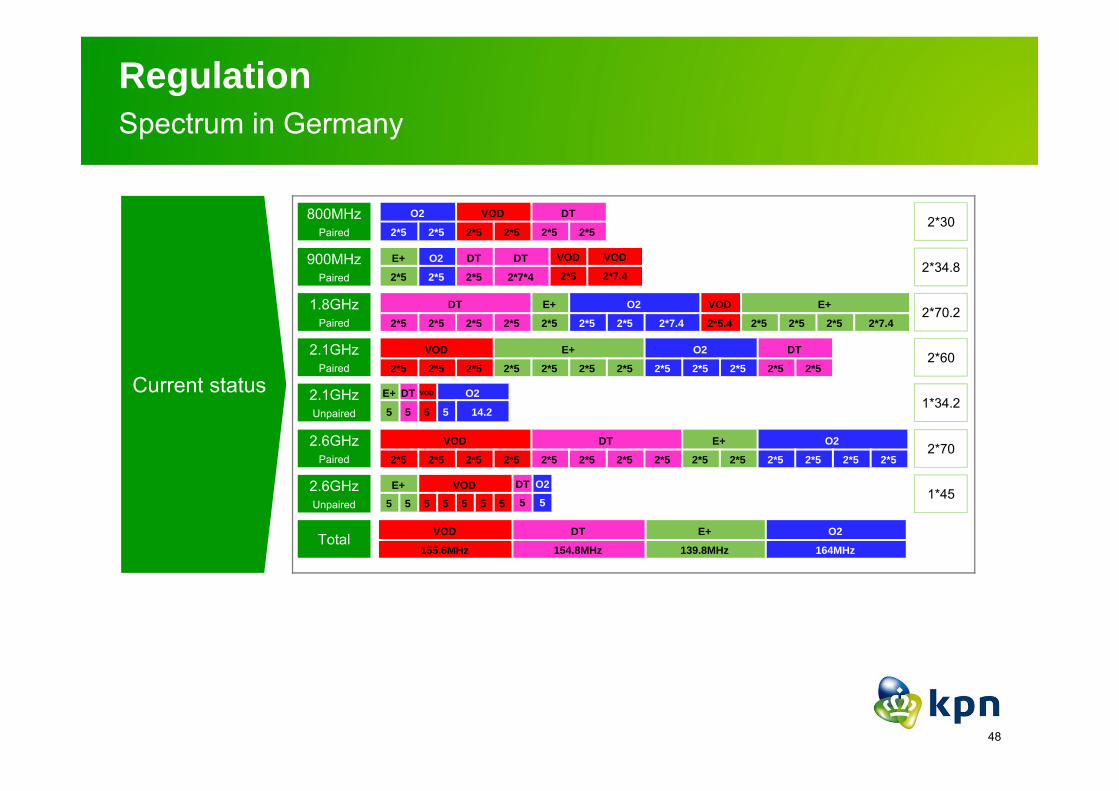
RegulationSpectrum in Germany
Current status
900MHzPaired
1.8GHzPaired
2.1GHzUnpaired
800MHzPaired
O2 VOD DT
2*5 2*5 2*5 2*5 2*5 2*5
E+ O2 DT DT VOD VOD
2*5 2*5 2*5 2*7*4 2*5 2*7.4
DT E+ O2 VOD E+
2*5 2*5 2*5 2*5 2*5 2*5 2*5 2*7.4 2*5.4 2*5 2*5 2*5 2*7.4
E+ DT VOD O2
5 5 5 5 14.2
2.1GHzPaired
VOD E+ O2 DT
2*5 2*5 2*5 2*5 2*5 2*5 2*5 2*5 2*5 2*5 2*5 2*5
Total
2.6GHzPaired
2.6GHzUnpaired
2*30
2*34.8
VOD DT E+ O2
2*5 2*5 2*5 2*5 2*5 2*5 2*5 2*5 2*5 2*5 2*5 2*5 2*5 2*5
E+ VOD DT O2
5 5 5 5 5 5 5 5 5
2*70.2
2*60
1*34.2
2*70
1*45
VOD DT E+ O2
155.6MHz 154.8MHz 139.8MHz 164MHz
49
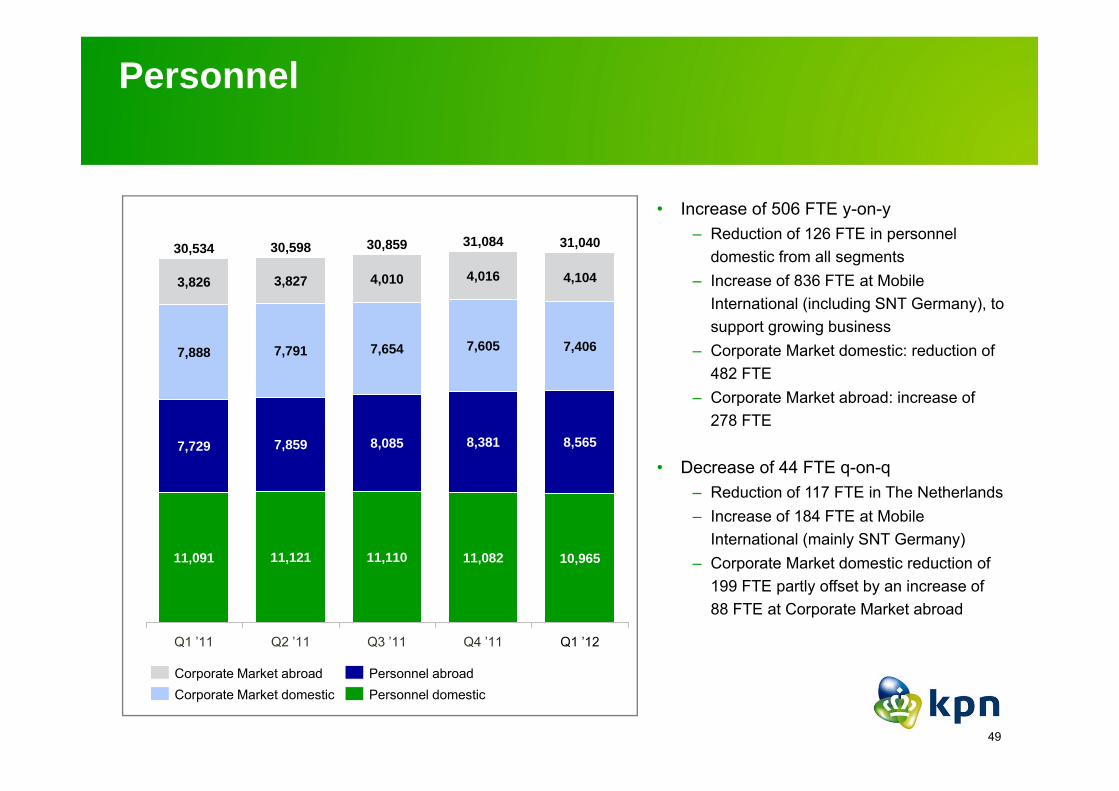
Personnel
• Increase of 506 FTE y-on-y– Reduction of 126 FTE in personnel
domestic from all segments – Increase of 836 FTE at Mobile
International (including SNT Germany), to support growing business
– Corporate Market domestic: reduction of 482 FTE
– Corporate Market abroad: increase of 278 FTE
• Decrease of 44 FTE q-on-q– Reduction of 117 FTE in The Netherlands– Increase of 184 FTE at Mobile
International (mainly SNT Germany)– Corporate Market domestic reduction of
199 FTE partly offset by an increase of 88 FTE at Corporate Market abroad
8,565
10,965
31,040
7,406
11,082
8,381
7,605
4,016
Q3 ’11
30,859
11,110
8,085
7,654
4,010
Q2 ’11
30,598
11,121
7,859
7,791
3,827
Q1 ’11
30,534
11,091
7,729
Q1 ’12Q4 ’11
31,084
7,888
3,826 4,104
Corporate Market abroadPersonnel domesticPersonnel abroad
Corporate Market domestic
ADSL oncopper
50
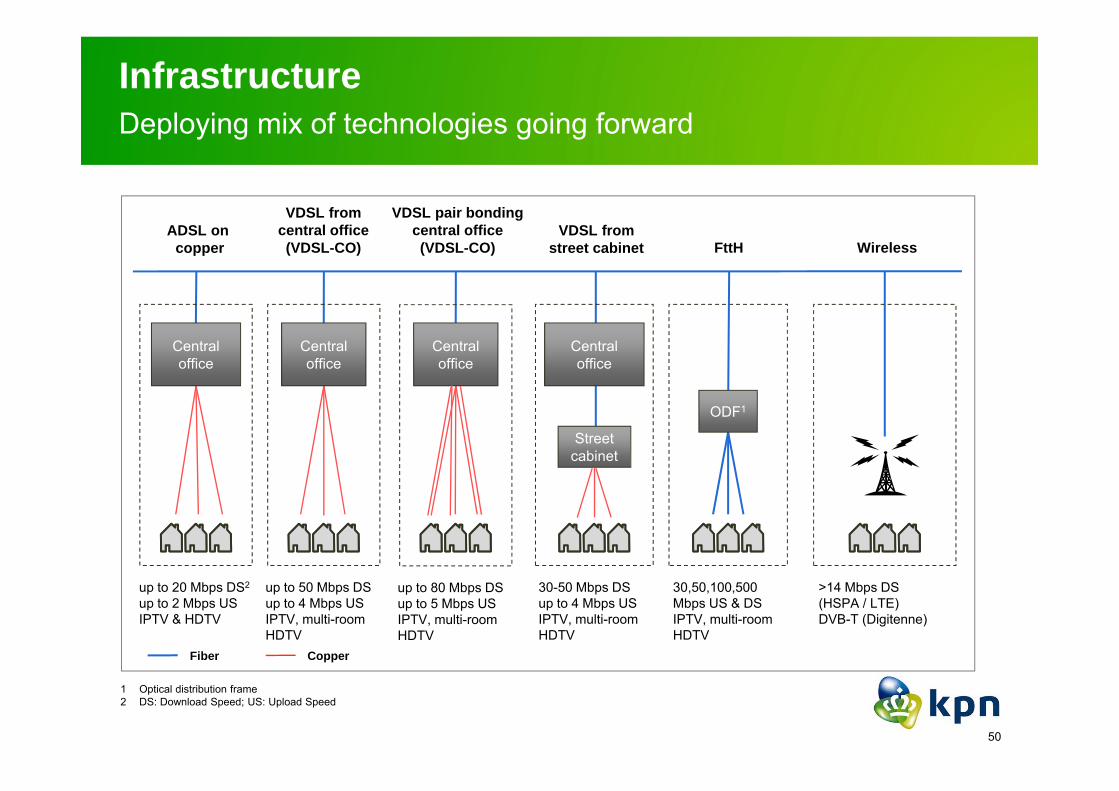
Infrastructure Deploying mix of technologies going forward
Fiber Copper
VDSL from street cabinet
30-50 Mbps DSup to 4 Mbps USIPTV, multi-room HDTV
Street cabinet
VDSL from central office (VDSL-CO)
up to 50 Mbps DSup to 4 Mbps USIPTV, multi-room HDTV
Central office
up to 20 Mbps DS2
up to 2 Mbps USIPTV & HDTV
Centraloffice
FttH
30,50,100,500 Mbps US & DSIPTV, multi-room HDTV
Wireless
>14 Mbps DS(HSPA / LTE)DVB-T (Digitenne)
Central office
VDSL pair bondingcentral office (VDSL-CO)
up to 80 Mbps DSup to 5 Mbps USIPTV, multi-room HDTV
Central office
ODF1
1 Optical distribution frame2 DS: Download Speed; US: Upload Speed
51
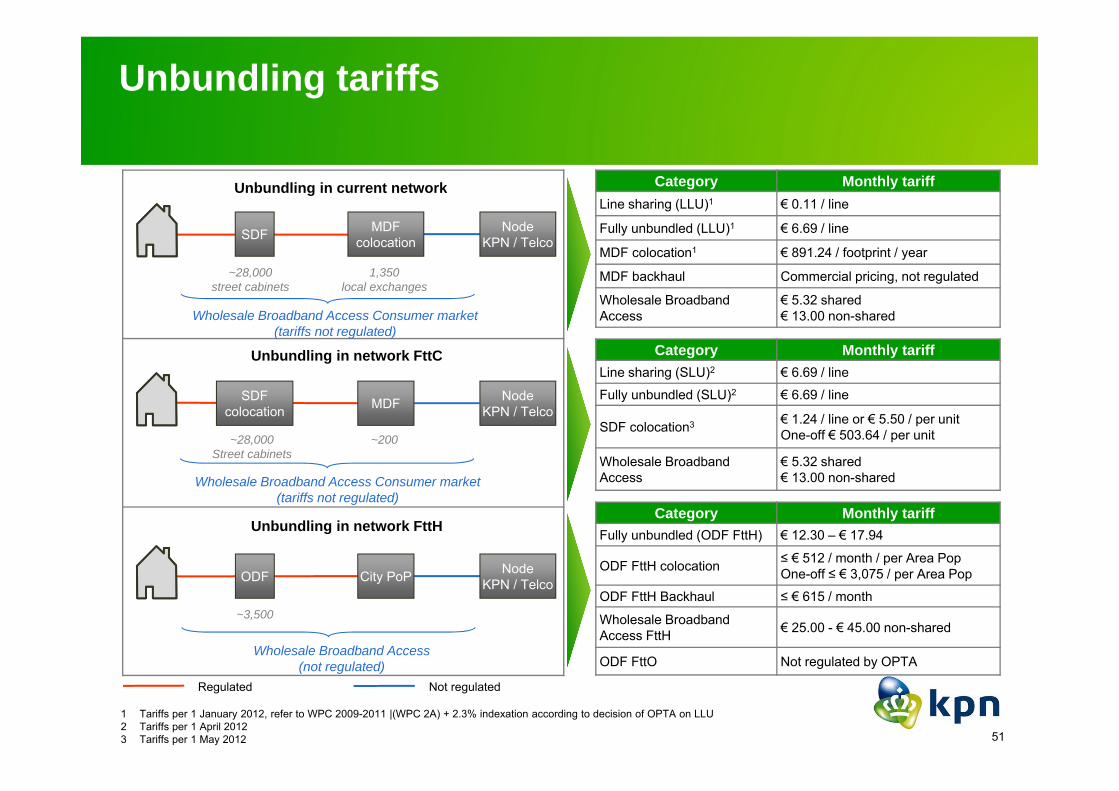
Unbundling tariffs
Category Monthly tariffLine sharing (LLU)1 € 0.11 / line
Fully unbundled (LLU)1 € 6.69 / line
MDF colocation1 € 891.24 / footprint / year
MDF backhaul Commercial pricing, not regulated
Wholesale Broadband Access
€ 5.32 shared€ 13.00 non-shared
Category Monthly tariffLine sharing (SLU)2 € 6.69 / line
Fully unbundled (SLU)2 € 6.69 / line
SDF colocation3 € 1.24 / line or € 5.50 / per unitOne-off € 503.64 / per unit
Wholesale Broadband Access
€ 5.32 shared€ 13.00 non-shared
Category Monthly tariffFully unbundled (ODF FttH) € 12.30 – € 17.94
ODF FttH colocation ≤ € 512 / month / per Area PopOne-off ≤ € 3,075 / per Area Pop
ODF FttH Backhaul ≤ € 615 / month
Wholesale Broadband Access FttH € 25.00 - € 45.00 non-shared
ODF FttO Not regulated by OPTA
Unbundling in current network
~28,000 street cabinets
1,350 local exchanges
Unbundling in network FttC
NodeKPN / Telco
~28,000 Street cabinets
MDF
~200
Unbundling in network FttH
~3,500
NodeKPN / TelcoCity PoP
MDFcolocationSDF Node
KPN / Telco
SDFcolocation
ODF
Regulated Not regulated
Wholesale Broadband Access(not regulated)
Wholesale Broadband Access Consumer market(tariffs not regulated)
Wholesale Broadband Access Consumer market (tariffs not regulated)
1 Tariffs per 1 January 2012, refer to WPC 2009-2011 |(WPC 2A) + 2.3% indexation according to decision of OPTA on LLU2 Tariffs per 1 April 20123 Tariffs per 1 May 2012