Embed Size (px)
Citation preview

KPMGs Corporate Tax Rate Survey An international analysis of corporate tax rates from 1993 to 2006
TAX
2 C o r p o r a t e I n c o m e T a x R a t e
Summary and Comment
Since 1993 KPMG has published an annual analysis of corporate tax rates around the world In our initial survey the rates from 23 countries were examined Now in 2006 the list stands at 86 countries
The survey has recorded a consistent and dramatic reduction in corporate tax rates over that 14-year period This reduction began in the mid-1980s in the United Kingdom when the government of Margaret Thatcher lowered the corporate tax rate from 52 percent to 35 percent between 1982 and 1986 forcing other countries to follow suit
Once one major industrialized economy cuts its rates others seem compelled to do the same in a process of international tax competition that continues and intensifies over time In the past 14 years the average corporate tax rate of countries surveyed by KPMG declined nearly 29 percent (287) dropping from an average of 38 percent to 271 percent
This same process seems to apply across entire regions and economic alliances as shown by the clear impact on European Union (EU) tax rates of the 10 new states that joined the community in 2004 and indeed by the evident worldwide competition between the trading blocs such as the Asia Pacific (ASPAC) nations Group of 7 (G7) Organisation for Economic Co-operation and Development (OECD) and the EU
This competition suggests that there must be some benefit in having low corporate taxes and indeed it appears that countries that adopt comparatively low tax rates tend to do better in terms of growth and inward investment than those that do not
But does this mean that countries are locked into a ldquorace to the bottomrdquo in tax rates Policymakers faced with the need to fund social programs may fear revenue shortfalls if they simply reduce corporate income tax rates even though there is a tendency among high tax rate countries not to rely substantially on revenue from this source
In the long term low tax rates should attract more inward investment which should expand the economy and thereby provide a greater tax base But in the short to medium term there is often a need for measures to offset the impact of low tax rates such as improving spending efficiency or relying more on other sources of revenues such as indirect taxes
The practical answer favored by some governments seems to be to combine favorable tax rates with a broadening of the tax collection system by reducing tax breaks and loopholes This strategy was used with conspicuous success by tax reformers in the Scandinavian countries as well as in Ireland and is finding its way into Eastern Europe The new German government plans to propose a package of tax reforms that broadly follows this model
copy 2006 KPMG International KPMG International is a Swiss cooperative of which all KPMG firms are members KPMG International provides no services to clients Each member firm is a separate and independent legal entity and each describes itself as such All rights reserved
3 A T r e n d A n a l y s i s
Corporations value policies that give them control and certainty so shifts toward long-term business-friendly tax administration systems are likely to attract their attention
But given the intense global competition for tax revenue it may make sense for governments to follow the example of the commercial sector and consider strategies other than simple price cuts to attract and retain discerning customers
This recognizes a subtle but important shift in the relationship between large multinational corporate taxpayers and national governments As transport communication and trading links improve across the world corporations are finding it progressively easier to site their operations wherever they can find the best combination of resources skills finance security and the effective rule of law
Tax under these circumstances becomes effectively a price that multinationals have to pay to make use of the goods and services that a country can provide Like any astute consumer faced with this kind of choice corporations are shopping around globally for the best combination of price and value
What this means for governments is that they have an opportunity to attract inward investment not just through low taxation but through astute global marketing of the benefits of siting operations in their countries Corporations value policies that give them control and certainty so shifts toward long-term business-friendly tax administration systems are likely to attract their attention Also sensibly countries may consider the best balance of income sourcesmdashbetween direct and indirect taxes to provide a diversity of income and collection and compliance efficiency
The next step for governments could be to recognize the reputational impact of tax policy on corporate behavior Paying customers sometimes have to justify to others why they made a particular decision to buy Through better communication of their strategic policy for collecting taxes and strategic plans for spending the money ie actively explaining to investors the benefits arising from their social policies governments can make it significantly easier for corporations to persuade shareholders and others that a particular siting decision was both financially sensible and socially responsible In a fiercely competitive and judgmental global environment information like this can make a real difference
In summary from our past 14 yearsrsquo tracking experience it appears to be economically and socially desirable for countries to strive for lower corporate income taxes Corporations are sensitive to income tax rates and the enhanced mobility of capital and labor all over the world increases their ability to transfer functions from a high-tax regime to a low-tax country But if countries want to offset the risks of relying on lower rates alone just as corporates in global competition strive constantly for new ways of differentiating products and services and increasing customer loyalty so in the face of globalization governments may be well advised to find new ways to make sure their countries attract and collect a sustainable share of global tax revenue to fund long-term programs
Loughlin Hickey Global Managing Partner Tax KPMG in the United Kingdom
copy 2006 KPMG International KPMG International is a Swiss cooperative of which all KPMG firms are members KPMG International provides no services to clients Each member firm is a separate and independent legal entity and each describes itself as such All rights reserved
4 C o r p o r a t e I n c o m e T a x R a t e
Analysis
Corporate tax rates around the world continue to decline driven primarily by competition among nations for business tax receipts and jobs In the 14-year period beginning in 1993 the average corporate tax rate of countries surveyed by KPMG declined nearly 29 percent (287) dropping from an average of 38 percent to 271 percent
Corporate Tax Rates All Countries 1993 ndash 2006
40
38
373 377 377
332 329
321 32 314
307
30
289
272 271
Perc
en
tag
e
35
30
25
1993 1994 1995 1996 1997 1998 1999 2000 2001 2002 2003 2004 2005 2006
(In all charts in this document highest rates reported were used for calculations)
Source KPMG International 2006
As part of its survey KPMG also examined corporate tax rates for a number of regions around the world including the OECD the G7 the EU 19 countries in the ASPAC region and 19 countries in the Latin AmericanCaribbean (LAT) region Among those regions the G7 has the highest average rate in 2006 with 365 percent The lowest with 258 percent is the EU
Corporate Tax Rates 2006 by Global Region
38
271
30
258
365
285 285
All ASPAC EU G7 LAT OECD
Source KPMG International 2006
36
34
32
30
28
26
24
22
20
Perc
en
tag
e
copy 2006 KPMG International KPMG International is a Swiss cooperative of which all KPMG firms are members KPMG International provides no services to clients Each member firm is a separate and independent legal entity and each describes itself as such All rights reserved
5 A T r e n d A n a l y s i s
In 1993 when the EU comprised 15 nations the rate was 38 percent By 2006 when there were 25 members rates had dropped 122 percentage points to 258 percent representing a decline of 32 percent
With an average corporate income tax rate of 18 percent the Eastern European states that joined the EU in 2004 have tax rates among the lowest in Europe Their accession to the EU also increased their attractiveness for foreign investors Furthermore due to the increased freedom of movement of capital and labor in the EU these countries now directly compete with western European nations for investment and labor
4
1
Corporate Tax Rates EU 1993 ndash 2006
1993 1994 1995 1996 1997 1998 1999 2000 2001 2002 2003 2004 2005 2006
Source KPMG International 2006
Among the major nations in the EU Germany slashed its federal tax rate from 597 percent in 1993 to 38 percent this year representing a decline of nearly 36 percent in the 14-year period This decline may be attributable to increasing competition especially with the accession of the new EU Member States in 2004 Despite that hefty decrease Germany still has the highest corporate income tax rate among EU countries (although there are moves to cut the German rate still further and widen the tax base) followed by Italy with
3
373 percent Malta and Spain each have a corporate tax rate of 35 percent
The largest decline among EU countries in the 14-year period was Ireland which cut its rate from 40 percent in 1993 down to 125 percent in 2006 a 688 percent reduction The second-largest declines were Austria and Germany each cutting their rates by 36 percent Portugal and Italy reduced rates 31 percent and 29 percent respectively Portugalrsquos rate is 275 percent and Italyrsquos is 373 percent
1 Jens Tartler ldquoNeue EU-Staaten zwingen das alte Europa zu Steuersenkungenrdquo Financial Times Deutschland April 29 2005 p 14 available at httpwwwcesifodeportalpage_pageid=362381006amp_dad=portalamp_schema=PORTALampitem_ link=echo-FTD-29-04-05htm
copy 2006 KPMG International KPMG International is a Swiss cooperative of which all KPMG firms are members KPMG International provides no services to clients Each member firm is a separate and independent legal entity and each describes itself as such All rights reserved
Perc
en
tag
e
38
373 379 38
355 351
348
339
32
309
297
283
261 258
25
30
35
40
6
Ger
man
y
Italy
Malta
Spain
Belgiu
m
France
Unite
d Kin
gdom
Luxe
mbourg
Gre
ece
C o r p o r a t e I n c o m e T a x R a t e
Highest Tax Rates EU 2006
Perc
en
tag
e
383 373
35 35 34 333
30 296 29
20
22
24
26
28
30
32
34
36
38
40
Source KPMG International 2006
The average corporate tax rate for countries in the OECD in 2006 is 28 percent which is percentage points less than the 1993 average rate By contrast nations in the G7 have an average corporate tax rate in 2006 of 365 percent which stands in significant contrast to those nations in the OECD
59 5
Reviewing the development of the countries among the G72 with the exception of the United States and France all have reduced their corporate income tax rates during the 14-year period3
G7 Countries 1993 ndash 2006
Perc
en
tag
e 443
333
597
522 524
33
40
361 333
383
373
40 7
30
40
20
25
30
35
40
45
50
55
60
65
Canada France Germany Italy Japan United United
Kingdom States
Jan 1 1993 Jan 1 2006
Source KPMG International 2006
2 Countries of the Group of Seven are Canada France Germany Italy Japan the United Kingdom and the United States
3 KPMG Corporate Tax Rate Survey 2006 available at httpwwwkpmgconzdownload102964110012 KPMGrsquos20Corporate20Tax20Rate20Survey202006pdf
copy 2006 KPMG International KPMG International is a Swiss cooperative of which all KPMG firms are members KPMG International provides no services to clients Each member firm is a separate and independent legal entity and each describes itself as such All rights reserved
7 A T r e n d A n a l y s i s
Among the countries that have reduced their rates
bull Germanyrsquos rate dropped 21 points or 36 percent in the period 4
bull Italyrsquos 149 percent decline represents a decrease of 28 percent 5
bull Japanrsquos rate declined 119 points or 227 percent
bull Canadarsquos rate dropped 82 percentage points or 185 percent
bull The United Kingdomrsquos rate slipped 3 points in the period down 91 percent
High-Tax Regimes
An examination of the tax data over this period indicates that despite cuts in corporate income tax rates there is a tendency for high-tax regimes to remain so as indicated in the comparison of regions around the world At top there are the G7 countries whose corporate income tax rates with the exception of the United Kingdom and France are all within a range of 4 percentage points The G7 average rate is 365 percent which is about 8 percentage points more than the OECD average and 11 percentage points higher than the average rate of the EU countries
Today the highest corporate income tax rate within the OECD is in Japan with a rate of 407 percent As is the case with Germany and most countries in the OECD Japan substantially reduced its tax rate during the 14-year period Japanrsquos 1997 rate stood at 516 percent which had been unchanged since 199 But in 1999 Japan reduced the rate to 48 percent and the following year the rate was cut again to 42 percent Todayrsquos rate of 407 percent represents a drop of slightly more than 22 percent since 1993
5
Second-ranked in terms of the highest corporate income tax rate today is the United States with a combined rate of 40 percent The United States was among the first countries to react to the large tax reduction in the United Kingdom reducing its corporate income tax rate in 1986 from 50 to 39 percent Before the reduction the United States had the second-highest corporate income tax rate within the G7 Only Germany imposed a higher tax burden with 56 percent at that time Since then the corporate income tax rate in the United States has changed only once when policymakers increased the rate by 1 percentage point in 1993 Since nearly all other countries reduced their taxes during the past decade the United States now faces increased economic competition especially since improved transport and communication links mean that corporations now have a greater choice than ever before of where to site their operations
copy 2006 KPMG International KPMG International is a Swiss cooperative of which all KPMG firms are members KPMG International provides no services to clients Each member firm is a separate and independent legal entity and each describes itself as such All rights reserved
8 C o r p o r a t e I n c o m e T a x R a t e
Corporate Tax Rates Comparison by Global Region
Perc
en
tag
e 38
326
381
45
34
38
271
30
257
365
285 28
20
25
30
35
40
45
50
All ASPAC EU G7 LAT OECD
5
1993 Avg Rate 2006 Avg Rate
Source KPMG International 2006
Notes for chart bull ASPAC 2 countries in 1993 19 in 2006
bull EU 15 countries in 1993 25 in 2006
bull LAT First year was 1995 with 1 country 19 in 2006
bull OECD 24 countries in 1993 30 countries in 2006
Budgetary Aspects
Despite its consistently high rates US corporate income tax has proved to be a relatively inefficient budgetary instrument Corporate income tax revenue in the United States only amounts to 2 percent of GDP (making it 26th by this measure in the OECD) and accounts for only 81 percent of all collected taxes (ranked 15th) in the United States in 2003
The countries that rely most on corporate income taxes are Luxembourg Norway and Australia however all of them have below-average corporate income tax rates4
In Germany corporate tax receipts account for 35 percent of all tax revenues and only 13 percent in relation to the GDP In fact countries with higher tax rates such as the United States Germany and Japan tend to have lower corporate tax collections as a percentage of GDP than the OECD average of 34 percent5
4 Chris Atkins and Scott A Hodge ldquoThe US Corporate Income Tax System Once a World Leader Now a Millstone Around the Neck of American Businessrdquo The Tax Foundation November 2005 No 136 available at httpwwwtaxfoundationorgnewsshow1175html
5 Chris Atkins and Scott A Hodge loc cit p4
copy 2006 KPMG International KPMG International is a Swiss cooperative of which all KPMG firms are members KPMG International provides no services to clients Each member firm is a separate and independent legal entity and each describes itself as such All rights reserved
9 A T r e n d A n a l y s i s
Thus a reduction in corporate income taxes might be a tax cut that more often than not will pay for itself A lower tax rate might initially reduce a corporationrsquos motivation to transfer taxable profits to low-tax regimes6 For example the enactment of the American Jobs Creation Act of 2004 which lowered repatriation taxes from 35 percent to 53 percent for one year showed that companies can be very sensitive to such tax offers During 2005 US companies according to a J P Morgan Chase evaluation repatriated approximately $300 billion which was far more than expected7
Low-Tax Regimes
Aside from countries such as the Cayman Islands and Bermuda which do not impose any corporate taxes on businesses several countries have adopted a low-tax policy over the period and have shown themselves to be attractive for foreign investments Poland reduced its tax rate from 38 percent in 1997 to 19 percent Cyprus has cut its rate from 28 percent to 10 percent and Hungaryrsquos rate stands at 16 percent
Perhaps the most remarkable example of a successful rate reduction is Ireland which slashed its rate from 40 percent in 1993 to 125 percent today This tax cut had a very positive effect on the Irish economy When Ireland joined the EU in 1973 its GDP was 60 percent of the average European GDP This year (2006) its GDP stands at 110 percent Additionally Ireland will this year become net contributor to the EU meaning that the country will pay more to the EU than it receives in grants and aid During the 1990s the Irish economy enjoyed growth rates of up to 12 percent and became a magnet for foreign capital and immigrants The growth of the Irish economy however has slowed to a more moderate 25 percent in recent years due to strong competition from Eastern Europe Nevertheless in 2003 Ireland still attracted foreign investments of $343 billion compared with $361 billion in Germany8
6 Martin A Sullivan ldquoA New Era in Corporate Taxationrdquo Tax Notes January 30 2006 p440-442 available at httptaxproftypepadcomtaxprof_blogfiles2006-1557-1pdf
7 Chris Atkins and Scott A Hodge loc cit 8 ldquoEU Newcomers Anger France Germany With Tax Cutsrdquo Bloombergcom June 1 2004 available at
httpwwwbloombergcomappsnewspid=10000085ampsid=aHHCzI1gwQkgamprefer=europe
copy 2006 KPMG International KPMG International is a Swiss cooperative of which all KPMG firms are members KPMG International provides no services to clients Each member firm is a separate and independent legal entity and each describes itself as such All rights reserved
1 0 C o r p o r a t e I n c o m e T a x R a t e
Similarly countries in Scandinavia have realized significant economic growth in part due to tax reductions As a group these northern European countries have an average tax rate of 256 percent which is only slightly higher than the European average However the Scandinavians have been quietly reducing their corporate income tax rates Denmark reduced its statutory tax rate from 50 percent to 30 percent in 1987 with an actual rate of 28 percent Sweden followed in 1992 when it reduced the tax rate from 51 percent to 25 percent with a slight rise to 2 percent today Norway heavily reformed its tax system in 1992 implemented a flat tax system and lowered the corporate tax rate from 52 to 28 percent which is still the actual rate
8
9 In 1993 Finland also slashed its corporate tax rate from 43 percent to 25 percent with a rate currently at 26 percent Iceland reduced its corporate tax rate in 2002 by 12 percentage points to 18 percent which is by far the lowest in Scandinavia and the third-lowest among the OECD countries10
Today there are five Scandinavian countries among the top 10 when measured by economic growth Finland is also leading the United States Denmark and Sweden in economic competitiveness11
Many factors influence economic growth and tax rate reductions may very well be one of those factors12 To quote Stefan Bach of the German Institute of Economic Development ldquoEven if a nexus between tax cuts and economic growth is not clear in theory and difficult to prove empirically the international experience shows countries that have lowered their corporate income tax had a positive economic developmentrdquo13
9 Recent Developments in the Norwegian Tax System Ministry of Finance Norway available at httpodindepnofin englishtopicsp4500279006041-990650dok-bnhtml
10 Martin A Sullivan loc cit 11 ldquoUSA im Schatten Finnlandsrdquo Sueddeutsche Zeitung October 30 2003 available at httpwwwsueddeutschede
wirtschaftartikel60420584 12 Peter Birch Sorensen ldquoNeutral Taxation of Shareholder Income A Norwegian Tax Reform Proposalrdquo p 5 13 Stefan Bach German Institute of Economic Development (DIW) ldquoRuettgers erzuernt Union und FDPrdquo Handelsblatt 8
August 2006 S 3
copy 2006 KPMG International KPMG International is a Swiss cooperative of which all KPMG firms are members KPMG International provides no services to clients Each member firm is a separate and independent legal entity and each describes itself as such All rights reserved
Theof atheconpro
Vis
copy 2netcliemebin
KPM
A T r e n d A n a l y s i s 1 1
Corporate Tax Rates 1993 - 2006
copy 2006 KPMG International KPMG International is a Swiss cooperative of which all KPMG firms are members KPMG International provides no services to clients Each member firm is a separate and independent legal entity and each describes itself as such All rights reserved
1 2 C o r p o r a t e I n c o m e T a x R a t e
copy 2006 KPMG International KPMG International is a Swiss cooperative of which all KPMG firms are members KPMG International provides no services to clients Each member firm is a separate and independent legal entity and each describes itself as such All rights reserved
33 33
OECDEuropean
UnionAsia -Pacific
Albania
Argentina 33 33 35
Aruba
Australia 33 33 36 36 36 36 36
Austria 39 34 34 34 34 34 34
Bangladesh 40 40 35
Barbados
Belgium 4017 4017 4017 4017 4017 4017 4017
Belize 35 35
Bolivia 25 25 25
Botswana
Brazil 25 25 33
Bulgaria
Canada 443 443 446 446 446 446 446
Cayman Islands
Chile 15 15 15
China 33 33 33
Colombia 35 35 35
Costa Rica 30 30
Croatia
Cyprus
Czech Republic 41 39 25 25 35
Denmark 34 34 34 34 34 34 32
Dominican Republic 25 25 25
Ecuador 32 3625 15
El Salvador 25 25 25
Estonia
Fiji 35 35 35
Finland 25 25 25 28 28 28 28
France 3333 3333 3666 3666 3666 4166 40
Germany 5967 5564 59 59 575 566 523
Greece 35 35 35 35 40 40 40
Guatemala 30 25 275
Honduras 4025 4025 25
Hong Kong 165 165 16
Hungary 18 18 18
Iceland 33 33 33 33 33 33 30
India 35 35 35
Indonesia 30 30 30
Ireland 40 40 38 38 36 32 28
Israel 36
Italy 522 522 532 532 532 4125 4125
Japan 524 524 516 516 516 516 48
Jamaica
Kazakhstan
OECDEuropean
UnionAsia - Pacific
LatinAmerica
Country1 Jan 93 1 Jan 94 1 Jan 95 1 Jan 96 1 Jan 97 1 Jan 98 1 Jan 99
() () () () () () ()
A T r e n d A n a l y s i s 1 3
copy 2006 KPMG International KPMG International is a Swiss cooperative of which all KPMG firms are members KPMG International provides no services to clients Each member firm is a separate and independent legal entity and eachdescribes itself as such All rights reserved
Albania 23 20
Argentina 35 35 35 35 35 35 35
35 Aruba 35 35
Australia 36 34 30 30 30 30 30
Austria 34 34 34 34 34 25 25
Bangladesh 35 35 35 30 30 30 30
Barbados 30 25
Belgium 4017 4017 4017 3399 3399 3399 3399
Belize 25 25
Bolivia 25 25 25 25 25 25 25
Botswana 25 25
Brazil 37 34 34 34 34 34 34
Bulgaria 15 15
Canada 446 421 386 366 361 361 361
Cayman Islands 0 0
Chile 15 15 16 165 17 17 17
China 33 33 33 33 33 33 33
Colombia 35 35 35 35 35 35 35
Costa Rica 36 30 30 30
Croatia 20 20 2032 2032 2032 2032
Cyprus 28 28 1500 1500 10 10
Czech Republic 31 31 31 31 28 26 24
Denmark 32 30 30 30 30 28 28
Dominican Republic 25 25 25 25 25 25 30
Ecuador 25 3625 3625 3625 3625 25 25
El Salvador 25 25 25 25 25
Estonia 24 23
Fiji 35 34 32 32 31 31 31
Finland 29 29 29 29 29 26 26
France 3666 3533 3433 3433 3433 3383 3333
Germany 516 3836 3836 3958 3829 3831 3834
Greece 40 375 35 35 35 32 29
Guatemala 25 31 31 31 31
Honduras 25 25 25 25 25 30 30
Hong Kong 16 16 16 16 175 175 175
Hungary 18 18 18 18 16 16 16
Iceland 30 30 18 18 18 18 18
India 385 3955 357 3675 35875 365925 3366
Indonesia 30 30 39 30 30 30 30
Ireland 24 20 16 125 125 125 125
Israel 36 36 36 36 36 34 31
Italy 4125 4025 4025 3825 3725 3725 3725
Japan 42 42 42 42 42 4069 4069
Jamaica 3333 3333
Kazakhstan 30 30
- c
LatinAmerica
Country1 Jan 00 1 Jan 01 1 Jan 02 1 Jan 03 1 Jan 04 1 Jan 05 1 Jan 06
() () () () () () ()
1 4 C o r p o r a t e I n c o m e T a x R a t e
OECDEuropean
UnionAsia Pacifi
Korea Republic of 308 308 308
Latvia
Lithuania
Luxembourg 3939 3939 4029 4029 3034 3745 3745
Macau
Malaysia 30 28 28
Malta
Mauritius
Mexico 34 34 35
Mozambique
Netherlands 35 35 35 35 35 35 35
Netherlands Antilles
New Zealand 33 33 33 33 33 33 33
Norway 28 28 28 28 28 28 28
Oman
Pakistan 30 30 35
Panama 37 37 37
Papua New Guinea 25 25 25
Paraguay 30 30 30
Peru 30 30 30
Philippines 35 34 33
Poland 38 36 34
Portugal 396 396 396 396 396 374 374
Romania
Russia
Singapore 26 26 26
Slovak Republic
Slovenia
South Africa
Spain 35 35 35 35 35 35 35
Sri Lanka 35 35 35
Sweden 30 28 28 28 28 28 28
Switzerland 285 285 285 285 285 275 251
Taiwan 25
Thailand 30 30 30
Tunisia
Turkey 4922 428 44 44 44 44 33
Ukraine
United Arab Emirates
United Kingdom 33 33 33 33 31 31 31
United States 40 40 40 40 40 40 40
Uruguay 30
Venezuela 34
Vietnam 35 35 35
Zambia
OECDEuropean
UnionAsia - Pacific
LatinAmerica
Country1 Jan 93 1 Jan 94 1 Jan 95 1 Jan 96 1 Jan 97 1 Jan 98 1 Jan 99
() () () () () () ()
Avg Corporate tax rate 380 373 377 377 332 329 321
Number of countries 24 24 26 26 57 57 60
copy 2006 KPMG International KPMG International is a Swiss cooperative of which all KPMG firms are members KPMG International provides no services to clients Each member firm is a separate and independent legal entity and each describes itself as such All rights reserved
A T r e n d A n a l y s i s 1 5
Avg 320 314 307 300 289 272 271
Num 60 66 66 71 71 86 86
Korea Republic of 308 308 297 297 297 275 275
Latvia 15 15
Lithuania 15 15
Luxembourg 3745 3745 3038 3038 3038 3038 2963
Macau 12 12
Malaysia 28 28 28 28 28 28 28
Malta 35 35
Mauritius 25 25
Mexico 35 35 35 34 33 30 29
Mozambique 32 32
Netherlands 35 35 345 345 345 315 296
Netherlands Antilles 345 345
New Zealand 33 33 33 33 33 33 33
Norway 28 28 28 28 28 28 28
Oman 12 12
Pakistan 43 3465 35 35 35 35 35
Panama 37 37 37 30 30 30 30
Papua New Guinea 25 25 25 30 30 30 30
Paraguay 30 30 30 30 30
Peru 30 30 30 27 30 30 30
Philippines 32 32 32 32 32 32 35
Poland 30 28 28 27 19 19 19
Portugal 374 352 33 33 275 275 275
Romania 25 25 25 25 16 16
Russia 43 24 24 24 24 24
Singapore 26 255 245 22 22 20 20
Slovak Republic 29 25 25 19 19 19
Slovenia 25 25
South Africa 378 378 378 378 378 369
Spain 35 35 35 35 35 35 35
Sri Lanka 35 35 42 35 35 325 325
Sweden 28 28 28 28 28 28 28
Switzerland 251 247 245 241 241 213 29
Taiwan 25 25 25 25 25 25 25
Thailand 30 30 30 30 30 30 30
Tunisia 33 33 35 35
Turkey 33 33 33 30 25 30 30
Ukraine 30 30 30 30 25 25
United Arab Emirates 40 40 2055 2055
United Kingdom 30 30 30 30 30 30 30
United States 40 40 40 34 34 40 40
Uruguay 30 32 28 30 30
Venezuela 34 34 34 34 34 34 34
Vietnam 325 32 32 32 28 28 28
Zambia 35 35
- c
LatinAmerica
Country1 Jan 00 1 Jan 01 1 Jan 02 1 Jan 03 1 Jan 04 1 Jan 05 1 Jan 06
() () () () () () ()
copy 2006 KPMG International KPMG International is a Swiss cooperative of which all KPMG firms are members KPMG International provides no services to clients Each member firm is a separate and independent legal entity and each describes itself as such All rights reserved
kpmgcom
KPMG International is a Swiss cooperative that serves as a coordinating entity for a network of independent member firms KPMG International provides no audit or other client services Such services are provided solely by member firms in their respective geographic areas KPMG International and its member firms are legally distinct and separate entities They are not and nothing contained herein shall be construed to place these entities in the relationship of parents subsidiaries agents partners or joint venturers No member firm has any authority (actual apparent implied or otherwise) to obligate or bind KPMG International or any member firm in any manner whatsoever or vice versa
The information contained herein is of a general nature and is not intended to address the circumstances of any particular individual or entity Although we endeavor to provide accurate and timely information there can be no guarantee that such information is accurate as of the date it is received or that it will continue to be accurate in the future No one should act on such information without appropriate professional advice after a thorough examination of the particular situation
Contact details
If you have any queries in relation to
KPMGs Corporate Tax Rate Survey
please contact us on
gofmicttaxratesurveykpmgcom
copy 2006 KPMG International KPMG International is a Swiss cooperative of which all KPMG firms are members KPMG International provides no services to clients Each member firm is a separate and independent legal entity and each describes itself as such All rights reserved KPMG and the KPMG logo are registered trademarks of KPMG International a Swiss cooperative Publication name Corporate Income Tax Rate - A Trend Analysis Publication number 304-250 Publication date October 2006
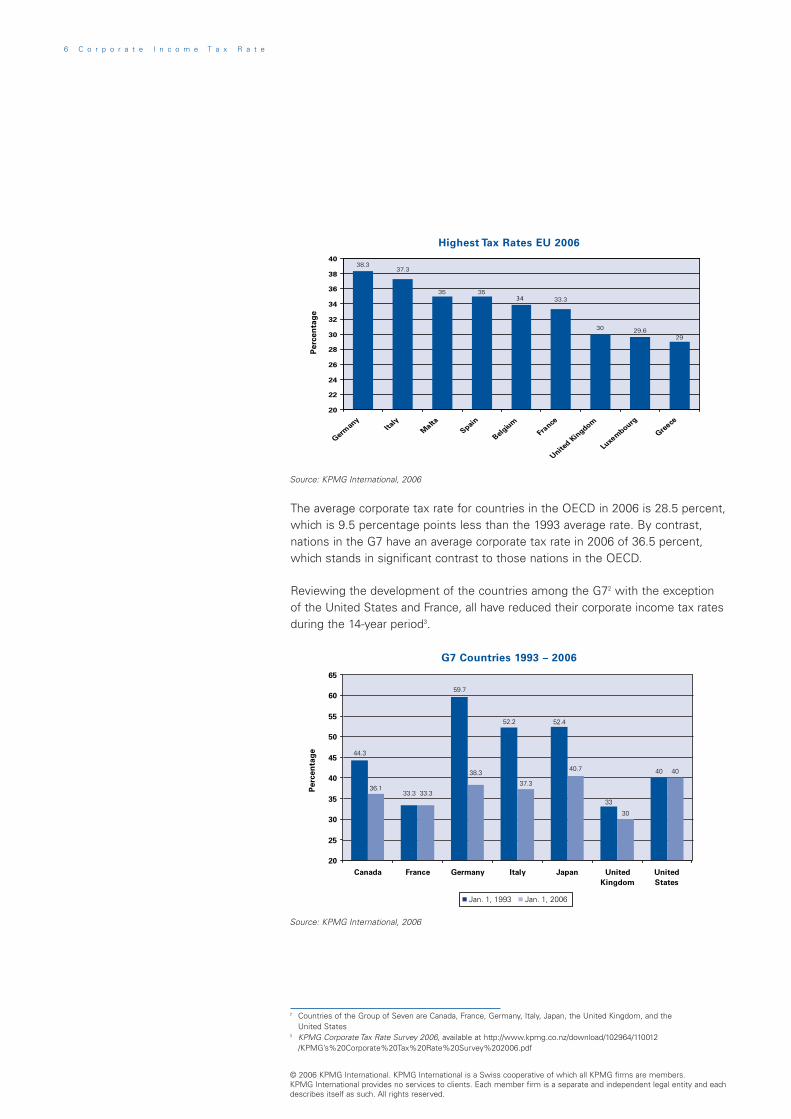