Embed Size (px)
Citation preview

KPMG.co.za

© 2016 KPMG Services Proprietary Limited, a South African company and a member firm of the KPMG network of independent member firms affiliated with KPMG International
Cooperative (“KPMG International”), a Swiss entity. All rights reserved. Printed in South Africa. KPMG and the KPMG logo are registered trademarks of KPMG International Cooperative
(“KPMG International”), a Swiss entity.
2
This report is intended as a supplement to the KPMG Survey of Corporate Responsibility Reporting 2015.
The information presented in this report is primarily intended to provide a snapshot of certain trends in current South African corporate
responsibility (CR) Reporting to business leaders, CR/sustainability professionals, investors and other interested parties. Based on KPMG South
Africa’s professional review of publically available CR reports of South Africa’s top 100 companies (by revenue), this report aims to reflect on and
highlight trends, drivers and gaps as well as offering insights on the business implications so that companies may be able to improve the quality of
their reports.
The KPMG (International) Survey of Corporate Responsibility
Reporting 2015 recently published is the ninth edition of this series
which reflects the current state of non-financial reporting worldwide.
Forty-five KPMG member firms around the world reviewed the CR
reports of the top 100 companies (termed the ‘N100’) in their
respective countries, and completed a set of questions. In addition, a
further questionnaire was completed regarding the CR reporting of
the world’s 250 largest companies by revenue (termed the ‘G250’).
While KPMG South Africa participated in the 2015 KPMG
(International) Survey it also conducted a detailed review of the CR
Reporting in South Africa (through completing the same
questionnaire used in the G250 review) which allowed for interesting
benchmarks.
The most recent publically available documents were used and no
direct contact was made with any companies. The information was
extracted from annual reports, integrated/CR reports and company
websites. Reports published in 2014/2015 that related to the
2013/2014 reporting year were used to conduct the research and
when available 2015 interim reports. Reports older than 2014 were
not included in the research. In the first instance, local reports were
used and if the company did not publish a local report then the group
report was used.

© 2016 KPMG Services Proprietary Limited, a South African company and a member firm of the KPMG network of independent member firms affiliated with KPMG International
Cooperative (“KPMG International”), a Swiss entity. All rights reserved. Printed in South Africa. KPMG and the KPMG logo are registered trademarks of KPMG International Cooperative
(“KPMG International”), a Swiss entity.
4
Financial
Services
28%
Retailers
12%
Manufacturin
g
17%
Commodities
14%
Telecoms & IT
6%
Medical
5%
Entertainment
6%
Logistics &
Transportation
5%
Construction
& Materials
7%
The South African 100 companies (SA N100) included in the survey
comprised of the sectors as shown in figure 1. Note that the
‘commodities’ sector includes companies in the mining and metals sector.
The information extracted from various reports were then analysed in
excel and are represented here using graphics. These graphics are
contextualised for the South African perspective and in some cases
comparative analysis was conducted using the results from the global
KPMG Survey of CR Reporting 2015 (the International G250 and
International N100 companies).
Figure 1. South African N100 companies – Industry segment
The KPMG (International) Survey on Corporate Responsibility Reporting 2015
KPMG’s global survey on Corporate Responsibility reporting is one the most
comprehensive reports on global trends in CR Reporting. Download the KPMG
(International) Survey of Corporate Responsibility Reporting 2015 here:
http://www.kpmg.com/CN/en/IssuesAndInsights/ArticlesPublications/Documents/kp
mg-survey-of-corporate-responsibility-reporting-2015-O-201511.pdf
Source: KPMG South Africa Corporate Responsibility Reporting Survey 2015 Base: 100 South African N100 companies
This report discusses the findings from the survey questions covering the
following topics:
Corporate Responsibility Reporting in South Africa
Risks and Opportunities
Materiality and Stakeholder Engagement
Targets and indicators
Transparency and Balance
External Assurance

© 2016 KPMG Services Proprietary Limited, a South African company and a member firm of the KPMG network of independent member firms affiliated with KPMG International
Cooperative (“KPMG International”), a Swiss entity. All rights reserved. Printed in South Africa. KPMG and the KPMG logo are registered trademarks of KPMG International Cooperative
(“KPMG International”), a Swiss entity.
5
Corporate Responsibility and Integrated
Reporting is standard practice in South
Africa
South African companies are driven by
corporate responsibility risks as well as
opportunities
Social risks put South African companies in
a different position to other global companies
Disclosure of materiality processes needs
progress
South African companies’ reporting on
stakeholder inclusivity and
responsiveness is in line with the global
top companies, but can still improve
Definitions and consistency of indicators, and
allocating timeframes to targets could be
improved
Intensity metrics inconsistent across companies
Balanced reporting is more common in South
African corporate responsibility reporting than in the
global top companies
External assurance of CR information is more
common in the global top companies than in the
South African top companies

© 2016 KPMG Services Proprietary Limited, a South African company and a member firm of the KPMG network of independent member firms affiliated with KPMG International
Cooperative (“KPMG International”), a Swiss entity. All rights reserved. Printed in South Africa. KPMG and the KPMG logo are registered trademarks of KPMG International Cooperative
(“KPMG International”), a Swiss entity.
6
Corporate Responsibility and Integrated Reporting is standard practice in South Africa
Figure 2. Corporate Responsibility reporting rate for South Africa in comparison to Global rates.
*Global rates are derived from the KPMG Survey of Corporate Responsibility Reporting 2015
19%
36%
97%
99%
83% 9
5%
93%
92%
53% 64%
71%
73%
2 008 2011 2013 2015
South Africa: N100 - Integrated report
International: G250
International: N100
The awareness and support of the International Integrated Reporting <IR> framework by major South African listed companies is high. In South
Africa all JSE listed companies are required, on an apply or explain basis, to produce an Annual Integrated Report as part of the recommended
principles and practices outlined in the King III Code of Corporate Governance since as early as February 2011. As a result, South Africa has led the
way in integrated reporting. The King IV Governance Code consultation draft will be released soon, we anticipate that its focus on integrated
reporting will remain. King IV is anticipated to become effective from mid-2017, after a robust consultation process.
The KPMG (International) Survey of CR Reporting 2015 found that
globally ‘Corporate Responsibility (CR) Reporting is standard practice
and growth has continued between 2013 and 2015, although the rate
of growth has slowed down’.
CR Reporting in South Africa is standard business practice with a 99%
CR and Integrated reporting rate (in the South African N100
companies), even higher than the G250 companies (as shown in
Figure 2.). Results from the KPMG International survey highlighted
South Africa as being placed fourth behind India, Indonesia and
Malaysia respectively for having the highest CR growth rate globally.
Global rates are derived from the KPMG Survey of Corporate Responsibility Reporting 2015, Base: N100/G250 companiesSource: KPMG South Africa Corporate Responsibility Reporting Survey 2015, Base: 100 South African N100 companies

Based on our experience companies are beginning to see that
integrated reporting can assist them to unlock value, through
identifying and strategically responding to the most material
impacts on their business that threaten or enhance value
creation into the long term. Integrated reporting is purpose-
built reporting, it enables businesses to make informed timely
decisions and ensures that underlying processes are fit for
purpose
With regards to the reporting frameworks used in CR
reporting, the 2015 research found that Global Reporting
Initiative (GRI) remained the most commonly used reporting
framework, in both the G250 companies as well as the South
African N100 companies.

© 2016 KPMG Services Proprietary Limited, a South African company and a member firm of the KPMG network of independent member firms affiliated with KPMG International
Cooperative (“KPMG International”), a Swiss entity. All rights reserved. Printed in South Africa. KPMG and the KPMG logo are registered trademarks of KPMG International Cooperative
(“KPMG International”), a Swiss entity.
8
Businesses, across all sectors, are becoming more and more aware of
the global, sustained and macro-economic forces that impact
business, economies and societies; such as climate change, water
scarcity and population growth. By staying informed of these
megaforces and their implications on themselves and their suppliers
and customers, companies are able to better assess the risks and
opportunities presented.
Of the South African N100 company reports reviewed 80% identified
some global megaforces that impact their business. Of these, climate
change, energy and fuel and water scarcity are the most commonly
listed (as shown in Figure 3.).
We noted that in the South African N100 companies the commodities,
manufacturing, financial services and retail sectors included
discussions of the highest number of the megaforces in their
reporting.
Sustainable businesses need to stay informed of the megaforces and
consider the short, medium and long term possible impacts on the
business. Practically this will include:
Stakeholder engagement: working with stakeholders to ensure
business plans are in place
Assess the cost of externalities: Consider ways to reduce costs
through the current externalities ahead of your competitors
Transparent reporting: Be accountable and transparent to your
stakeholders
3
7
9
14
16
17
20
22
28
31
38
52
58
Ageing Population
Deforestation
Urbanization
Food security
Other
Population growth
Ecosystem Decline
Wealth
Health
Material resource scarcity
Water scarcity
Energy and fuel
Climate Change
Trends affecting
South African N100
Companies
Figure 3. Number of times the South African N100 companies
discussed the global environmental and social megaforces as
affecting their business
Risks and Opportunities
Source: KPMG South Africa Corporate Responsibility Reporting Survey 2015Base: 100 South African N100 companies

© 2016 KPMG Services Proprietary Limited, a South African company and a member firm of the KPMG network of independent member firms affiliated with KPMG International
Cooperative (“KPMG International”), a Swiss entity. All rights reserved. Printed in South Africa. KPMG and the KPMG logo are registered trademarks of KPMG International Cooperative
(“KPMG International”), a Swiss entity.
9
Regarding the reporting of opportunities and risks both the South
African N100 companies and international G250 reports identify more
opportunities than risks when reporting on the megaforces. This
shows the understanding and value given to sustainability as it is seen
as both a risk factor and a value driver.
Of the risks identified by the South African N100 companies,
regulatory and social risks are the most commonly discussed whereas
physical and regulatory risks are most commonly discussed in the
G250 companies. Innovation and learning is the opportunity identified
most commonly by both the South African N100 and the international
G250 companies.
A risk that emerges as unique to the South African context is that of
social risk. This is to say that for South African companies, social
stability and good relations with all stakeholders, including employees,
unions, and local communities is of integral importance in ensuring
the ongoing operation of the business by avoiding labour or
community unrest. Therefore, it is important for business to
understand the impact being made on its surrounding community as
well as society in general, and also the micro and macro socio-
economic factors which may affect these groups and, in turn, the
business itself.
In a country where historical racial and class divides remain
significant, and economic progress and inclusion have not reached a
large proportion of society, business is seen to be critically involved in
creating a more fertile economic environment. This places the private
sector under pressure to play a role in creating positive change, and
means that they are accountable to South African society for doing
so.
As an example, the mining industry, on which the South African
economy places great reliance, is experiencing particularly difficult
times amidst low commodity prices, a weak currency and growing
pressure from a range of stakeholders including local government,
labour, communities and shareholders. In business terms, this
pressure translates to a need to ensure that decisions being made are
those that contribute to sustainable businesses, communities and
economies, in order that investments are not being wasted and
decisions are being made which are likely to support the continuation
of the business’s right to operate (both from a regulatory and social
licence to operate point of view). The channel through which the
license to operate in the Mining Industry predominantly flows is that
of the Social and Labour Plans (SLPs). In order to secure their
regulatory license to operate, mines are required to commit significant
financial resources towards a number of areas aimed at the upliftment
of their communities, and South African society more generally.
These range from skills development to ownership, local economic
development to preferential procurement (amongst many others) and
are areas if addressed thoughtfully and strategically, are able to go a
long way in securing the mine’s social license to operate as well.
South African companies are driven by corporate responsibility risks as well as opportunities.
Social risks put South African companies in a different position to other global companies.
Figure 4. Reporting of Corporate Responsibility as a risk and/or
opportunity
Risks and Opportunities
South African
N100 companies
International G250
companies
risks (%)1
65 83
opportunities (%)2
78 85
Global rates are derived from the KPMG Survey of Corporate Responsibility Reporting 2015, Base: 230 G250 companies that report on CR Source: KPMG South Africa Corporate Responsibility Reporting Survey 2015, Base: 100 South African N100 companies, footnotes included on pages 10 and 11

© 2016 KPMG Services Proprietary Limited, a South African company and a member firm of the KPMG network of independent member firms affiliated with KPMG International
Cooperative (“KPMG International”), a Swiss entity. All rights reserved. Printed in South Africa. KPMG and the KPMG logo are registered trademarks of KPMG International Cooperative
(“KPMG International”), a Swiss entity.
10
1: Six types of CR risk KPMG has identified six key types of risks companies face from social and environmental megaforces.
For this report, member firms’ professionals reviewed G250 CR reports to find out what types of risks large companies are identifying.
KPMG International,ExpecttheUnexpected, February 2012. kpmg.com/expecttheunexpected
Risks and Opportunities
Physical
Damage to assets and
supply chains from
physical impacts such as
storms, floods, water
shortages and sea-level
rise.
Competitive
Impacts of fast-changing
market dynamics, and
uncertainty of supply and
price volatility of key
inputs.
Regulatory
Complex and rapid
changes to the regulatory
landscape.
Social
Conflicts, social unrest,
community and worker
protests, labour shortages,
migration, etc.
Reputational
Damage to corporate
reputation from being
seen to do the wrong
thing.
Legal
Exposure to potential legal
action, for example, over
non-disclosure of
environmental, social and
governance information.

Risks and Opportunities
2: KPMG identified several opportunities from social
and environmental megaforces. These are:
innovation (e.g. new products or services) and
learning;
improve employee motivation;
reduce/manage risks;
access to capital or increased shareholder value;
improve reputation or brand (e.g. strengthened
consumer relationships);
improve market position (market share);
strengthen supplier relationships;
cost savings;
improved relationships with
governmental/regulators.

© 2016 KPMG Services Proprietary Limited, a South African company and a member firm of the KPMG network of independent member firms affiliated with KPMG International
Cooperative (“KPMG International”), a Swiss entity. All rights reserved. Printed in South Africa. KPMG and the KPMG logo are registered trademarks of KPMG International Cooperative
(“KPMG International”), a Swiss entity.
12
Disclosure of materiality processes needs progress
Our survey showed that the majority of the G250 and the South
African N100 companies do present their material issues. However,
only 44% of the N100 South African companies showed a clear link
between stakeholder views and the material issues identified. In
addition, as shown in figure 5, many companies in the G250 as well as
the South African N100 do not disclose how often a materiality
assessment is conducted.
Figure 5. Frequency of materiality assessments in the SA
N100 and G250 companies
South African companies’ reporting on stakeholder
inclusivity and responsiveness is relatively in line with
the global top companies, but can still improve
Figure 6 shows that in comparison to the G250 companies, South
African companies more commonly report on the process followed for
stakeholder engagement. Only 53% and 63% of the South African
N100 and the G250 companies respectively provided clear
explanations of how the companies report on actions in response to
stakeholder feedback (figure 7.).
Figure 6. % Responses in the SA N100 and G250 regarding
whether there is a reported process for stakeholder identification
and engagement
Materiality and
Stakeholder Engagement
*Global rates are derived from the KPMG Survey of Corporate Responsibility Reporting 2015, Base: 230 G250 companies that report on CR Source: KPMG South Africa Corporate Responsibility Reporting Survey 2015, Base: 100 South African N100 companies
15%
28%
12%
41%
20%
15%
10%
55%
O N G O I N G
B A S I S
S P E C I F I E D
I N T E R V A L S
I N F R E Q U E N T N O T S T A T E D
% SA N100 % G250
69%
22%
9%
66%
12%
22%
C L E A R
E X P L A N A T I O N
G I V E N
L I M I T E D
D I S C U S S I O N
N O T R E P O R T E D
% SA N100 % G250
*Global rates are derived from the KPMG Survey of Corporate Responsibility Reporting 2015, Base: 230 G250 companies that report on CR Source: KPMG South Africa Corporate Responsibility Reporting Survey 2015, Base: 100 South African N100 companies

© 2016 KPMG Services Proprietary Limited, a South African company and a member firm of the KPMG network of independent member firms affiliated with KPMG International
Cooperative (“KPMG International”), a Swiss entity. All rights reserved. Printed in South Africa. KPMG and the KPMG logo are registered trademarks of KPMG International Cooperative
(“KPMG International”), a Swiss entity.
13
Figure 7. % Responses in the SA N100 and G250 regarding
whether the companies report on actions taken in response to
stakeholder feedback
Companies need a materiality process to identify and prioritize the
issues at the heart of their long term viability and to focus
management and reporting resources on these.
With the release of the Global Reporting Initiative’s (GRI) G4 Reporting
guidelines, materiality has become a more critical element in CR
Reporting, and has allowed companies to focus their reports on the
most significant risks and opportunities. The GRI G4 Guidelines list
materiality and stakeholder inclusiveness as two of the Reporting
Principles which are ‘fundamental to achieving transparency in
sustainability reporting and therefore should be applied by all
organizations when preparing a sustainability report’.
Stakeholder inclusiveness and materiality go hand-in-hand as
stakeholder insight on the relative importance of specific sustainability
issues should be considered when companies report on their
performance; but is also important in strategic planning and
operational management.
Materiality and
Stakeholder Engagement
* Stakeholder Inclusiveness Principle: The organization should identify its stakeholders, and explain how it has responded to their
reasonable expectations and interests. Stakeholders can include those who are invested in the organization as well as those who have other
relationships to the organization. The reasonable expectations and interests of stakeholders are a key reference point for many decisions in
the preparation of the report.
*Materiality Principle: The report should cover Aspects that:
Reflect the organization’s significant economic, environmental and social impacts; or
Substantively influence the assessments and decisions of stakeholders
Organizations are faced with a wide range of topics on which they could report. Relevant topics are those that may reasonably be considered
important for reflecting the organization’s economic, environmental and social impacts, or influencing the decisions of stakeholders, and,
therefore, potentially merit inclusion in the report. Materiality is the threshold at which Aspects become sufficiently important that they should
be reported.
*Global Reporting Initiative, G4 Sustainability Reporting Guidelines, Reporting principles and Standard disclosures
53%
23%
24%
63%
15% 2
2%
C L E A R
E X P L A N A T I O N
G I V E N
L I M I T E D
D I S C U S S I O N
N O T R E P O R T E D
% SA N100 % G250
*Global rates are derived from the KPMG Survey of Corporate Responsibility Reporting 2015, Base: 230 G250 companies that report on CR Source: KPMG South Africa Corporate Responsibility Reporting Survey 2015, Base: 100 South African N100 companies

© 2016 KPMG Services Proprietary Limited, a South African company and a member firm of the KPMG network of independent member firms affiliated with KPMG International
Cooperative (“KPMG International”), a Swiss entity. All rights reserved. Printed in South Africa. KPMG and the KPMG logo are registered trademarks of KPMG International Cooperative
(“KPMG International”), a Swiss entity.
14
Definitions and consistency of indicators and
allocating timeframes to targets could be improved
Our review of the South African N100 companies showed significant
variation in the type of sustainability performance indicators reported
on. It is common to see different definitions used for particular
indicators as well as inconsistencies in the indicators reported on
within sectors. Safety is a striking example of a lack of comparability
between companies. When reporting safety, any of the following
metrics are used:
Lost time injury frequency rate (LTIFR)
Total recordable injury frequency rate (TRIFR)
Medical treatment injury frequency rate (MTIFR)
It is common to see differences in the following:
calculation methods used (e.g. injury rates expressed as the
number of injuries per 1 000 000 hours worked, or 200 000 hours
worked)
definition of a lost time, recordable or medical treatment injury
When stakeholders, including investors, government and NGOs
benchmark companies they are likely to assume that metrics are
comparable, while in fact they may not be. Therefore it is very
important for companies to disclose their sustainability performance
information in a transparent manner so that readers are able to
analyse and understand the context of the data.
In addition, alignment and agreement within sectors on the form and
definition of particular key metrics should assist sector-wide reliable
comparisons and collaborations.
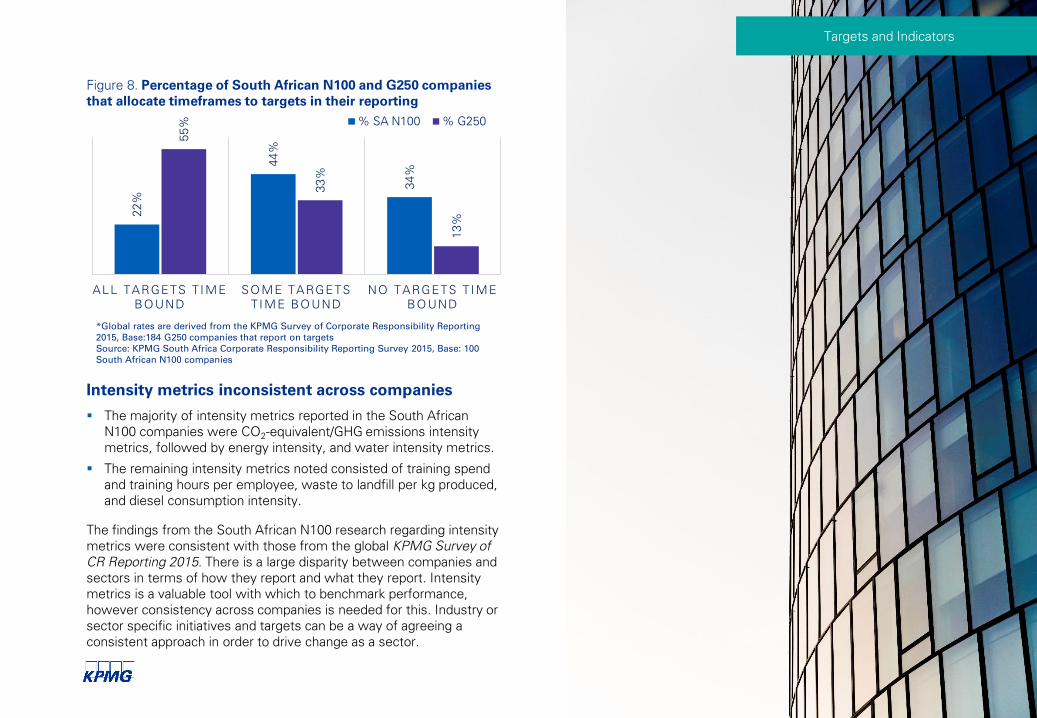
With regards to targets, our survey revealed a relatively high
proportion of the South African N100 companies reported on targets
which were not time bound (figure 8.). When targets are set (e.g.
reduce the carbon footprint by 15%) it is important to allocate a
timeframe or deadline in order to make the target finite; which
ultimately will hold a company accountable for its performance.
Targets and Indicators
Targets and Indicators
Figure 8. Percentage of South African N100 and G250 companies
that allocate timeframes to targets in their reporting
Intensity metrics inconsistent across companies
The majority of intensity metrics reported in the South African
N100 companies were CO2-equivalent/GHG emissions intensity
metrics, followed by energy intensity, and water intensity metrics.
The remaining intensity metrics noted consisted of training spend
and training hours per employee, waste to landfill per kg produced,
and diesel consumption intensity.
The findings from the South African N100 research regarding intensity
metrics were consistent with those from the global KPMG Survey of
CR Reporting 2015. There is a large disparity between companies and
sectors in terms of how they report and what they report. Intensity
metrics is a valuable tool with which to benchmark performance,
however consistency across companies is needed for this. Industry or
sector specific initiatives and targets can be a way of agreeing a
consistent approach in order to drive change as a sector.
22%
44%
34%
55%
33%
13%
ALL TARGETS T I ME
BO UND
SO ME TARGETS
T I ME BO UND
NO TARGETS T I ME
BO UND
% SA N100 % G250
*Global rates are derived from the KPMG Survey of Corporate Responsibility Reporting 2015, Base:184 G250 companies that report on targets Source: KPMG South Africa Corporate Responsibility Reporting Survey 2015, Base: 100 South African N100 companies

© 2016 KPMG Services Proprietary Limited, a South African company and a member firm of the KPMG network of independent member firms affiliated with KPMG International
Cooperative (“KPMG International”), a Swiss entity. All rights reserved. Printed in South Africa. KPMG and the KPMG logo are registered trademarks of KPMG International Cooperative
(“KPMG International”), a Swiss entity.
16
Balanced reporting is more common in South African
Corporate Responsibility reporting than in the global
top companies
Figure 9. Percentage responses of South African N100 and G250
companies when asked whether the report discusses
challenges/dilemmas/failures as well as achievements
Transparency in CR reporting is extremely important and the
commitment to publish non-financial information (whether positive or
negative) leads a company to ask itself important questions about its
performance. By reporting transparently on the entire range of
practices and products, as well as providing comparative data,
stakeholders may be able to obtain an understanding of the overall
impact of a company. When a company avoids disclosing discussion
of their challenges and failures the report becomes a marketing
document as opposed to a report intended for making informed
business decisions.
The survey results indicated that 45% of the South African N100
companies were deemed to have well balanced reports (reporting of
their successes as well as failures or challenges), in comparison to
34% of the G250 companies.
Transparency and Balance
45%
40%
14%
34% 37%
29%
A . D I S C U S S E S
C H A L L E N G E S A N D I S
W E L L B A L A N C E D
B . L I M I T E D
D I S C U S S I O N O F
C H A L L E N G E S
C . N O D I S C U S S I O N S
O F C H A L L E N G E S
% SA N100
*Global rates are derived from the KPMG Survey of Corporate Responsibility Reporting 2015, Base: 230 G250 companies that report on CR Source: KPMG South Africa Corporate Responsibility Reporting Survey 2015, Base: 100 South African N100 companies

Transparency and Balance
© 2016 KPMG Services Proprietary Limited, a South African company and a member firm of the KPMG network of independent member firms affiliated with KPMG International
Cooperative (“KPMG International”), a Swiss entity. All rights reserved. Printed in South Africa. KPMG and the KPMG logo are registered trademarks of KPMG International Cooperative
(“KPMG International”), a Swiss entity.
18
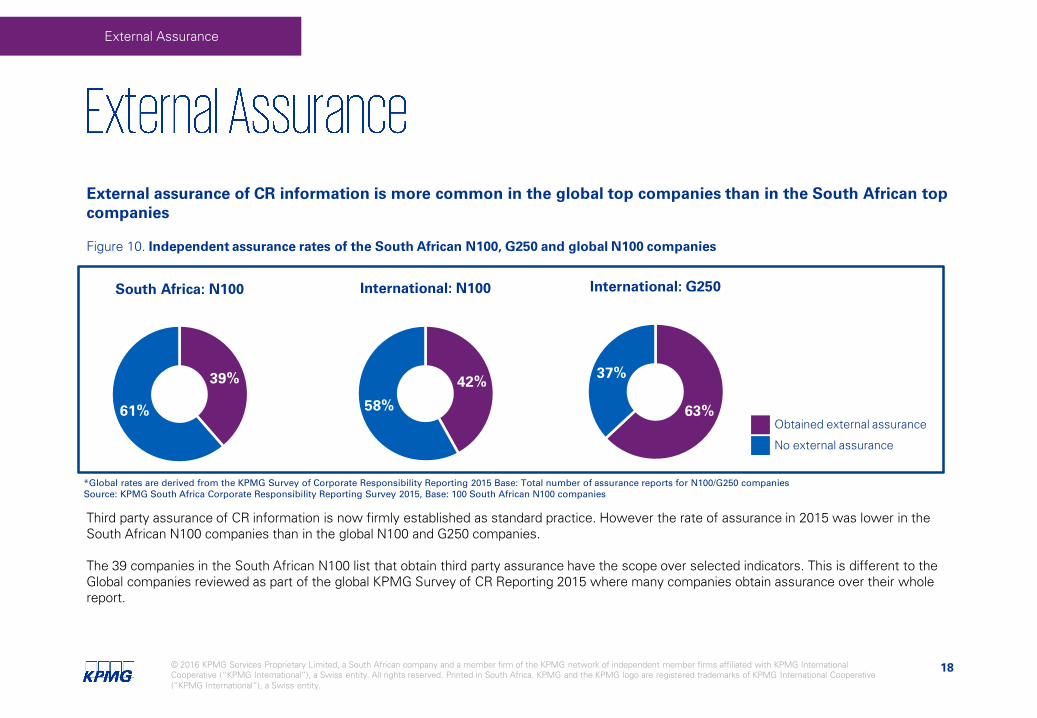
External assurance of CR information is more common in the global top companies than in the South African top
companies
Figure 10. Independent assurance rates of the South African N100, G250 and global N100 companies
Third party assurance of CR information is now firmly established as standard practice. However the rate of assurance in 2015 was lower in the
South African N100 companies than in the global N100 and G250 companies.
The 39 companies in the South African N100 list that obtain third party assurance have the scope over selected indicators. This is different to the
Global companies reviewed as part of the global KPMG Survey of CR Reporting 2015 where many companies obtain assurance over their whole
report.
External Assurance
39%
61%
South Africa: N100
63%
37%
International: G250
42%
58%
International: N100
Obtained external assurance
No external assurance
*Global rates are derived from the KPMG Survey of Corporate Responsibility Reporting 2015 Base: Total number of assurance reports for N100/G250 companies Source: KPMG South Africa Corporate Responsibility Reporting Survey 2015, Base: 100 South African N100 companies

© 2016 KPMG Services Proprietary Limited, a South African company and a member firm of the KPMG network of independent member firms affiliated with KPMG International
Cooperative (“KPMG International”), a Swiss entity. All rights reserved. Printed in South Africa. KPMG and the KPMG logo are registered trademarks of KPMG International Cooperative
(“KPMG International”), a Swiss entity.
19
Figure 11. Independent assurance providers of the South African N100, G250 and global N100 companies
Of the South African companies that do obtain assurance over their CR information, 70% of these opt for assurance from the major accountancy
organisations, higher than this rate in the global N100 and G250 companies (as shown in Figure 11).
Today's businesses need to be concerned about the accuracy and integrity of sustainability information and data which is reported to stakeholders
and used for strategic decision making. The growing demand for credible non-financial information is influenced by the attention and scrutiny it
receives on behalf of analysts, investors, consumers, business partners and even employees. The reputational risk of getting it wrong is significant,
both in terms of not managing the right risks or reporting inaccurate information.
As companies increasingly incorporate sustainability into their core business strategies, the importance of timely and accurate sustainability related
metrics increases.
70%
30%
South Africa: N100
64%
36%
International: N100
65%
35%
International: G250
External Assurance
Major accountancy
organisations
Other providers
*Global rates are derived from the KPMG Survey of Corporate Responsibility Reporting 2015, Base: Total number of assurance reports for N100/G250 companiesSource: KPMG South Africa Corporate Responsibility Reporting Survey 2015, Base: 100 South African N100 companies

© 2016 KPMG Services Proprietary Limited, a South African company and a member firm of the KPMG network of independent member firms affiliated with KPMG International
Cooperative (“KPMG International”), a Swiss entity. All rights reserved. Printed in South Africa. KPMG and the KPMG logo are registered trademarks of KPMG International Cooperative
(“KPMG International”), a Swiss entity.
20
KPMG is one of the pioneers of sustainability consulting – some KPMG member firms first offered sustainability services over 20
years ago – which gives KPMG’s network a level of experience few can match. Today, our member firms employ several hundred
sustainability professionals located in around 60 countries.
Local knowledge, global experience
Our global network means KPMG member firm professionals have in-depth understanding of the economic, political, environmental
and social landscapes wherever your organization may operate. At the same time, our member firms are closely connected through
our global Centre of Excellence. This means that, whatever challenge you face, we can put together a team with international
experience to help you.
Sustainability Plus
We don’t work in a sustainability vacuum. We work side-by-side with KPMG member firm professionals from tax, audit and
advisory including sector specialists, management consultants, tax accountants and experts in IT, supply chain, infrastructure,
international development and more. You won’t receive generic advice and one-size- fits all solutions, instead you can benefit from
a hand-picked multi- disciplinary team.
Results-driven
KPMG firms help clients to develop future-fit business strategies based on solid understanding of the issues. We strive to think big
and challenge convention, but also to find practical solutions that can create success and growth through change.
Foresight needs insight
Our global Centre of Excellence focuses on thought-provoking research, analysing drivers of global change and developing practical
business responses that you can apply within your own organisation.

The information contained herein is of a general nature and is not intended to address the circumstances of any particular individual or entity. Although we endeavor to provide
accurate and timely information, there can be no guarantee that such information is accurate as of the date it is received or that it will continue to be accurate in the future. No
one should act on such information without appropriate professional advice after a thorough examination of the particular situation.
2016 KPMG Services Proprietary Limited, a South African company and a member firm of the KPMG network of independent member firms affiliated with KPMG International
Cooperative (“KPMG International”), a Swiss entity. All rights reserved. Printed in South Africa. KPMG and the KPMG logo are registered trademarks of KPMG International
Cooperative (“KPMG International”), a Swiss entity.
Shireen Naidoo
+27 83 381 9235
Director
Climate Change & Sustainability Services
Neil Morris
+27 83 286 7194
Director
Climate Change & Sustainability Services