Embed Size (px)
Citation preview

Ingegneria dei Processi Aziendali
Ernesto Damiani
Università di Milano
KPI for BPE
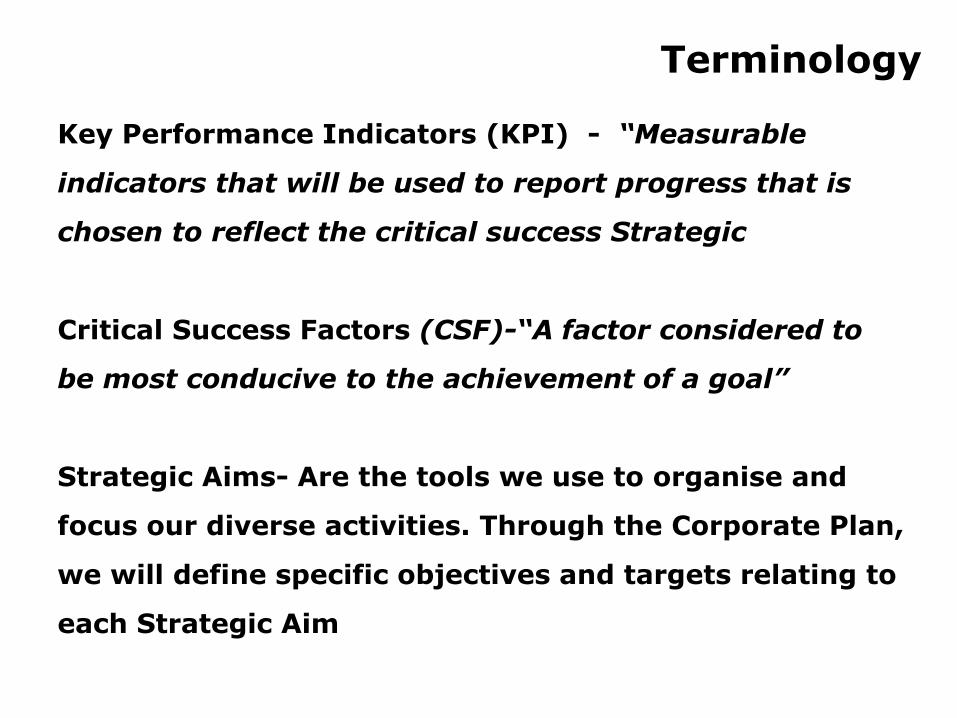
Terminology
Key Performance Indicators (KPI) - “Measurable
indicators that will be used to report progress that is
chosen to reflect the critical success Strategic
Critical Success Factors (CSF)-“A factor considered to
be most conducive to the achievement of a goal”
Strategic Aims- Are the tools we use to organise and
focus our diverse activities. Through the Corporate Plan,
we will define specific objectives and targets relating to
each Strategic Aim
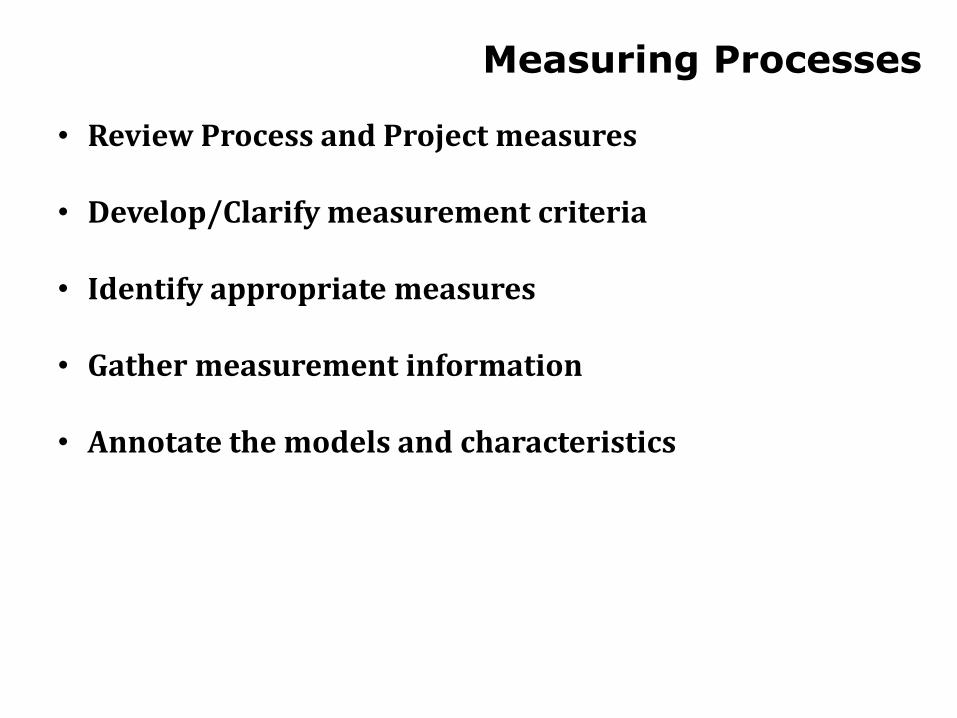
• Review Process and Project measures
• Develop/Clarify measurement criteria
• Identify appropriate measures
• Gather measurement information
• Annotate the models and characteristics
Measuring Processes

Process and Project goals and objectives will determine required
level of Measurement
Can be a mix of process model levels
Should at lease measure overall process performance
Details are required for incremental change, 80/20 tells where to drill
Measurement Granularity (Number of Measured Sub
Processes)
Significance of Process
Change
Identify Appropriate Measures

ProvideDeliveryService
Service Customer
Close TransactionGreet
Customer
Prepare Food
Schedule
Delivery
Deliver Order
Take Order
WHAT
HOW
HOW
Workflow
15-50%
10-15%
>100%
Days
Minutes/Hours
Minutes
Minutes/Seconds
Identify Appropriate Measurement Levels

• Key Performance Indicators• # of exceptions• on-time • number of
complaints
Objective Customer Satisfaction
Goals Eliminate non-value-added activities Improve the reliability of delivery- Reduce number of coupons given by 50% Simplify the process Improve cross-functional communication
Review KPIs and Project Objectives
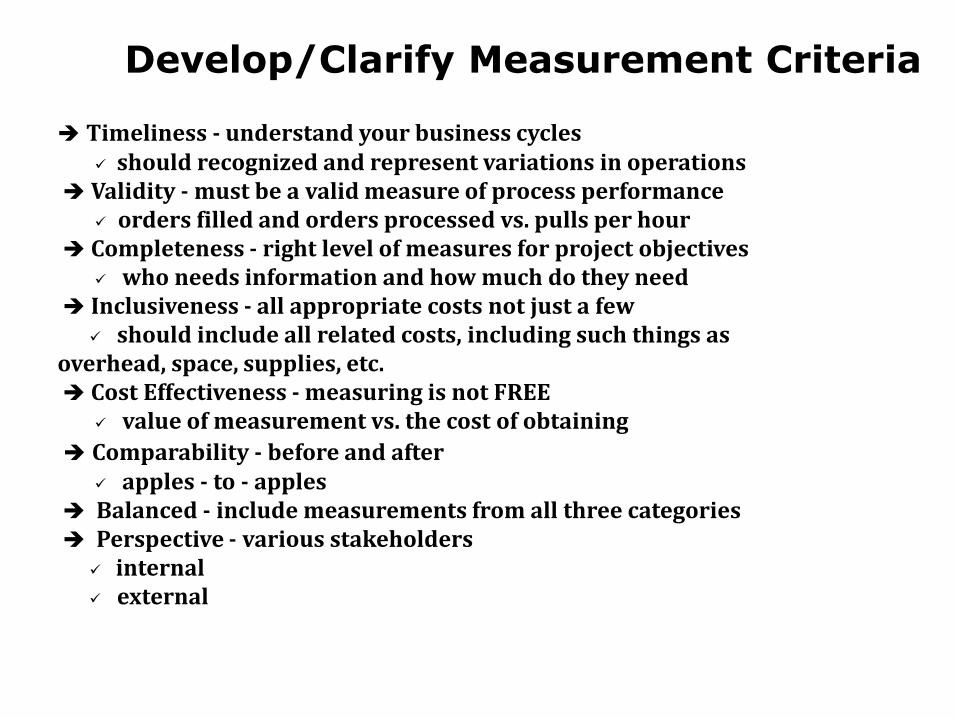
Timeliness - understand your business cycles should recognized and represent variations in operations
Validity - must be a valid measure of process performance orders filled and orders processed vs. pulls per hour
Completeness - right level of measures for project objectives who needs information and how much do they need
Inclusiveness - all appropriate costs not just a few should include all related costs, including such things as
overhead, space, supplies, etc. Cost Effectiveness - measuring is not FREE
value of measurement vs. the cost of obtaining
Comparability - before and after apples - to - apples
Balanced - include measurements from all three categories Perspective - various stakeholders
internal external
Develop/Clarify Measurement Criteria
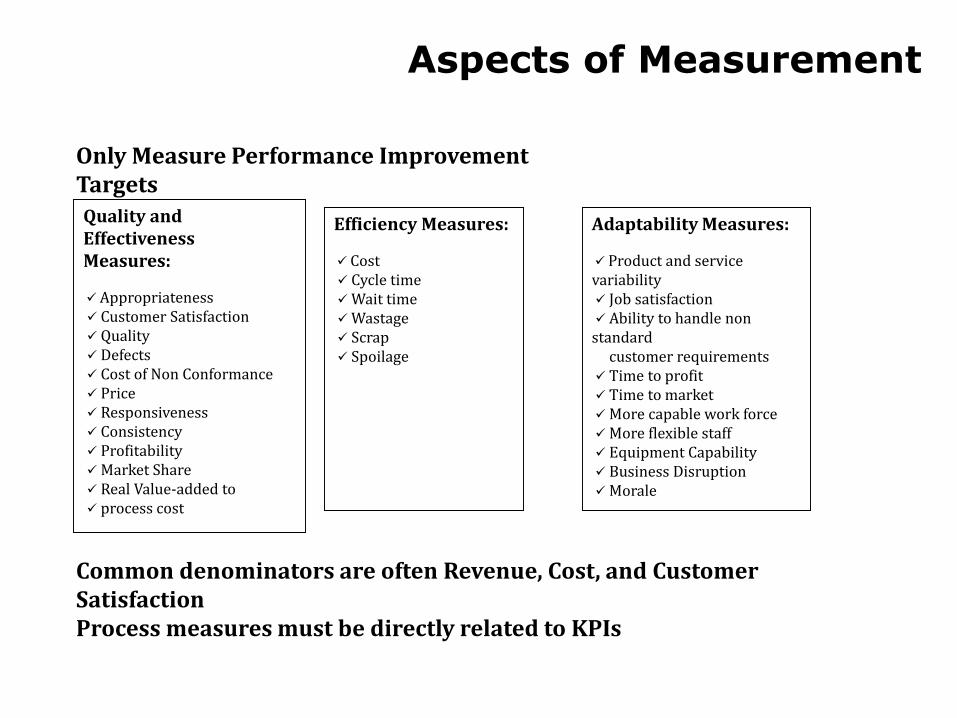
Only Measure Performance Improvement TargetsQuality and EffectivenessMeasures:
Appropriateness Customer Satisfaction Quality Defects Cost of Non Conformance Price Responsiveness Consistency ProfitabilityMarket Share Real Value-added to process cost
Efficiency Measures:
Cost Cycle timeWait timeWastage Scrap Spoilage
Adaptability Measures:
Product and service variability Job satisfaction Ability to handle non standard
customer requirements Time to profit Time to marketMore capable work forceMore flexible staff Equipment Capability Business DisruptionMorale
Common denominators are often Revenue, Cost, and Customer SatisfactionProcess measures must be directly related to KPIs
Aspects of Measurement

Run Workshops
Observe the Process Flow
Decompose and Prioritize Process Flows
Identify Evaluation Criteria for Quick Wins
Implement Quick Wins
Validating and Analyzing Processes
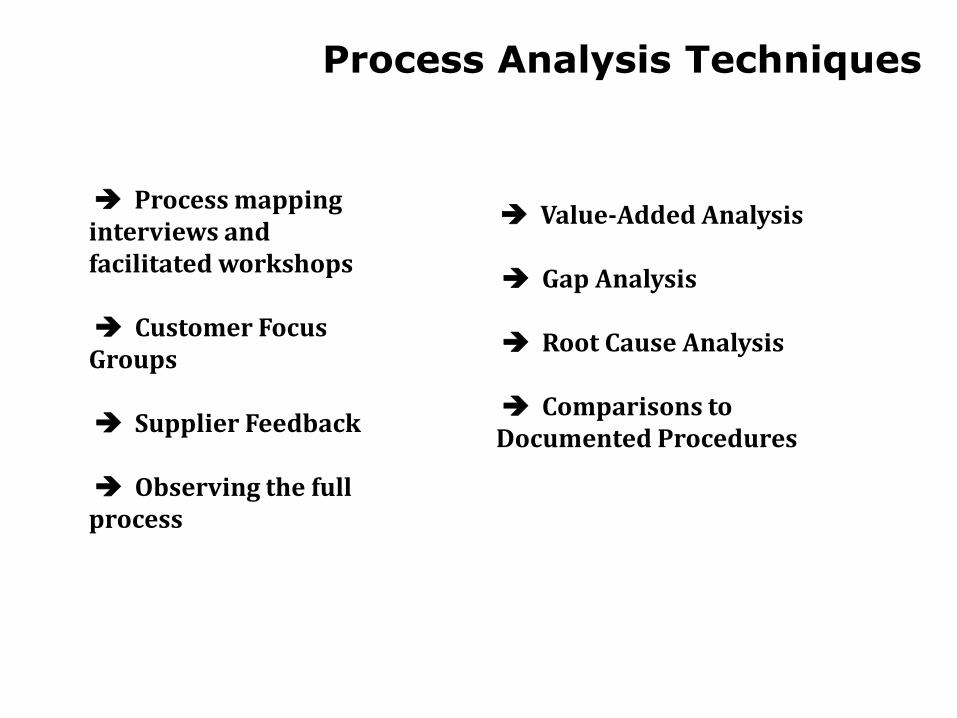
Process mapping interviews and facilitated workshops
Customer Focus Groups
Supplier Feedback
Observing the full process
Value-Added Analysis
Gap Analysis
Root Cause Analysis
Comparisons to Documented Procedures
Process Analysis Techniques

Capture Information/
Recognize Triggers
GUI
Smart Cards
PDAs
Self-Identifying Tags
Image Capture
Bar Coding
OCR
Speech Recognition
Phone/Fax
Biometrics
Wearable Computers
Provide Information for Decision Making andCustomer Service
Multimedia Knowledge Access Natural Language Information Retrieval Data Warehouse Geographic IS Expert Systems Electronic Books
Pass Control/Hand-off
EDI/edi IVRWorkflow ApplicationsWorkgroup Applications Documents/Forms/Images Internet/Intranet/Extranet xDSL (Generic Digital) Subscriber Line Cable Modems IP Telephony Internet Chat
Examine IT Enablers
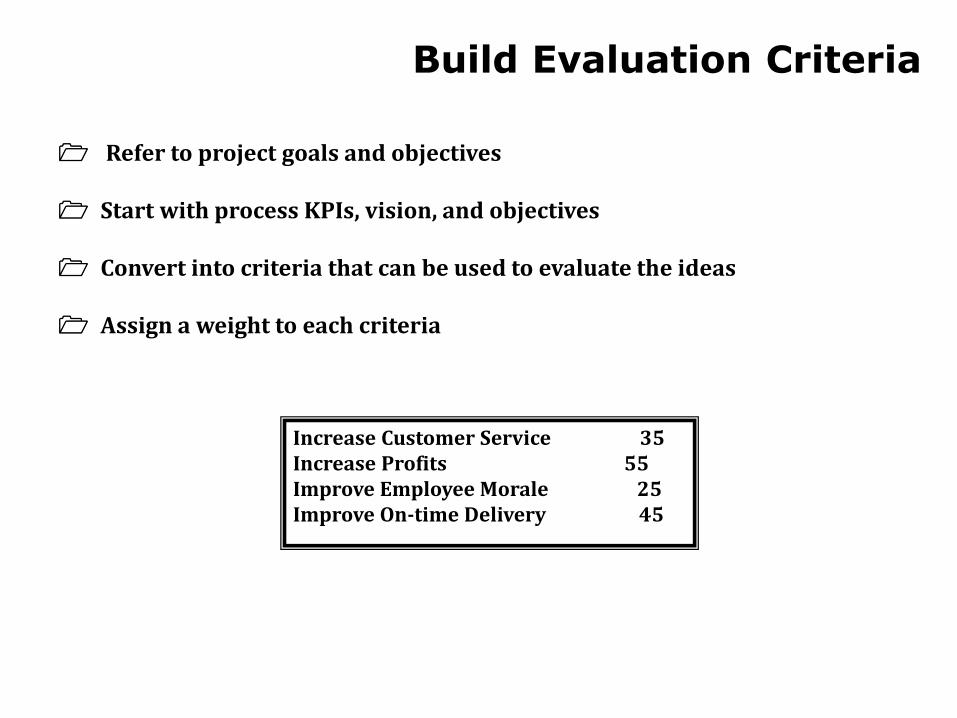
Refer to project goals and objectives
Start with process KPIs, vision, and objectives
Convert into criteria that can be used to evaluate the ideas
Assign a weight to each criteria
Increase Customer Service 35Increase Profits 55Improve Employee Morale 25Improve On-time Delivery 45
Build Evaluation Criteria
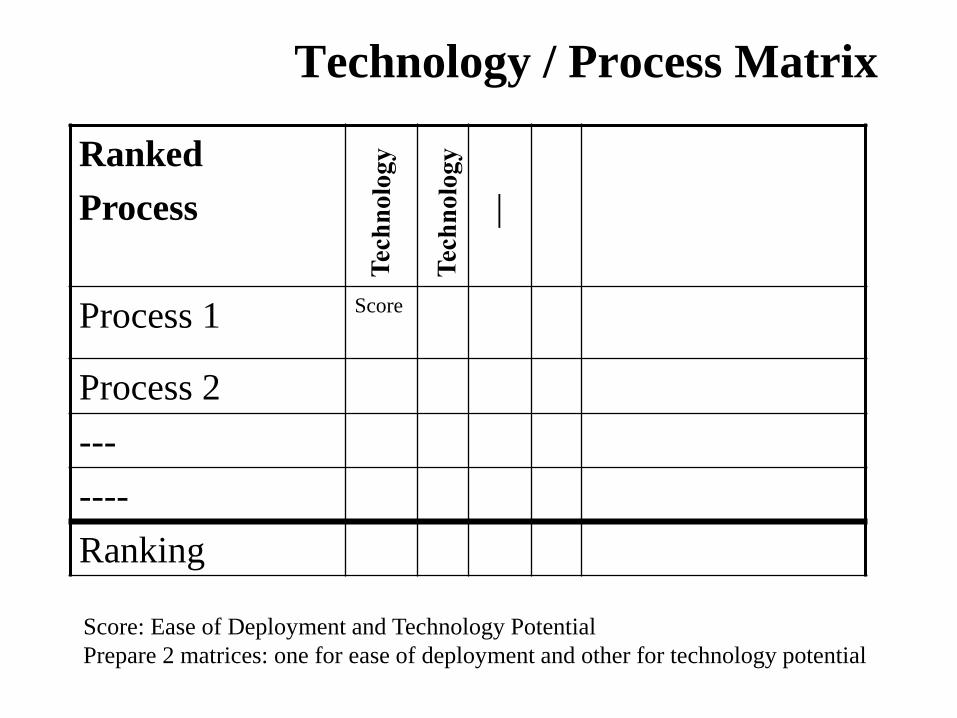
Technology / Process Matrix
Ranked
Process |
Process 1 Score
Process 2
---
----
Ranking
Score: Ease of Deployment and Technology Potential
Prepare 2 matrices: one for ease of deployment and other for technology potential
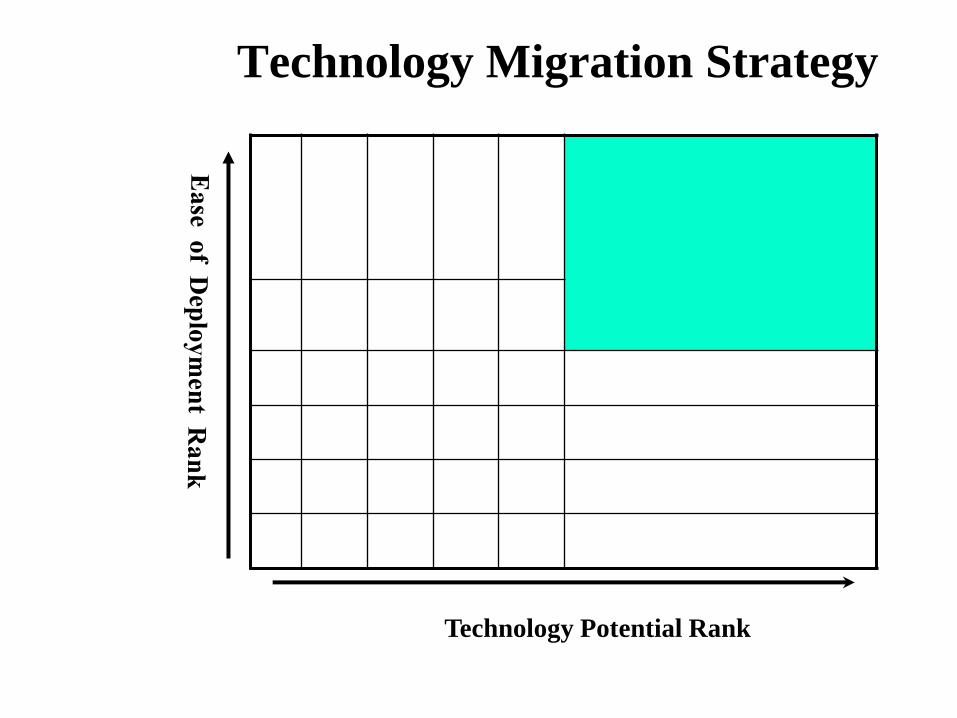
Technology Migration Strategy
Technology Potential Rank
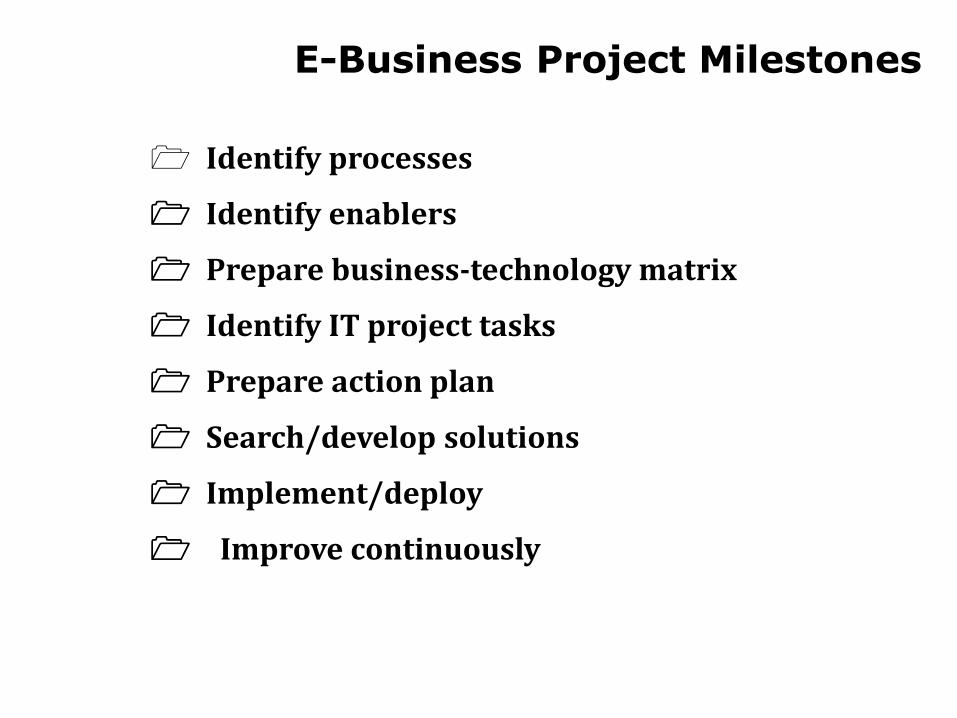
Identify processes
Identify enablers
Prepare business-technology matrix
Identify IT project tasks
Prepare action plan
Search/develop solutions
Implement/deploy
Improve continuously
E-Business Project Milestones
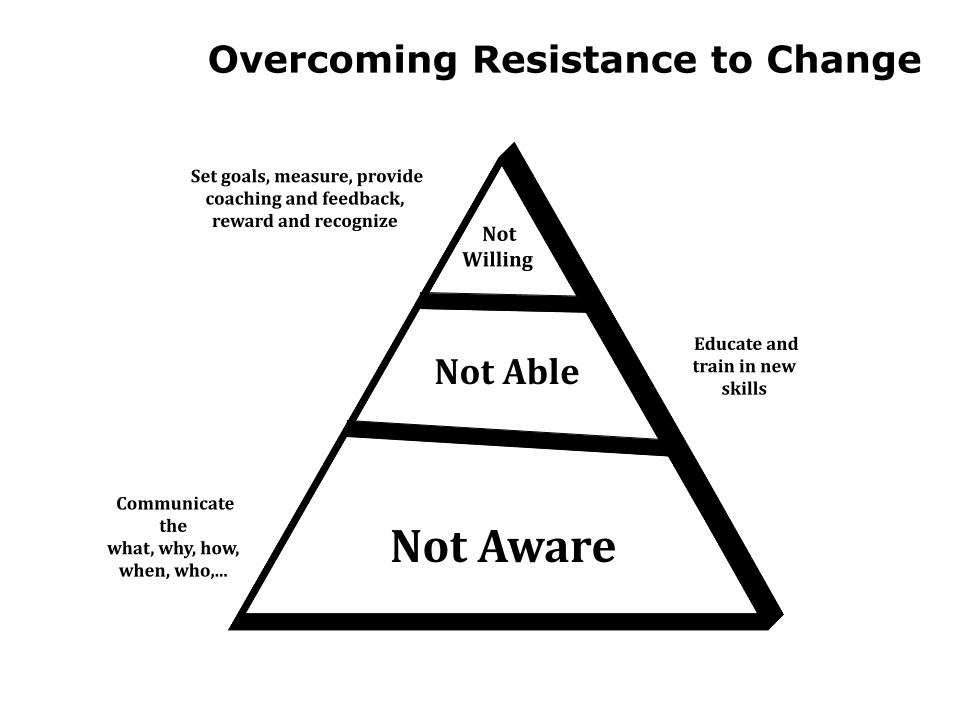
Set goals, measure, provide coaching and feedback, reward and recognize
Communicate the
what, why, how, when, who,...
Educate and train in new
skills
NotWilling
Not Able
Not Aware
Overcoming Resistance to Change
Key Performance Indicator
Generally there are two approaches
KPI based on Strategic themes
KPI Based on Critical success factors
They both drive from:
Objectives from strategic aims
Performance indicators flowing from objectives
Status and progress indicators
Year on year change indicators
Strategic Aims
Over the period Jan 2012 to Dec 2012 all
employers
are to demonstrate Continuous Improvement
in their
health and safety management performance
whilst
being benchmarked using a suitable
benchmarking tool.

What IS A KPI
A KPI (Key Performance Indicator) is simply a metric
that is tied to a target.
Most often, a KPI represents how far a metric is above or
below a pre-determined target.
KPI’s usually are shown as a ratio of actual to target and
are designed to instantly let a business user know if
they are on or off their plan without the end user
having to consciously focus on the metrics being
represented.
* Specific – It has to be clear what the KPI exactly measures. There has to be one widely-accepted definition of the KPI to make sure the different users interpret it the same way and, as a result, come to the same and right conclusions which they can act on.
* Measurable – The KPI has to be measurable to define a standard, budget or norm, to make it possible to measure the actual value and to make the actual value comparable to the budgeted value.
* Achievable – Every KPI has to be measurable to define a standard value for it. It is really important for the acceptance of KPI’s and Performance Management in general within the organization that this norm is achievable. Nothing is more discouraging than striving for a goal that you will never obtain.
SMART is an abbreviation for the five conditions of good KPI’s:

SMART is an abbreviation for the five conditions of good KPI’s:
• Relevant – The KPI must give more insight in the
performance of the organization in obtaining its
strategy. If a KPI is not measuring a part of the
strategy, acting on it doesn’t affect the organizations’
performance. Therefore an irrelevant KPI is useless.
* Time phased – It is important to express the value of
the KPI in time. Every KPI only has a meaning if one
knows the time dimension in which it is realized. The
realization and standardization of the KPI therefore
has to be time phased.
Critical Success Factors
Critical success factors – key issues requiring management attention
• Represent real issues faced “here and now”
Performance indicators relate to critical success factors not strategic aims –offers greater flexibility
• Critical success factors can be mapped to strategic aims
How To Achieve Success
• Identify areas of activity that require greater
attention
• Performance indicators that are grounded
(SMART)
• Striking a balance between a comprehensive
set of KPIs and information overload
Selecting Project Specific KPI
“What you measure is what you get.”(Kaplan and Norton, 1992).
KPI help define the achievement of theCSF
• Number depends on their comprehensivenessand importance of the CSF to overall projectsuccess.
• Do the KPIs provide YOU with a clear indication of progress to date and areas requiring greater attention?
• Strategic aims do not always lend themselves to measurement and require associated objectives
• No difficulty with objectives extracted from the Corporate Strategy but derived objectives may have no real ownership
Sources of potential KPI
Introduction of KPI’s
• Introduction of KPIs represents a major step forwards
• Enables YOU to understand where progress is being made towards achieving strategic aims and those areas which need to be addressed
• The management review in BS EN ISO and OHSAS standards also help focus performance
Is your H&S management good?
How do you know?
Current Position?
“We don’t have many accidents”
“We haven’t had many RIDDORs”
“Operatives get loads of training”
“There’s PPE if they need it”
“We do regular H&S inspections”
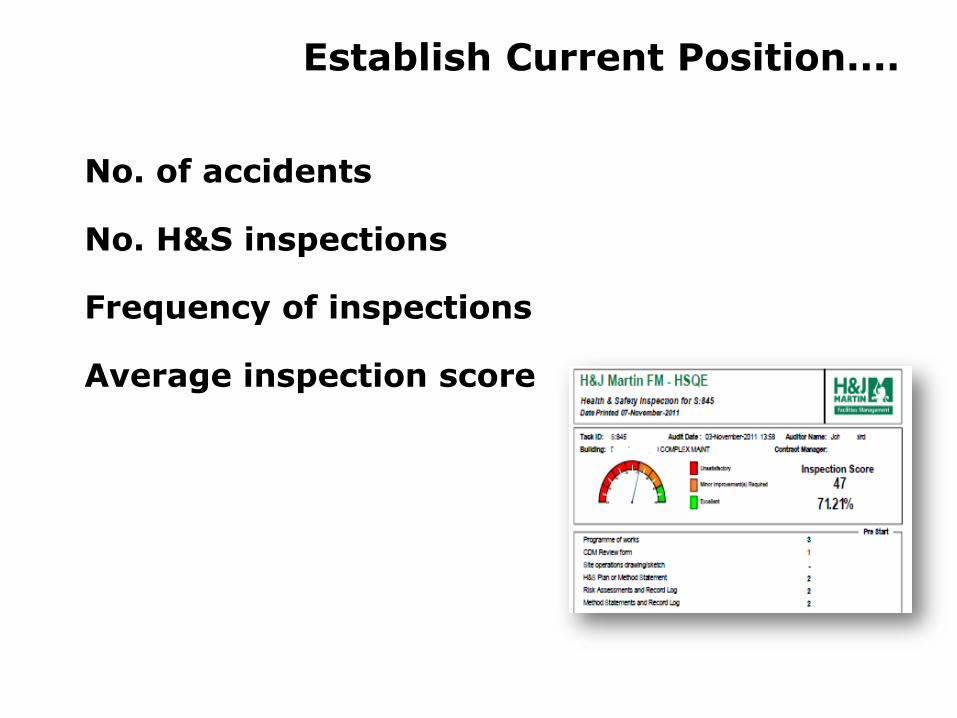
Establish Current Position....
No. of accidents
No. H&S inspections
Frequency of inspections
Average inspection score
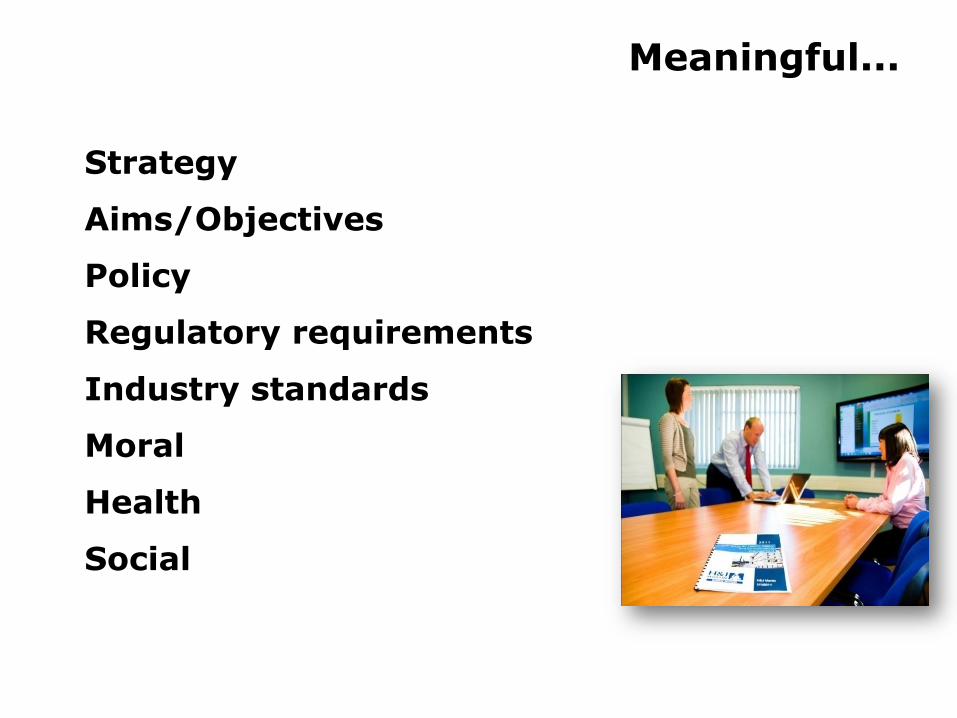
Meaningful...
Strategy
Aims/Objectives
Policy
Regulatory requirements
Industry standards
Moral
Health
Social
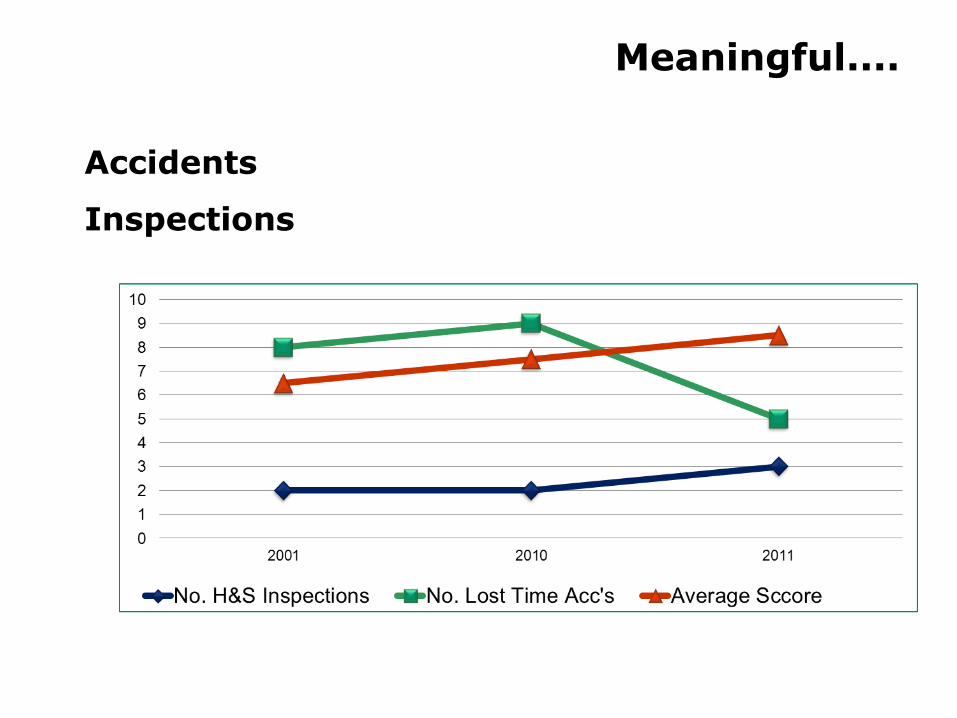
Meaningful....
Accidents
Inspections
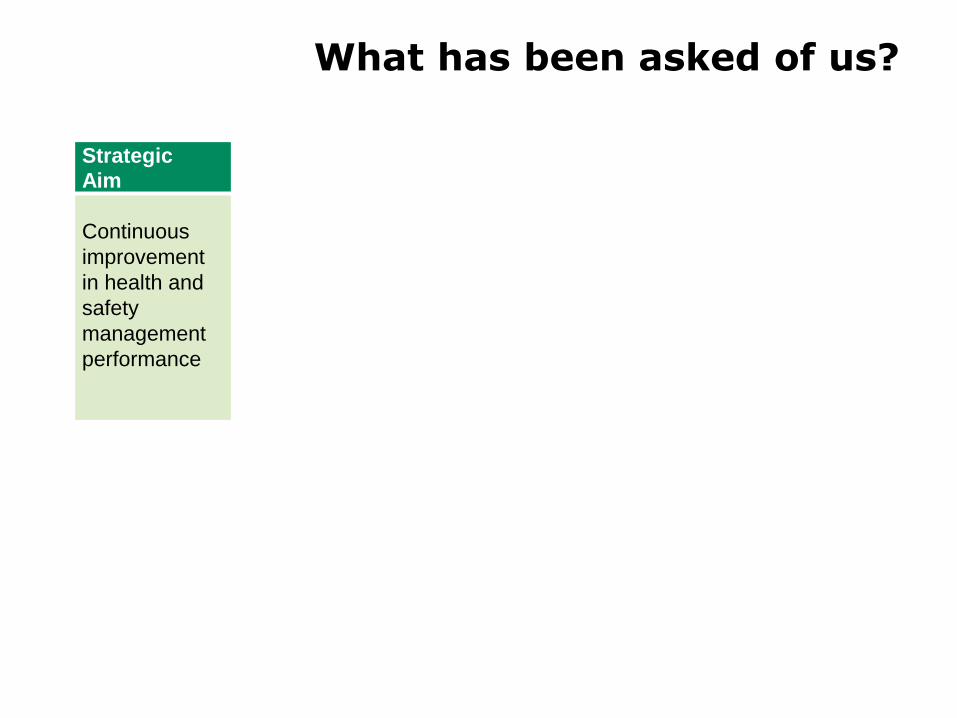
What has been asked of us?
Strategic
Aim
Continuous
improvement
in health and
safety
management
performance
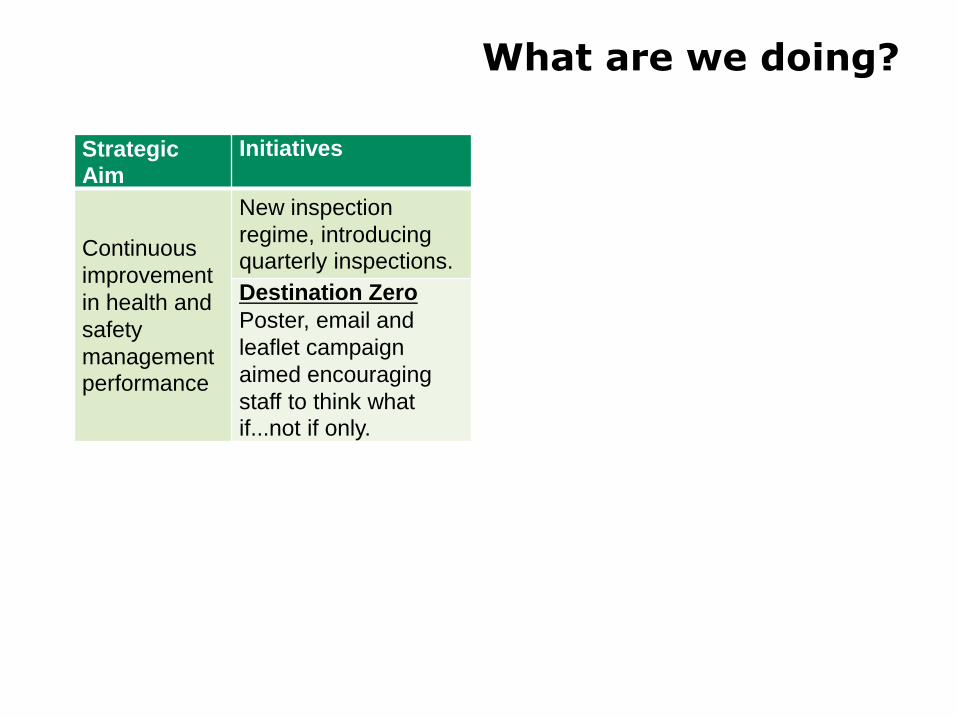
What are we doing?
Strategic Aim
Initiatives
Continuous
improvement
in health and
safety
management performance
New inspection
regime, introducing quarterly inspections.
Destination Zero
Poster, email and
leaflet campaign
aimed encouraging
staff to think what if...not if only.
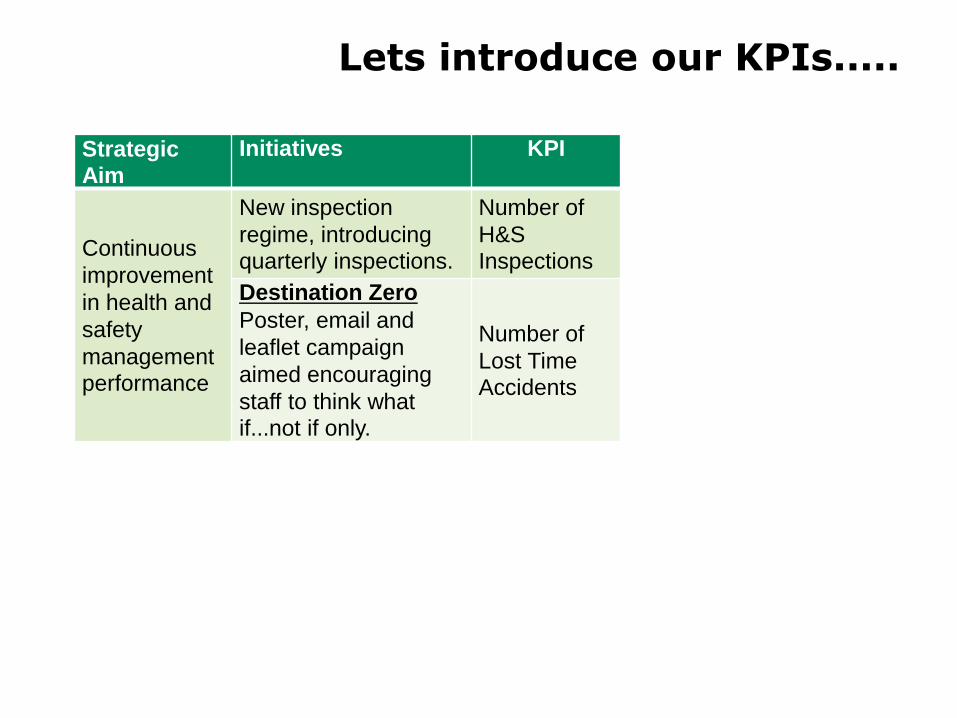
Lets introduce our KPIs.....
Strategic Aim
Initiatives KPI
Continuous
improvement
in health and
safety
management performance
New inspection
regime, introducing quarterly inspections.
Number of
H&S Inspections
Destination Zero
Poster, email and
leaflet campaign
aimed encouraging
staff to think what if...not if only.
Number of
Lost Time Accidents
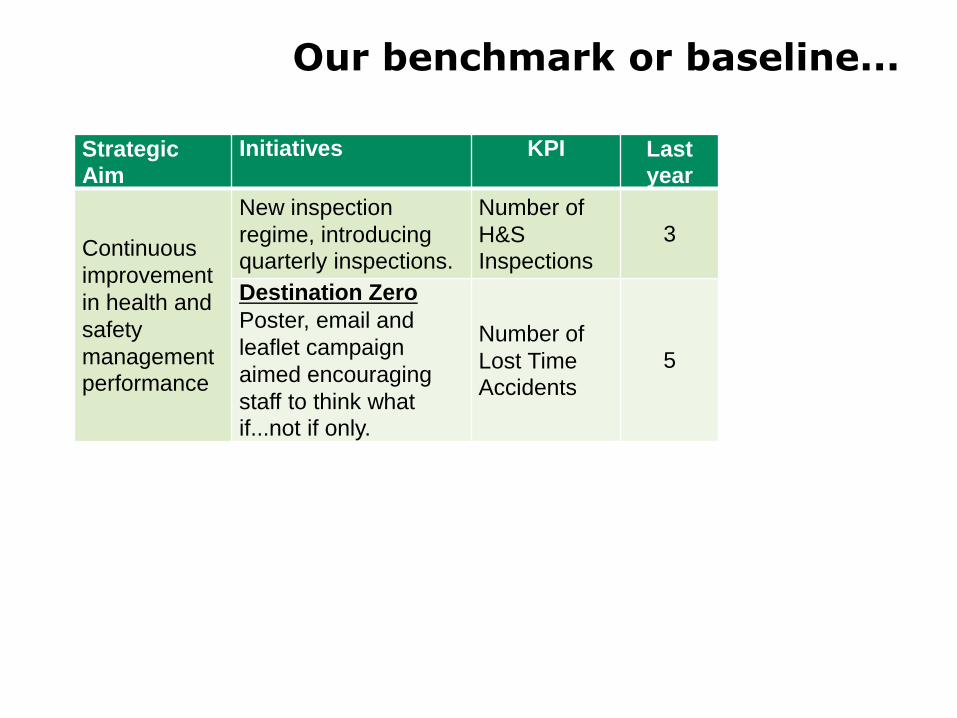
Our benchmark or baseline...
Strategic Aim
Initiatives KPI Last year
Continuous
improvement
in health and
safety
management performance
New inspection
regime, introducing quarterly inspections.
Number of
H&S Inspections
3
Destination Zero
Poster, email and
leaflet campaign
aimed encouraging
staff to think what if...not if only.
Number of
Lost Time Accidents
5
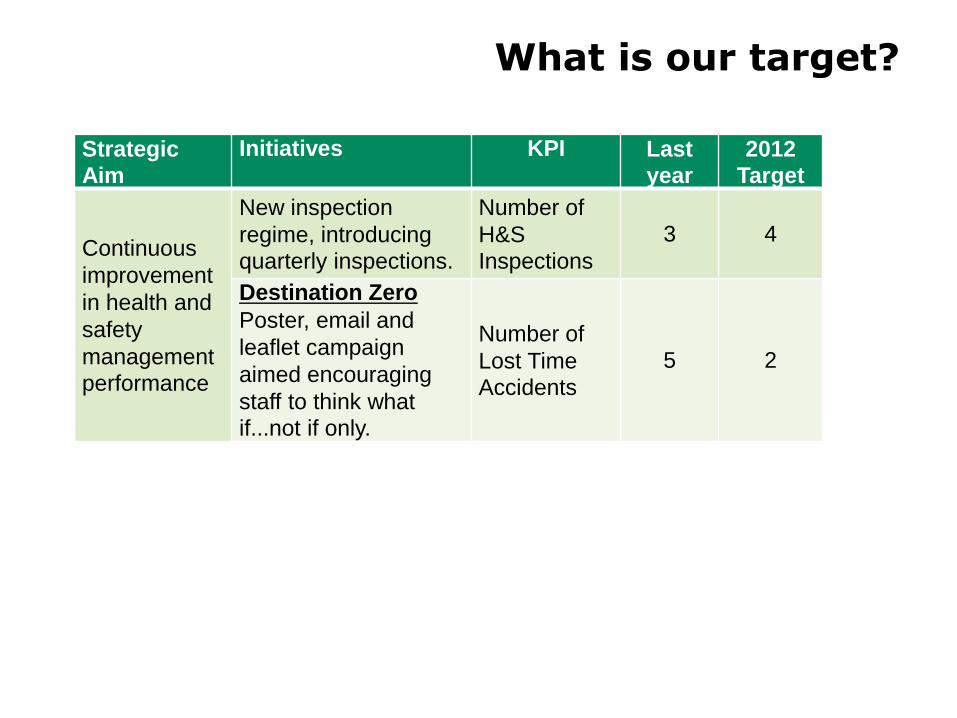
What is our target?
Strategic Aim
Initiatives KPI Last year
2012 Target
Continuous
improvement
in health and
safety
management performance
New inspection
regime, introducing quarterly inspections.
Number of
H&S Inspections
3 4
Destination Zero
Poster, email and
leaflet campaign
aimed encouraging
staff to think what if...not if only.
Number of
Lost Time Accidents
5 2
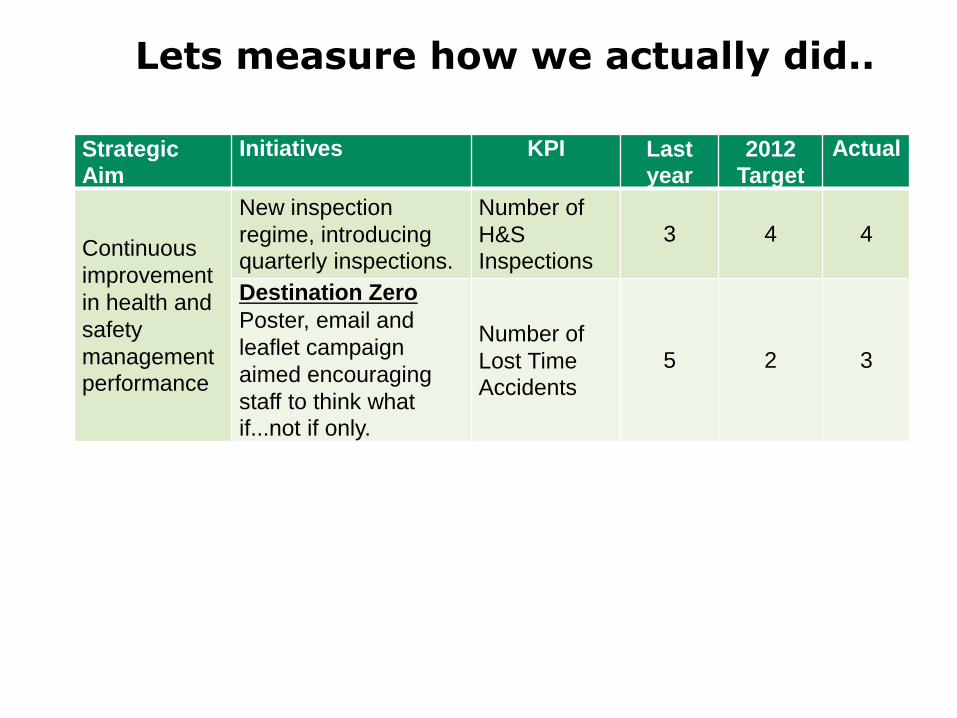
Lets measure how we actually did..
Strategic Aim
Initiatives KPI Last year
2012 Target
Actual
Continuous
improvement
in health and
safety
management performance
New inspection
regime, introducing quarterly inspections.
Number of
H&S Inspections
3 4 4
Destination Zero
Poster, email and
leaflet campaign
aimed encouraging
staff to think what if...not if only.
Number of
Lost Time Accidents
5 2 3

Revisit the KPIs......Success?
Points of note
Quantity does not equal quality
Measure what’s most important
Don’t let the cost of measuring exceed the
value of the results
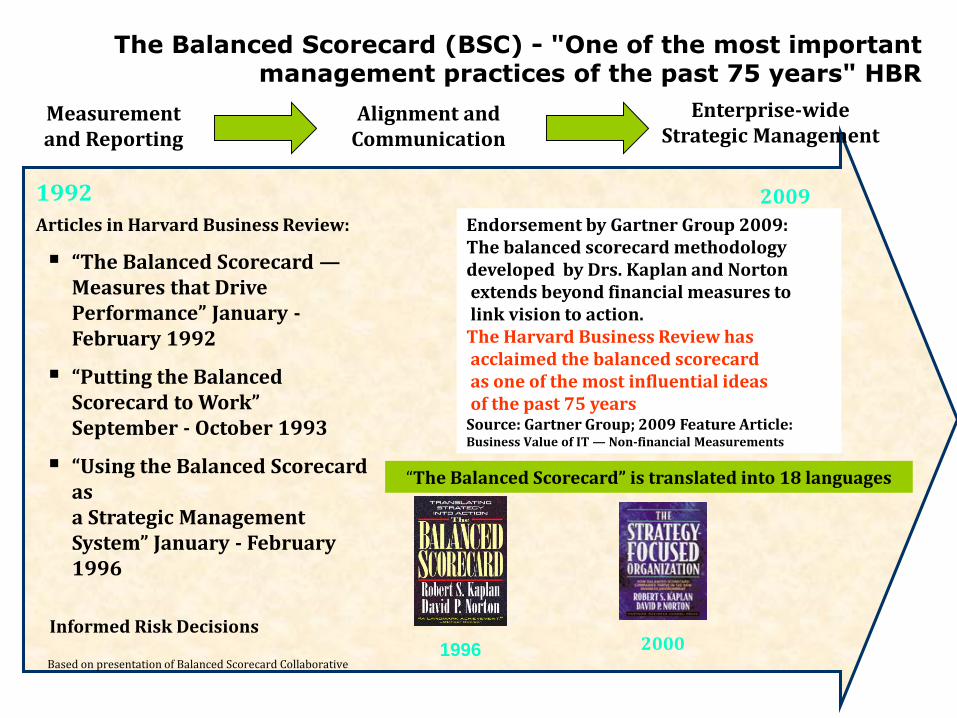
1992 2009
Based on presentation of Balanced Scorecard Collaborative
Articles in Harvard Business Review:
“The Balanced Scorecard —Measures that Drive Performance” January -February 1992
“Putting the Balanced Scorecard to Work” September - October 1993
“Using the Balanced Scorecard asa Strategic Management System” January - February 1996
1996 2000
Endorsement by Gartner Group 2009:The balanced scorecard methodologydeveloped by Drs. Kaplan and Nortonextends beyond financial measures tolink vision to action.
The Harvard Business Review hasacclaimed the balanced scorecardas one of the most influential ideasof the past 75 years
Source: Gartner Group; 2009 Feature Article:Business Value of IT — Non-financial Measurements
“The Balanced Scorecard” is translated into 18 languages
Measurement and Reporting
Alignment and Communication
Enterprise-wide Strategic Management
Informed Risk Decisions
The Balanced Scorecard (BSC) - "One of the most important management practices of the past 75 years" HBR
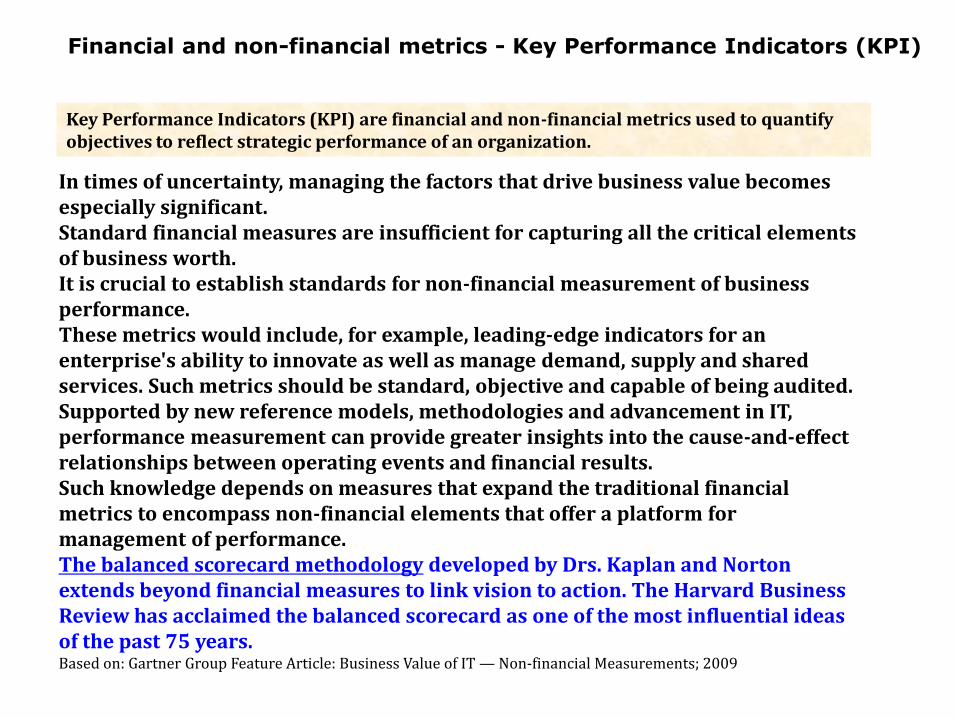
In times of uncertainty, managing the factors that drive business value becomes especially significant.Standard financial measures are insufficient for capturing all the critical elements of business worth.It is crucial to establish standards for non-financial measurement of business performance. These metrics would include, for example, leading-edge indicators for an enterprise's ability to innovate as well as manage demand, supply and shared services. Such metrics should be standard, objective and capable of being audited.Supported by new reference models, methodologies and advancement in IT, performance measurement can provide greater insights into the cause-and-effect relationships between operating events and financial results. Such knowledge depends on measures that expand the traditional financial metrics to encompass non-financial elements that offer a platform for management of performance.The balanced scorecard methodology developed by Drs. Kaplan and Norton extends beyond financial measures to link vision to action. The Harvard Business Review has acclaimed the balanced scorecard as one of the most influential ideas of the past 75 years.Based on: Gartner Group Feature Article: Business Value of IT — Non-financial Measurements; 2009
Key Performance Indicators (KPI) are financial and non-financial metrics used to quantify objectives to reflect strategic performance of an organization.
Financial and non-financial metrics - Key Performance Indicators (KPI)
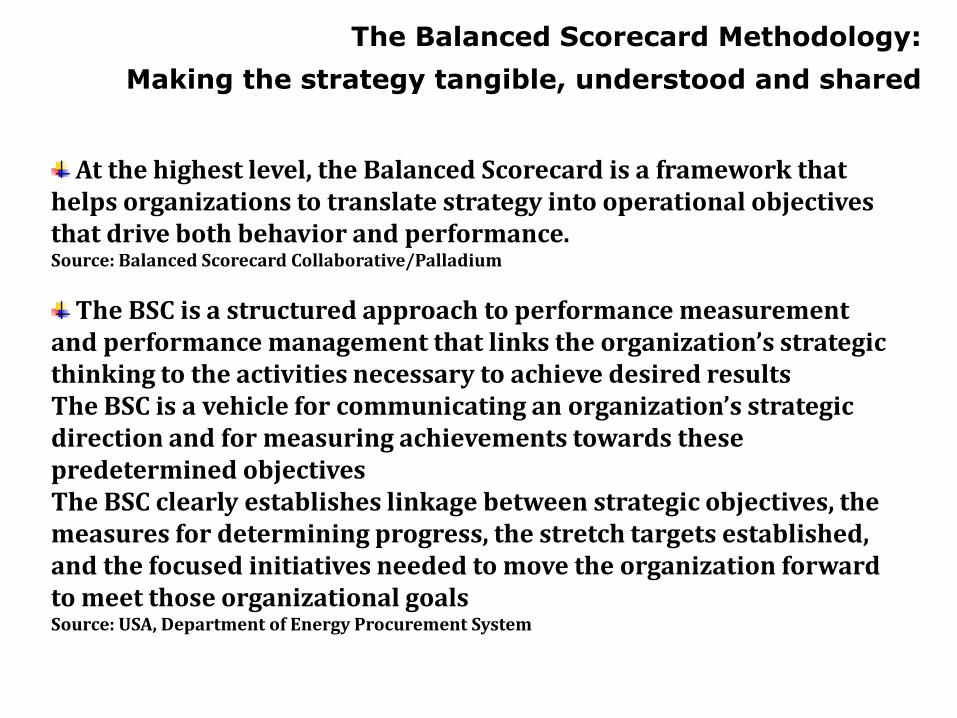
The Balanced Scorecard Methodology:
Making the strategy tangible, understood and shared
At the highest level, the Balanced Scorecard is a framework that helps organizations to translate strategy into operational objectives that drive both behavior and performance.Source: Balanced Scorecard Collaborative/Palladium
The BSC is a structured approach to performance measurement and performance management that links the organization’s strategic thinking to the activities necessary to achieve desired resultsThe BSC is a vehicle for communicating an organization’s strategic direction and for measuring achievements towards these predetermined objectives The BSC clearly establishes linkage between strategic objectives, the measures for determining progress, the stretch targets established, and the focused initiatives needed to move the organization forward to meet those organizational goalsSource: USA, Department of Energy Procurement System
Strategy
“A general method for achieving specific objectives. It describes the essential resources and their amounts, which are to be committed to achieving those objectives. It describes how resources will be organized, and the policies that will apply for the management and use of those resources."Source: Engineering Strategy Development; Definition of Strategy; Feb 2004 http://www.johnstark.com/es5.html
Please note:The term Strategy is intuitively perceived as relating to Enterprise-wide strategic objectives; however it may describe also departmental/functional objectives/goals/targets such as of Customer Service dept…
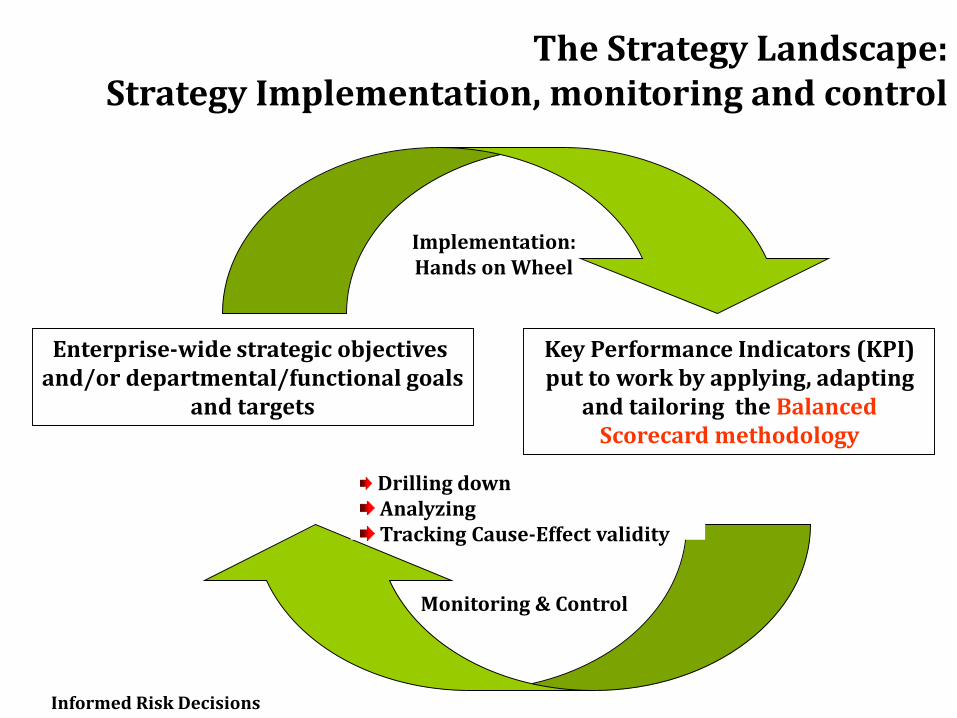
Enterprise-wide strategic objectives and/or departmental/functional goals
and targets
Key Performance Indicators (KPI)put to work by applying, adapting
and tailoring the Balanced Scorecard methodology
Implementation:Hands on Wheel
The Strategy Landscape:Strategy Implementation, monitoring and control
Drilling downAnalyzingTracking Cause-Effect validity
Monitoring & Control
Informed Risk Decisions
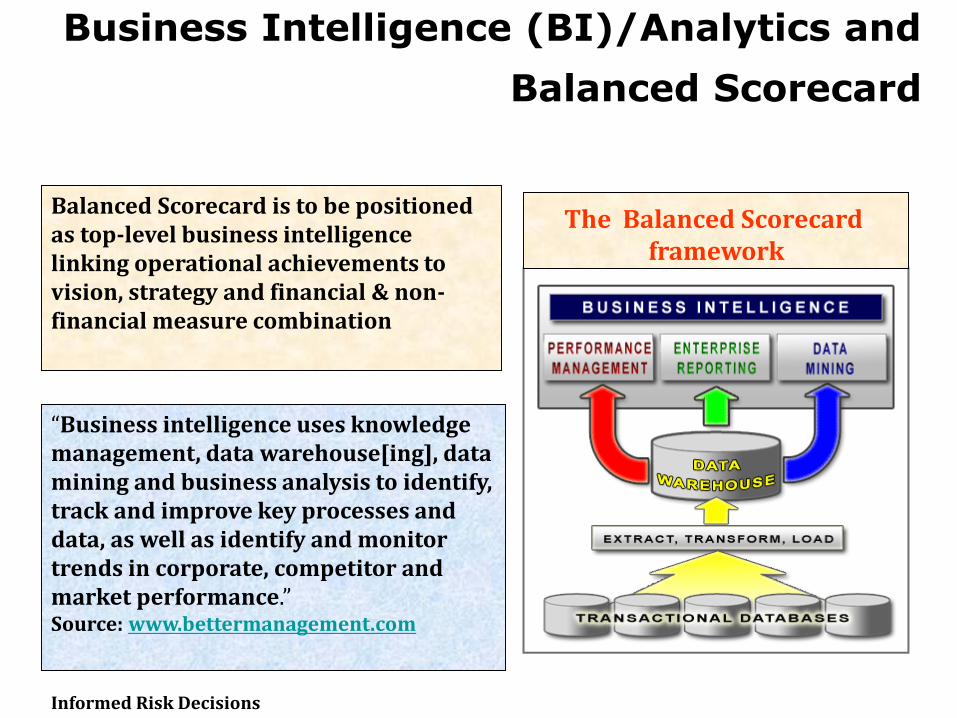
Business Intelligence (BI)/Analytics and
Balanced Scorecard
The Balanced Scorecard framework
“Business intelligence uses knowledge management, data warehouse[ing], data mining and business analysis to identify, track and improve key processes and data, as well as identify and monitor trends in corporate, competitor and market performance.”Source: www.bettermanagement.com
Balanced Scorecard is to be positioned as top-level business intelligence linking operational achievements to vision, strategy and financial & non-financial measure combination
Informed Risk Decisions
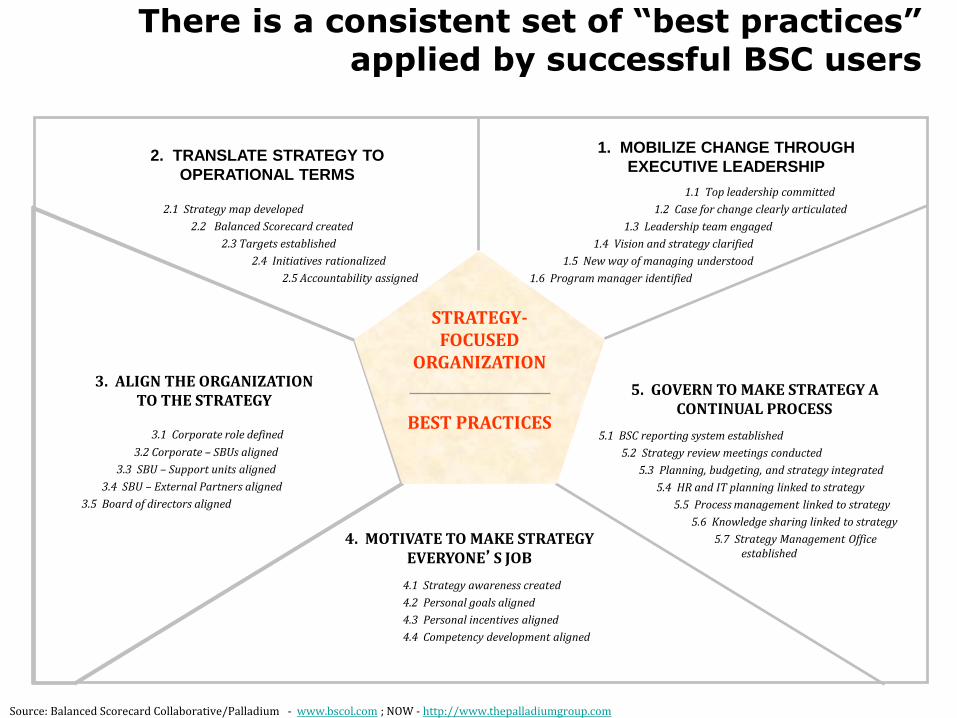
1.1 Top leadership committed
1.2 Case for change clearly articulated
1.3 Leadership team engaged
1.4 Vision and strategy clarified
1.5 New way of managing understood
1.6 Program manager identified
5. GOVERN TO MAKE STRATEGY A CONTINUAL PROCESS
3.1 Corporate role defined
3.2 Corporate – SBUs aligned
3.3 SBU – Support units aligned
3.4 SBU – External Partners aligned
3.5 Board of directors aligned
5.1 BSC reporting system established
5.2 Strategy review meetings conducted
5.3 Planning, budgeting, and strategy integrated
5.4 HR and IT planning linked to strategy
5.5 Process management linked to strategy
5.6 Knowledge sharing linked to strategy
5.7 Strategy Management Office established
2.1 Strategy map developed
2.2 Balanced Scorecard created
2.3 Targets established
2.4 Initiatives rationalized
2.5 Accountability assigned
4.1 Strategy awareness created
4.2 Personal goals aligned
4.3 Personal incentives aligned
4.4 Competency development aligned
4. MOTIVATE TO MAKE STRATEGY EVERYONE’S JOB
STRATEGY-FOCUSED
ORGANIZATION
BEST PRACTICES
2. TRANSLATE STRATEGY TO
OPERATIONAL TERMS
1. MOBILIZE CHANGE THROUGH
EXECUTIVE LEADERSHIP
Source: Balanced Scorecard Collaborative/Palladium - www.bscol.com ; NOW - http://www.thepalladiumgroup.com
There is a consistent set of “best practices” applied by successful BSC users
GETTING ACQUAINTED WITH THE BALANCED SCORECARD
Informed Risk Decisions
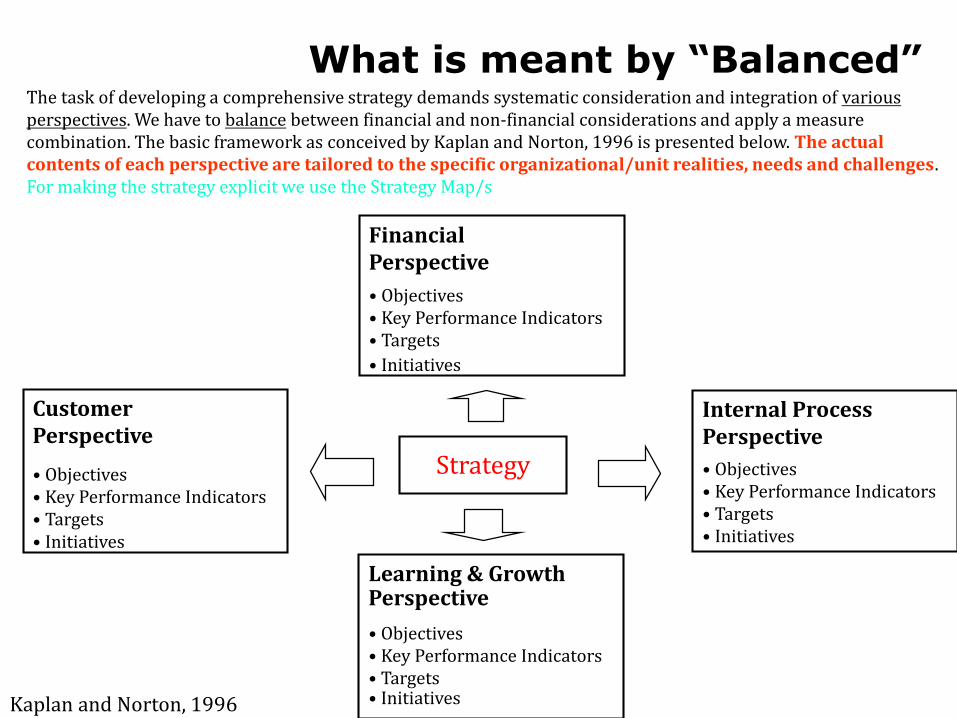
Financial Perspective
• Objectives• Key Performance Indicators• Targets
• Initiatives
Strategy
Learning & Growth Perspective
• Objectives• Key Performance Indicators• Targets• Initiatives
CustomerPerspective
• Objectives• Key Performance Indicators• Targets• Initiatives
Internal Process Perspective
• Objectives• Key Performance Indicators• Targets• Initiatives
Kaplan and Norton, 1996
The task of developing a comprehensive strategy demands systematic consideration and integration of various perspectives. We have to balance between financial and non-financial considerations and apply a measure combination. The basic framework as conceived by Kaplan and Norton, 1996 is presented below. The actual contents of each perspective are tailored to the specific organizational/unit realities, needs and challenges. For making the strategy explicit we use the Strategy Map/s
What is meant by “Balanced”

CUSTOMER- Customer Satisfaction- Effective Service/Partnership
MISSIONVISION
STRATEGY
LEARNING ANDGROWTH
- Access to Strategic Information- Employee Satisfaction- Organization Structured for
Continuous Improvement- Quality Workforce
FINANCIAL- Optimum Cost Efficiency of
Purchasing Operations; Cost Reasonableness of Actions
INTERNAL BUSINESSPROCESSES
- Acquisition Excellence- Most Effective Use of
Contracting Approaches- Streamlined Processes- On-Time Delivery- Supplier Satisfaction- Socio-economics
Source: USA, Department of Energy Procurement System
Tailoring to the specific organizational/unit realities, needs and challenges - government procurement service example

What do we balance
Financial versus Non-financial measures
Tangible versus Intangible assets
Long-term versus Short-term Goals
Internal versus External Perspective
Performance Drivers versus Outcomes
Cause-effect relationships hypotheses
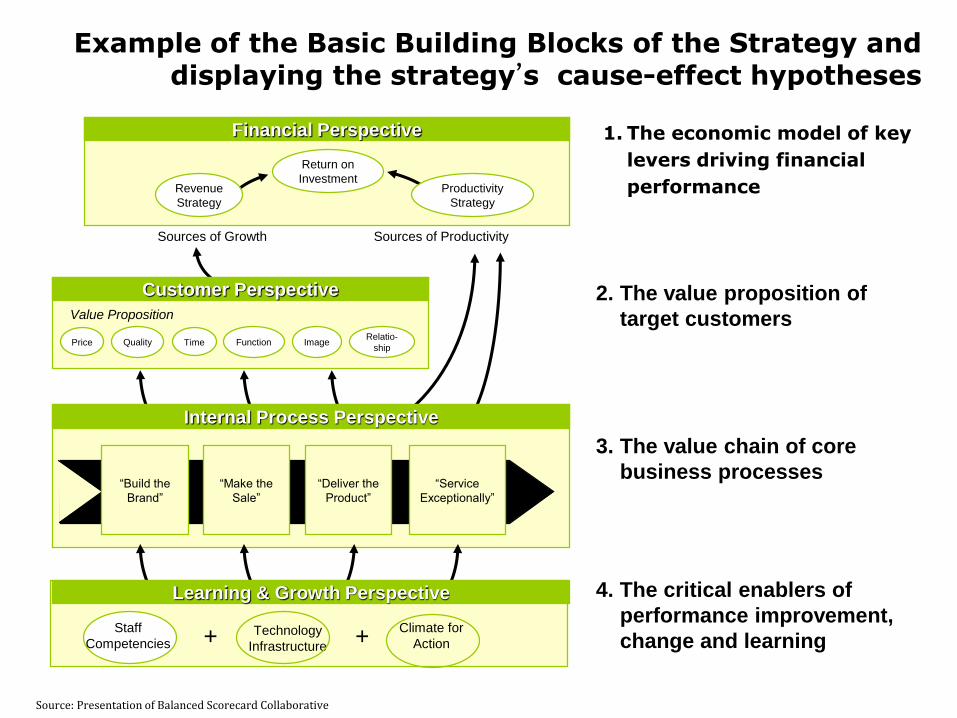
Internal Process Perspective
Financial Perspective
Learning & Growth Perspective
Customer Perspective
Return on
Investment
Price Quality Time Function ImageRelatio-
ship
Value Proposition
Sources of Growth Sources of Productivity
Technology
Infrastructure
Climate for
Action+ +
“Build the
Brand”
“Make the
Sale”
“Deliver the
Product”
“Service
Exceptionally”
Revenue
Strategy
Productivity
Strategy
Example of the Basic Building Blocks of the Strategy and displaying the strategy’s cause-effect hypotheses
1. The economic model of key
levers driving financial
performance
2. The value proposition of
target customers
3. The value chain of core
business processes
4. The critical enablers of
performance improvement,
change and learningStaff
Competencies
Source: Presentation of Balanced Scorecard Collaborative
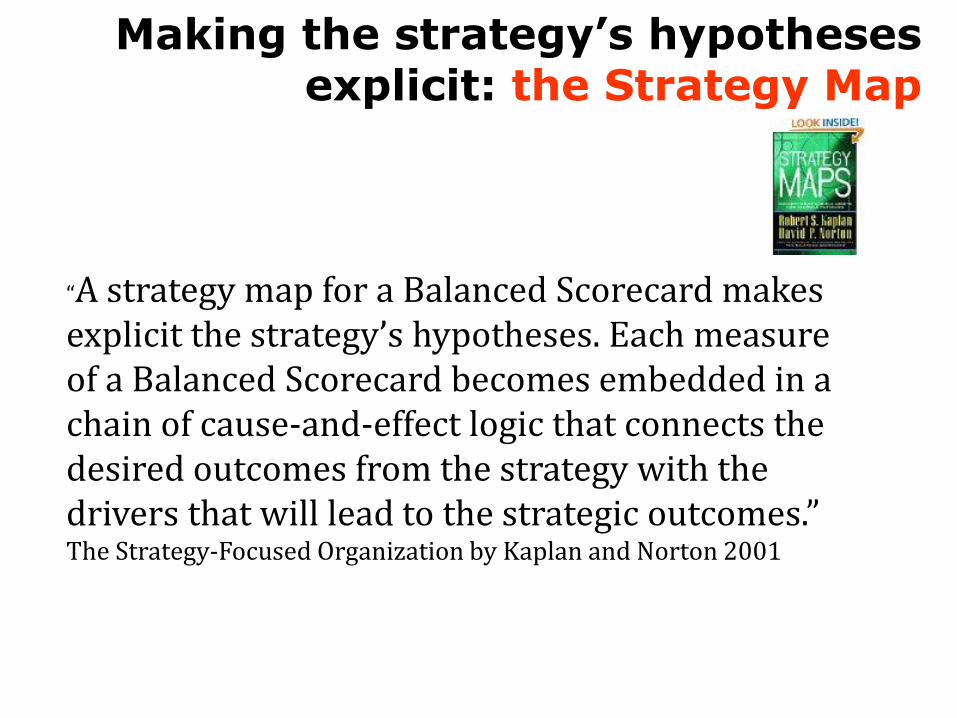
Making the strategy’s hypotheses explicit: the Strategy Map
“A strategy map for a Balanced Scorecard makes explicit the strategy’s hypotheses. Each measure of a Balanced Scorecard becomes embedded in a chain of cause-and-effect logic that connects the desired outcomes from the strategy with the drivers that will lead to the strategic outcomes.”The Strategy-Focused Organization by Kaplan and Norton 2001
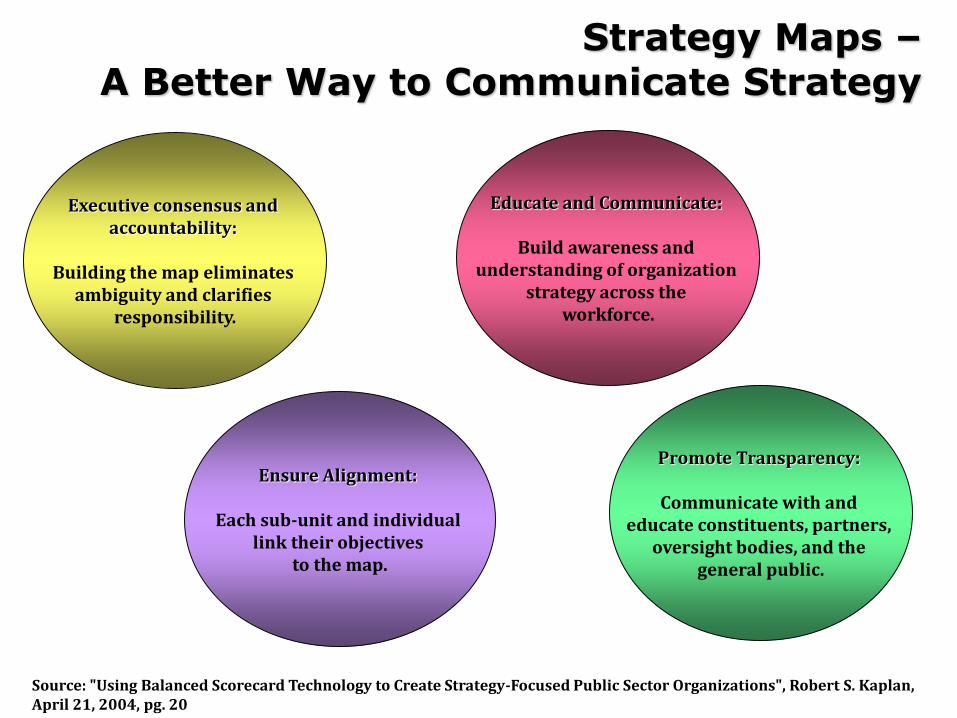
Executive consensus and accountability:
Building the map eliminates ambiguity and clarifies
responsibility.
Educate and Communicate:
Build awareness and understanding of organization
strategy across the workforce.
Ensure Alignment:
Each sub-unit and individual link their objectives
to the map.
Source: "Using Balanced Scorecard Technology to Create Strategy-Focused Public Sector Organizations", Robert S. Kaplan, April 21, 2004, pg. 20
Promote Transparency:
Communicate with and educate constituents, partners,
oversight bodies, and the general public.
Strategy Maps –A Better Way to Communicate Strategy
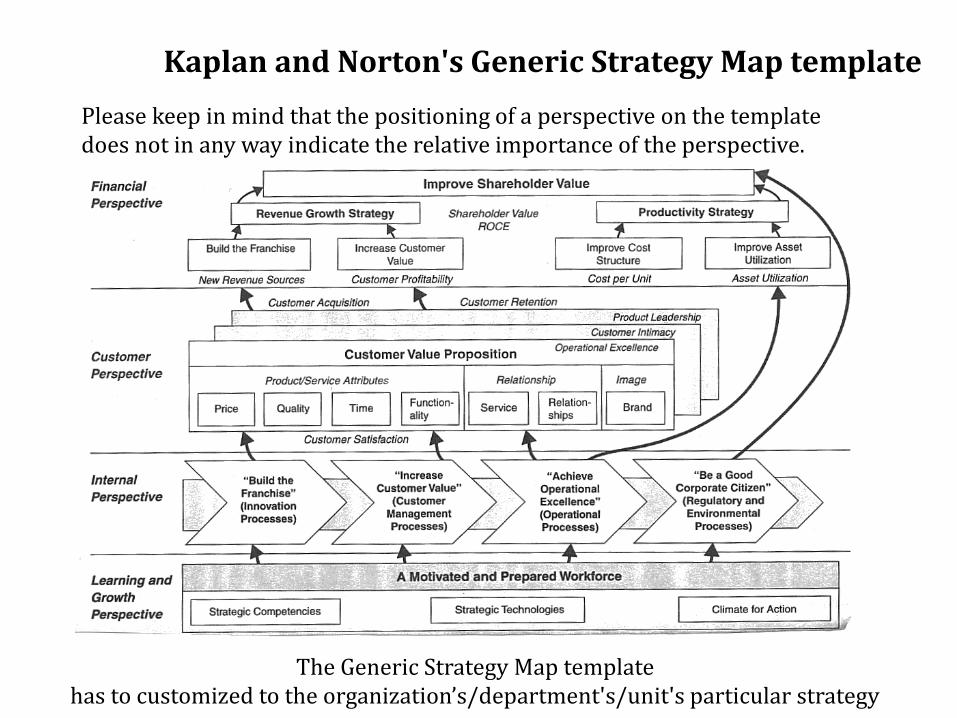
Please keep in mind that the positioning of a perspective on the template does not in any way indicate the relative importance of the perspective.
Kaplan and Norton's Generic Strategy Map template
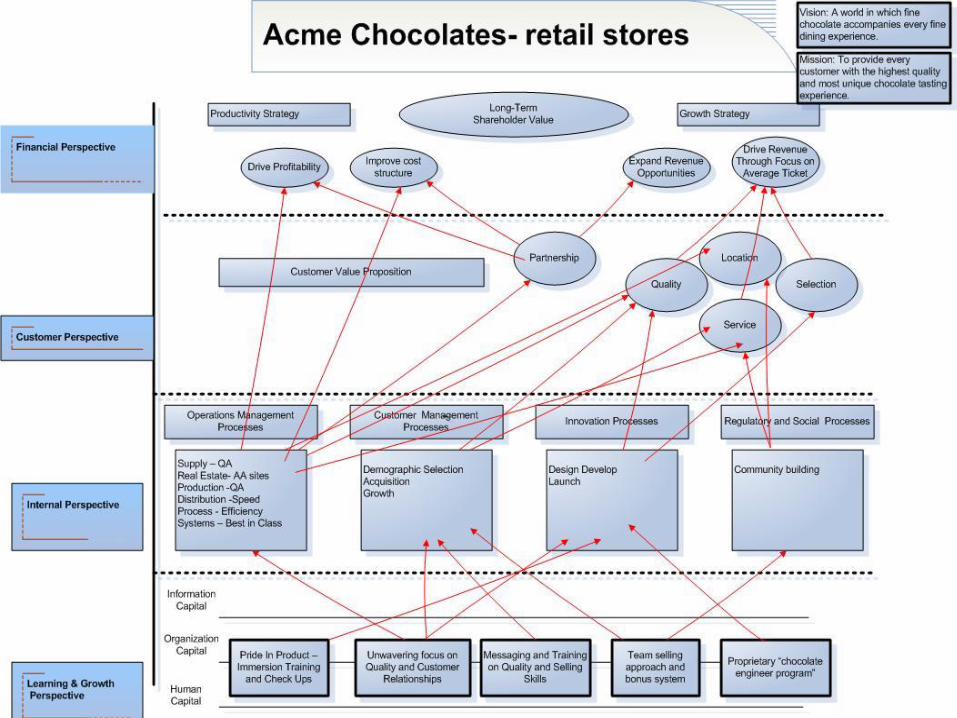
The Generic Strategy Map template has to customized to the organization’s/department's/unit's particular strategy
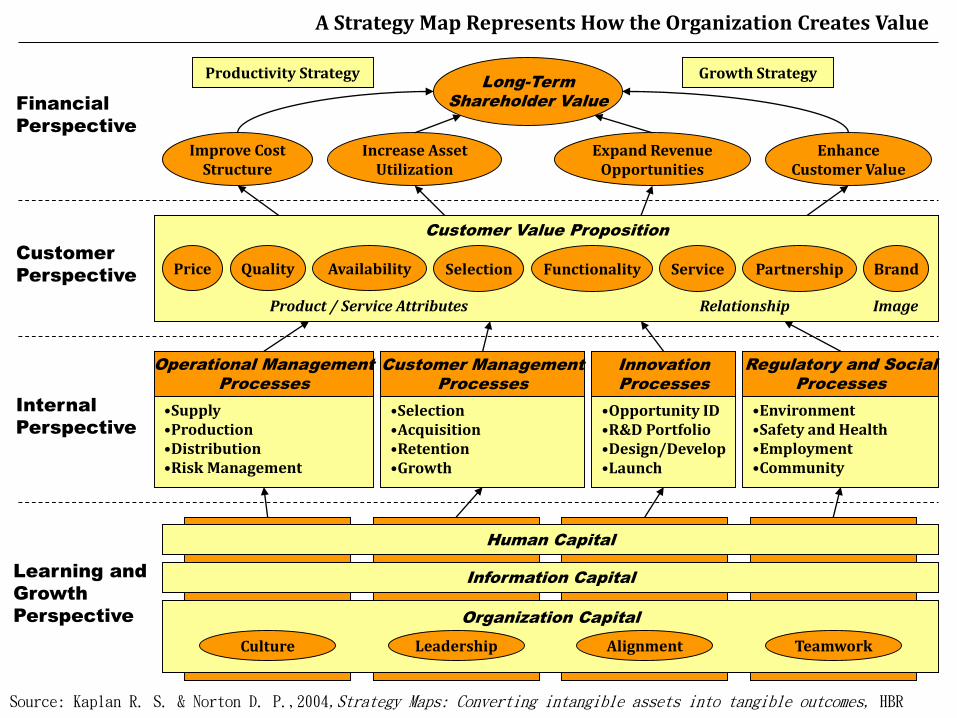
Customer Value Proposition
SelectionAvailabilityQualityPrice
Organization Capital
A Strategy Map Represents How the Organization Creates Value
•Supply•Production•Distribution•Risk Management
Operational Management
Processes
•Selection•Acquisition•Retention•Growth
Customer Management
Processes
•Opportunity ID•R&D Portfolio•Design/Develop•Launch
Innovation
Processes
•Environment•Safety and Health•Employment•Community
Regulatory and Social
Processes
Internal
Perspective
Human Capital
Information Capital
Culture Leadership Alignment Teamwork
Learning and
Growth
Perspective
Customer
Perspective
Financial
Perspective
Functionality Service Partnership Brand
Product / Service Attributes Relationship Image
Improve CostStructure
Increase AssetUtilization
Long-Term
Shareholder Value
Expand RevenueOpportunities
EnhanceCustomer Value
Productivity Strategy Growth Strategy
Source: Kaplan R. S. & Norton D. P.,2004,Strategy Maps: Converting intangible assets into tangible outcomes, HBR
Inte
rnal
Pro
cess
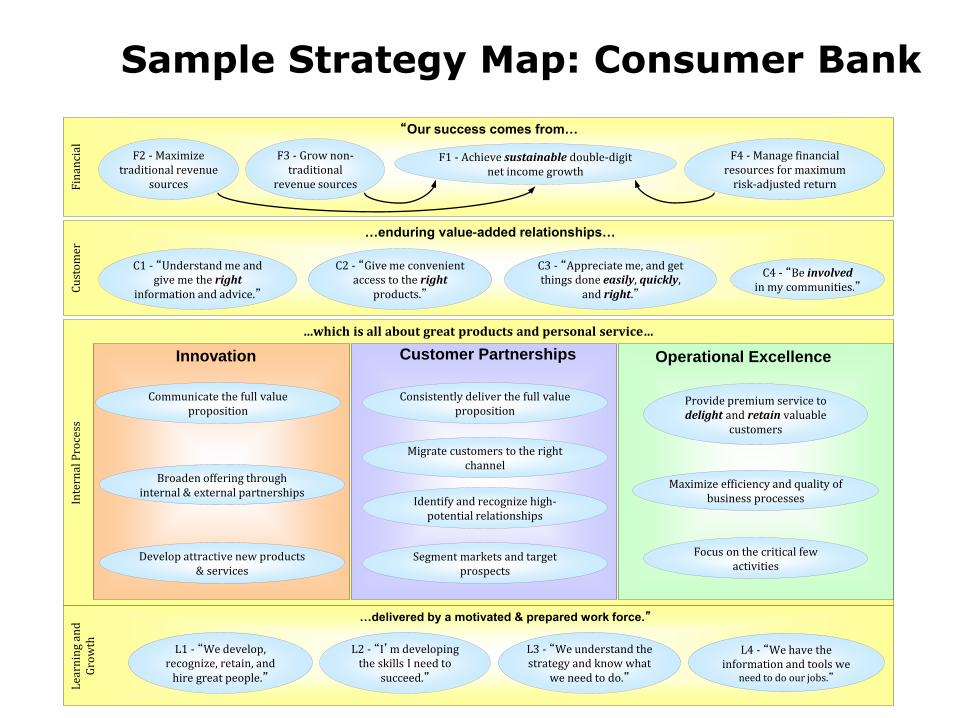
…which is all about great products and personal service…
Cu
sto
mer
…enduring value-added relationships…
Fin
anci
al
“Our success comes from…
C3 - “Appreciate me, and get things done easily, quickly,
and right.”
C1 - “Understand me and give me the right
information and advice.”
C4 - “Be involvedin my communities.”
C2 - “Give me convenient access to the right
products.”
F1 - Achieve sustainable double-digit net income growth
F2 - Maximize traditional revenue
sources
F4 - Manage financial resources for maximum
risk-adjusted return
F3 - Grow non-traditional
revenue sources
Lea
rnin
g an
d
Gro
wth
…delivered by a motivated & prepared work force.”
L4 - “We have the information and tools we
need to do our jobs.”
L1 - “We develop, recognize, retain, and
hire great people.”
L3 - “We understand the strategy and know what
we need to do.”
L2 - “I’m developing the skills I need to
succeed.”
Innovation Customer Partnerships Operational Excellence
Provide premium service to delight and retain valuable
customers
Maximize efficiency and quality of business processes
Focus on the critical few activities
Consistently deliver the full value proposition
Migrate customers to the right channel
Identify and recognize high-potential relationships
Segment markets and target prospects
Communicate the full value proposition
Broaden offering through internal & external partnerships
Develop attractive new products & services
Sample Strategy Map: Consumer Bank
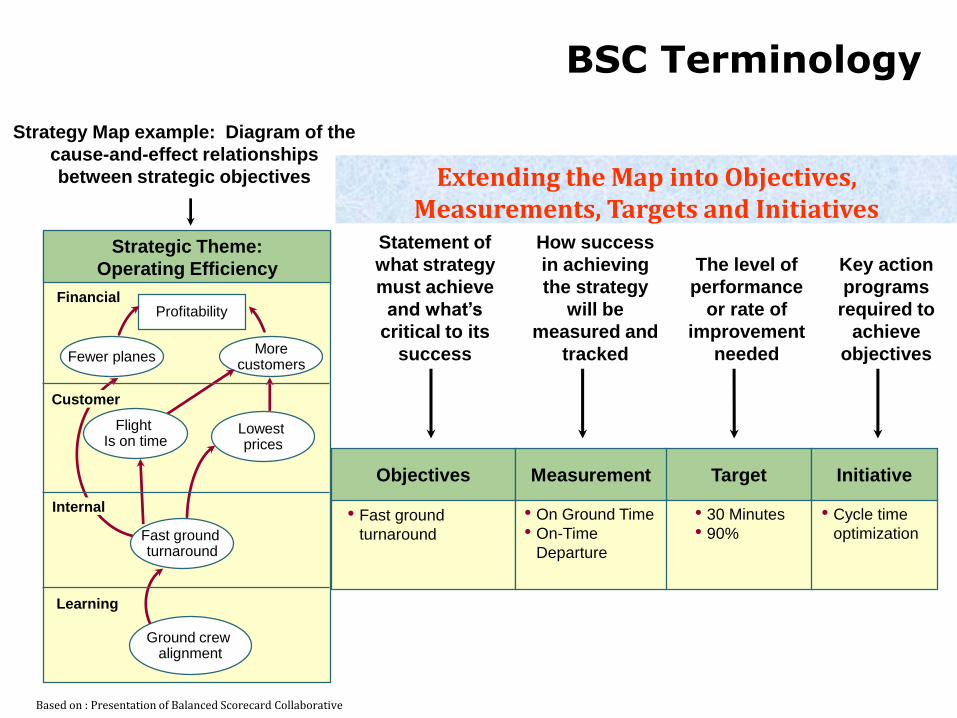
Objectives
• Fast ground
turnaround
Statement of
what strategy
must achieve
and what’s
critical to its
success
Target
• 30 Minutes
• 90%
The level of
performance
or rate of
improvement
needed
• Cycle time
optimization
Key action
programs
required to
achieve
objectives
InitiativeMeasurement
• On Ground Time
• On-Time
Departure
How success
in achieving
the strategy
will be
measured and
tracked
Strategic Theme:
Operating Efficiency
ProfitabilityFinancial
Learning
Morecustomers
Ground crew alignment
Lowest prices
Fewer planes
Customer
Internal
Fast ground turnaround
Strategy Map example: Diagram of the
cause-and-effect relationships
between strategic objectives
Flight Is on time
BSC Terminology
Extending the Map into Objectives, Measurements, Targets and Initiatives
Based on : Presentation of Balanced Scorecard Collaborative
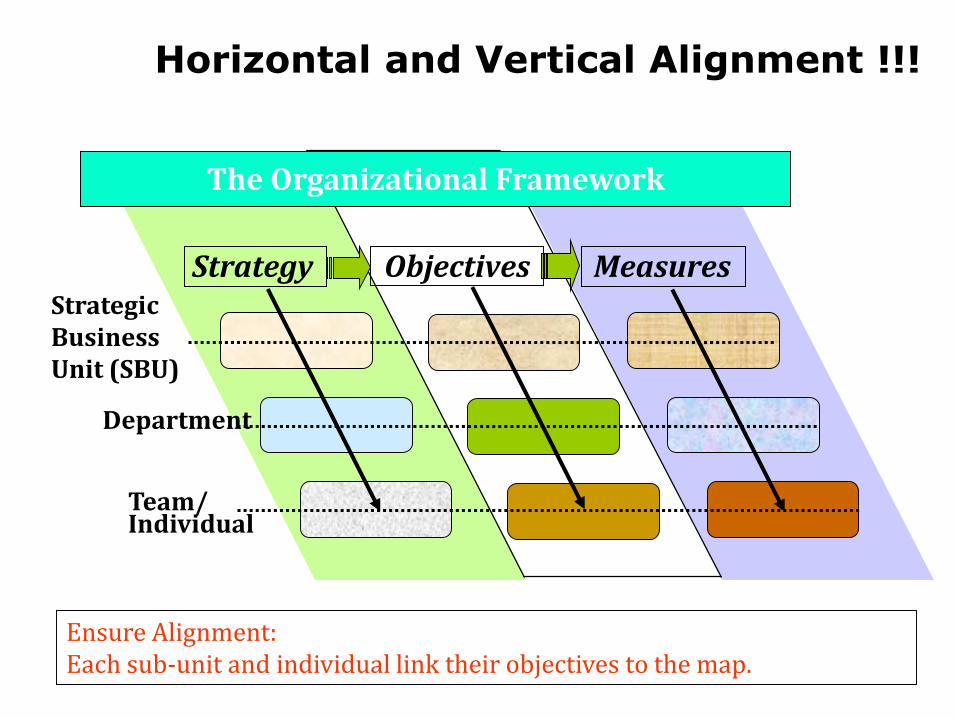
Strategy
Department
Team/Individual
MeasuresObjectives
The Organizational Framework
Horizontal and Vertical Alignment !!!
Strategic BusinessUnit (SBU)
Ensure Alignment: Each sub-unit and individual link their objectives to the map.
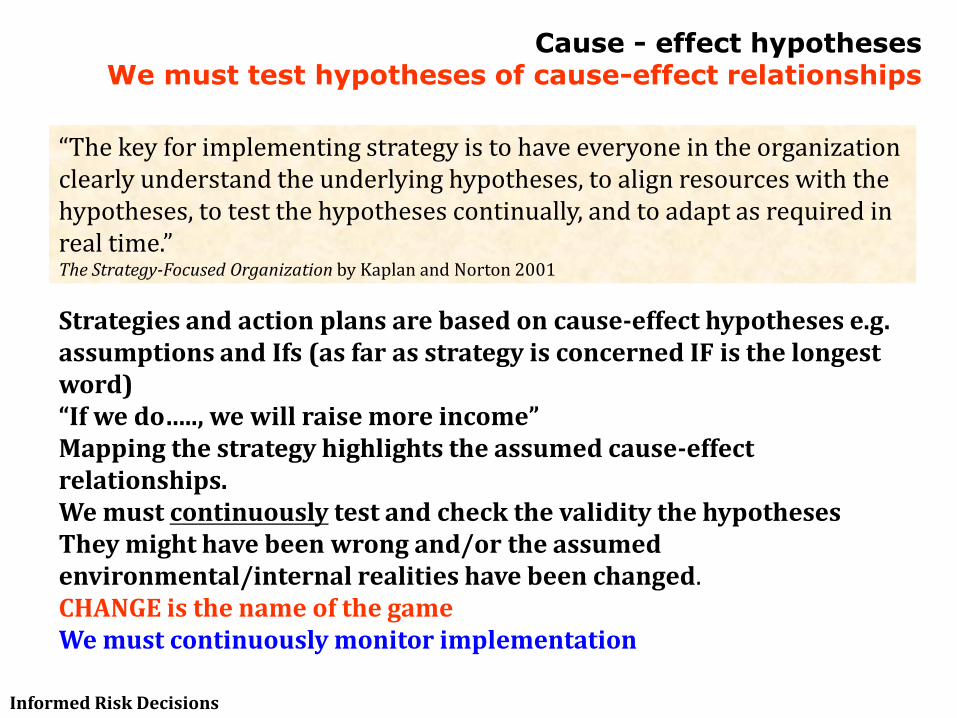
Cause - effect hypothesesWe must test hypotheses of cause-effect relationships
“The key for implementing strategy is to have everyone in the organization clearly understand the underlying hypotheses, to align resources with the hypotheses, to test the hypotheses continually, and to adapt as required in real time.”The Strategy-Focused Organization by Kaplan and Norton 2001
Strategies and action plans are based on cause-effect hypotheses e.g. assumptions and Ifs (as far as strategy is concerned IF is the longest word)“If we do….., we will raise more income”Mapping the strategy highlights the assumed cause-effect relationships.We must continuously test and check the validity the hypothesesThey might have been wrong and/or the assumed environmental/internal realities have been changed.CHANGE is the name of the gameWe must continuously monitor implementation
Informed Risk Decisions

ABILITY TO DRILL DOWN
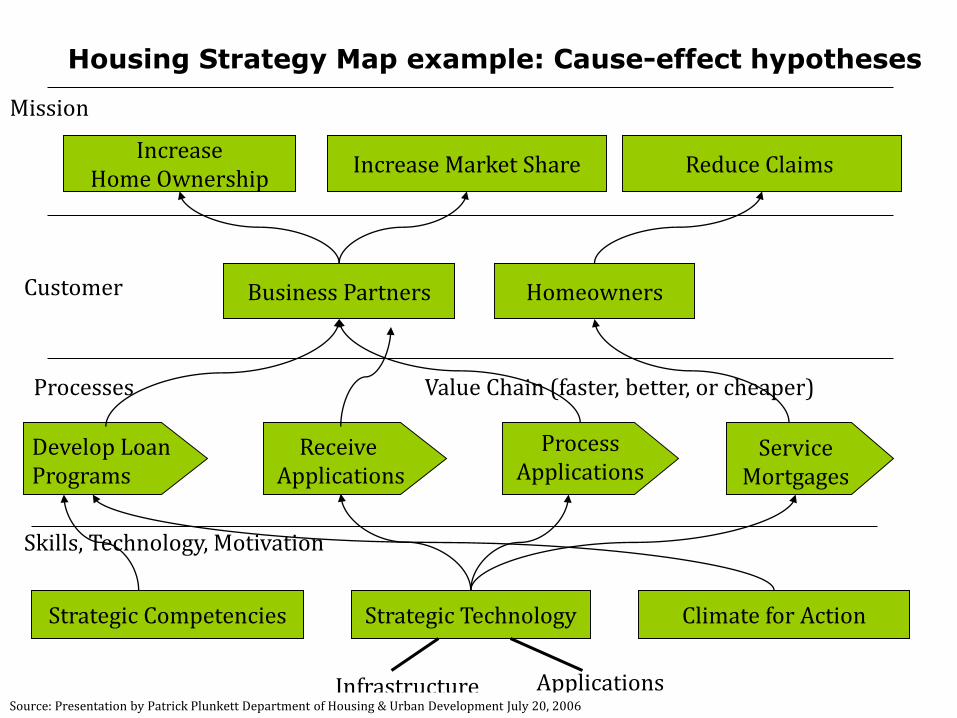
Strategic Competencies Strategic Technology Climate for Action
Infrastructure Applications
Customer Business Partners Homeowners
Processes Value Chain (faster, better, or cheaper)
Receive Applications
ProcessApplications
ServiceMortgages
Develop LoanPrograms
Skills, Technology, Motivation
Mission
IncreaseHome Ownership
Increase Market Share Reduce Claims
Source: Presentation by Patrick Plunkett Department of Housing & Urban Development July 20, 2006
Housing Strategy Map example: Cause-effect hypotheses
BALANCED SCORECARD DEVELOPMENT PROCESS
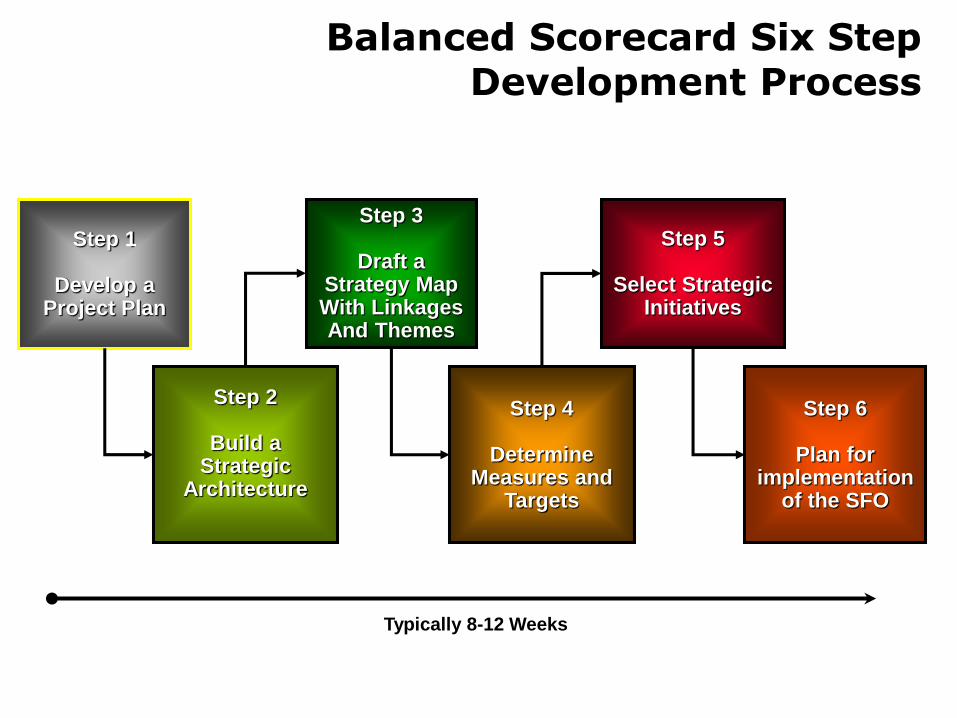
Typically 8-12 Weeks
Step 1
Develop aProject Plan
Step 2
Build aStrategic
Architecture
Step 3
Draft a Strategy MapWith LinkagesAnd Themes
Step 4
Determine Measures and
Targets
Step 5
Select Strategic Initiatives
Step 6
Plan for implementation
of the SFO
Balanced Scorecard Six Step Development Process
PUTTING THE BSC TO WORK
Presentation of the metrics and their visualization
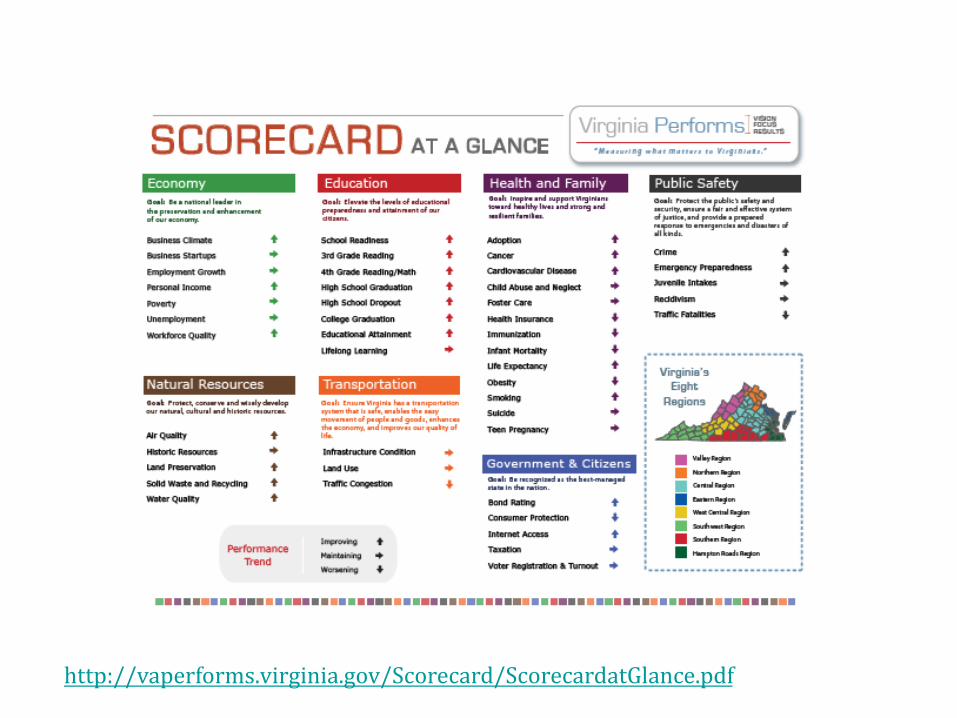
http://vaperforms.virginia.gov/Scorecard/ScorecardatGlance.pdf
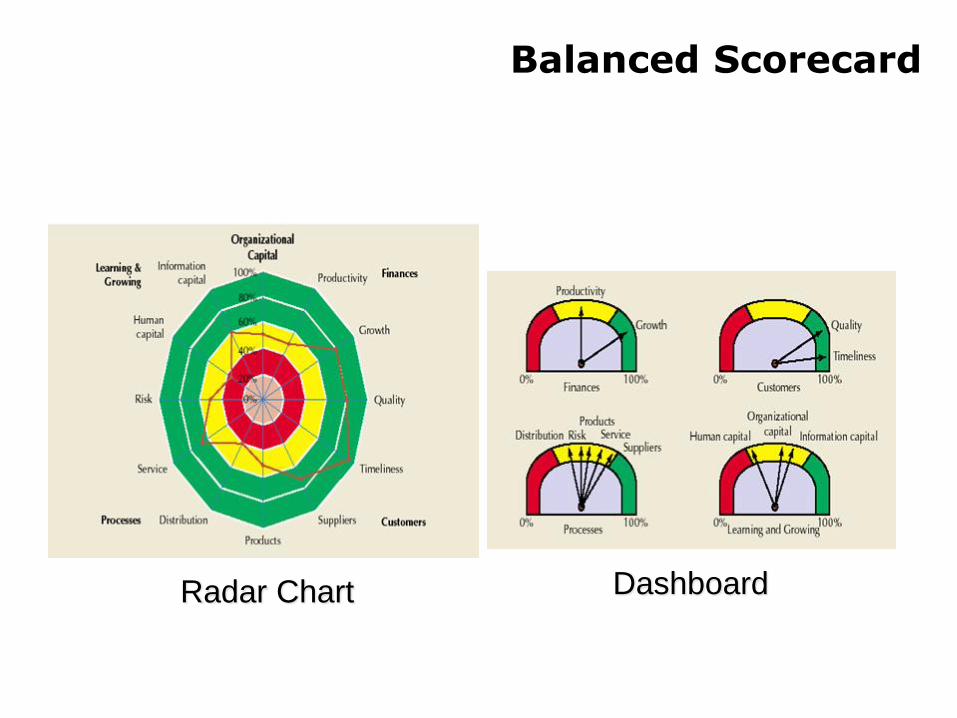
Radar Chart Dashboard
Balanced Scorecard

Some of the Indicators of Good Balanced Scorecard
4. Financial LinkageEvery objective can ultimately be related to financial
results
1. Executive InvolvementStrategic decision makers must validate and own
the strategy and related measures
2. Cause-and-Effect RelationshipsEvery objective selected should be part of a chain of
cause and effect linkages that represent the
strategy
3. Balance between outcome and leading
measures There should be a balance of outcome
measures and leading measures to facilitate
anticipatory management
5. Linkage of Initiatives and Measures: Each
initiative should be based on a gap between
baseline and target.
A good Balanced
Scorecard will
“tell the story” of
your strategy in
actionable terms.
Source: Balanced Scorecard Collaborative/Palladium
FINE