Embed Size (px)
Citation preview
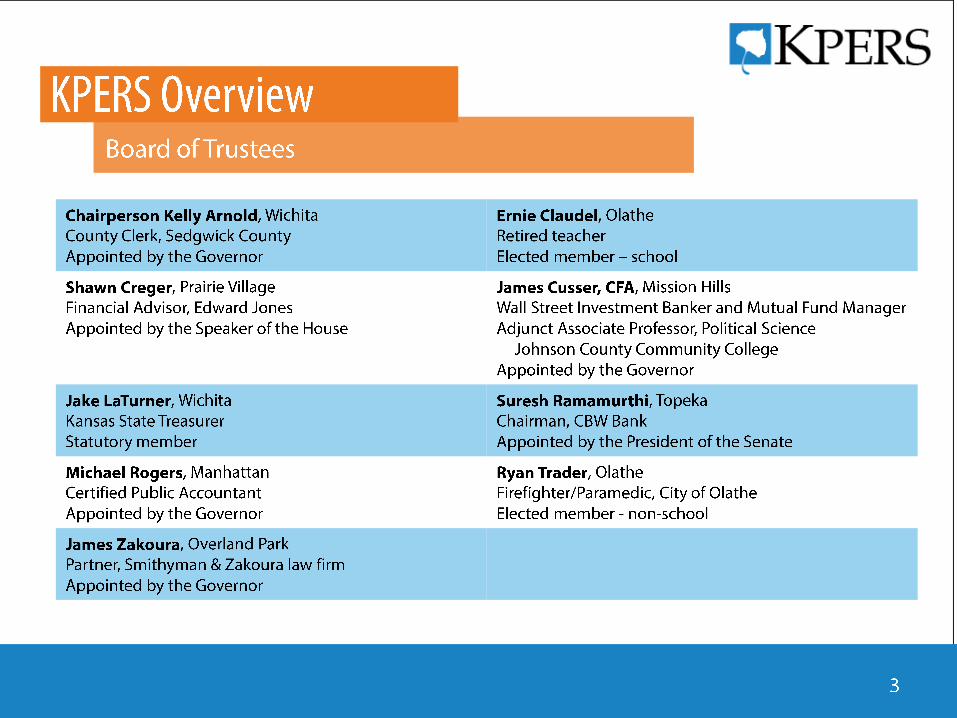
KPERS Overview
Senate Ways and Means Committee
1
Presented by: Alan D. Conroy, Executive Director
Phone: 785-296-6880
Email: [email protected]
January 16, 2019
•
•
•
•
•
•
•
•
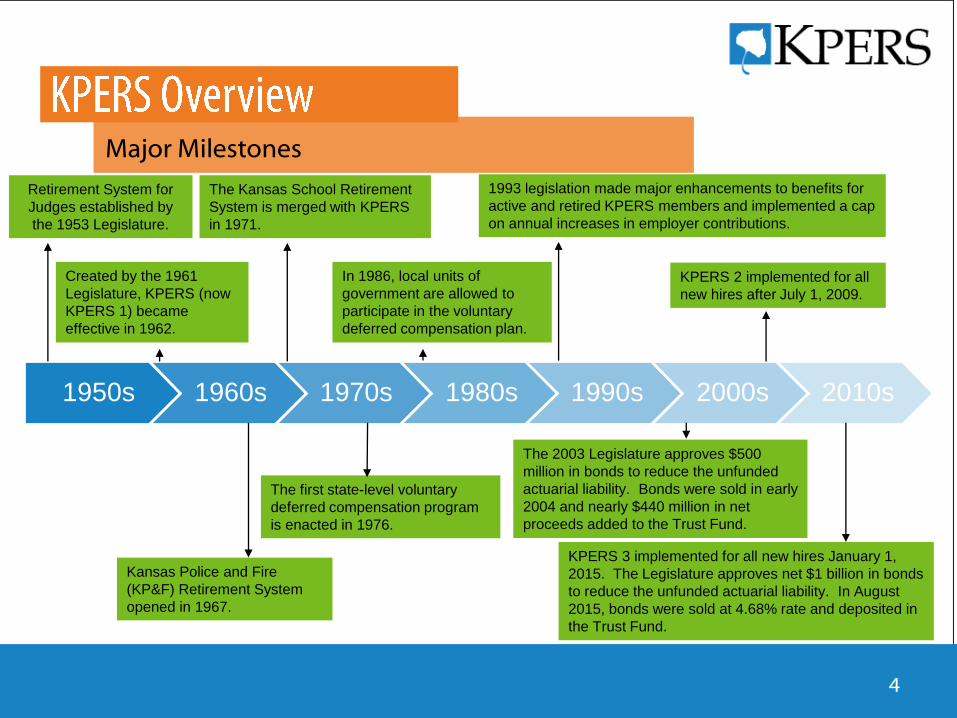
Major Milestones
4
Created by the 1961
Legislature, KPERS (now
KPERS 1) became
effective in 1962.
The Kansas School Retirement
System is merged with KPERS
in 1971.
KPERS 2 implemented for all
new hires after July 1, 2009.
KPERS 3 implemented for all new hires January 1,
2015. The Legislature approves net $1 billion in bonds
to reduce the unfunded actuarial liability. In August
2015, bonds were sold at 4.68% rate and deposited in
the Trust Fund.
Kansas Police and Fire
(KP&F) Retirement System
opened in 1967.
The first state-level voluntary
deferred compensation program
is enacted in 1976.
In 1986, local units of
government are allowed to
participate in the voluntary
deferred compensation plan.
1993 legislation made major enhancements to benefits for
active and retired KPERS members and implemented a cap
on annual increases in employer contributions.
Retirement System for
Judges established by
the 1953 Legislature.
The 2003 Legislature approves $500
million in bonds to reduce the unfunded
actuarial liability. Bonds were sold in early
2004 and nearly $440 million in net
proceeds added to the Trust Fund.
1950s 1960s 1970s 1980s 1990s 2000s 2010s
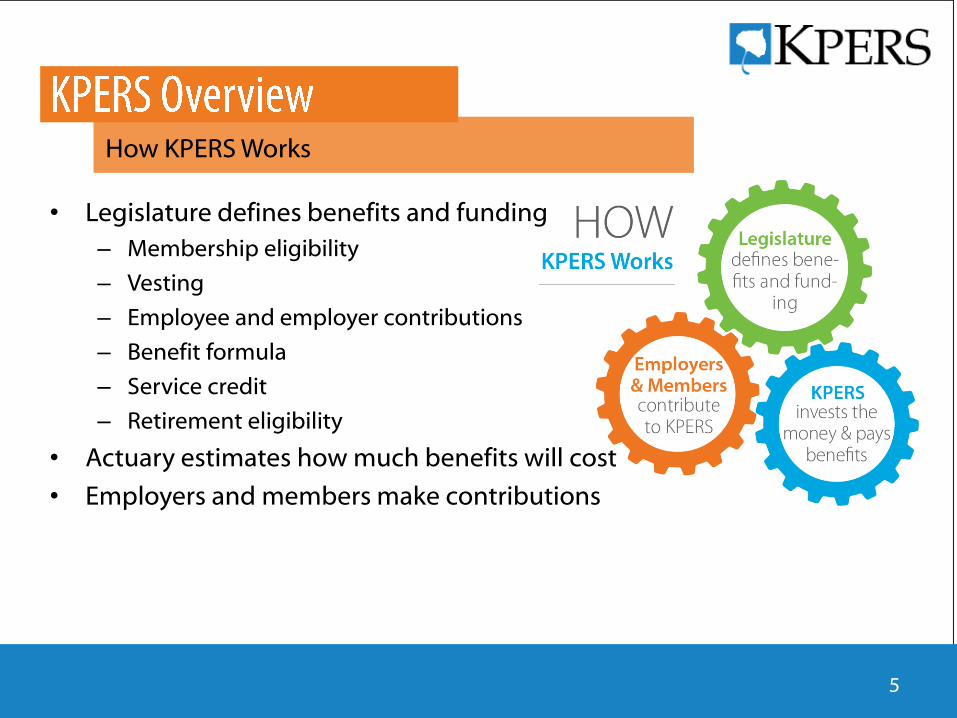
• Legislature defines benefits and funding
– Membership eligibility
– Vesting
– Employee and employer contributions
– Benefit formula
– Service credit
– Retirement eligibility
• Actuary estimates how much benefits will cost
• Employers and members make contributions
How KPERS Works
5
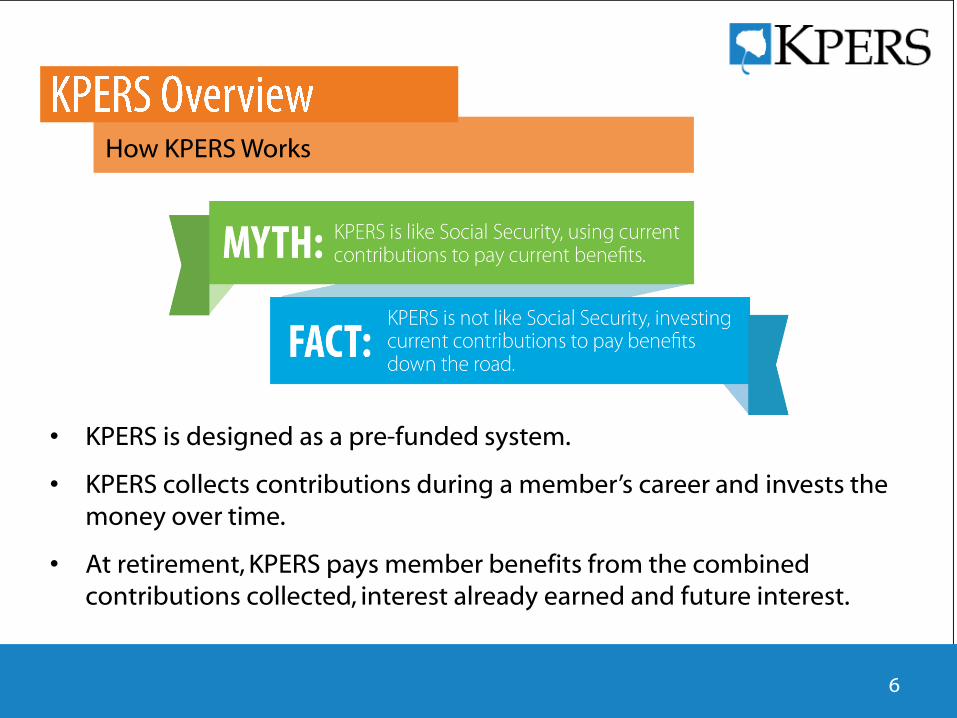
• KPERS is designed as a pre-funded system.
• KPERS collects contributions during a member’s career and invests the money over time.
• At retirement, KPERS pays member benefits from the combined contributions collected, interest already earned and future interest.
How KPERS Works
6
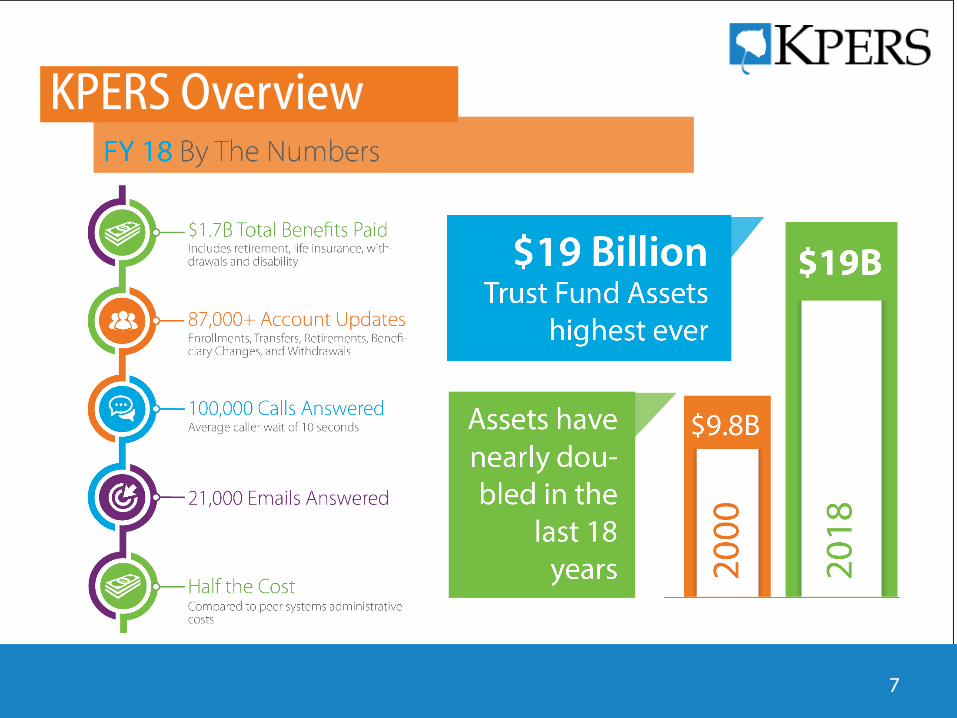
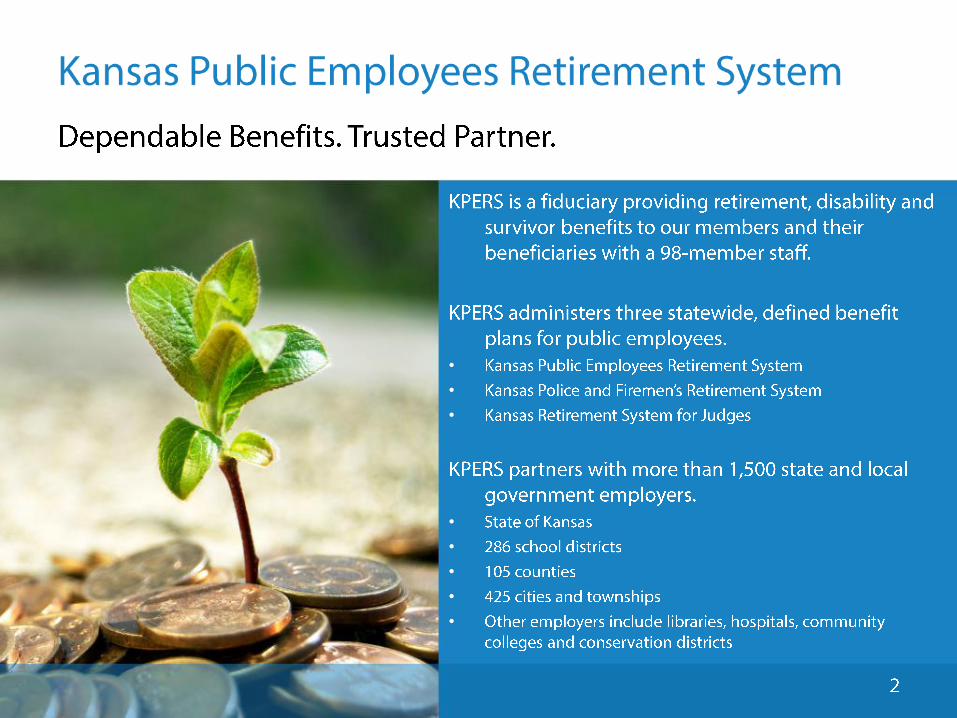
KPERS Overview
7
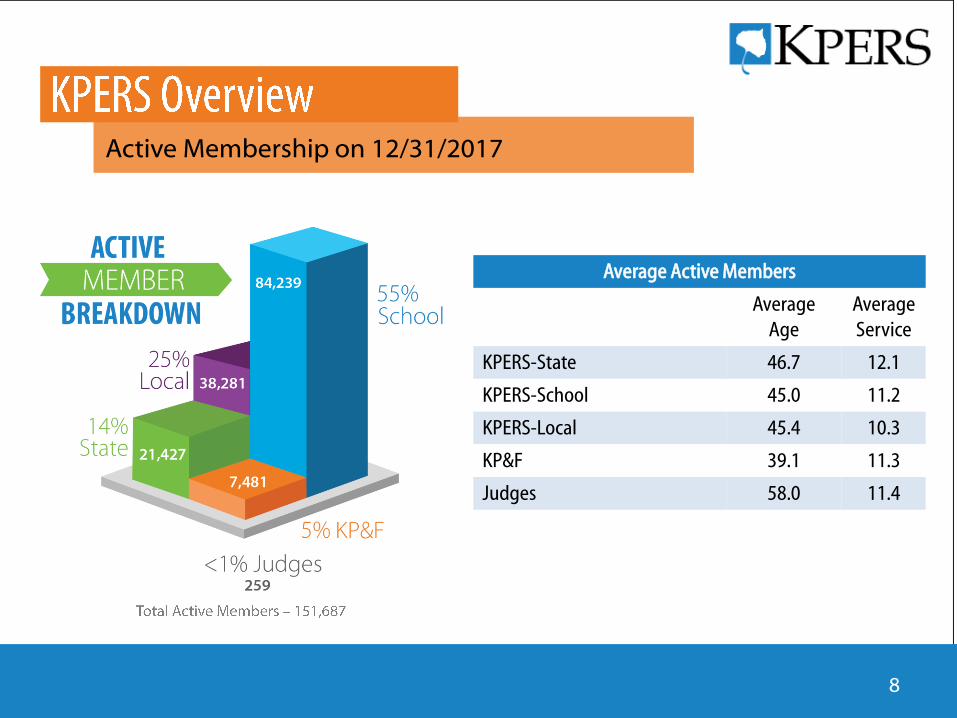
Active Membership on 12/31/2017
8
Average Active Members
Average
Age
Average
Service
KPERS-State 46.7 12.1
KPERS-School 45.0 11.2
KPERS-Local 45.4 10.3
KP&F 39.1 11.3
Judges 58.0 11.4
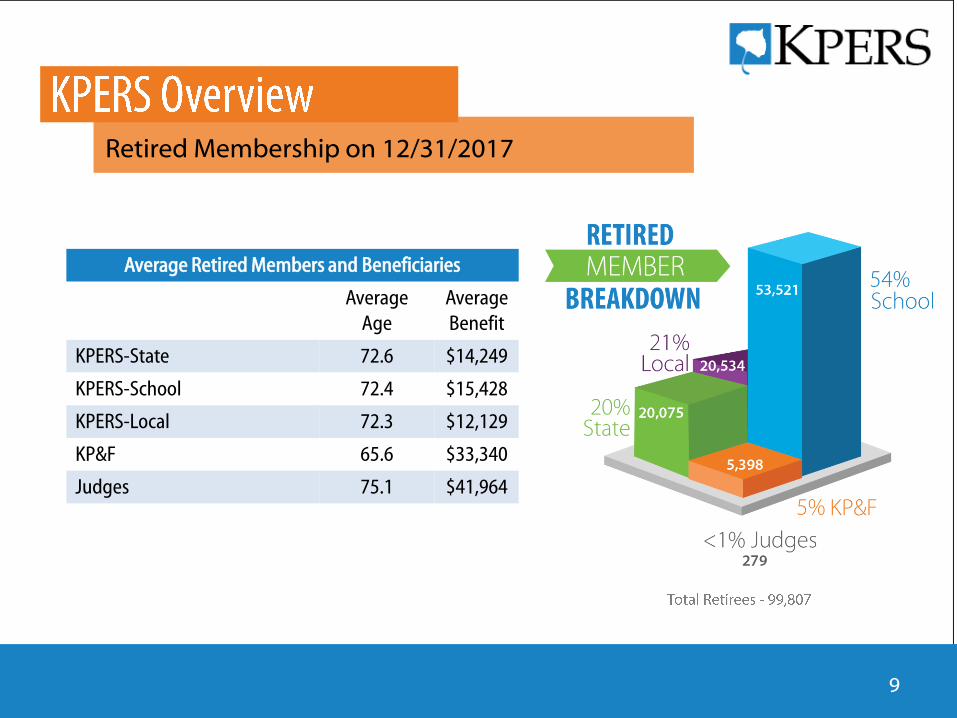
Retired Membership on 12/31/2017
9
Average Retired Members and Beneficiaries
Average
Age
Average
Benefit
KPERS-State 72.6 $14,249
KPERS-School 72.4 $15,428
KPERS-Local 72.3 $12,129
KP&F 65.6 $33,340
Judges 75.1 $41,964
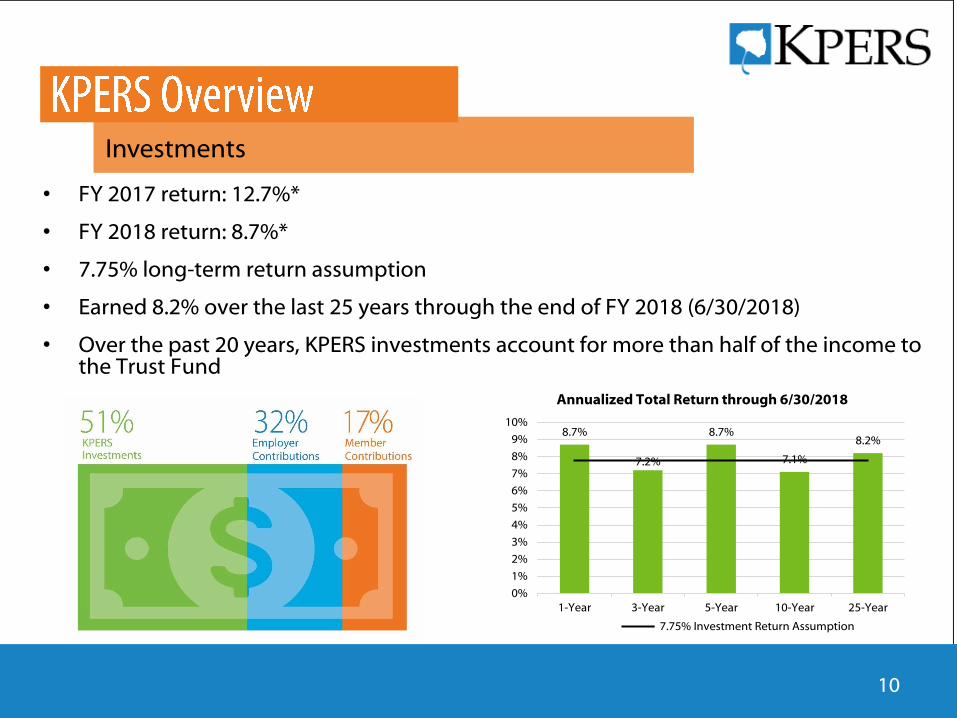
Investments
• FY 2017 return: 12.7%*
• FY 2018 return: 8.7%*
• 7.75% long-term return assumption
• Earned 8.2% over the last 25 years through the end of FY 2018 (6/30/2018)
• Over the past 20 years, KPERS investments account for more than half of the income to the Trust Fund
10
8.7%
7.2%
8.7%
7.1%
8.2%
0%
1%
2%
3%
4%
5%
6%
7%
8%
9%
10%
1-Year 3-Year 5-Year 10-Year 25-Year
Annualized Total Return through 6/30/2018
7.75% Investment Return Assumption
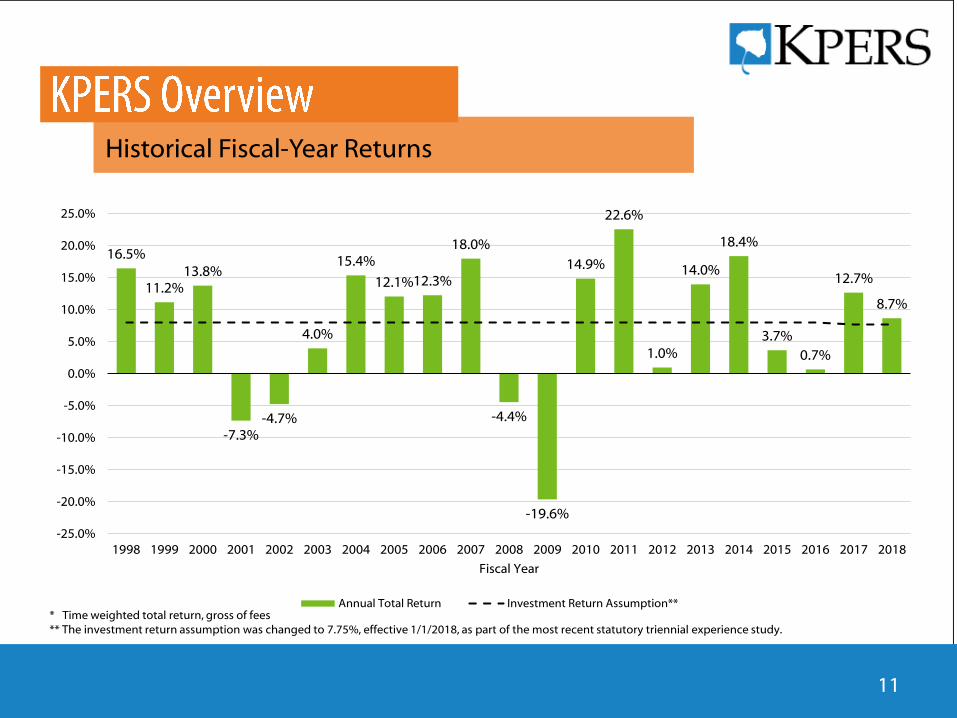
* Time weighted total return, gross of fees** The investment return assumption was changed to 7.75%, effective 1/1/2018, as part of the most recent statutory triennial experience study.
16.5%
11.2%13.8%
-7.3%-4.7%
4.0%
15.4%
12.1%12.3%
18.0%
-4.4%
-19.6%
14.9%
22.6%
1.0%
14.0%
18.4%
3.7%
0.7%
12.7%
8.7%
-25.0%
-20.0%
-15.0%
-10.0%
-5.0%
0.0%
5.0%
10.0%
15.0%
20.0%
25.0%
1998 1999 2000 2001 2002 2003 2004 2005 2006 2007 2008 2009 2010 2011 2012 2013 2014 2015 2016 2017 2018
Fiscal Year
Annual Total Return Investment Return Assumption**
Historical Fiscal-Year Returns
11
12
• FY 2018 contributions
• Future employer contribution projections
• Additional “layered” payments
• Pension obligation bonds
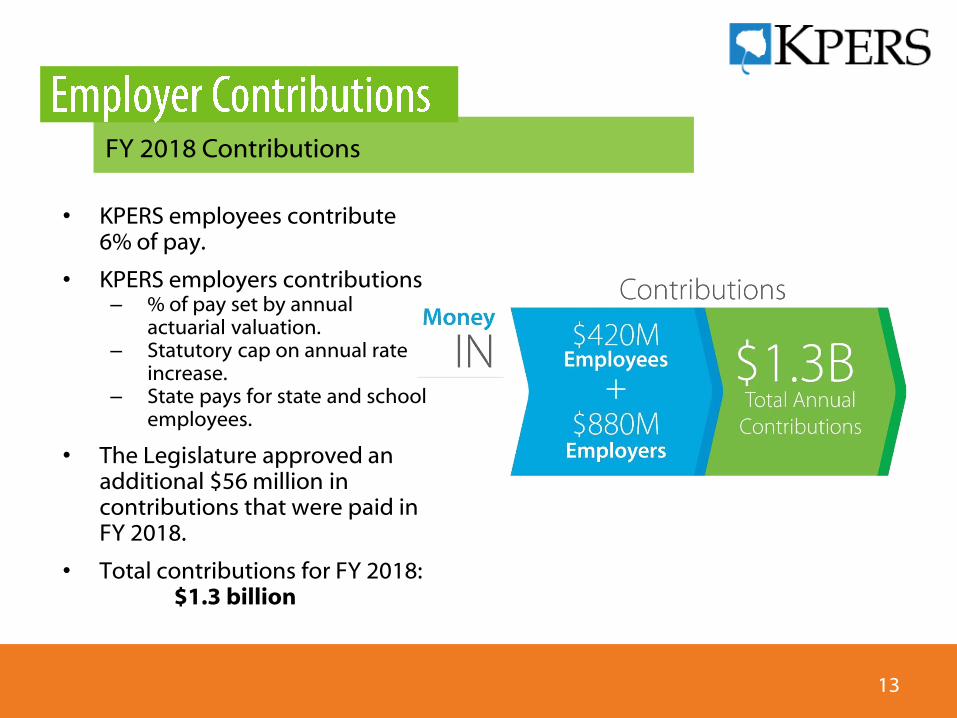
• KPERS employees contribute 6% of pay.
• KPERS employers contributions– % of pay set by annual
actuarial valuation.– Statutory cap on annual rate
increase.– State pays for state and school
employees.
• The Legislature approved an additional $56 million in contributions that were paid in FY 2018.
• Total contributions for FY 2018: $1.3 billion
FY 2018 Contributions
13
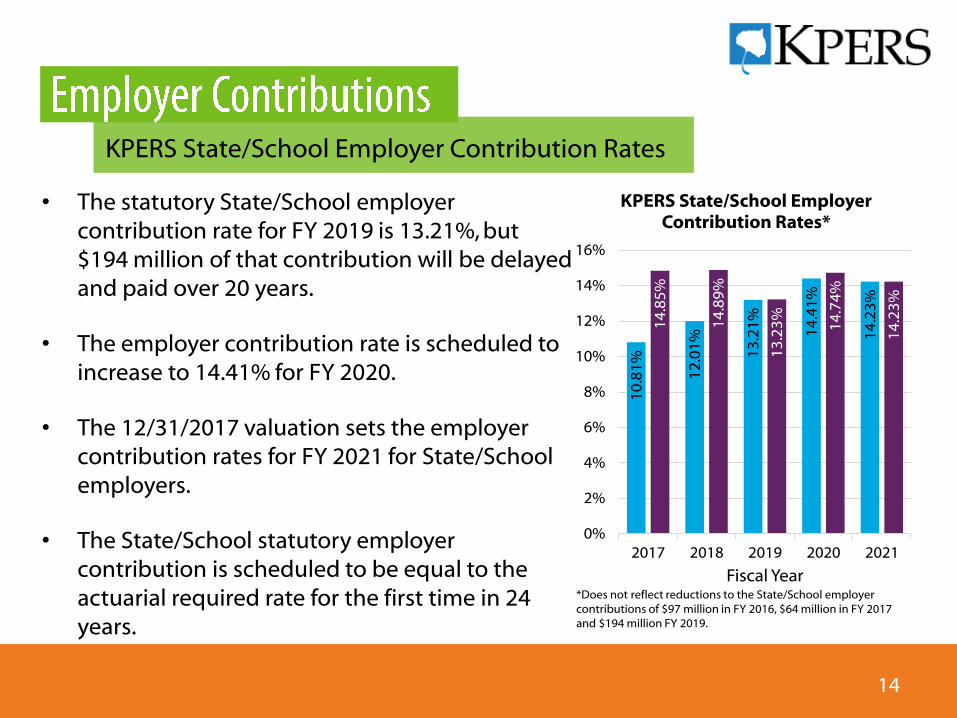
KPERS State/School Employer Contribution Rates
14
• The statutory State/School employer contribution rate for FY 2019 is 13.21%, but $194 million of that contribution will be delayed and paid over 20 years.
• The employer contribution rate is scheduled to increase to 14.41% for FY 2020.
• The 12/31/2017 valuation sets the employer contribution rates for FY 2021 for State/School employers.
• The State/School statutory employer contribution is scheduled to be equal to the actuarial required rate for the first time in 24 years.
10
.81
%
12
.01
%
13
.21
%
14
.41
%
14
.23
%
14
.85
%
14
.89
%
13
.23
%
14
.74
%
14
.23
%
0%
2%
4%
6%
8%
10%
12%
14%
16%
2017 2018 2019 2020 2021
Fiscal Year
KPERS State/School Employer Contribution Rates*
*Does not reflect reductions to the State/School employer contributions of $97 million in FY 2016, $64 million in FY 2017 and $194 million FY 2019.
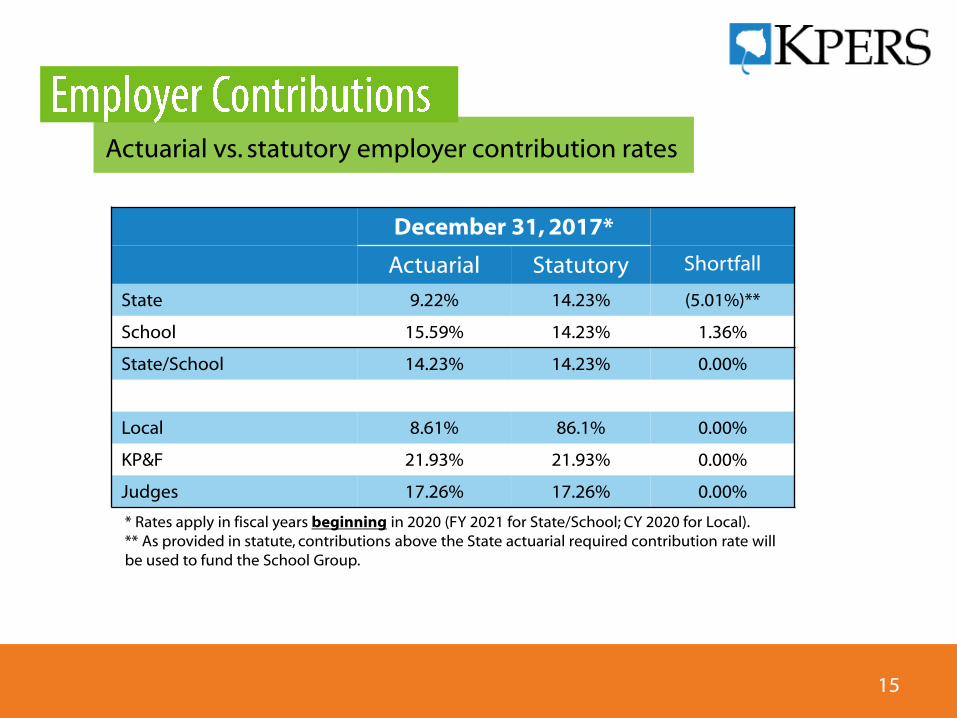
Actuarial vs. statutory employer contribution rates
15
December 31, 2017*
Actuarial Statutory Shortfall
State 9.22% 14.23% (5.01%)**
School 15.59% 14.23% 1.36%
State/School 14.23% 14.23% 0.00%
Local 8.61% 86.1% 0.00%
KP&F 21.93% 21.93% 0.00%
Judges 17.26% 17.26% 0.00%
* Rates apply in fiscal years beginning in 2020 (FY 2021 for State/School; CY 2020 for Local).** As provided in statute, contributions above the State actuarial required contribution rate will be used to fund the School Group.
• The 2018 Legislature approved additional payments to KPERS.
– Up to $56 million in FY 2018 contingent on actual FY 2018 receipts exceeding April revenue estimates.
– $82 million direct transfer in FY 2019.
– Up to $56 million in FY 2019 contingent on actual FY 2019 receipts exceeding April revenue estimates.
• KPERS has received two of the approved payments so far.
– $56 million received in June 2018 for the first contingent payment.
– $82 million received in July 2019.
• Senate Bill 9 would approve an additional $115 million payment to KPERS in FY 2019.
– $115 million was the calculated cost to repay the FY 2016 State/School employer contribution reduction, plus interest.
Additional Contributions
16
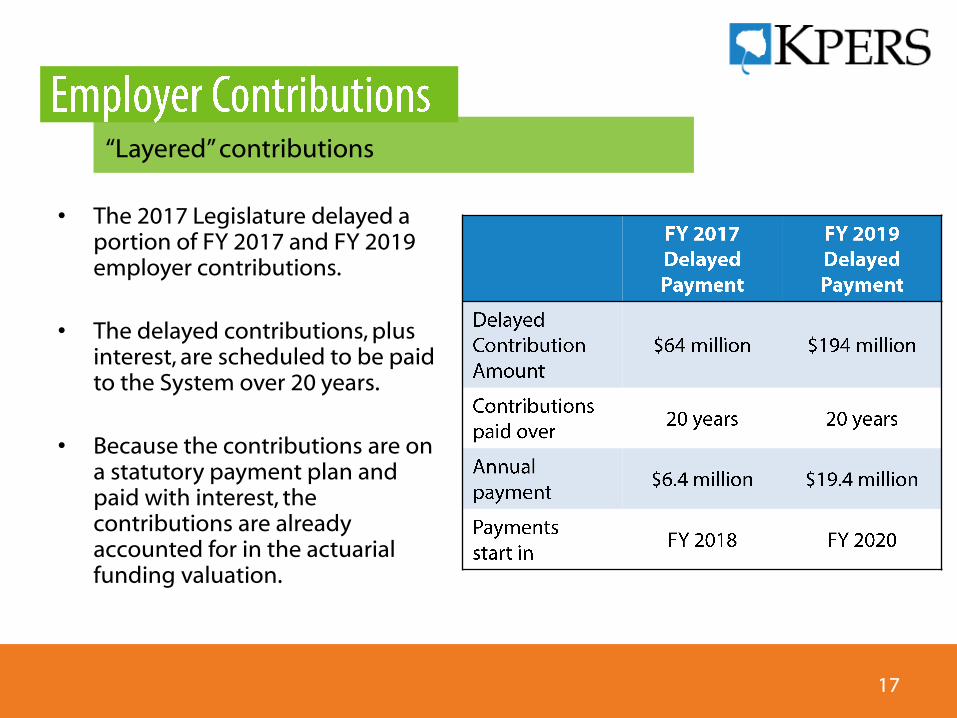
• The 2017 Legislature delayed a portion of FY 2017 and FY 2019 employer contributions.
• The delayed contributions, plus interest, are scheduled to be paid to the System over 20 years.
• Because the contributions are on a statutory payment plan and paid with interest, the contributions are already accounted for in the actuarial funding valuation.
“Layered” contributions
17
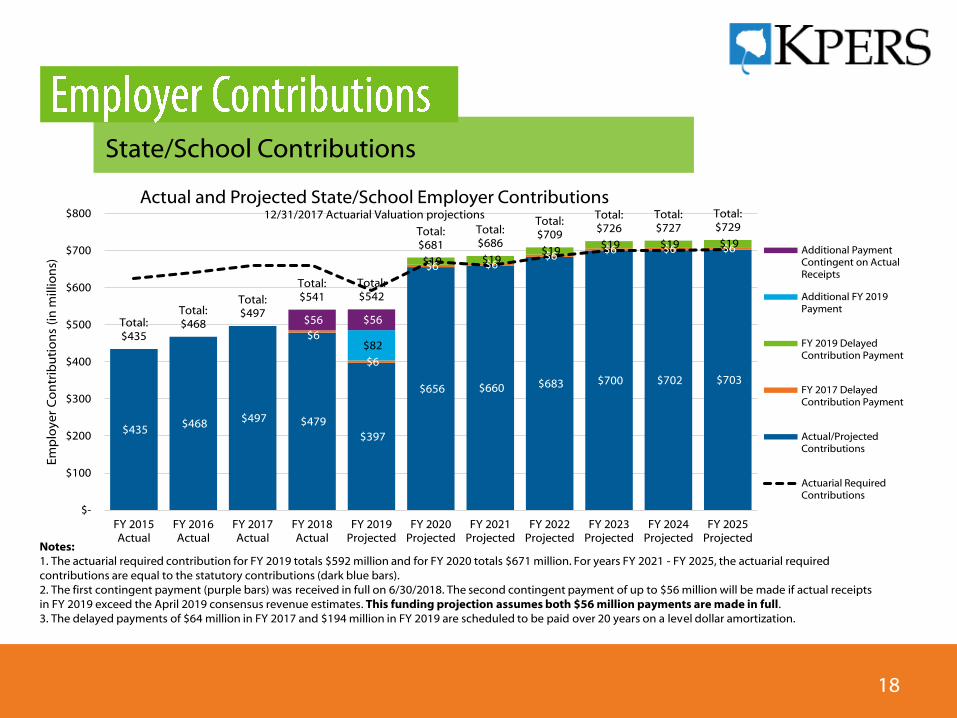
State/School Contributions
18
$435 $468 $497 $479
$397
$656 $660 $683 $700 $702 $703
$6
$6
$6 $6 $6
$6 $6 $6 $19 $19
$19 $19 $19 $19
$82
$56 $56 Total:$435
Total:$468
Total:$497
Total:$541
Total:$542
Total:$681
Total:$686
Total:$709
Total:$726
Total:$727
Total:$729
$-
$100
$200
$300
$400
$500
$600
$700
$800
FY 2015Actual
FY 2016Actual
FY 2017Actual
FY 2018Actual
FY 2019Projected
FY 2020Projected
FY 2021Projected
FY 2022Projected
FY 2023Projected
FY 2024Projected
FY 2025Projected
Em
plo
yer
Co
ntr
ibu
tio
ns
(in
mill
ion
s)
Actual and Projected State/School Employer Contributions12/31/2017 Actuarial Valuation projections
Additional PaymentContingent on ActualReceipts
Additional FY 2019Payment
FY 2019 DelayedContribution Payment
FY 2017 DelayedContribution Payment
Actual/ProjectedContributions
Actuarial RequiredContributions
Notes:1. The actuarial required contribution for FY 2019 totals $592 million and for FY 2020 totals $671 million. For years FY 2021 - FY 2025, the actuarial required contributions are equal to the statutory contributions (dark blue bars). 2. The first contingent payment (purple bars) was received in full on 6/30/2018. The second contingent payment of up to $56 million will be made if actual receipts in FY 2019 exceed the April 2019 consensus revenue estimates. This funding projection assumes both $56 million payments are made in full.3. The delayed payments of $64 million in FY 2017 and $194 million in FY 2019 are scheduled to be paid over 20 years on a level dollar amortization.
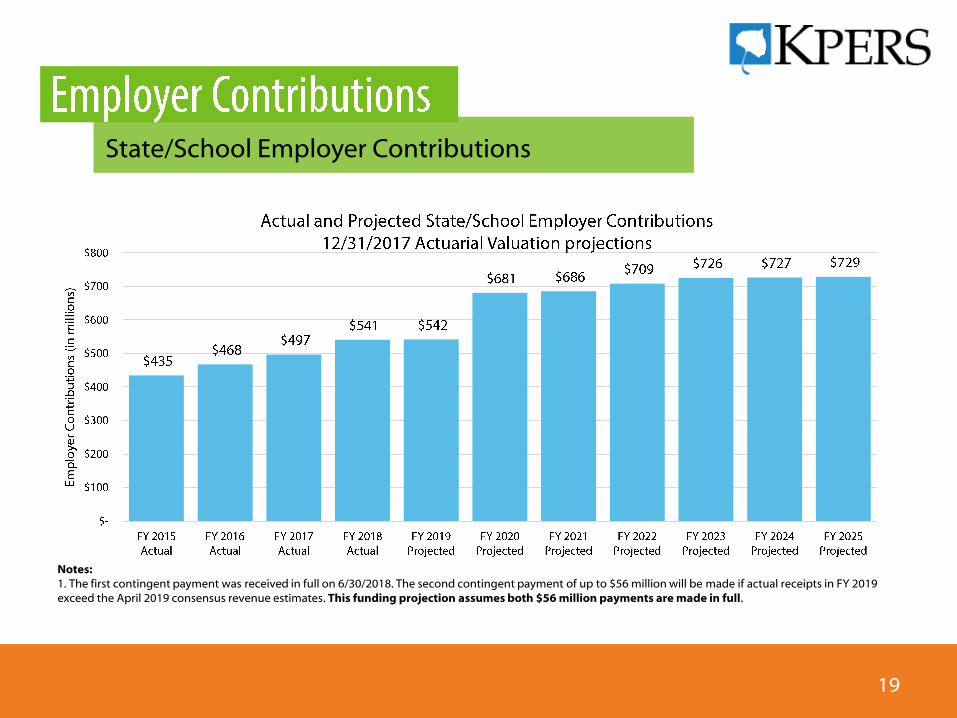
Notes:1. The first contingent payment was received in full on 6/30/2018. The second contingent payment of up to $56 million will be made if actual receipts in FY 2019 exceed the April 2019 consensus revenue estimates. This funding projection assumes both $56 million payments are made in full.
State/School Employer Contributions
19
• The State of Kansas has issued pension obligation bonds to improve the funded status of the System on two occasions. – The first pension obligation bond issue was in 2004 (2004C) for a total of $500
million, gross of fees.
– The second pension obligation bond issue was approved by the Legislature and issued in 2015 (2015H). The approved amount of the pension obligation bonds was $1.0 billion, net of fees.
• The idea behind the bonds is for KPERS investment returns to exceed the interest cost of the bonds (interest arbitrage).
• The State makes annual debt service payments in addition to the annual employer contributions.
History of approved pension obligation bonds
20
• As of November 30, 2018, investment returns on the System’s investment portfolio have exceeded the interest cost of both bond issues.
• The System’s average annualized total return for the time period since the 2004C bond issue is 7.13%, compared to the bond interest cost of 5.39%. The value added since issuance, after payment of the debt service, is over $261.2 million.
• The System’s average annualized total return for the time period since the 2015H bond issue is 6.64%, compared to the bond interest cost of 4.68%. The value added since issuance, after payment of the debt service, is over $72.9 million.
Investment performance as of November 30, 2018
21
22
• Steady progress
• Funding plan
• Funding projections
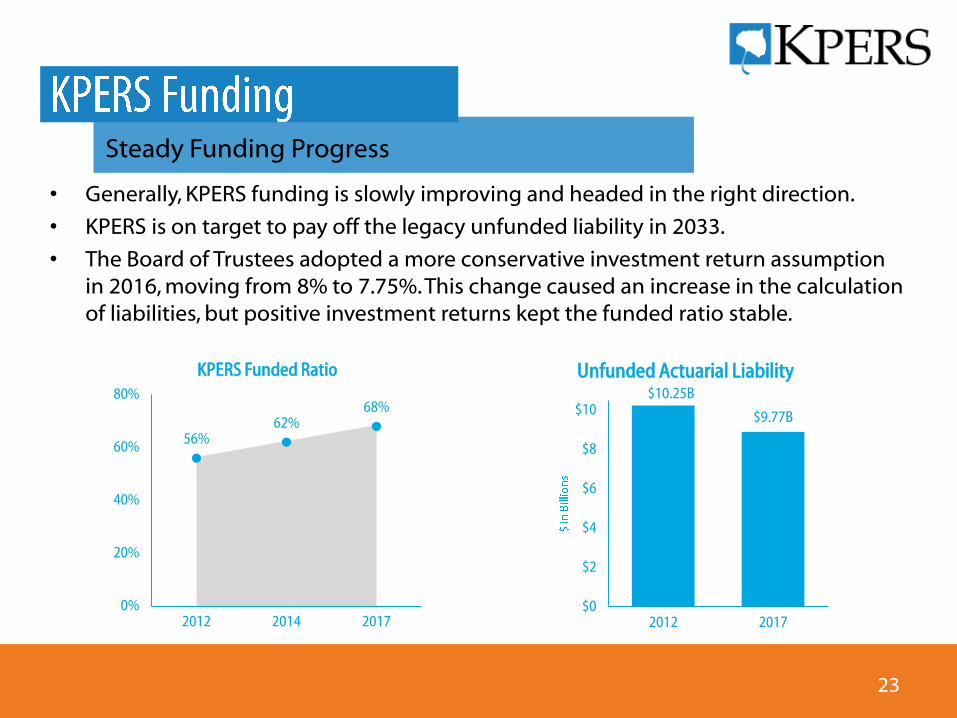
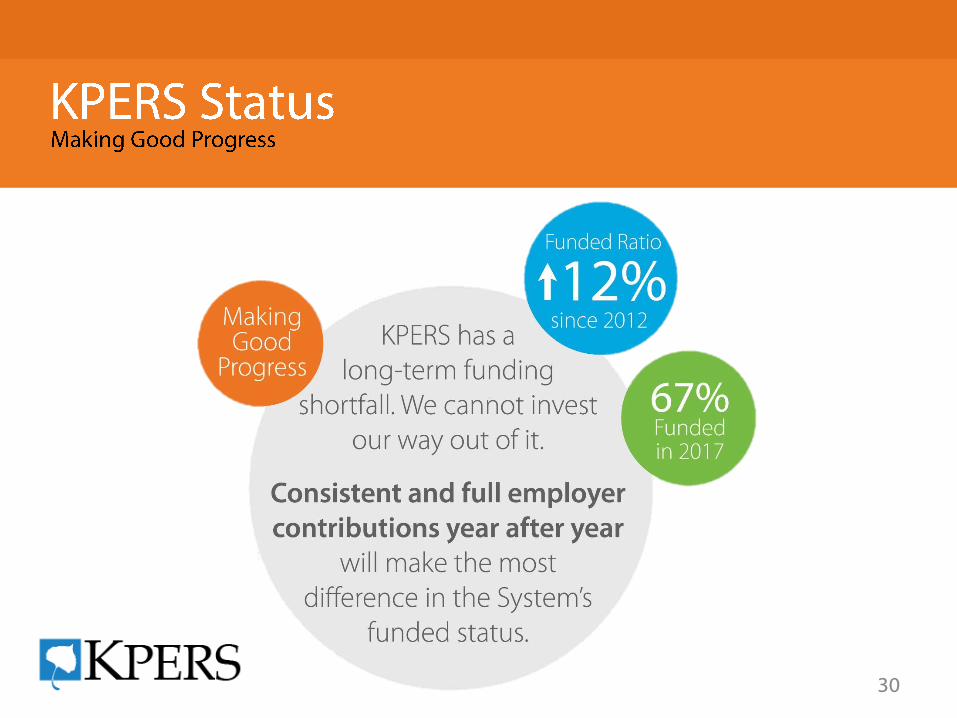
• Generally, KPERS funding is slowly improving and headed in the right direction.
• KPERS is on target to pay off the legacy unfunded liability in 2033.
• The Board of Trustees adopted a more conservative investment return assumption in 2016, moving from 8% to 7.75%. This change caused an increase in the calculation of liabilities, but positive investment returns kept the funded ratio stable.
Steady Funding Progress
23
56%62%
68%
0%
20%
40%
60%
80%
2012 2014 2017
KPERS Funded Ratio$10.25B
$9.77B
$0
$2
$4
$6
$8
$10
2012 2017
Unfunded Actuarial Liability
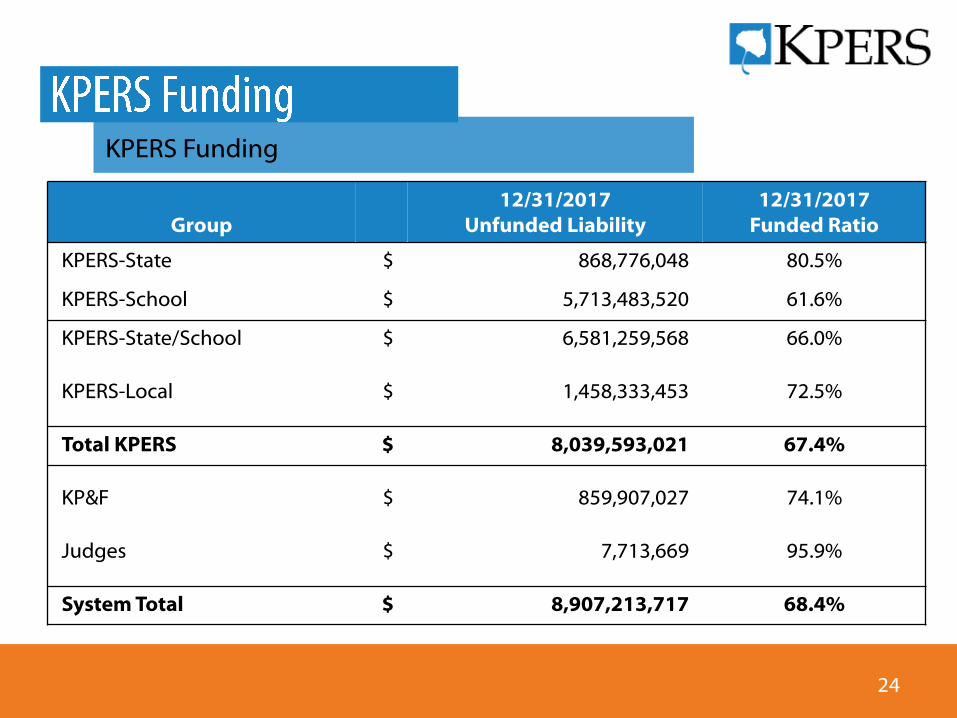
Group12/31/2017
Unfunded Liability12/31/2017
Funded Ratio
KPERS-State $ 868,776,048 80.5%
KPERS-School $ 5,713,483,520 61.6%
KPERS-State/School $ 6,581,259,568 66.0%
KPERS-Local $ 1,458,333,453 72.5%
Total KPERS $ 8,039,593,021 67.4%
KP&F $ 859,907,027 74.1%
Judges $ 7,713,669 95.9%
System Total $ 8,907,213,717 68.4%
KPERS Funding
24
• The System has a funding plan to fully fund the System.
• The Legislature set a 40-year, closed amortization period in 1993.
• The Board of Trustees approved a layered amortization approach as part of the last triennial experience study. – The existing unfunded liability (legacy unfunded liability) remains on the 40-year
amortization schedule, ending in 2033.
– Each year any experience different than the actuarial assumptions (either positive or negative) will be realized in separate 20-year amortization periods.
– Each layer will have an annual “payment” calculated and each layer’s payment is added together to calculate a single unfunded liability payment.
Funding the unfunded liability
25
• “Level percent of pay” amortization methodology results in an increase in the dollar amount of unfunded actuarial liability over more than half of amortization period, even if full actuarial required contribution rate is paid.
• Amortization period on the legacy unfunded liability has declined and at the point where unfunded actuarial liability will start decreasing if full actuarial required contribution rate is paid and all assumptions are met.
Funding the unfunded liability
26
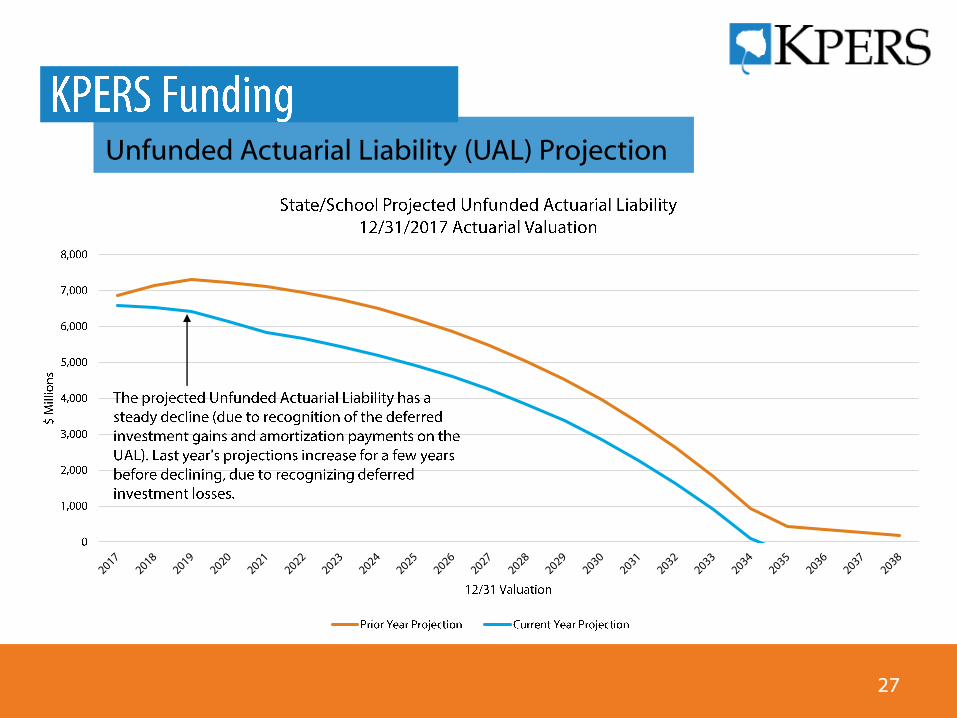
Unfunded Actuarial Liability (UAL) Projection
27
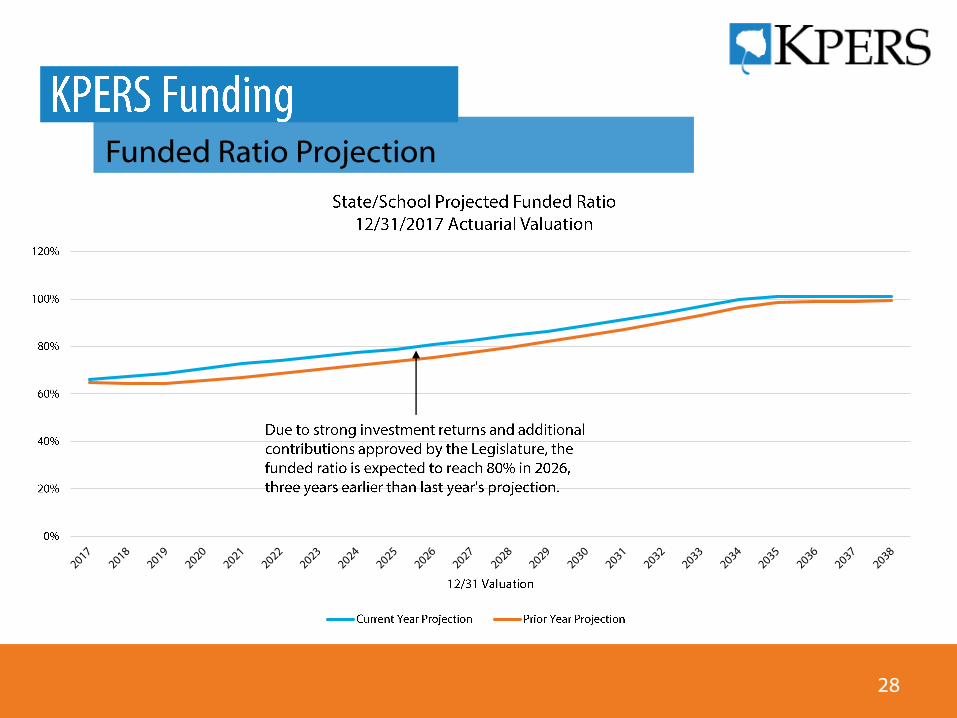
Funded Ratio Projection
28
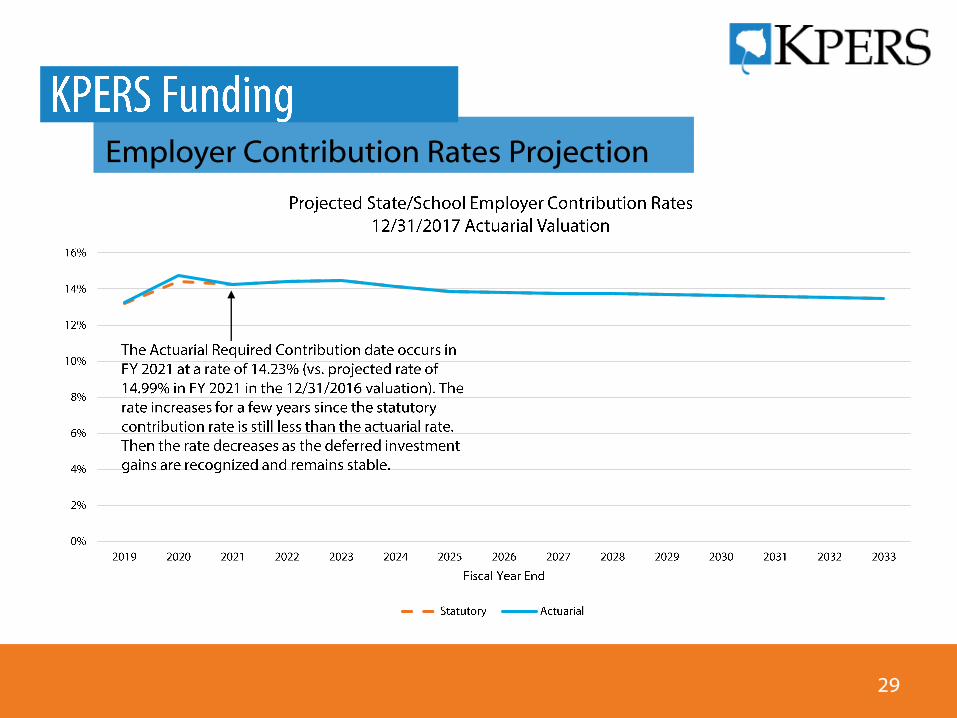
Employer Contribution Rates Projection
29
30
Benefits will be here
31
• The fiduciary standard is our guiding principle and driving force.
• As a fiduciary, KPERS serves members by:– Holding assets in trust;
– Growing those assets through investments; and
– Delivering promised benefits when the time comes.
• Funds can never be removed from a trust fund like KPERS for any reason other than to fund the benefits of members and pay expenses of the System.
• With approximately $19 billion in assets today and a well diversified investment portfolio, KPERS is able to pay promised benefits for many years.
32
Questions?