Embed Size (px)
Citation preview

South Korean Energy Outlook:
I Coal and Electricity Focus
Cod Project Program on Resources: Energy and Minerals
East-West Center
Honolulu, Hawaii 96848 1777 EW-Wmt Road
Td: (808) 944-7550 Fa: (808) 944-7559
3L March 1995

DISCLAIMER
Portions of this document may be illegible electronic image products. Images are produced from the best available original document.

I t N
south “k Korea
C.
la8 b W
EXECUTIVE SUMMARY
From 1981 to 1993* the Republic of Korea Korea) had the third highest energy growth rate and the second highest GDP growth rate in Asia. The demand for electricity is projected to increase at an average of 7.2 percent per year to 2000 and wage 4.5 percent per yearfiom 2001 to 2015. Korea is projected to accomt for the hrgest increase in imported coal (44 million tons) among Asian co~naesfiom 1995 to 2015. Bituminous coal consumption is projected to increase from 33 minlbn tom in 1994 to 80 million tom in 2015. Planned SO2 emission limits fop thc late- 1990s will resuit in tk insitdilation of &suljimzation technolq$es on new c d - fired p e r p h . Cml-j?red generating apc i t y is projected to increase from 5.8 GW in 1993 to 11.6 GWin 2000and24.2 GWin 201s. High costpr&tion of rdomestc imthracite will fall to less than five million tuns by 2000. Nuclear power is projected to contim to account for the kzrgesf share of eieciriCiiy generation over the 1995-20lSpCriod Opportunities for p m a e participafioor are developing in rhc power sector; howewr, near term opportunilies nury be limited ami above mrage retuna on hws!men& am expected to be &#cult to achieve. Korea 3 strotegy to have dversi~ed energy sources and equity pmtici- in coal mines is expected to continueB but will incremihgly be pi&d by market fwces
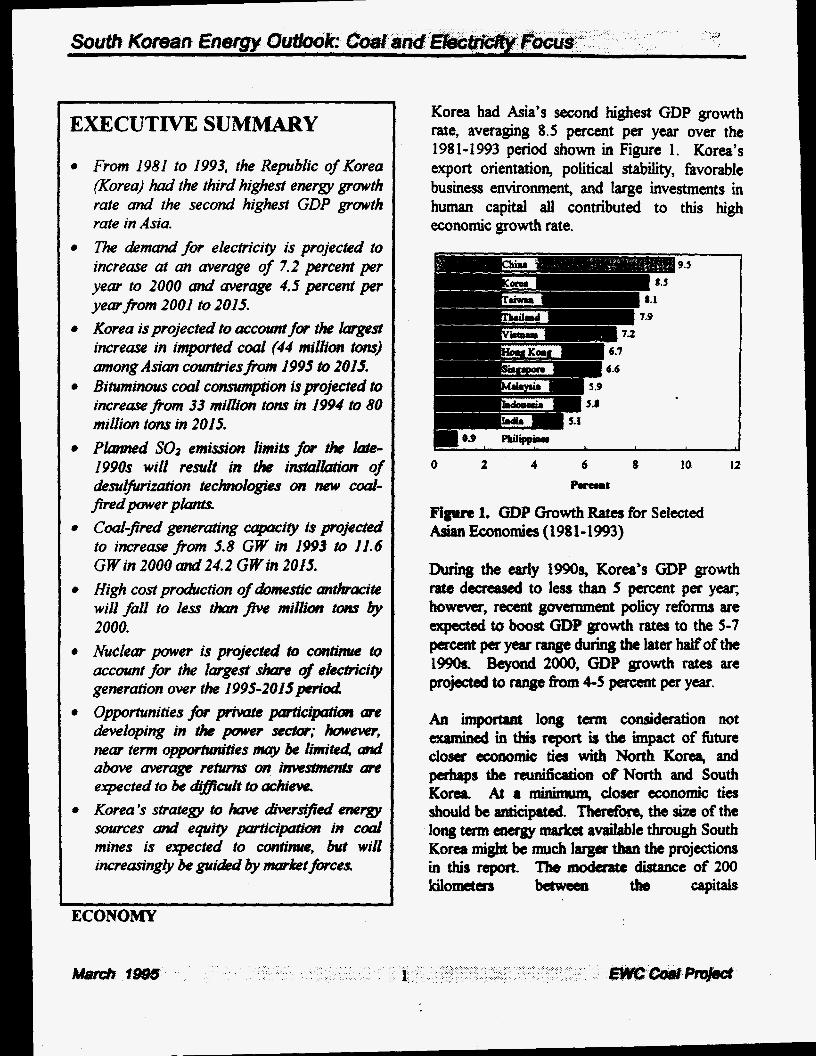
Korea had Asia’s second highest GDP growth rate, averaging 8.5 percent per year over the 1981-1993 period shown in Figure 1. Korea’s export orientation, political stabiity, favorable business environment, and large investments in human capital ail contributed to this high economic growth rate.
0.9 Philippirr I
0 2 4 6 8 10 I2 P a c # L
Figm 1. GDP Growth Rates for Selected Asian Economies (1981-1993)
During the early 1990% Korea’s GDP growth rate dacregsed to less than 5 percent per y e , however, recent government policy reforms are w d tb boost GDP g O w t h rates to the 5-7 percent payear range during the later halfof the 1% B e y o n d 2000, GDP growth fates are projected to range h m 4 - 5 percent per year.
An important long term consideration not
closer economic ties with North Korea, and pghaps the d a t i o n ofNorth and South Korea At 8 mhhnn , cfoser ecomrnic ties should be anticipd. Theneforq the size ofthe tong tcrm energy market available through South Korea might be much larger than the projections in this report. The modcratc dktancc of 200 kil0-US bemeeat the capitals
examimd in tbis report is ths impact of future
ECONOMY

of North and South Korea (and their population centers) suggests interconnection of the two electricity systems may have economic merit in the long term.
ENERGY SECTOR ORGANIZATION e
0
e
e
a
e
The Ministry of Trade, Industry and Energy (MOT) is Korea’s key energy planning agency. The Korean Electric Power Corporation (KEPCO) is a stataowned power corporation responsible for Korea’s electricity generation, transmission, and distribution. The Ministry of Science and Technology (MOST) licenses, regulates, and supervises the nuclear industry, but KEPCO retains the responsibility for nuclear power plant procurement, construction, and operation. The Korea Gas Corporation (KGC), a state- owned corporation, operates the receiving terminal for liquefied natural gas W G ) and transports gas to KEPCO and to private town gas companies. According to the Korean government, additional companies may be dowed to import LslJG in the near fbture. Korea’s oil refineries arc now controlled by five b s , and this sector is scheduled to be gradually opened to new h S . The Korea Institute of Energy Research (KIER) is responsible for the advancement of energy and mineral technology, and the collection and preparation of energy data The Korea Energy EcommicS Institute (KEEI) prepares the annual report ‘‘Korea Energy Outlook” and undertakes a range of economic analyses of energy issues in Korea
ENERGY POLICIES The increase in petroleum prices in the 1970s resulted in government policies to d i v e away f?om heavy dependence on petroleum, and to establish multiple sources of energy suppties.
The two largest beneficiaries of these policies have been Korea’s programs for nuclear and coal-fired power plants.
The Korean government has a long term goal to have domestic companies hold equity in mines supplying 30 percent of cod imports. However, over the past decade, Korean companies have held equity in overseas mines accounting for a relativeiy constant 9 percent of import needs. Foreign equity participation exists in mines in Australia, Canada, and the United States, with substantial low quality coal holdings in Indonesia.
The Korean government is likely to reduce its present 78 percent ownership in KEPCO to under 70 percent in the next few years. In addition, the gov- is opening the power sector to various forms of private scctor participation (see Private Sector Opportunities).
The ‘‘Support for ConrmwritieS Surrounding Power Plants Act“ was enacted in 1980 to promote understanding and cooperation between local COmmuNtI * ‘es and power plants. By the end of 1993 KEPCO had spent $68 million for cooperation activities, including installing pubtic fiicilities and subiditing education. Foreign investors in power plants Win need to include provisions for financial support to local commwities for all fhre power plant developmests.
ENERGY OVERVIEW Figure 2 shows that during the 1981-1985 period, energy consumption in Korea grew at 5.1 percent pet yeat, then doubled to 10.6 pacmt per year &om 1986 to 1993. This figure also shows that the energy consumption growth rate is projected to decrease to 6.1 percent

between 1994 and 2000, and then average 3.2 percent per year between 200 1 and 20 1 5 .
12 10.6 I
IO
8
B g 6
4
2
0 I911 -I 985 1916-1 993 1994-2000 ZOO1 -201 5
Figure 2. Energy Consumption Growth Rates
Figure 3 shows the estimated energy mix for 1994 and the projected energy mix for 2000 and 2015. In 1994, the energy mix consisted of od-63 percent, coal-20 percent, nuclear-11 percent, LNG-5 percent, hydro and other renewables-2 percent. The energy sources projected to have the highest annual growth rate in the medium term (1994-2OOO) are LNG at 8.3 percent and nuclear at 7.6 percent.
1 0 0 - n n n 90 80 70 60
5 50 40 30 20 10
- - - - - - -
c1
a 0
a
- -
0 - 1994 2000 2015
Figure 3. Primary Energy Consumption Mix in the Korean Economy: 1994-2015
I The high elasticitydenergyto GDP growth rata is declining rapidly toward 1.0. Both GDP and energy consumptionareprojectedto grow at anaverageofabaU 6.0 percent per year m r the 1994-2000 period (elasticity = 1.0).
Korea’s 95 percent dependence on energy imports results in substantial weight given to strategic considerations. Korea follows a policy of diversifled energy types and diversifled sources of supply. However, increasingly, the trend is toward market forces (price) determining coal supplies.
ENERGY RESERVES AND COAL PRODUCTXON South Korea has modest rtserves of about 200 million tons of anthfacite co4 and 3 GW of large@ deveIoped hydropower. The removal of govenrment assistance to the high cost anthracite industry in the late 1980s resulted in a rapid daiine in production fiom 24.8 million tons in 1988 to 9.4 million tons in 1993. Anthracite production in the fbtm is speculstive, with a plausible scenatio of 3-5 d o n tons in 2000 and 1-3 rniUions tons by 2010. Three quarten of the existing 40 anthtacite mines in Korea are projected to cease operation within a few years (Kim Xi-Kwang, 1994).
Note that North Korea apparently has large rescryeg of anthracite and produces at least 30 million tons per year, and, according to some sourceq much more. It is speculated that much of the North Korean production is high cost and would not be competitive in a market economy.
COAL CONSUMPTION Korea’s targe, rapidly-growing bituminous coal demand is met entirely by imports. During the next 15 yean Korea is projected to account for the fargat increase in coal imports of any Asian country. As shown in Tabk 1, bitwninous coal consumption jumped &om 5 d o n tons per year in 1980 to 33 million tom in 1993, and is projected to reach 48 d o n tons by ZOO0 and 80 million tons by 2015. Table 1 also shows that dt sectom with the exception of the residential sector, have increased coal

consumptions over the 1980- 1993 period. Anthracite consumption, primarily in the residential sector, has been declining by more than 20 percent per year in recent years. Anthracite consumption decreased by about 50 percent from 1980-1993, primarily because of the shrinking residential and commercial market.
Table 1. Coal Consumption by Sector Million metric tons)
thracite
ommerciai
.... ..... " ......... "".-....-... identiid&
otdAfIthr8cite
1980 1 1 .... "..................
0.9 20.5
1993 I2000* I 2015*
........ "-
2.2
7.7
2.3
~~~~ ~
"-.........--...
Electricity cement & others - TotalBituminowl 5.0 I 32.9 I 48.4 I 79.7
Residential& "1 18.0 7.7 1.3 0.1 Total Coal Consumption
Commercial Iron & Steel 4.0 16.0 55.6 55.5 '
Electricity 1.6 12.6 27.2 57.0 CemeXltBtothen 1.9 6.7 8.0 9.4 Total 25.5 43.0 52.1 82.0 *Projections by the EWC Coai Prqed Sources: Major Statistics ofKorean Ecoaomy lW, Korea Energy ~evtew ~onthty , arch 1%; K E ~ KEPCO; asxi MOT.
.........- .......... .......-.-... .........-.- ..... __.-....
I
l
In 1994, thermal coal accounted for about 54 percent of coal imports. By 2015, thamal coal is projected to increase its share to about 80 percent of total coal imports. In 1994, Australia, Canada, and the United States Bccounted for two thirds of Korea's coal imports. The trend in imports is for increasing imports fhm Asia and
Oil's share demased by twcAirds &om 79 percent in 1980 to 24 percent in 1993,
Between 1993 and 2015, increasing shares of gaeration are projected for nuclear (40 percent to 48 percent) and cod (21 percent to 34 ---
~~
Australia and a declining share of imports from North America-particularly higher priced U.S. supplies. Increased suppiies are planned fiom low cost suppliers in Indonesia and South Afiica, which may adversely influence Australia's share of Korea's imports in the 1990s.
ELECTRICITY SECTOR During the 1980-1993 period, electricity consumption grew at an average of 11 percent per year-almost one-third faster than the GDP growth rate of 8.5 percent per year. The growth in electricity consumption jumped almost one-third to 14.2 percent in 1994 and is projected to increase by 9 percent in 199s (KEEk 1995). In response to the higher tb expected growth rate in electricity Consumption, MOT has revised its projections of peak capacity &om 36 GW to 41 GW in 2000. These higb growth rates are projected to decline substantially by 1996 or 1997. The growth rate in electricity generation is projected to average 7.2 percent per year between 1994
betwan 2000 and 2015. and 2000, and 4.5 percent per year
Figure 4 shows major c h g e s occurring in the energy mix of electricity generation h r n 1980 to 2015. During the 1980- 1993 period, nuclear's share of generation grew fiom 9 percent to 40 percent, followed by coal, which increased &om 7 to 21 percent. The LNG market devdoped a f k 1985, and accounted for 10 percent of total generation in 1993.
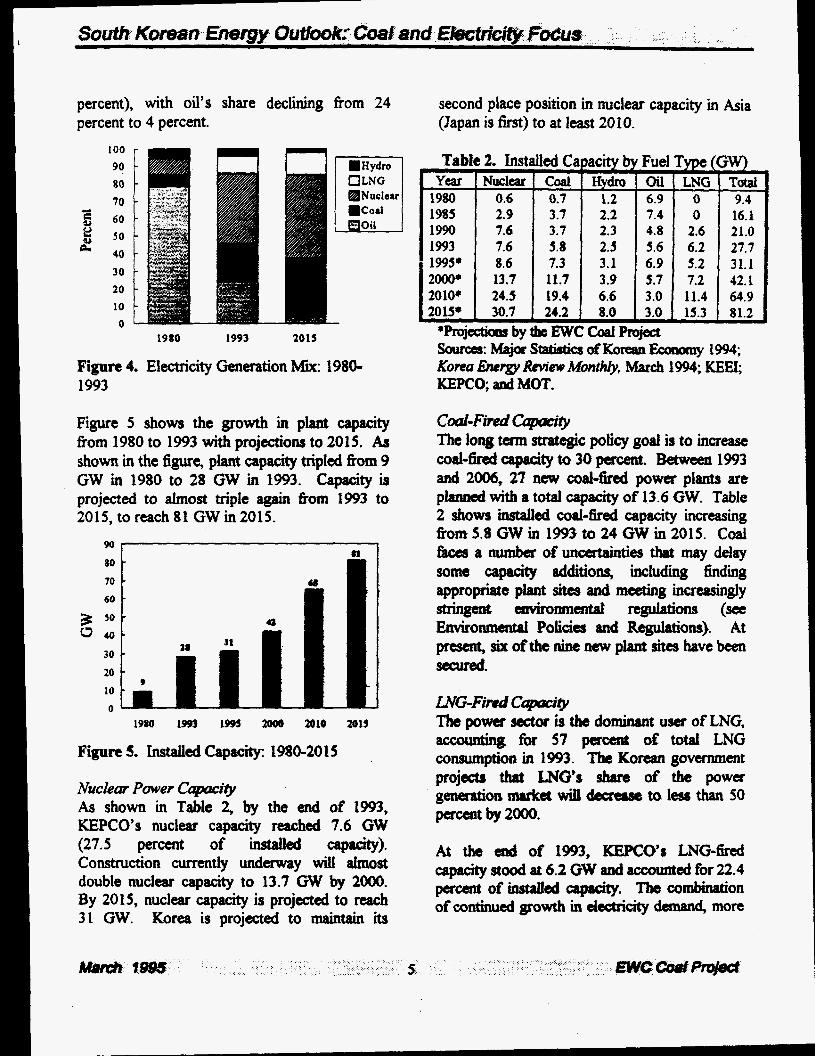
percent), with oil’s share declining from 24 percent to 4 percent.
second place position in nuclear capacity in Asia (Japan is first) to at least 20 10.
100 90 80 70 60
$ 50
- a 40
30 20 10 0
1980 1993 201s
Figure 4. ElectriCity Generation Mix: 1980- 1993
Figure 5 shows the growth in plant Capacity from 1980 to 1993 with projections to 2015. As shown in the figure, piant capacity tripled from 9 GW in 1980 to 28 GW in 1993. Capacity is projected to almost triple again &om 1993 to 2015, to reach 81 GW in 2015.
80 - - 70 - 60
I - 3 s o - U 0 40. 31 28 30 -
20 - c
i
1980 im 1 9 ~ 2006 m a 201s
Figure 5. Installed Capacity: 1980-2015
Nuclear Power C’2y As shown in Table 2, by the end of 1993, KEPCO’s nuclear capacity reached 7.6 GW (27.5 permt of instailed CappCity). Construction currently underway will aitlhost double nuclear capacity to 13.7 GW by 2000. By 2015, nuclear capacity is projected to reach 31 GW. Korea is projected to maintainits
Table 2. Installed Capacity by Fuel Type (GW) Year Nuclear Coat Hydro Oil LNG Totat
1980 0.6 0.7 1.2 ~ 6.9 0 9.4 1985 2.9 3.7 2.2 7.4 0 16.1 1990 7.6 3.7 2.3 4.8 2.6 21.0 1993 7.6 5.8 2.5 5.6 6.2 27.7 1999 8.6 7.3 3.1 6.9 5.2 31.1 2000* 13.7 11.7 3.9 5.7 7.2 42.1 I 2010* 24.4 19.4 6.6 3.0 11.4 64.9 ’
I 2 O W I 30.7 I 24.2 I 8.0 I 3.0 I 15.3 I 81.2 *Projectbas bythe EWC Coal Project sounxS. h&&x Statistics ofKore!au Ecanaay 1994; Koreu Energv Review Month&, March 1994; KEEI; KEPCO a d MOT.
Coal-Fired C V . ~
~ 0 d - M Cagacity to 30 percent, k t ~ e ~ ~ 1993 4 2006,27 IICW ~0al-W plants
The long term strategic policy god is to increase
p l d with a total capacity of 13.6 GW. Table
h r n 5.8 GW in 1993 to 24 GW in 2015. Coal t3cu a number ofunGertainties that may delay some capacity additions including flnding appropriate plant sites and meeting increasingly stringent enVironmd ngulations (see Environmental Policies and Regulations). At present, six ofthe nine new plant sites have been secured.
2 shows installed Coal-fired capacity increasing
LNGFired Cqxzcify The power sector is the dominant user of LNG, accounting fur 57 percent of total LNG consumption in 1993. The Korean government projects that WG’s share of the power g d O U rmrke d dccreost tQ leslr than 50 percentbY2OOo.
At the d O f 1993, KEPCO’S LNG-fired Capacity stood at 6.2 GW and 8ccouIltcd for 22.4 percent of iastalled capcity. The combination of continued growth in electricity demand, more

stringent environmental regulations, and the need for peak-load capacity will result in LNG capacity growing to about 15 GW by 2015. The installation of LNG-fired combined cycle power plants has allowed KEPCO to achieve very high thermal efficiencies of almost 50 percent and to supply district heating in connection with the government’s “New Town Development Plan.”
The possibility of pipeline gas from the Sakahah gas fields (about 3000 kilometers to the north of Seoul, in the Russian Far East) has been suggested by Khartukov (1994) and others; however, such a pipehe interconnection with Korea is unlikely before 2010 at the earliest.
Pumped Storage Capacity As previously noted, hydroelectric capacity is largely committed. However, KEPCO plans 3 GW of pumped storage capacity for the 1993 to 2006 period. The 19 planned pumped storage facilities are necessary to make use of off-peak electricity fiom its nuclear power plants. The combination of conventional hydro and pumped storage capacity is projected to increase &om 2.5 GW in 1993 to 8.0 GW in 2015, as shown in Table 2. However, long term projections of pumped storage capacity are specdative.
Oil-Fired Capcity Strictly oil-fired capacity is projected to gradually decline from 5.6 GW in 1993 to 3 GW in 2015. In the intermediate term fiom 1993 to 2006, KEPCO plaas to add about 500 MW of oil-fired capacity.
Although the role of oil in the power sector is likely to continue to decline, it should be noted
could substitute oil if price and environmental conditions warrant. A larger than projected role for oil is more likely over the next decade but uniikely after 2005
that ~oal-fired POW= plants uc dual-hd and
THERMAL AM) METALLURGICAL COAL PRICES Figure 6 shows the average c.i.f cost of imported thermal and metallurgical coals to Korea fiom 1985 to 1994. In 1994, the average c.i.f prices of both thermal and metallurgical coal were at their lowest point since Korea became a sigdicant coal importer in the early 1980s.
65 1 i
35 5 1985 I 9 9 0 1991 1992 1993 19w
Figure 6. Imported Coal Prices (c.i.E)
Thermal and metalIurgicat coal prices have been declining because of the combination of an increased share of imports from lower cost producers and the general decline in international coal prices. High cost coal imports fiom the United States decked the most from 1985 to 1993, with metalhugid cod imports declining fiom 26 to 13 percent and t h d coal imports declining fiom 7 to 5 pefcent.
ELECTRICITY PRICES Electricity prices in local currency (won) increased at an a v q e annual growth rate of 2.7 percent for lighting and 0.7 percent for others between 1980 and 1993. In U.S. doilan, the lighting tariff i n c r d &om $0.09 pa KWh in 1980 to $0.10 per KWh in 1993. The M t o industrial customers declined tiom $0.075 per KWh in 1980 to $0.067 perm in 1993. The o v d average electricity price d d &om $0.077 per KWh in 1980 to $0.073 per KWh in

1993. If inflation is included, electricity costs decreased between 1980 and 1993 in both local currency and in U.S. dollars. With respect to electricity prices, KEPCO is permitted to recover its operating costs plus a fair return on capital. Rate hikes must be approved by the MOT, then the Price Stabilization Committee, the Economic Planning Board, and the cabinet. This complex rate setthg system introduces
After January 1999, Sa emissions standards will be fbrther tightened to 270 ppm (0.63 lb/MBtu), which is equivalent to approximately 0.4 percent sulfiu coal; particulate emissions will be limited to 50-150 mg/m3 (0.04-0.12 Ib/MBtu). Because internationally traded coal in the Asian region typically contains between 0.5 and 0.8 percent suffir, current SO2 regulations can be met with available low sufir coals.
broader economic and political facton into the However, s u b control equipment will have to rate setting process, and, consequently, can lead be installed by 1999 at the latest to meet the 270 to less timely rate increases. ppm limit on Sa emissions. Figure 7 shows the
SUMM content in cod that will meet the limits of ENVIRONMENTAL POLICIES AND SO, in pounds per MBtu and milligrams of Sa REGULATIONS per cubic meter. As shown in Table 3, until the end of 1994, Korea's standards for coal-fhd power plant L8 a 4
,.6 'I968 0 9 0 9 0 1 0 I 0 9 . 9 - 0
emissions limited SOz to 700 ppm (1.63 19MLyI 0
Ib/MBtu), NO, to 350 ppm (0.59 IWMBtu), and I 0 I I
8" L4 IrnC 1- &
0 l 0" I e 8
I 4 $ ' Ib/MBtu)-equivdent to about 0.7 percent * 8 0.8
1 as L-GG- , 7 3 8 sulfilr coal. During that !Wne period, the emissions of particulates will be limited to 100- I I 0"
4 Q4 0 200 mg/m3 (0.08-0.16 lb/MBtu). .
. .
. particulates to 250 ms/m3 (0.2 lb/MBtu). From
Sa will be limited to 500 ppm (1.16
1.2 ; I I 0 I 0 0 9 9 I O
0 I ' 1m rg
0 - m u
January 1995 to December 1998, emissions of t .1995uIy
I I I B
I I I I
' 8 2
Table 3. Emission Limits for Power Plasts ErnissioaT)p until1m lDS-lu98 A f k 1 m
so, @Pm) Anthracitc(Lmd) 1,200-1,6u) 1,2~1,650 270 Bitumiwus coal 700 500 270
N4@Pm) Allcoal 350 350 350
particulates (Wd > 30,000 m 3 h 250 100 so 6,OO 1-3O.OOO m3/hr 2% 1% < 6,000 m 3 h 300 200 150
source: summanzed . hmtbePrimeMinis&ds Decree 011 the Air Quality Protectiopl Law, 1992.
a2 t 8 0
Figare 7. S u b Contart in Cod vs. Limits of S o Z p e r ~ ~
KEPCO's &fired piants have dectrostatic precipitators that maintain average particulate emissions to no more than 100 to 150 mg/m3. NO, emissions are controlled by using low NO, burners and two stage combustion. At present, Korea has no regutations restricting C G emiSSiOnS.
Table 4 shows the lwcragt sulfur contents of d in Korea in 1991. It is probable that the
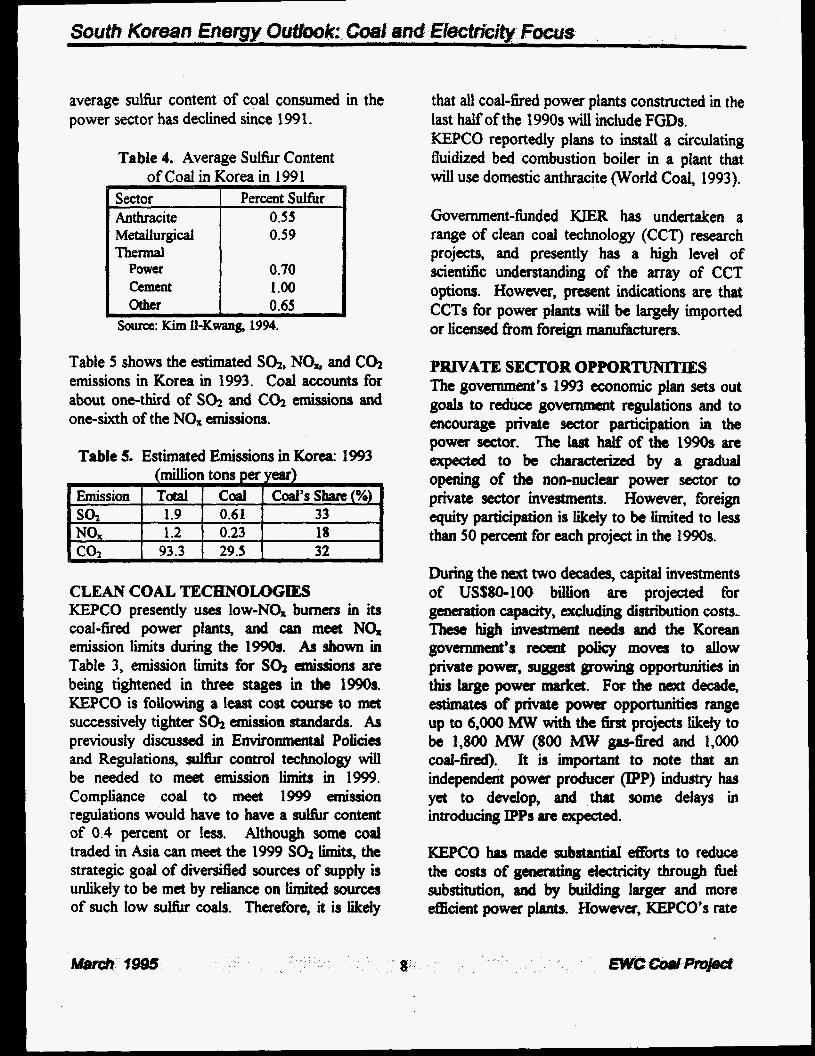
average sufir content of coal consumed in the power sector has declined since 199 1.
Table 4. Average Sulhr Content of Coal in Korea in 2991
SOurc~: Kim I1-K-g 1994.
Table 5 shows the estimated Sa, NO, and C& emissions in Korea in 1993. Coal accounts for about one-third of S a and C& emissions and one-sixth of the N G emissions.
Table 5. Estimated EmissionS in Korea: 1993
NO, 1.2 0.23 I co, I 93.3 I 29.5 I 32 I CLEAN COAL TECHNOLOGIES KEPCO presently uses low-NG burners in its coal-fired power plants, and can meet N G emission limits during the 1990s. As shown in Table 3, emission limits for S a anissionS are being tightened in three stages in the 1990s. KEPCO is fouowing a least cost course to met successively tighter S a emission standards. As previously discwsed in Environmental Policies and Regulations, sulfirr control technology will be needed to meet emission limits in 1999. Compliance coal to meet 1999 emission regulations would have to have a & content of 0.4 percent or less. Although some coal traded in Asia can meez the 1999 S o l limits, the strategic goal of divenGed sources of supply is unlikely to be met by reliance on limited sources of such low sulfur coals. Therefore, it is likely
that all coal-fued power plants constructed in the last half of the 1990s will include FGDs. KEPCO reportedly plans to install a circulating fluidized bed combustion boiler in a plant that will use domestic anthracite (World Coal, 1993).
Governrnent-fbnded KIER has undertaken a range of clean coal technology (CCT) research projects, and presently has a high level of scientific understanding of the array of CCT options. However, present indications are that CCTs for power plants will be largely imported or licensed Erom foreign manufacturers.
PRIVATE SECTOR OPPORTUNITIES The government’s 1993 economic plan sets out goals to reduce governmetlt regulations and to encourage private sector participation in the powa sector. The last half of the 1990s are srpected to be characterized by a gradual opening of the non-nuclear power Sector to private Sector invments. However, foreign equity participation is likely to be limited to less than 50 percent for each project in the 1990s.
During the next two decades, capital investments of USS80-100 biilion are projected for generation capacity, excluding distribution costs- These high i n v m nee& and the Korean government’s recent policy moves to allow private powa, suggest growing opportunities in this large power market. For the next decade, estimates of private power opportunities range up to 6,000 MW with the 6rst projects likely to be 1,800 MW (800 MW gas-fired and 1,OOO cod-fired). It is important to note that an i n d m power producer (IPP) industry has yet to develop, and that some delays in introducing IPPS are expected.
KEPCO has d e substantial &orb to reduce
substitution, and by budding larger and more &cient power plants. However, KEPCO’s rate
the costs of gcneratm g electlicity through fuel

t
of return on investment has decreased from 12 to 8 percent-well below levels attractive to private foreign investors. Independent power plants will probably need to operate at high capacity factors to achieve acceptable returns on investments. The high percentage of nuclear and coal-fired capacity in the Korean grid may make it more difEcuIt for IPPs to achieve the high capacity factors that they will want. This combined with uncertainty about timely rate increases is expected to moderate the development of a flourishing P P sector in the near future.
Sources of Information and References Asia I994 Yearbook, 1994. Far Eastern
Economic Review, ed. Robert Delfk, Review Publishing Company, Ltd., Hong Kong.
Asian Dewlopent OutloOA 1994, Asian Development Bank. Word UniverSity Press, Hong Kong.
BP Sfafstical Review of World Energy, 1994. The British Petroleum Company, England, June.
Cwl in Asia-Pacific, 1994. Tables 2-1 - 2-7. NED0 (New Energy and Industrial Technology Development O r ~ o u ) ,
Electric UtiIities Data Book jbp the Asia and Pa@ Regim 1993, 1993. Asian Development Bank, Manila, January.
~ ~ p e ~ n t Power &port, 1994. ai. Kathy
Tokyo, Jan~ary, VO~. 5, IW. 3, pp. 55-57.
Ci~olin Larsen, M-w-HilI, N ~ w York, Decanber 2.
KEEI, 1995. 1995 Korea Enrrgy ~ t l b o k , Korea Energy Economics Insthe, Korea, January.
W C O A d R e w , 1994. Korea Electric Power Corporation.
Khartukov, Eugene, 1994, "It& Far East Emerging as Significant Gas Supplier," Pipeline & Gas J d , Dahs, August.
Kim n-KWmg 1994, "Cod Demand Outlook and Concerned Policy in Korea," Presented at APEC Coal Flow Seminar, Tokyo, October 4-6.
King's lntemutional Coal Tract, 1992. King Publishing Corporation, Knoxville, Tennessee.
Korea Energy Review Month&, 1993. Coal Statistics, Tables III-1 - m-5, Korea Energy Economics Institute, Korea, February, pp. 64-68.
Korea Energy Review Monthly, June, pp. 62-66 Korea Energy Review Month&, OctMov, pp.
65-68. Korea Eraergy Review Mmthly, 1994. March,
pp. 59-62. Korea Overseas Idonnation SesviCe, 1990. A
H d of Korea, S d w a Printing Co., Ltd., Seoui, 574 pp.
Lee Hoesung, 1993. "South Kona: Tasks for Environmentally Sound and Sustainable Development," Korea Energy Review Monthly, Korea Energy Economics Institute, Korea, November.
Lee Won-Woo, 1994, "Coal Demand Outlook and its Policy Implication," Coal in Asia
No. 4. --Term Power Supply and Demand Plan:
1991-2006, 1991. Minisby of Energy and Resources (of Korea) November.
M q w Statistics of Korean fiommy, August, 1994. National Statistical office, Korea
Paik Keun-Wook, 1992, ''Towards a Northeast Asia Energy Charta," Energy Policy, oxford, United Kingdom, May.
fucific, NEDO, Tokyo, March, voi. 5
Puwer in A d 4 1995. ed. Frank Gray, FinanCiaI T m Enagy Publishin& London,
prime Mini9ter's Decree 011 the Air Quality
m e " united Kingdom,
February 20.
Protection Law, 1992, Korea, August. Worki Cad, 1993, "Moving Towards the
S e p t d , pp. 22-24.
9

East-West Center The U.S. Congress established the East-West Center in 1960 as a private academic research institution The Center’s goal is to foster mutual understanding and cooperation among governments and peoples oi the Asia-Pacific region, including the United States. Principal fhding for the Center comes from tht U. S. government, with additional support provided by private agencies, individuals and corporations, anc more than 20 Asian and Pacific governments.
The Center promotes responsible development and tong-term stability for all economies of the region and helps prepare the United States for constructive involvement in Asia and the Pacif~c.
PREM The Program on Resources: Energy and Mherals (PREM) conducts research in the two broad program areas of energy and minerals. Research focwes on energy resources (oil, coal, and gas) and non-fuel minerals in the Asia-Pacific region and the Western Hemisphere.
Coal Project The Coal Project examines policies and economics of coal supply and consumption in Asian economies. Emphasis is on the power sector and the impacts of evohring government energy and environmental policies on fbture coal use. The project prepares tong-term projections of coal production, consumption, and trade; coal-fired power plant capacity; and the rate of introduction of clean coal technologies in the Asia-Pacific region. The Coal Project advises the U.S. Department of Energy’s Of5ce of Fossil Energy, and is actively involved with the Asia Pacific Economic Cooperation Experts’ Group on Clean Coal Technology. I
10