Embed Size (px)
Citation preview

ICAO APANPIRG, 3rd ISFT
Korean CAT-I GBAS Ionospheric Threat Model
Jiyun Lee
KAIST
Republic of Korea
3rd Ionospheric Studies Task Force Seoul, Republic of Korea
ICAO APANPIRG 16 October 2013

ICAO APANPIRG, 3rd ISFT
Ionospheric Threat Model Development for GBAS Category I Operation in the Korean
Region
• In order to mitigate ionosphere threats occurring in different geographical regions, ionospheric threat models have to be established for the relevant regions.
• To allow the certification of a GBAS ground facility in South Korea, a Korean ionospheric threat model has be determined
2
ICAO APANPIRG, 3rd ISFT
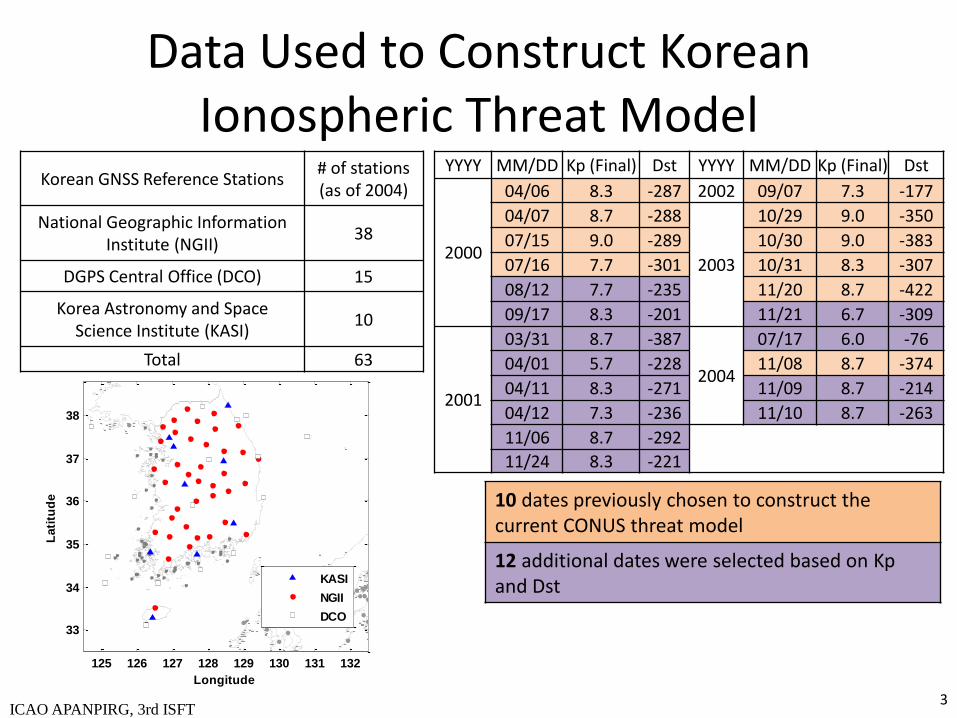
Data Used to Construct Korean Ionospheric Threat Model
3
YYYY MM/DD Kp (Final) Dst YYYY MM/DD Kp (Final) Dst
2000
04/06 8.3 -287 2002 09/07 7.3 -177
04/07 8.7 -288
2003
10/29 9.0 -350
07/15 9.0 -289 10/30 9.0 -383
07/16 7.7 -301 10/31 8.3 -307
08/12 7.7 -235 11/20 8.7 -422
09/17 8.3 -201 11/21 6.7 -309
2001
03/31 8.7 -387
2004
07/17 6.0 -76
04/01 5.7 -228 11/08 8.7 -374
04/11 8.3 -271 11/09 8.7 -214
04/12 7.3 -236 11/10 8.7 -263
11/06 8.7 -292
11/24 8.3 -221
Korean GNSS Reference Stations # of stations (as of 2004)
National Geographic Information Institute (NGII)
38
DGPS Central Office (DCO) 15
Korea Astronomy and Space Science Institute (KASI)
10
Total 63
125 126 127 128 129 130 131 132
33
34
35
36
37
38
Longitude
Lati
tud
e
KASI
NGII
DCO
10 dates previously chosen to construct the current CONUS threat model
12 additional dates were selected based on Kp and Dst
ICAO APANPIRG, 3rd ISFT
Korean CAT-I GBAS Ionospheric Threat Model
4
0 10 20 30 40 50 60 70 80 900
50
100
150
200
250
300
350
400
450
Elevation [deg]
Slo
pe
[m
m/k
m]
Flat 375
mm/km
Linear bound [mm/km]
y=375+50(el-15)/50
Flat 425 mm/km
UT DD/MM/YY
03/31/01
04/01/01
11/06/01
11/24/01
09/07/02
10/29/03
10/31/03
11/20/03
11/10/04160mm/km
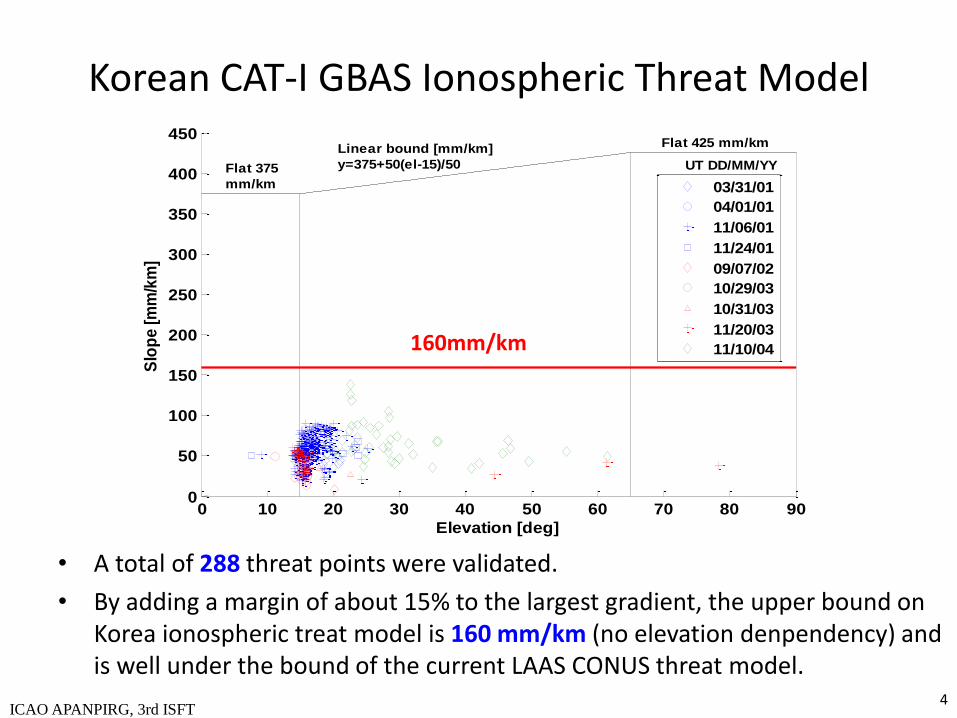
• A total of 288 threat points were validated.
• By adding a margin of about 15% to the largest gradient, the upper bound on Korea ionospheric treat model is 160 mm/km (no elevation denpendency) and is well under the bound of the current LAAS CONUS threat model.

ICAO APANPIRG, 3rd ISFT
Case Study 1: The Most Extreme Ionospheric Gradient on Nov. 10, 2004
5
Pair PRN Time
(HH:MM:SS) Slope
(mm/km) Elev. (deg.)
Dist. (km)
YOSU-HADG
31 14:18:00 138.5 22.6 44.95
12 12.5 13 13.5 14 14.50
5
10
Sla
nt
Dela
y (
m)
YOSU
HADG
12 12.5 13 13.5 14 14.5-100
0
100
Ion
o S
lop
e (
mm
/km
)
12 12.5 13 13.5 14 14.50
20
40
60
80
Ele
vati
on
(d
eg
)
b)
a)
c)
Dual-frequency, YOSU - HADG PRN31
Time (hour of 11/06/2004)
12 12.5 13 13.5 14 14.5-100
-50
0
50
100
150
Time (hour of 11/06/2004)
Ion
o G
rad
ien
t (m
m/k
m)
YOSU and HADG, Gradients Comparison; PRN31
DF (L1/L2) Gradient
L1-only Gradient

ICAO APANPIRG, 3rd ISFT
Station-Wide Validation and Localized Disturbances on Nov. 10, 2004
6
13 13.5 14 14.50
5
10
15
Sla
nt
Dela
y (
m)
YOSU
HADG
JINJ
SORI
13 13.5 14 14.5-100
-50
0
50
100
150
Ion
o G
rad
ien
t (m
m/k
m)
YOSU-HADG
YOSU-JINJ
SORI-JINJ
SORI-YOSU
Time (hour of 11/10/2004)
• The ionospheric event observed in South Korea on November 10, 2004 was caused by localized disturbances, rather than the enhanced TEC around the geomagnetic equator.
<IPP tracks and regional vertical ionospheric delay map>

ICAO APANPIRG, 3rd ISFT
Case Study 2: The Second Largest Ionospheric Gradient on Nov. 6, 2001
7
0 1 2 3 40
20
40
60
80
Sla
nt
Dela
y (
m)
Dual-frequency. NAMW/ SONC PRN 21
NAMW
SONC
0 1 2 3 4-50
0
50
100
Ion
o S
lop
e (
mm
/km
)
Time (hour of 11/06/2001)3 3.5 4 4.5
-50
0
50
100
Time (hour of 11/06/2001)
Ion
o G
rad
ien
t (m
m/k
m)
DF (L1/L2) Gradient
L1-only Gradient
NAWM and SONC, Gradients Comparison ; PRN21
Pair PRN Time
(HH:MM:SS) Slope
(mm/km) Elev. (deg.)
Dist. (km)
NAWM-SONC
21 04:15:00 91 mm/km 20.1 52.3

ICAO APANPIRG, 3rd ISFT
Station-Wide Validation and Enhanced TEC in Korea on Nov. 6, 2001
8
3 3.5 4 4.5
20
30
40
50
60
70
80
90
Sla
nt
Dela
y (
m)
NAMW
SONC
GOCH
JINJ
YECH
KUNW
TEGN
3 3.5 4 4.5-50
0
50
100
Time (hour of 11/06/2001)
Ion
o G
rad
ien
t (m
m/k
m)
NAMW-SONC
GOCH-JINJ
YECH-KUNW
KUNW-TEGN
b)
a) Longitude
Lati
tud
e
-150 -100 -50 0 50 100 150
-80
-60
-40
-20
0
20
40
60
80
Vert
ical Io
no
sp
heri
c D
ela
y (
m)
0
5
10
15
Longitude
Lati
tud
e
-150 -100 -50 0 50 100 150
-80
-60
-40
-20
0
20
40
60
80
Vert
ical Io
no
sp
heri
c D
ela
y (
m)
0
5
10
15
20Global Ionosphere Map on Nov. 6, 2001 04:00 UT

ICAO APANPIRG, 3rd ISFT
Thank you for your attention
9