Embed Size (px)
Citation preview
THIS REPORT CONTAINS ASSESSMENTS OF COMMODITY AND TRADE ISSUES MADE BY
USDA STAFF AND NOT NECESSARILY STATEMENTS OF OFFICIAL U.S. GOVERNMENT
POLICY
Date:
GAIN Report Number:
Approved By:
Prepared By:
Report Highlights: Since the FMD outbreak in 2010, local raw milk production has rebounded, but has outpaced slower growing demand. As a
result, higher ending stock levels in 2014 carried over into 2015. Overall local raw milk products recorded 2 percent
negative volume, but per capita volume consumption continued to increase in 2015. Drinking milk products recorded
negative volume and value growth in 2015 as per capita volume consumption continued to decrease. Consumers who
continue to drink milk will shift to reduced fat milk from full fat fresh milk. The share of reduced fat fresh milk is projected
to be 19% in 2020, up from 16% in 2015. Flavored milk drinks contain sugar, so it is unlikely to post strong growth given
health and wellness trends. All cheese categories recorded positive value growth in 2015. The introduction of different types
of processed cheese led to growth. Cheddar sliced processed cheese dominated processed cheese but the range expanded to
include Mozzarella, Gorgonzola, Gouda and Camembert sliced processed cheeses. The potential uses on product
packaging promoted use of cheese on hamburgers, sandwiches, instant noodles and Gimbap. A new type called snack
cheese or portion cheese also helped processed cheese to continue positive value growth. Local NFDM production
Youngsook OH, Ag. Marketing Specialist
Lynne Larrabee, ATO Director
Dairy and Products Annual Update
Dairy and Products Annual
Korea - Republic of
KS1636
10/17/2016
Required Report - public distribution

decreased 20 percent in 2015 from the previous year while consumption remained relatively flat. However, year end
inventory remained high mostly due to less expensive imports.
Executive Summary: Korean raw fluid milk production posted 2 percent negative volume, however, per capita volume consumption for dairy
products overall continued to increase in 2015. Drinking milk products recorded negative volume and value growth in 2015
as per capita volume consumption continued to decrease. In South Korea, raw milk production rebounded since 2011 after
recovering from foot-and-mouth disease (FMD) outbreak in 2010, but consumer consumption was lower. Consumers who
continue to drink milk will shift to reduced fat milk from full fat fresh milk. The share of reduced fat fresh milk is projected
to be 19% in 2020, up from 16% in 2015.
Domestic cheese manufacturers distribute imported cheese brands, but with the exception of Philadelphia spreadable
processed cheese, value share of global brands remained small. Korean consumers are not yet familiar with natural
unprocessed cheese, but the number of imported brands in unprocessed cheese continues to increase. All cheese categories
recorded positive value growth in 2015. The introduction of different types of processed cheese led to growth. Cheddar
sliced processed cheese dominated processed cheese but the range increased to include Mozzarella, Gorgonzola, Gouda and
Camembert sliced processed cheeses.
Over production of fresh milk and less expensive NFDM imports have resulted in higher inventories in 2015. In 2015, local
NFDM production amounted to 17,000 MT; a 20% decrease from the previous year. Yoghurt is expected to be stagnant with
1% at constant 2016 prices. Drinking yoghurt and plain yoghurt products are expected to increase, but fruited yoghurt is
predicted to decrease 2% at constant 2016 prices. Flavored yoghurt, which was mainly targeted at children, showed positive
value and volume growth in 2015 thanks to active marketing campaigns using famous animated characters. Fruited yoghurt
contains sugar or fruit concentrate, so consumers shifted to plain yoghurt in order to consume more natural food. Ice cream
manufacturers are set to introduce premium single portion ice cream desserts, such as ice cream waffles or macaroon ice
cream. Manufacturers are predicted to develop ice cream by targeting adult consumers rather than children. Coffee-flavored
ice cream and real cheese cake with ice cream are likely to remain popular with adults.
Commodities:
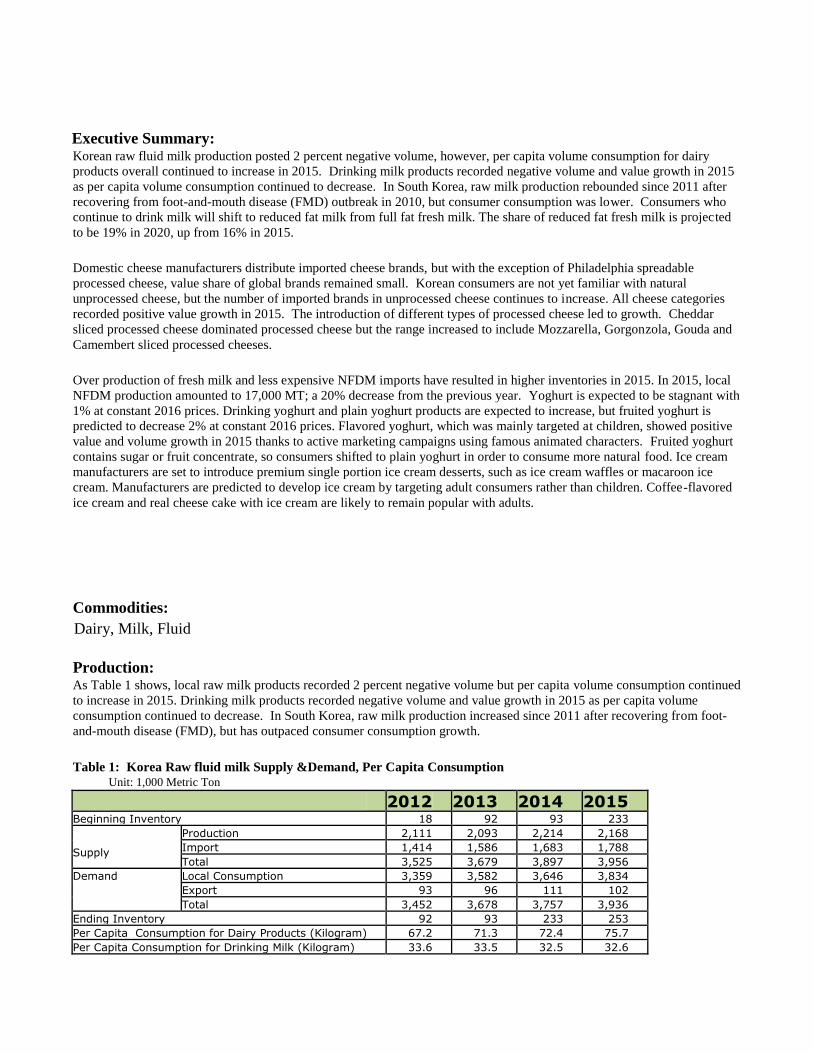
Production: As Table 1 shows, local raw milk products recorded 2 percent negative volume but per capita volume consumption continued
to increase in 2015. Drinking milk products recorded negative volume and value growth in 2015 as per capita volume
consumption continued to decrease. In South Korea, raw milk production increased since 2011 after recovering from foot-
and-mouth disease (FMD), but has outpaced consumer consumption growth.
Table 1: Korea Raw fluid milk Supply &Demand, Per Capita Consumption
Unit: 1,000 Metric Ton
2012 2013 2014 2015 Beginning Inventory 18 92 93 233
Supply
Production 2,111 2,093 2,214 2,168 Import 1,414 1,586 1,683 1,788 Total 3,525 3,679 3,897 3,956
Demand Local Consumption 3,359 3,582 3,646 3,834 Export 93 96 111 102 Total 3,452 3,678 3,757 3,936
Ending Inventory 92 93 233 253 Per Capita Consumption for Dairy Products (Kilogram) 67.2 71.3 72.4 75.7 Per Capita Consumption for Drinking Milk (Kilogram) 33.6 33.5 32.5 32.6
Dairy, Milk, Fluid
Source: Ministry of Agriculture, Food and Rural Affairs (MAFRA/ 2015 Dairy Statistics Yearbook by Korea Dairy Committee (KDC)
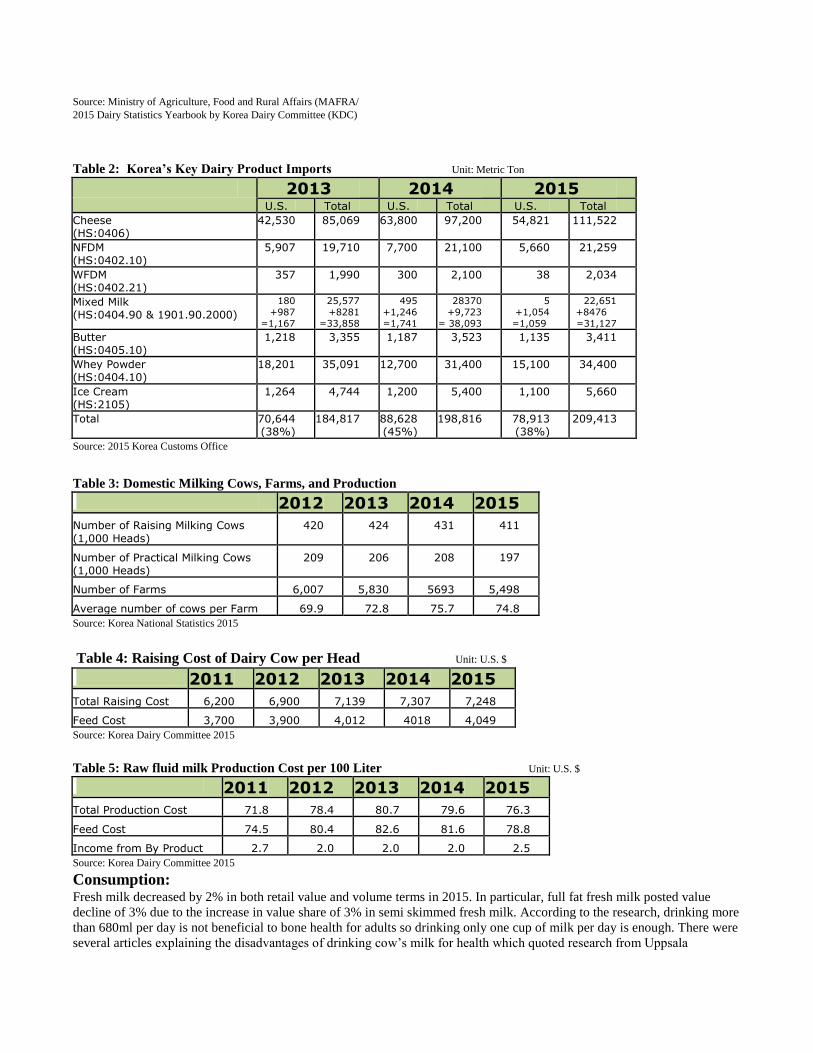
Table 2: Korea’s Key Dairy Product Imports Unit: Metric Ton
2013 2014 2015 U.S. Total U.S. Total U.S. Total
Cheese (HS:0406)
42,530 85,069 63,800 97,200 54,821 111,522
NFDM (HS:0402.10)
5,907 19,710 7,700 21,100 5,660 21,259
WFDM (HS:0402.21)
357 1,990 300 2,100 38 2,034
Mixed Milk (HS:0404.90 & 1901.90.2000)
180 +987
=1,167
25,577 +8281
=33,858
495 +1,246 =1,741
28370 +9,723
= 38,093
5 +1,054 =1,059
22,651 +8476
=31,127 Butter (HS:0405.10)
1,218 3,355 1,187 3,523 1,135 3,411
Whey Powder (HS:0404.10)
18,201 35,091 12,700 31,400 15,100 34,400
Ice Cream (HS:2105)
1,264 4,744 1,200 5,400 1,100 5,660
Total 70,644 (38%)
184,817 88,628 (45%)
198,816 78,913 (38%)
209,413
Source: 2015 Korea Customs Office
Table 3: Domestic Milking Cows, Farms, and Production
2012 2013 2014 2015
Number of Raising Milking Cows (1,000 Heads)
420 424 431 411
Number of Practical Milking Cows (1,000 Heads)
209 206 208 197
Number of Farms 6,007 5,830 5693 5,498 Average number of cows per Farm 69.9 72.8 75.7 74.8 Source: Korea National Statistics 2015 Table 4: Raising Cost of Dairy Cow per Head Unit: U.S. $
2011 2012 2013 2014 2015
Total Raising Cost 6,200 6,900 7,139 7,307 7,248 Feed Cost 3,700 3,900 4,012 4018 4,049 Source: Korea Dairy Committee 2015 Table 5: Raw fluid milk Production Cost per 100 Liter Unit: U.S. $
2011 2012 2013 2014 2015
Total Production Cost 71.8 78.4 80.7 79.6 76.3 Feed Cost 74.5 80.4 82.6 81.6 78.8 Income from By Product 2.7 2.0 2.0 2.0 2.5 Source: Korea Dairy Committee 2015
Consumption: Fresh milk decreased by 2% in both retail value and volume terms in 2015. In particular, full fat fresh milk posted value
decline of 3% due to the increase in value share of 3% in semi skimmed fresh milk. According to the research, drinking more
than 680ml per day is not beneficial to bone health for adults so drinking only one cup of milk per day is enough. There were
several articles explaining the disadvantages of drinking cow’s milk for health which quoted research from Uppsala
University in Sweden. The articles also recommend reduced fat milk for adults to help prevent a number of adult health
problems. The volume sales of fresh milk therefore decreased since 2011, but reduced fat milk has been recorded to continue
increase despite overall slowdown in milk since 2012.
Manufacturers focused on launching premium positioned milk products to attract consumers such as fat free milk (FFM) but
the marketing strategy did not result in positive volume or value growth. Due to frequent promotional sales through major
distribution channels to boost drinking milk because of oversupply in volume, current unit price of flavored milk drinks and
cow’s milk both declined, although there was more premiumisation in drinking milk products. Organic milk and fat free milk
(FFM) also declined in both volume and value terms during 2015 which are normally distributed so they can be targeted at
children, but they were affected by the overall weak performance of children’s food market. Flavored milk drinks declined
by 3% in both value and volume in 2015. Dairy only flavored milk drinks declined more rapidly than flavored milk drinks
with fruit juice, with banana flavor continuing to lead. Among dairy only flavored milk drinks, chocolate flavor had the
largest share followed by coffee flavor. Meanwhile, banana flavor’s value sales continued to have the largest share of 30%.
Soy milk declined by 3% in value terms in 2015. To boost the stagnant market, players introduced different flavored soy
milk drinks such as green tea soy latte, soy milk with real fruit juice and coffee flavored soy milk to attract drinkers of RTD
products, targeted at the younger consumer group.
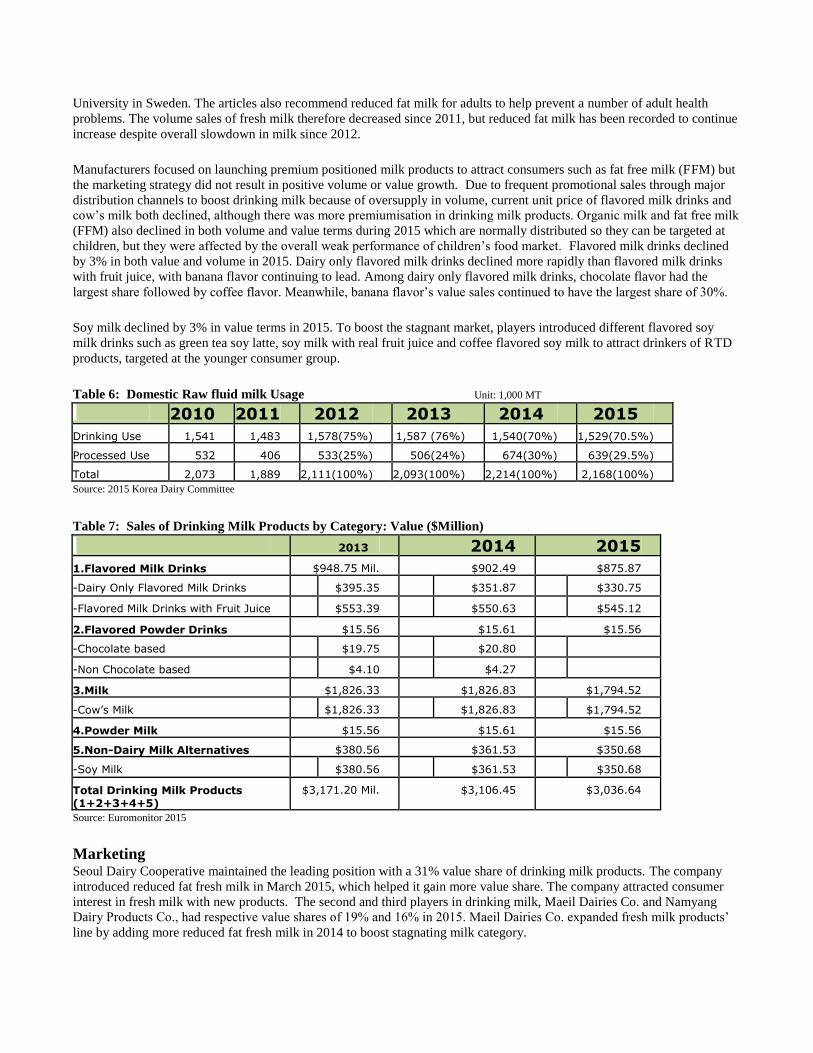
Table 6: Domestic Raw fluid milk Usage Unit: 1,000 MT
2010 2011 2012 2013 2014 2015
Drinking Use 1,541 1,483 1,578(75%) 1,587 (76%) 1,540(70%) 1,529(70.5%) Processed Use 532 406 533(25%) 506(24%) 674(30%) 639(29.5%) Total 2,073 1,889 2,111(100%) 2,093(100%) 2,214(100%) 2,168(100%) Source: 2015 Korea Dairy Committee
Table 7: Sales of Drinking Milk Products by Category: Value ($Million)
2013 2014 2015
1.Flavored Milk Drinks $948.75 Mil. $902.49 $875.87
-Dairy Only Flavored Milk Drinks $395.35 $351.87 $330.75
-Flavored Milk Drinks with Fruit Juice $553.39 $550.63 $545.12
2.Flavored Powder Drinks $15.56 $15.61 $15.56 -Chocolate based $19.75 $20.80
-Non Chocolate based $4.10 $4.27
3.Milk $1,826.33 $1,826.83 $1,794.52
-Cow’s Milk $1,826.33 $1,826.83 $1,794.52
4.Powder Milk $15.56 $15.61 $15.56
5.Non-Dairy Milk Alternatives $380.56 $361.53 $350.68
-Soy Milk $380.56 $361.53 $350.68
Total Drinking Milk Products (1+2+3+4+5)
$3,171.20 Mil. $3,106.45 $3,036.64
Source: Euromonitor 2015
Marketing Seoul Dairy Cooperative maintained the leading position with a 31% value share of drinking milk products. The company
introduced reduced fat fresh milk in March 2015, which helped it gain more value share. The company attracted consumer
interest in fresh milk with new products. The second and third players in drinking milk, Maeil Dairies Co. and Namyang
Dairy Products Co., had respective value shares of 19% and 16% in 2015. Maeil Dairies Co. expanded fresh milk products’
line by adding more reduced fat fresh milk in 2014 to boost stagnating milk category.
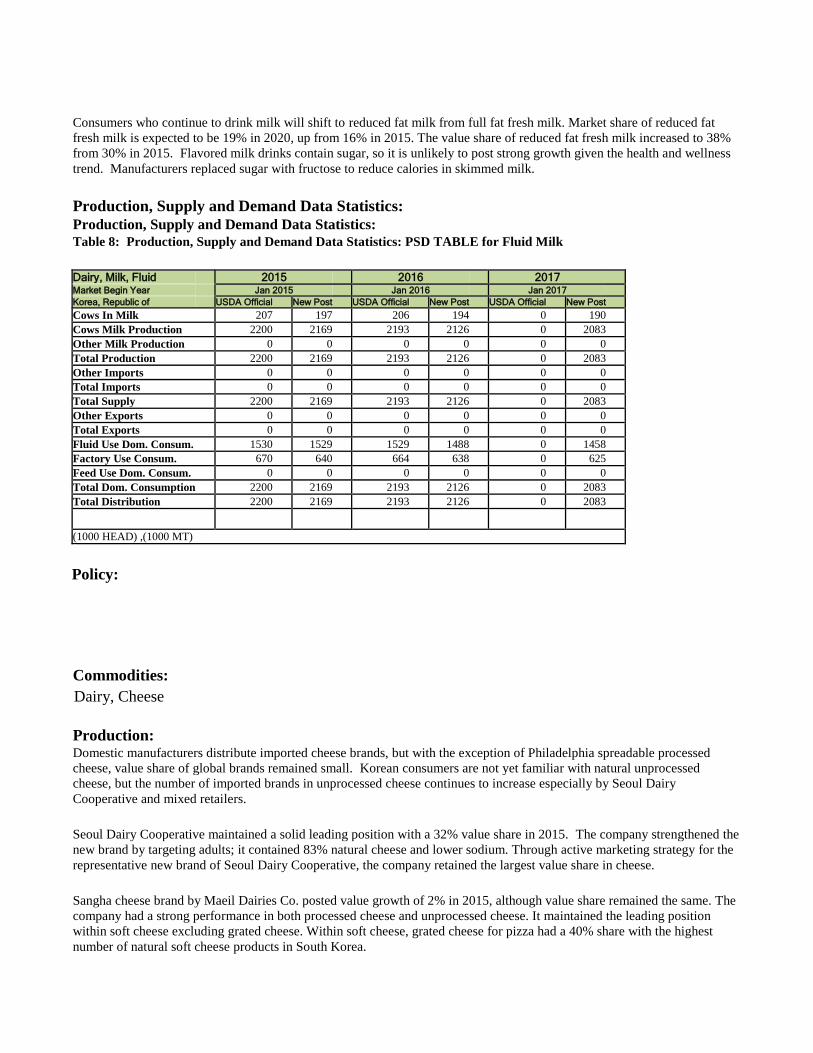
Consumers who continue to drink milk will shift to reduced fat milk from full fat fresh milk. Market share of reduced fat
fresh milk is expected to be 19% in 2020, up from 16% in 2015. The value share of reduced fat fresh milk increased to 38%
from 30% in 2015. Flavored milk drinks contain sugar, so it is unlikely to post strong growth given the health and wellness
trend. Manufacturers replaced sugar with fructose to reduce calories in skimmed milk.
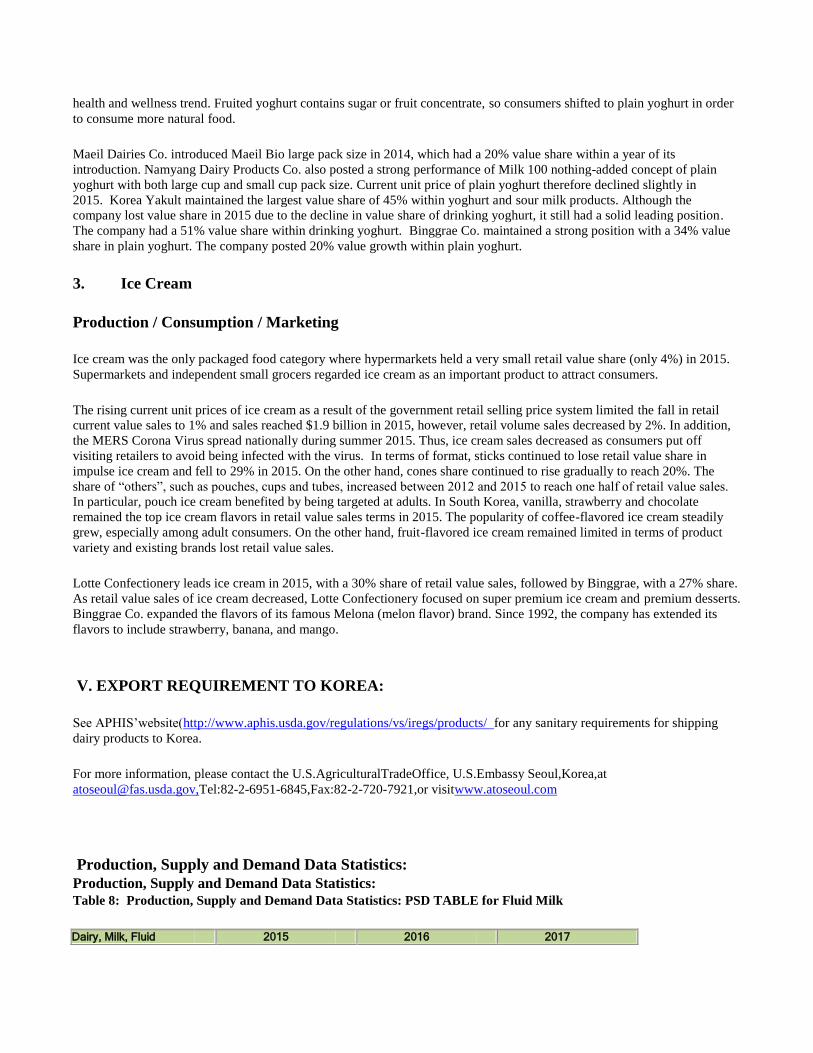
Production, Supply and Demand Data Statistics: Production, Supply and Demand Data Statistics: Table 8: Production, Supply and Demand Data Statistics: PSD TABLE for Fluid Milk
Dairy, Milk, Fluid 2015 2016 2017 Market Begin Year Jan 2015 Jan 2016 Jan 2017 Korea, Republic of USDA Official New Post USDA Official New Post USDA Official New Post Cows In Milk 207 197 206 194 0 190 Cows Milk Production 2200 2169 2193 2126 0 2083 Other Milk Production 0 0 0 0 0 0 Total Production 2200 2169 2193 2126 0 2083 Other Imports 0 0 0 0 0 0 Total Imports 0 0 0 0 0 0 Total Supply 2200 2169 2193 2126 0 2083 Other Exports 0 0 0 0 0 0 Total Exports 0 0 0 0 0 0 Fluid Use Dom. Consum. 1530 1529 1529 1488 0 1458 Factory Use Consum. 670 640 664 638 0 625 Feed Use Dom. Consum. 0 0 0 0 0 0 Total Dom. Consumption 2200 2169 2193 2126 0 2083 Total Distribution 2200 2169 2193 2126 0 2083
(1000 HEAD) ,(1000 MT)
Policy:
Commodities:
Production: Domestic manufacturers distribute imported cheese brands, but with the exception of Philadelphia spreadable processed
cheese, value share of global brands remained small. Korean consumers are not yet familiar with natural unprocessed
cheese, but the number of imported brands in unprocessed cheese continues to increase especially by Seoul Dairy
Cooperative and mixed retailers.
Seoul Dairy Cooperative maintained a solid leading position with a 32% value share in 2015. The company strengthened the
new brand by targeting adults; it contained 83% natural cheese and lower sodium. Through active marketing strategy for the
representative new brand of Seoul Dairy Cooperative, the company retained the largest value share in cheese.
Sangha cheese brand by Maeil Dairies Co. posted value growth of 2% in 2015, although value share remained the same. The
company had a strong performance in both processed cheese and unprocessed cheese. It maintained the leading position
within soft cheese excluding grated cheese. Within soft cheese, grated cheese for pizza had a 40% share with the highest
number of natural soft cheese products in South Korea.
Dairy, Cheese
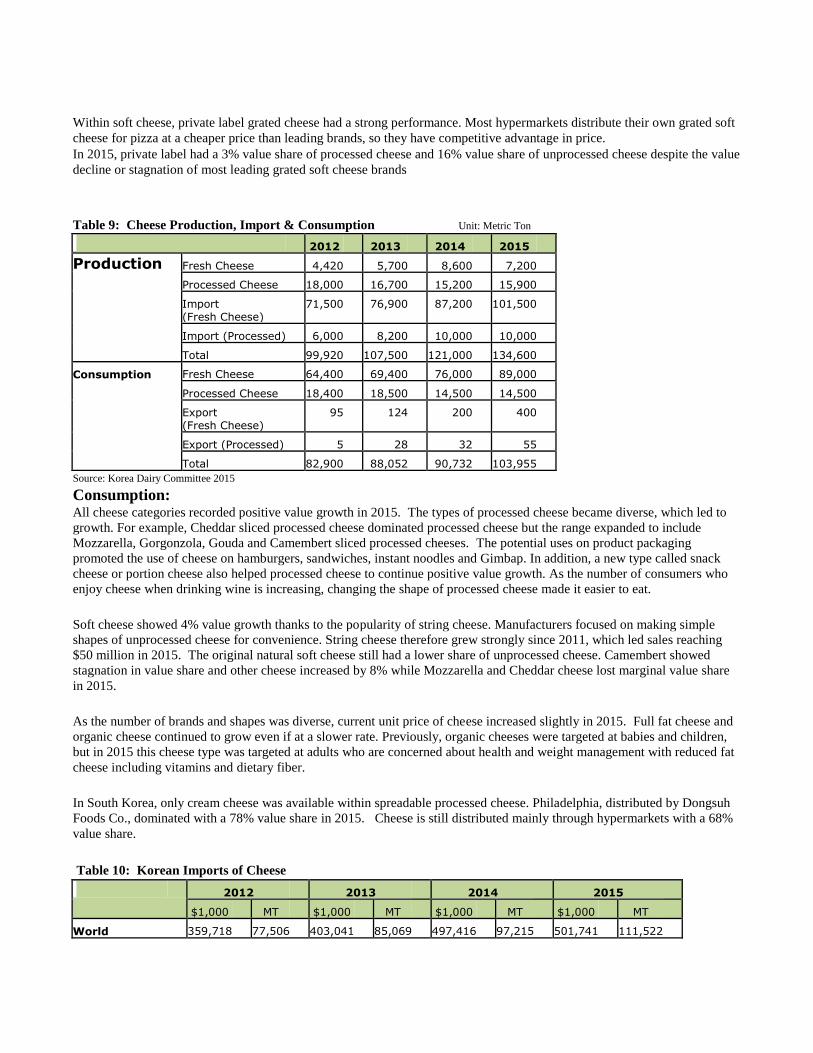
Within soft cheese, private label grated cheese had a strong performance. Most hypermarkets distribute their own grated soft
cheese for pizza at a cheaper price than leading brands, so they have competitive advantage in price. In 2015, private label had a 3% value share of processed cheese and 16% value share of unprocessed cheese despite the value
decline or stagnation of most leading grated soft cheese brands
Table 9: Cheese Production, Import & Consumption Unit: Metric Ton
2012 2013 2014 2015 Production Fresh Cheese 4,420 5,700 8,600 7,200
Processed Cheese 18,000 16,700 15,200 15,900 Import (Fresh Cheese)
71,500 76,900 87,200 101,500
Import (Processed) 6,000 8,200 10,000 10,000 Total 99,920 107,500 121,000 134,600
Consumption Fresh Cheese 64,400 69,400 76,000 89,000 Processed Cheese 18,400 18,500 14,500 14,500 Export (Fresh Cheese)
95 124 200 400
Export (Processed) 5 28 32 55 Total 82,900 88,052 90,732 103,955
Source: Korea Dairy Committee 2015
Consumption: All cheese categories recorded positive value growth in 2015. The types of processed cheese became diverse, which led to
growth. For example, Cheddar sliced processed cheese dominated processed cheese but the range expanded to include
Mozzarella, Gorgonzola, Gouda and Camembert sliced processed cheeses. The potential uses on product packaging
promoted the use of cheese on hamburgers, sandwiches, instant noodles and Gimbap. In addition, a new type called snack
cheese or portion cheese also helped processed cheese to continue positive value growth. As the number of consumers who
enjoy cheese when drinking wine is increasing, changing the shape of processed cheese made it easier to eat.
Soft cheese showed 4% value growth thanks to the popularity of string cheese. Manufacturers focused on making simple
shapes of unprocessed cheese for convenience. String cheese therefore grew strongly since 2011, which led sales reaching
$50 million in 2015. The original natural soft cheese still had a lower share of unprocessed cheese. Camembert showed
stagnation in value share and other cheese increased by 8% while Mozzarella and Cheddar cheese lost marginal value share
in 2015.
As the number of brands and shapes was diverse, current unit price of cheese increased slightly in 2015. Full fat cheese and
organic cheese continued to grow even if at a slower rate. Previously, organic cheeses were targeted at babies and children,
but in 2015 this cheese type was targeted at adults who are concerned about health and weight management with reduced fat
cheese including vitamins and dietary fiber.
In South Korea, only cream cheese was available within spreadable processed cheese. Philadelphia, distributed by Dongsuh
Foods Co., dominated with a 78% value share in 2015. Cheese is still distributed mainly through hypermarkets with a 68%
value share.
Table 10: Korean Imports of Cheese
2012 2013 2014 2015 $1,000 MT $1,000 MT $1,000 MT $1,000 MT
World 359,718 77,506 403,041 85,069 497,416 97,215 501,741 111,522
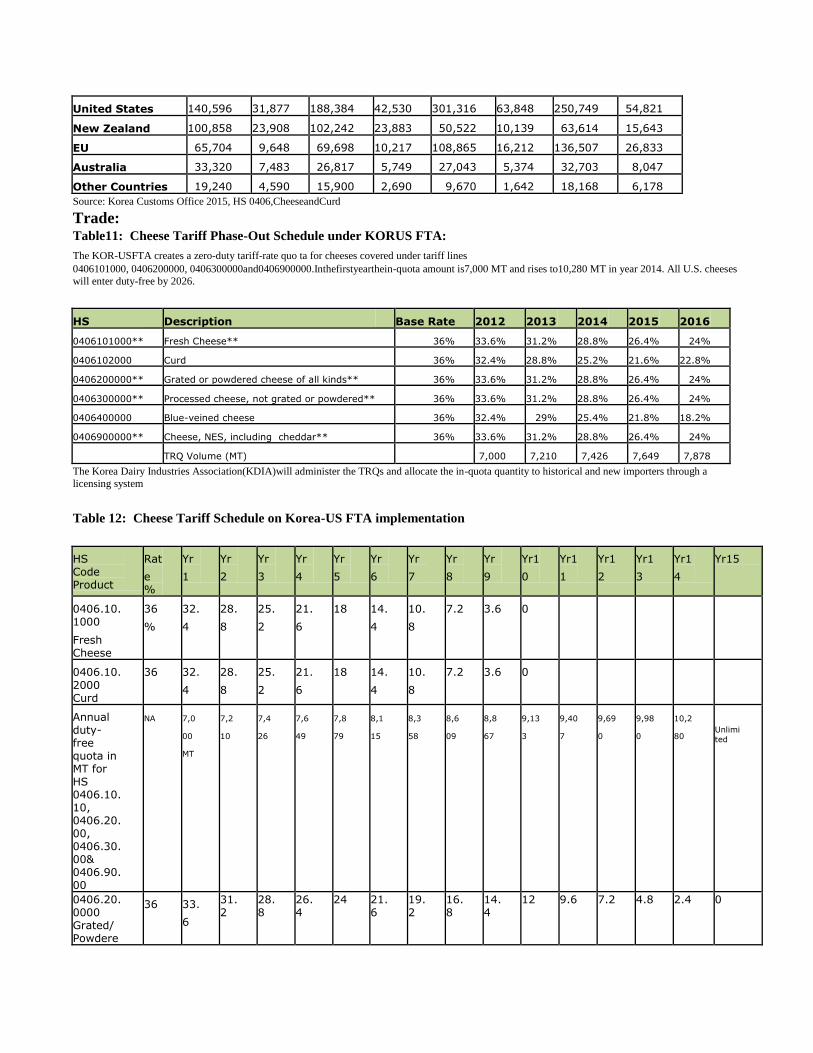
United States 140,596 31,877 188,384 42,530 301,316 63,848 250,749 54,821
New Zealand 100,858 23,908 102,242 23,883 50,522 10,139 63,614 15,643
EU 65,704 9,648 69,698 10,217 108,865 16,212 136,507 26,833
Australia 33,320 7,483 26,817 5,749 27,043 5,374 32,703 8,047
Other Countries 19,240 4,590 15,900 2,690 9,670 1,642 18,168 6,178 Source: Korea Customs Office 2015, HS 0406,CheeseandCurd
Trade: Table11: Cheese Tariff Phase-Out Schedule under KORUS FTA:
The KOR-USFTA creates a zero-duty tariff-rate quo ta for cheeses covered under tariff lines 0406101000, 0406200000, 0406300000and0406900000.Inthefirstyearthein-quota amount is7,000 MT and rises to10,280 MT in year 2014. All U.S. cheeses
will enter duty-free by 2026.
HS Description Base Rate 2012 2013 2014 2015 2016 0406101000** Fresh Cheese** 36% 33.6% 31.2% 28.8% 26.4% 24% 0406102000 Curd 36% 32.4% 28.8% 25.2% 21.6% 22.8% 0406200000** Grated or powdered cheese of all kinds** 36% 33.6% 31.2% 28.8% 26.4% 24% 0406300000** Processed cheese, not grated or powdered** 36% 33.6% 31.2% 28.8% 26.4% 24% 0406400000 Blue-veined cheese 36% 32.4% 29% 25.4% 21.8% 18.2% 0406900000** Cheese, NES, including cheddar** 36% 33.6% 31.2% 28.8% 26.4% 24% TRQ Volume (MT) 7,000 7,210 7,426 7,649 7,878 The Korea Dairy Industries Association(KDIA)will administer the TRQs and allocate the in-quota quantity to historical and new importers through a
licensing system
Table 12: Cheese Tariff Schedule on Korea-US FTA implementation
HS Code Product
Rat
e %
Yr
1 Yr
2 Yr
3 Yr
4 Yr
5 Yr
6 Yr
7 Yr
8 Yr
9 Yr1
0 Yr1
1 Yr1
2 Yr1
3 Yr1
4 Yr15
0406.10. 1000 Fresh Cheese
36
% 32.
4 28.
8 25.
2 21.
6 18 14.
4 10.
8 7.2 3.6 0
0406.10. 2000 Curd
36 32.
4 28.
8 25.
2 21.
6 18 14.
4 10.
8 7.2 3.6 0
Annual duty- free quota in MT for HS 0406.10.10, 0406.20.00, 0406.30.00& 0406.90.00
NA 7,0
00 MT
7,2
10 7,4
26 7,6
49 7,8
79 8,1
15 8,3
58 8,6
09 8,8
67 9,13
3 9,40
7 9,69
0 9,98
0 10,2
80 Unlimi
ted
0406.20. 0000 Grated/ Powdere
36 33.
6
31.2
28.8
26.4
24 21.6
19.2
16.8
14.4
12 9.6 7.2 4.8 2.4 0
d cheese
0406.30. 0000 Processed cheese, not grated or powdered
36
33.6
31.2
28.8
26.4
24
21.6
19.2
16.8
14.4
12
9.6
7.2
4.8
2.4
0
0406.40. 0000 Blue- veined cheese
36
33.6
31.2
28.8
26.4
24
21.6
19.2
16.8
14.4
12
9.6
7.2
4.8
2.4
0
0406.90. 0000 Other cheese
36
33.6
31.2
28.8
26.4
24
21.6
19.2
16.8
14.4
12
9. 6
7.2
4.8
2.4
0
0406.90. 0000 Cheese, Cheddar
36
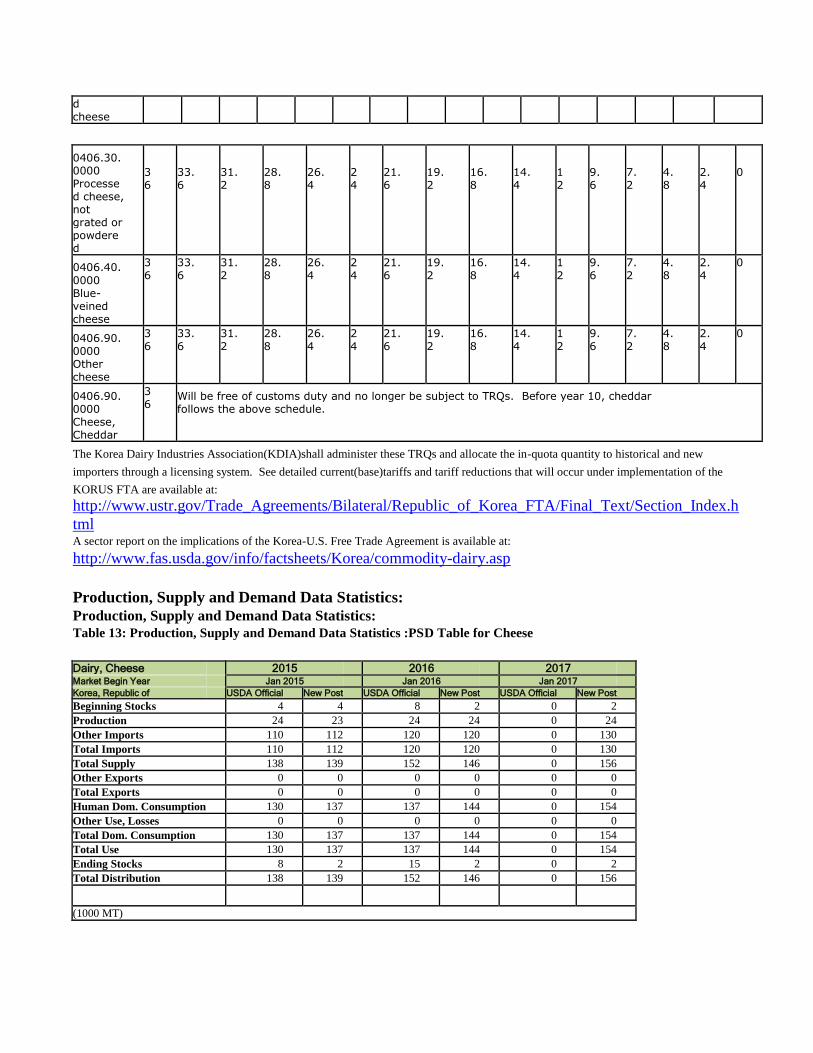
Will be free of customs duty and no longer be subject to TRQs. Before year 10, cheddar follows the above schedule.
The Korea Dairy Industries Association(KDIA)shall administer these TRQs and allocate the in-quota quantity to historical and new
importers through a licensing system. See detailed current(base)tariffs and tariff reductions that will occur under implementation of the
KORUS FTA are available at:
http://www.ustr.gov/Trade_Agreements/Bilateral/Republic_of_Korea_FTA/Final_Text/Section_Index.h
tml A sector report on the implications of the Korea-U.S. Free Trade Agreement is available at:
http://www.fas.usda.gov/info/factsheets/Korea/commodity-dairy.asp
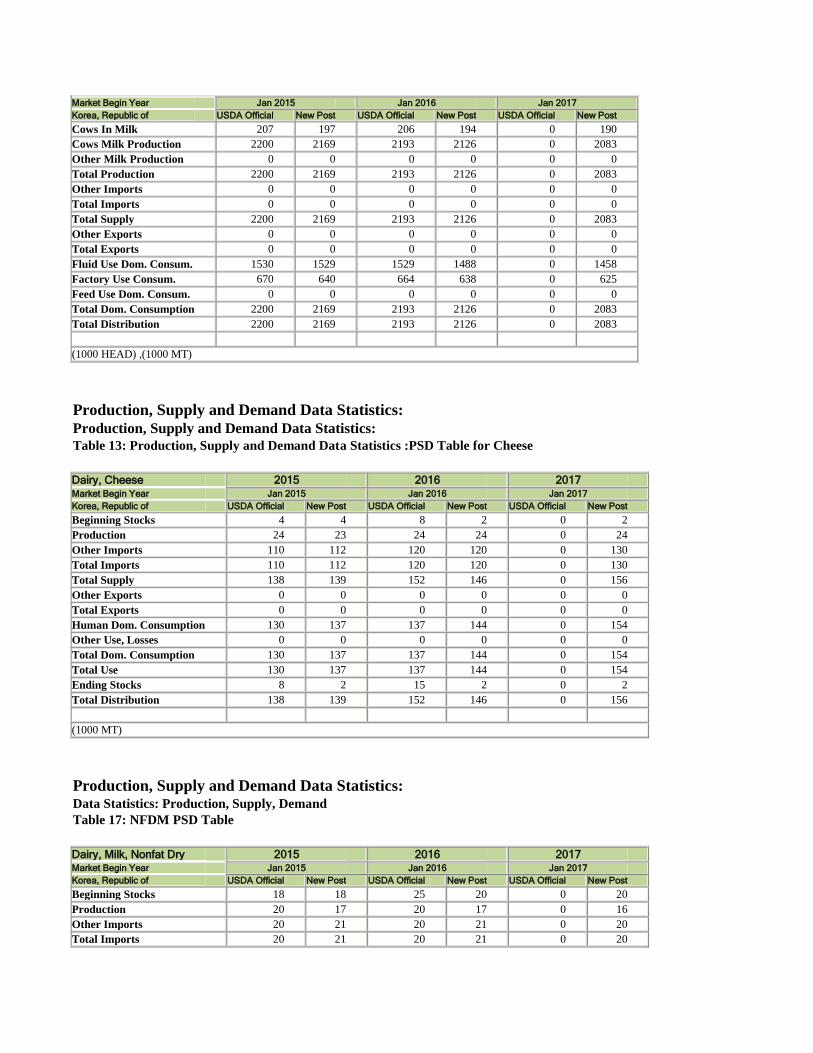
Production, Supply and Demand Data Statistics: Production, Supply and Demand Data Statistics: Table 13: Production, Supply and Demand Data Statistics :PSD Table for Cheese
Dairy, Cheese 2015 2016 2017 Market Begin Year Jan 2015 Jan 2016 Jan 2017 Korea, Republic of USDA Official New Post USDA Official New Post USDA Official New Post Beginning Stocks 4 4 8 2 0 2 Production 24 23 24 24 0 24 Other Imports 110 112 120 120 0 130 Total Imports 110 112 120 120 0 130 Total Supply 138 139 152 146 0 156 Other Exports 0 0 0 0 0 0 Total Exports 0 0 0 0 0 0 Human Dom. Consumption 130 137 137 144 0 154 Other Use, Losses 0 0 0 0 0 0 Total Dom. Consumption 130 137 137 144 0 154 Total Use 130 137 137 144 0 154 Ending Stocks 8 2 15 2 0 2 Total Distribution 138 139 152 146 0 156
(1000 MT)
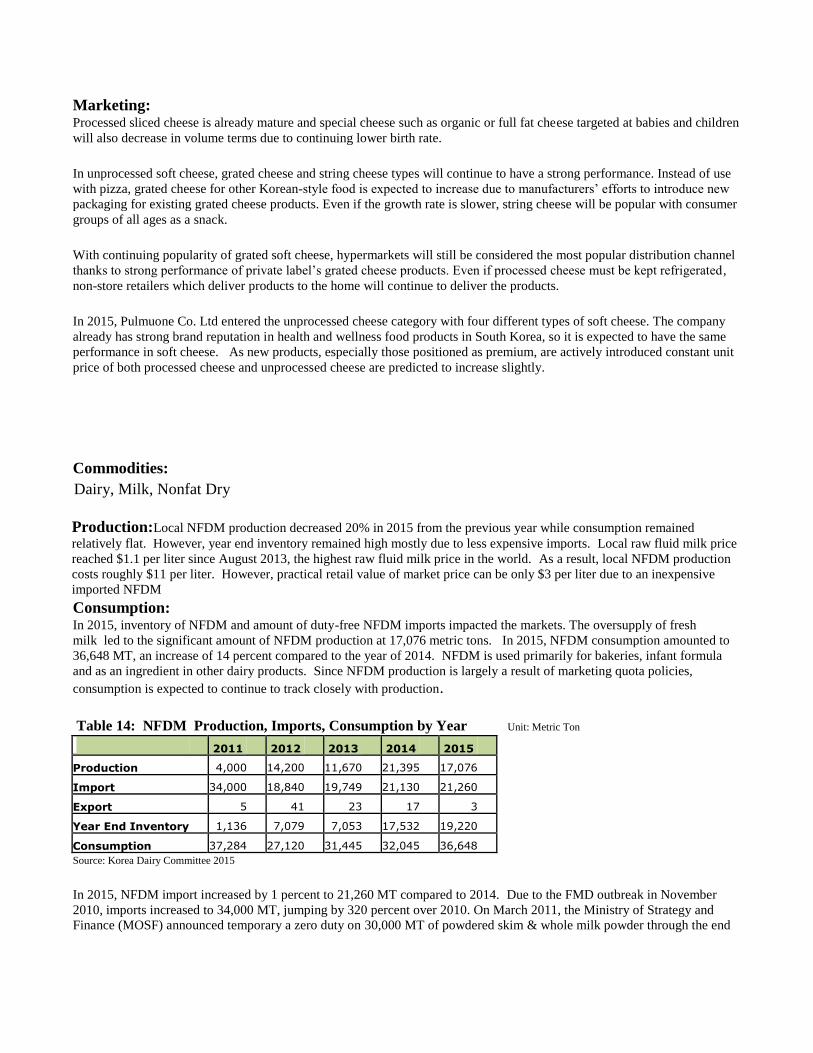
Marketing: Processed sliced cheese is already mature and special cheese such as organic or full fat cheese targeted at babies and children
will also decrease in volume terms due to continuing lower birth rate.
In unprocessed soft cheese, grated cheese and string cheese types will continue to have a strong performance. Instead of use
with pizza, grated cheese for other Korean-style food is expected to increase due to manufacturers’ efforts to introduce new
packaging for existing grated cheese products. Even if the growth rate is slower, string cheese will be popular with consumer
groups of all ages as a snack.
With continuing popularity of grated soft cheese, hypermarkets will still be considered the most popular distribution channel
thanks to strong performance of private label’s grated cheese products. Even if processed cheese must be kept refrigerated,
non-store retailers which deliver products to the home will continue to deliver the products.
In 2015, Pulmuone Co. Ltd entered the unprocessed cheese category with four different types of soft cheese. The company
already has strong brand reputation in health and wellness food products in South Korea, so it is expected to have the same
performance in soft cheese. As new products, especially those positioned as premium, are actively introduced constant unit
price of both processed cheese and unprocessed cheese are predicted to increase slightly.
Commodities:
Production:Local NFDM production decreased 20% in 2015 from the previous year while consumption remained
relatively flat. However, year end inventory remained high mostly due to less expensive imports. Local raw fluid milk price
reached $1.1 per liter since August 2013, the highest raw fluid milk price in the world. As a result, local NFDM production
costs roughly $11 per liter. However, practical retail value of market price can be only $3 per liter due to an inexpensive
imported NFDM
Consumption: In 2015, inventory of NFDM and amount of duty-free NFDM imports impacted the markets. The oversupply of fresh
milk led to the significant amount of NFDM production at 17,076 metric tons. In 2015, NFDM consumption amounted to
36,648 MT, an increase of 14 percent compared to the year of 2014. NFDM is used primarily for bakeries, infant formula
and as an ingredient in other dairy products. Since NFDM production is largely a result of marketing quota policies,
consumption is expected to continue to track closely with production.
Table 14: NFDM Production, Imports, Consumption by Year Unit: Metric Ton
2011 2012 2013 2014 2015 Production 4,000 14,200 11,670 21,395 17,076
Import 34,000 18,840 19,749 21,130 21,260
Export 5 41 23 17 3
Year End Inventory 1,136 7,079 7,053 17,532 19,220
Consumption 37,284 27,120 31,445 32,045 36,648 Source: Korea Dairy Committee 2015
In 2015, NFDM import increased by 1 percent to 21,260 MT compared to 2014. Due to the FMD outbreak in November
2010, imports increased to 34,000 MT, jumping by 320 percent over 2010. On March 2011, the Ministry of Strategy and
Finance (MOSF) announced temporary a zero duty on 30,000 MT of powdered skim & whole milk powder through the end
Dairy, Milk, Nonfat Dry
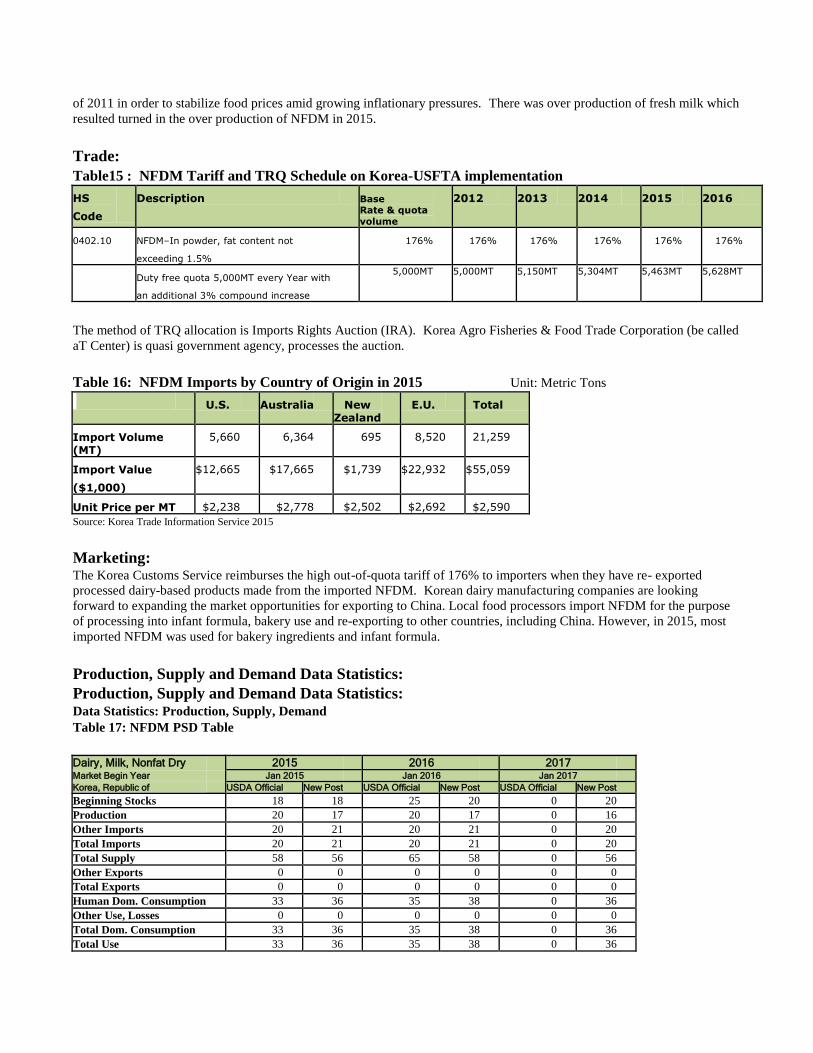
of 2011 in order to stabilize food prices amid growing inflationary pressures. There was over production of fresh milk which
resulted turned in the over production of NFDM in 2015.
Trade:
Table15 : NFDM Tariff and TRQ Schedule on Korea-USFTA implementation
HS
Code Description Base
Rate & quota
volume
2012 2013 2014 2015 2016
0402.10 NFDM–In powder, fat content not
exceeding 1.5% 176% 176% 176% 176% 176% 176%
Duty free quota 5,000MT every Year with
an additional 3% compound increase
5,000MT 5,000MT 5,150MT 5,304MT 5,463MT 5,628MT
The method of TRQ allocation is Imports Rights Auction (IRA). Korea Agro Fisheries & Food Trade Corporation (be called
aT Center) is quasi government agency, processes the auction.
Table 16: NFDM Imports by Country of Origin in 2015 Unit: Metric Tons
U.S. Australia New Zealand
E.U. Total
Import Volume (MT)
5,660 6,364 695 8,520 21,259
Import Value ($1,000)
$12,665 $17,665 $1,739 $22,932 $55,059
Unit Price per MT $2,238 $2,778 $2,502 $2,692 $2,590 Source: Korea Trade Information Service 2015
Marketing: The Korea Customs Service reimburses the high out-of-quota tariff of 176% to importers when they have re- exported
processed dairy-based products made from the imported NFDM. Korean dairy manufacturing companies are looking
forward to expanding the market opportunities for exporting to China. Local food processors import NFDM for the purpose
of processing into infant formula, bakery use and re-exporting to other countries, including China. However, in 2015, most
imported NFDM was used for bakery ingredients and infant formula.
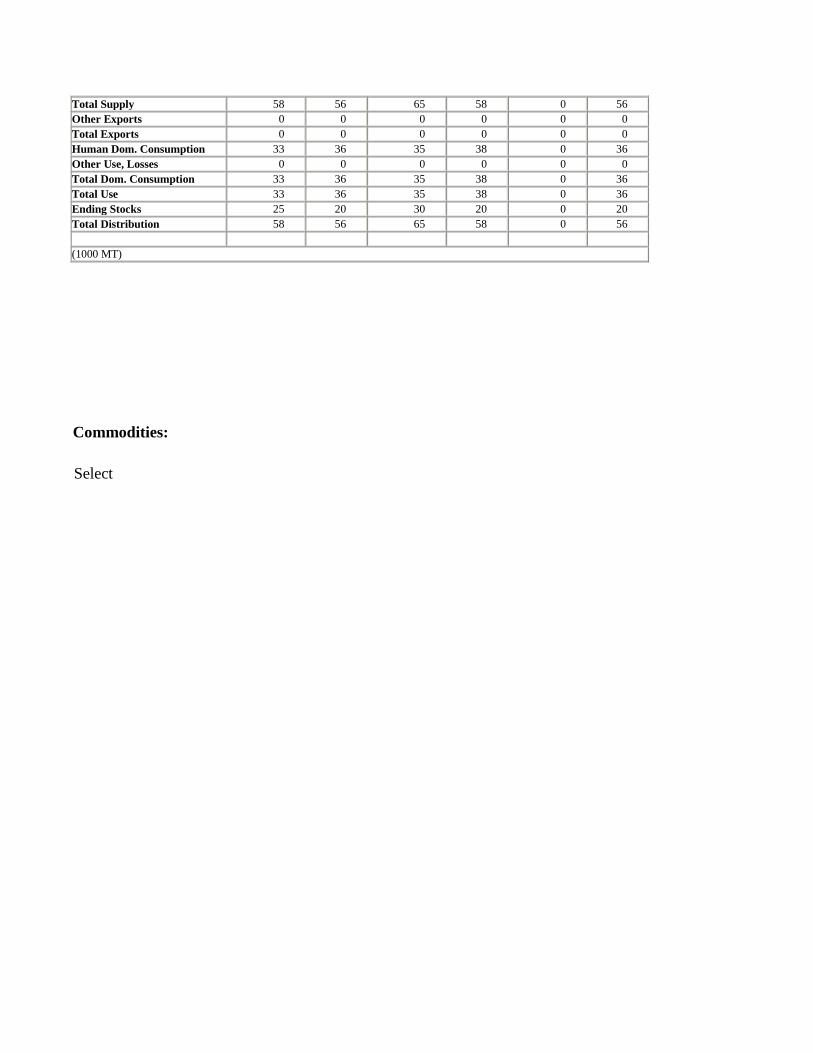
Production, Supply and Demand Data Statistics:
Production, Supply and Demand Data Statistics: Data Statistics: Production, Supply, Demand Table 17: NFDM PSD Table
Dairy, Milk, Nonfat Dry 2015 2016 2017 Market Begin Year Jan 2015 Jan 2016 Jan 2017 Korea, Republic of USDA Official New Post USDA Official New Post USDA Official New Post Beginning Stocks 18 18 25 20 0 20 Production 20 17 20 17 0 16 Other Imports 20 21 20 21 0 20 Total Imports 20 21 20 21 0 20 Total Supply 58 56 65 58 0 56 Other Exports 0 0 0 0 0 0 Total Exports 0 0 0 0 0 0 Human Dom. Consumption 33 36 35 38 0 36 Other Use, Losses 0 0 0 0 0 0 Total Dom. Consumption 33 36 35 38 0 36 Total Use 33 36 35 38 0 36
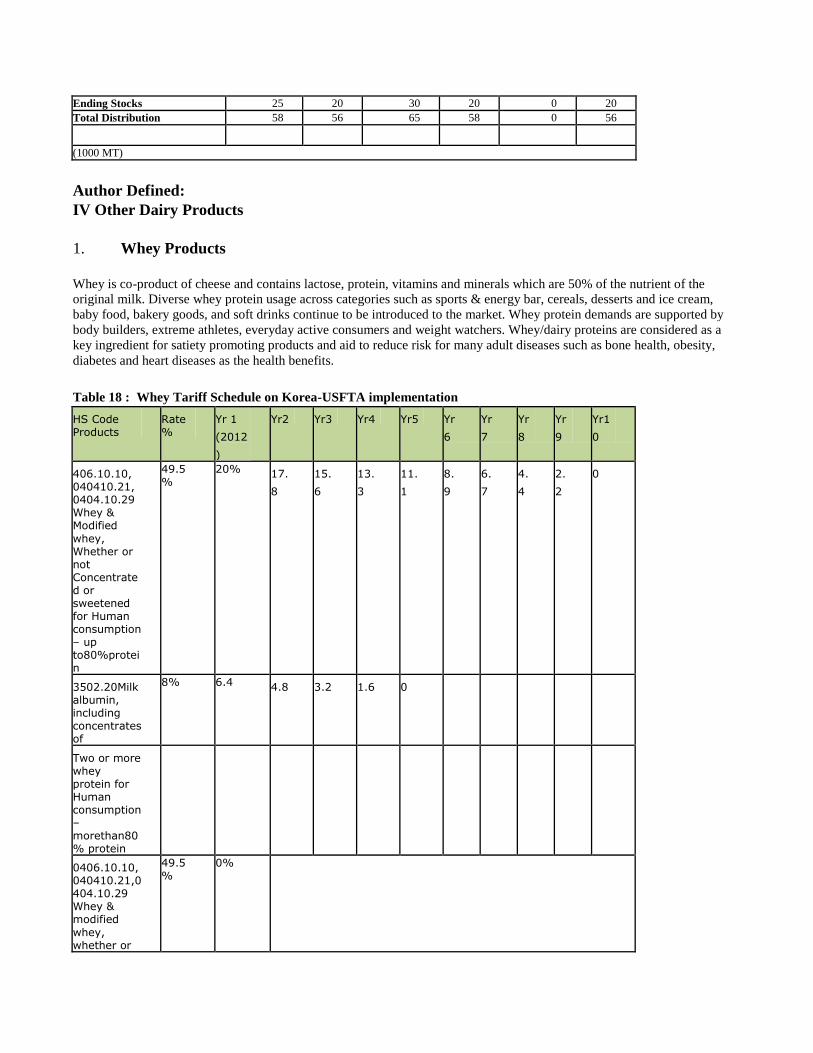
Ending Stocks 25 20 30 20 0 20 Total Distribution 58 56 65 58 0 56
(1000 MT)
Author Defined:
IV Other Dairy Products
1. Whey Products Whey is co-product of cheese and contains lactose, protein, vitamins and minerals which are 50% of the nutrient of the
original milk. Diverse whey protein usage across categories such as sports & energy bar, cereals, desserts and ice cream,
baby food, bakery goods, and soft drinks continue to be introduced to the market. Whey protein demands are supported by
body builders, extreme athletes, everyday active consumers and weight watchers. Whey/dairy proteins are considered as a
key ingredient for satiety promoting products and aid to reduce risk for many adult diseases such as bone health, obesity,
diabetes and heart diseases as the health benefits.
Table 18 : Whey Tariff Schedule on Korea-USFTA implementation
HS Code Products
Rate %
Yr 1 (2012
)
Yr2 Yr3 Yr4 Yr5 Yr
6 Yr
7 Yr
8 Yr
9 Yr1
0
406.10.10, 040410.21, 0404.10.29 Whey & Modified
whey, Whether or not Concentrated or sweetened for Human consumption – up to80%protei n
49.5%
20% 17.
8 15.
6 13.
3 11.
1 8.
9 6.
7 4.
4 2.
2 0
3502.20Milk albumin, including concentrates of
8% 6.4 4.8 3.2 1.6 0
Two or more whey protein for Human consumption – morethan80 % protein
0406.10.10, 040410.21,0 404.10.29 Whey & modified
whey, whether or
49.5%
0%
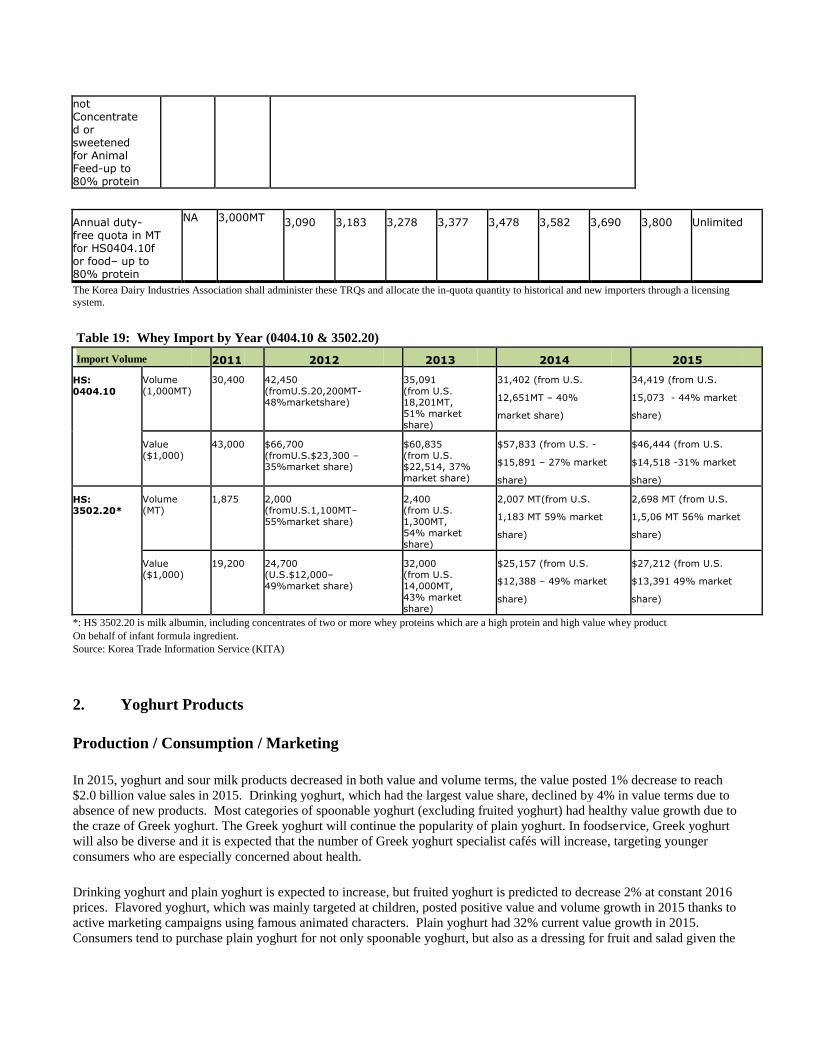
not Concentrated or sweetened for Animal Feed-up to 80% protein
Annual duty- free quota in MT for HS0404.10f or food– up to 80% protein
NA 3,000MT 3,090 3,183 3,278 3,377 3,478 3,582 3,690 3,800 Unlimited
The Korea Dairy Industries Association shall administer these TRQs and allocate the in-quota quantity to historical and new importers through a licensing system.
Table 19: Whey Import by Year (0404.10 & 3502.20)
Import Volume 2011 2012 2013 2014 2015
HS: 0404.10
Volume (1,000MT)
30,400 42,450 (fromU.S.20,200MT- 48%marketshare)
35,091 (from U.S. 18,201MT, 51% market
share)
31,402 (from U.S.
12,651MT – 40%
market share)
34,419 (from U.S.
15,073 - 44% market
share)
Value ($1,000)
43,000 $66,700 (fromU.S.$23,300 – 35%market share)
$60,835 (from U.S. $22,514, 37% market share)
$57,833 (from U.S. -
$15,891 – 27% market
share)
$46,444 (from U.S.
$14,518 -31% market
share) HS: 3502.20*
Volume (MT)
1,875 2,000 (fromU.S.1,100MT– 55%market share)
2,400 (from U.S.
1,300MT, 54% market
share)
2,007 MT(from U.S.
1,183 MT 59% market
share)
2,698 MT (from U.S.
1,5,06 MT 56% market
share)
Value ($1,000)
19,200 24,700 (U.S.$12,000–
49%market share)
32,000 (from U.S.
14,000MT, 43% market
share)
$25,157 (from U.S.
$12,388 – 49% market
share)
$27,212 (from U.S.
$13,391 49% market
share)
*: HS 3502.20 is milk albumin, including concentrates of two or more whey proteins which are a high protein and high value whey product On behalf of infant formula ingredient. Source: Korea Trade Information Service (KITA)
2. Yoghurt Products
Production / Consumption / Marketing
In 2015, yoghurt and sour milk products decreased in both value and volume terms, the value posted 1% decrease to reach
$2.0 billion value sales in 2015. Drinking yoghurt, which had the largest value share, declined by 4% in value terms due to
absence of new products. Most categories of spoonable yoghurt (excluding fruited yoghurt) had healthy value growth due to
the craze of Greek yoghurt. The Greek yoghurt will continue the popularity of plain yoghurt. In foodservice, Greek yoghurt
will also be diverse and it is expected that the number of Greek yoghurt specialist cafés will increase, targeting younger
consumers who are especially concerned about health.
Drinking yoghurt and plain yoghurt is expected to increase, but fruited yoghurt is predicted to decrease 2% at constant 2016
prices. Flavored yoghurt, which was mainly targeted at children, posted positive value and volume growth in 2015 thanks to
active marketing campaigns using famous animated characters. Plain yoghurt had 32% current value growth in 2015.
Consumers tend to purchase plain yoghurt for not only spoonable yoghurt, but also as a dressing for fruit and salad given the
health and wellness trend. Fruited yoghurt contains sugar or fruit concentrate, so consumers shifted to plain yoghurt in order
to consume more natural food.
Maeil Dairies Co. introduced Maeil Bio large pack size in 2014, which had a 20% value share within a year of its
introduction. Namyang Dairy Products Co. also posted a strong performance of Milk 100 nothing-added concept of plain
yoghurt with both large cup and small cup pack size. Current unit price of plain yoghurt therefore declined slightly in
2015. Korea Yakult maintained the largest value share of 45% within yoghurt and sour milk products. Although the
company lost value share in 2015 due to the decline in value share of drinking yoghurt, it still had a solid leading position.
The company had a 51% value share within drinking yoghurt. Binggrae Co. maintained a strong position with a 34% value
share in plain yoghurt. The company posted 20% value growth within plain yoghurt.
3. Ice Cream
Production / Consumption / Marketing
Ice cream was the only packaged food category where hypermarkets held a very small retail value share (only 4%) in 2015.
Supermarkets and independent small grocers regarded ice cream as an important product to attract consumers.
The rising current unit prices of ice cream as a result of the government retail selling price system limited the fall in retail
current value sales to 1% and sales reached $1.9 billion in 2015, however, retail volume sales decreased by 2%. In addition,
the MERS Corona Virus spread nationally during summer 2015. Thus, ice cream sales decreased as consumers put off
visiting retailers to avoid being infected with the virus. In terms of format, sticks continued to lose retail value share in
impulse ice cream and fell to 29% in 2015. On the other hand, cones share continued to rise gradually to reach 20%. The
share of “others”, such as pouches, cups and tubes, increased between 2012 and 2015 to reach one half of retail value sales.
In particular, pouch ice cream benefited by being targeted at adults. In South Korea, vanilla, strawberry and chocolate
remained the top ice cream flavors in retail value sales terms in 2015. The popularity of coffee-flavored ice cream steadily
grew, especially among adult consumers. On the other hand, fruit-flavored ice cream remained limited in terms of product
variety and existing brands lost retail value sales.
Lotte Confectionery leads ice cream in 2015, with a 30% share of retail value sales, followed by Binggrae, with a 27% share.
As retail value sales of ice cream decreased, Lotte Confectionery focused on super premium ice cream and premium desserts.
Binggrae Co. expanded the flavors of its famous Melona (melon flavor) brand. Since 1992, the company has extended its
flavors to include strawberry, banana, and mango.
V. EXPORT REQUIREMENT TO KOREA:
See APHIS’website(http://www.aphis.usda.gov/regulations/vs/iregs/products/ for any sanitary requirements for shipping
dairy products to Korea.
For more information, please contact the U.S.AgriculturalTradeOffice, U.S.Embassy Seoul,Korea,at
[email protected],Tel:82-2-6951-6845,Fax:82-2-720-7921,or visitwww.atoseoul.com
Production, Supply and Demand Data Statistics:
Production, Supply and Demand Data Statistics:
Table 8: Production, Supply and Demand Data Statistics: PSD TABLE for Fluid Milk
Dairy, Milk, Fluid 2015 2016 2017
Market Begin Year Jan 2015 Jan 2016 Jan 2017
Korea, Republic of USDA Official New Post USDA Official New Post USDA Official New Post
Cows In Milk 207 197 206 194 0 190
Cows Milk Production 2200 2169 2193 2126 0 2083
Other Milk Production 0 0 0 0 0 0
Total Production 2200 2169 2193 2126 0 2083
Other Imports 0 0 0 0 0 0
Total Imports 0 0 0 0 0 0
Total Supply 2200 2169 2193 2126 0 2083
Other Exports 0 0 0 0 0 0
Total Exports 0 0 0 0 0 0
Fluid Use Dom. Consum. 1530 1529 1529 1488 0 1458
Factory Use Consum. 670 640 664 638 0 625
Feed Use Dom. Consum. 0 0 0 0 0 0
Total Dom. Consumption 2200 2169 2193 2126 0 2083
Total Distribution 2200 2169 2193 2126 0 2083
(1000 HEAD) ,(1000 MT)
Production, Supply and Demand Data Statistics: Production, Supply and Demand Data Statistics:
Table 13: Production, Supply and Demand Data Statistics :PSD Table for Cheese
Dairy, Cheese 2015 2016 2017 Market Begin Year Jan 2015 Jan 2016 Jan 2017
Korea, Republic of USDA Official New Post USDA Official New Post USDA Official New Post
Beginning Stocks 4 4 8 2 0 2
Production 24 23 24 24 0 24
Other Imports 110 112 120 120 0 130
Total Imports 110 112 120 120 0 130
Total Supply 138 139 152 146 0 156
Other Exports 0 0 0 0 0 0
Total Exports 0 0 0 0 0 0
Human Dom. Consumption 130 137 137 144 0 154
Other Use, Losses 0 0 0 0 0 0
Total Dom. Consumption 130 137 137 144 0 154
Total Use 130 137 137 144 0 154
Ending Stocks 8 2 15 2 0 2
Total Distribution 138 139 152 146 0 156
(1000 MT)
Production, Supply and Demand Data Statistics: Data Statistics: Production, Supply, Demand Table 17: NFDM PSD Table
Dairy, Milk, Nonfat Dry 2015 2016 2017 Market Begin Year Jan 2015 Jan 2016 Jan 2017
Korea, Republic of USDA Official New Post USDA Official New Post USDA Official New Post
Beginning Stocks 18 18 25 20 0 20
Production 20 17 20 17 0 16
Other Imports 20 21 20 21 0 20
Total Imports 20 21 20 21 0 20
Total Supply 58 56 65 58 0 56
Other Exports 0 0 0 0 0 0
Total Exports 0 0 0 0 0 0
Human Dom. Consumption 33 36 35 38 0 36
Other Use, Losses 0 0 0 0 0 0
Total Dom. Consumption 33 36 35 38 0 36
Total Use 33 36 35 38 0 36
Ending Stocks 25 20 30 20 0 20
Total Distribution 58 56 65 58 0 56
(1000 MT)
Commodities:
Select