Embed Size (px)
Citation preview
Kopernik Global Investors4Q 2018 Conference Call
Presented by:David B. Iben, CFACIO & Lead Portfolio Manager
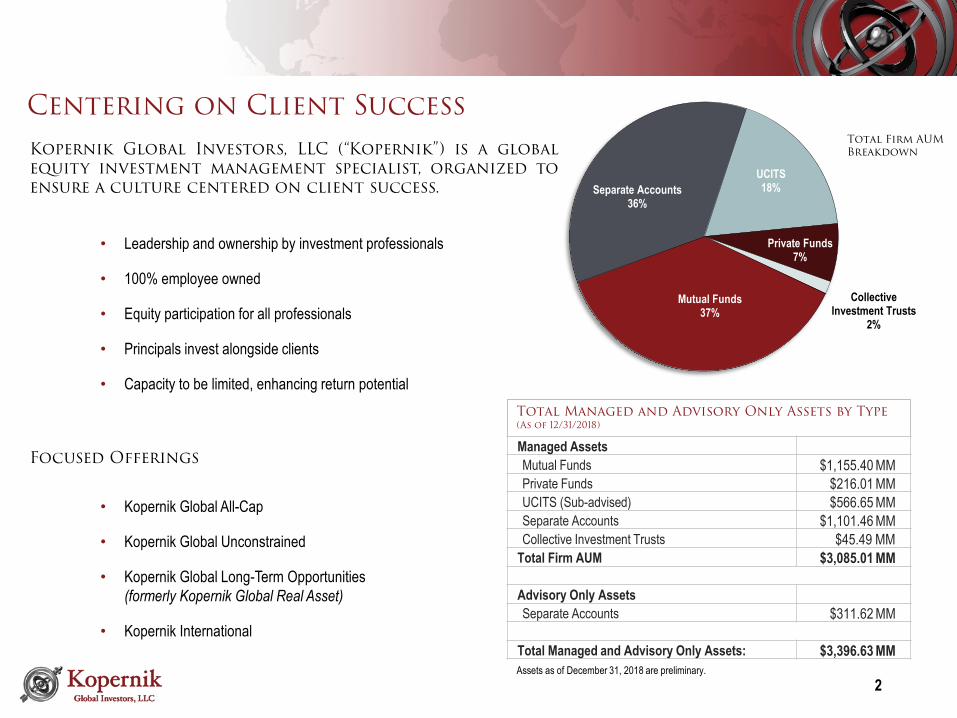
Mutual Funds37%
Separate Accounts36%
UCITS18%
Private Funds7%
Collective Investment Trusts
2%
• Leadership and ownership by investment professionals
• 100% employee owned
• Equity participation for all professionals
• Principals invest alongside clients
• Capacity to be limited, enhancing return potential
2
Total Managed and Advisory Only Assets by Type (As of 12/31/2018)
• Kopernik Global All-Cap
• Kopernik Global Unconstrained
• Kopernik Global Long-Term Opportunities (formerly Kopernik Global Real Asset)
• Kopernik International
Centering on Client Success
Managed AssetsMutual Funds $1,155.40 MMPrivate Funds $216.01 MMUCITS (Sub-advised) $566.65 MMSeparate Accounts $1,101.46 MMCollective Investment Trusts $45.49 MM
Total Firm AUM $3,085.01 MM
Advisory Only AssetsSeparate Accounts $311.62 MM
Total Managed and Advisory Only Assets: $3,396.63 MM
Kopernik Global Investors, LLC (“Kopernik”) is a globalequity investment management specialist, organized toensure a culture centered on client success.
Focused Offerings
Assets as of December 31, 2018 are preliminary.
Total Firm AUM Breakdown
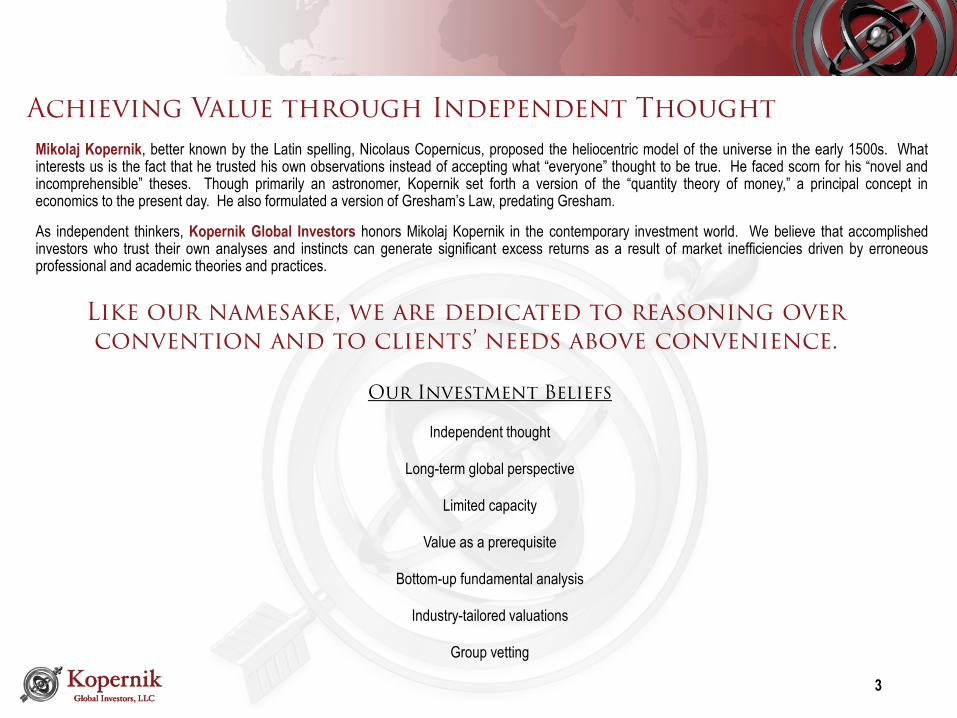
Like our namesake, we are dedicated to reasoning over convention and to clients’ needs above convenience.
Our Investment Beliefs
Independent thought
Long-term global perspective
Limited capacity
Value as a prerequisite
Bottom-up fundamental analysis
Industry-tailored valuations
Group vetting
Mikolaj Kopernik, better known by the Latin spelling, Nicolaus Copernicus, proposed the heliocentric model of the universe in the early 1500s. Whatinterests us is the fact that he trusted his own observations instead of accepting what “everyone” thought to be true. He faced scorn for his “novel andincomprehensible” theses. Though primarily an astronomer, Kopernik set forth a version of the “quantity theory of money,” a principal concept ineconomics to the present day. He also formulated a version of Gresham’s Law, predating Gresham.
As independent thinkers, Kopernik Global Investors honors Mikolaj Kopernik in the contemporary investment world. We believe that accomplishedinvestors who trust their own analyses and instincts can generate significant excess returns as a result of market inefficiencies driven by erroneousprofessional and academic theories and practices.
3
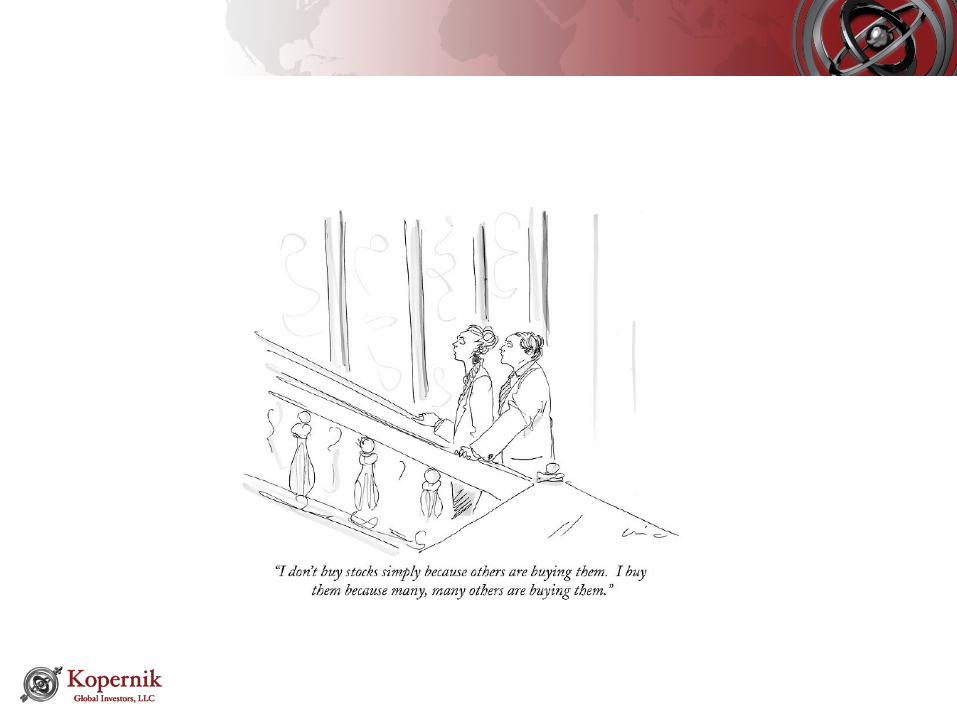
Achieving Value through Independent Thought
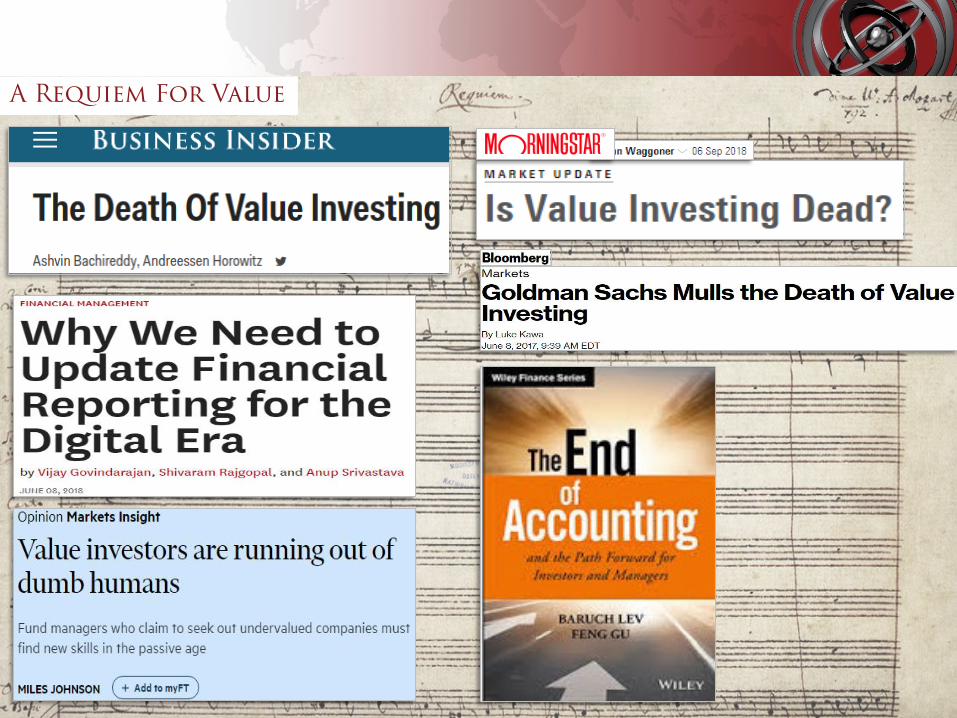
A Requiem For Value
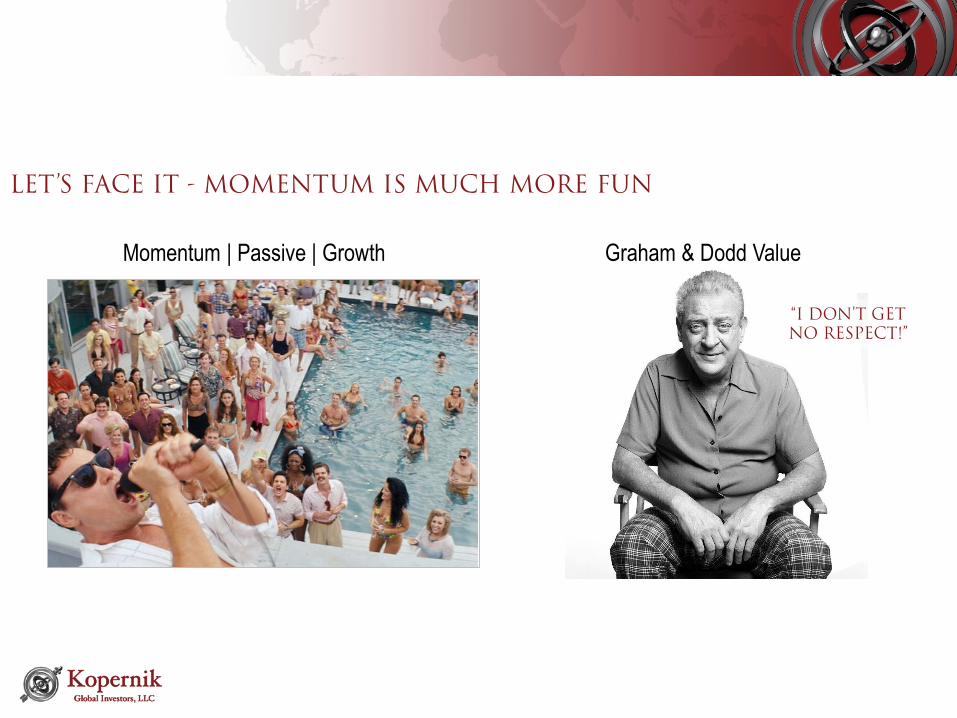
Momentum | Passive | Growth Graham & Dodd Value
LET’S FACE IT - MOMENTUM IS MUCH MORE FUN
“I DON’T GET NO RESPECT!”
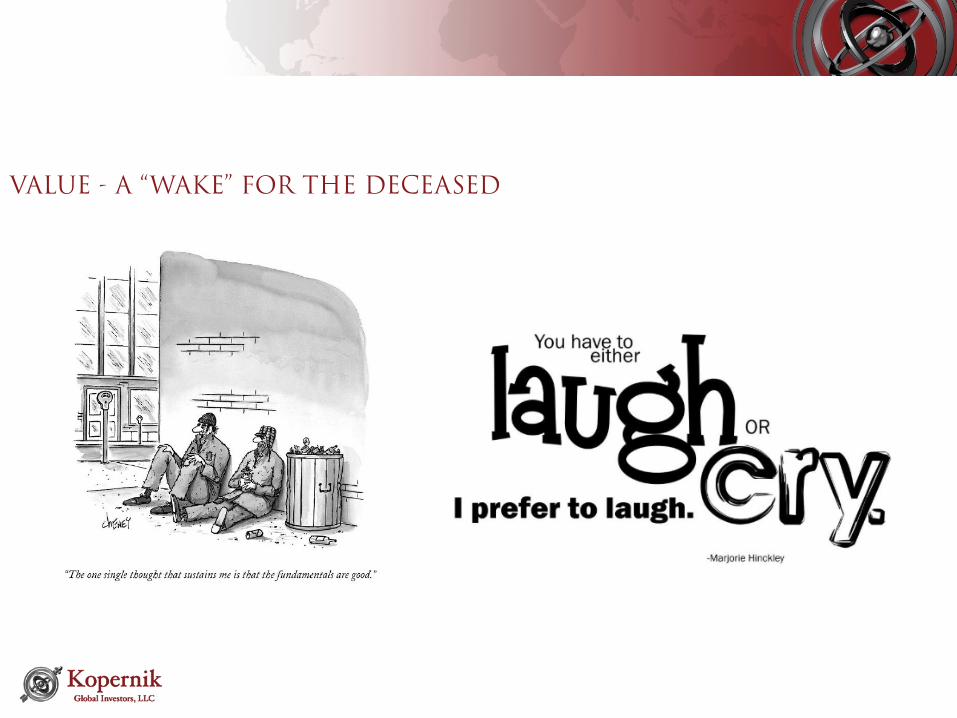
VALUE - A “WAKE” FOR THE DECEASED
$800
$1,000
$1,200
$1,400
$1,600
$1,800
$2,000
$2,200
$2,400
2013 2014 2015 2016 2017 2018
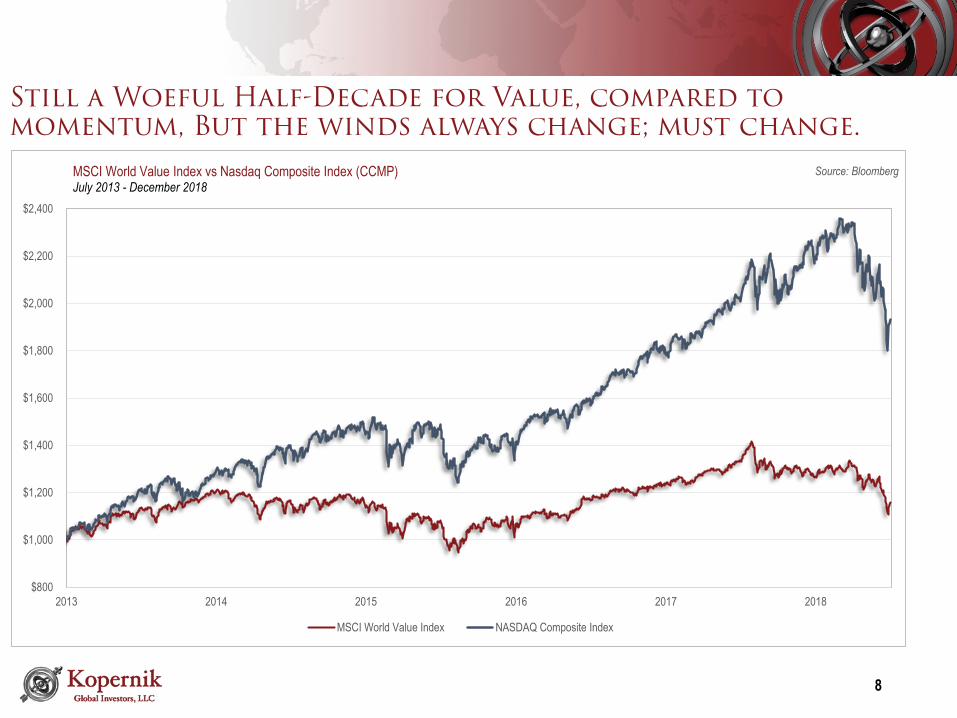
MSCI World Value Index vs Nasdaq Composite Index (CCMP)July 2013 - December 2018
MSCI World Value Index NASDAQ Composite Index
8
Still a Woeful Half-Decade for Value, compared to momentum, But the winds always change; must change.
Source: Bloomberg
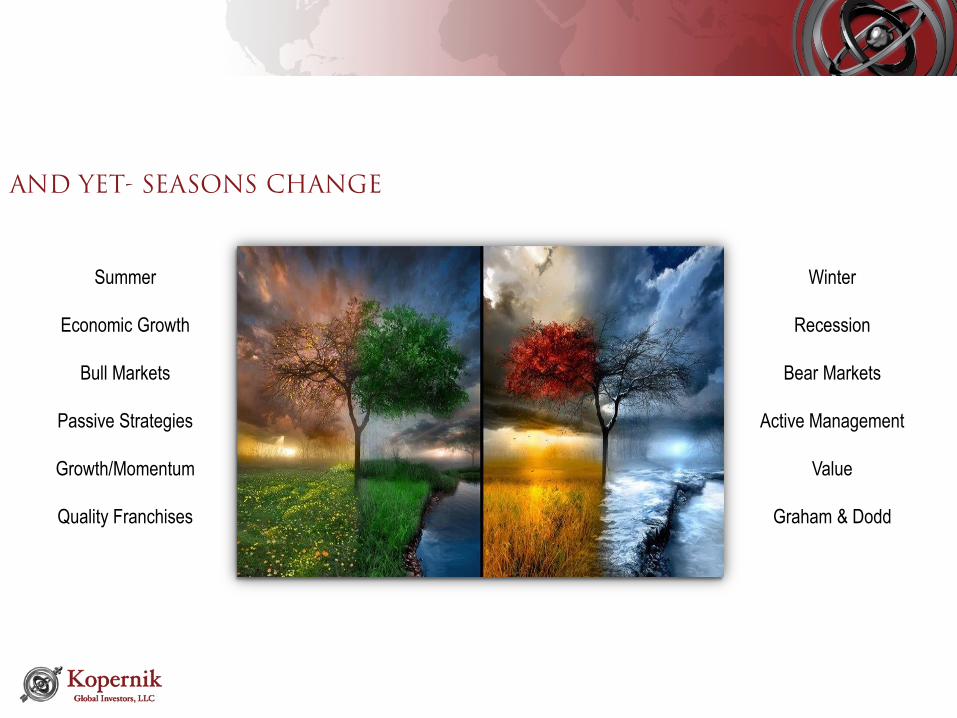
AND YET- SEASONS CHANGE
Summer
Economic Growth
Bull Markets
Passive Strategies
Growth/Momentum
Quality Franchises
Winter
Recession
Bear Markets
Active Management
Value
Graham & Dodd
10
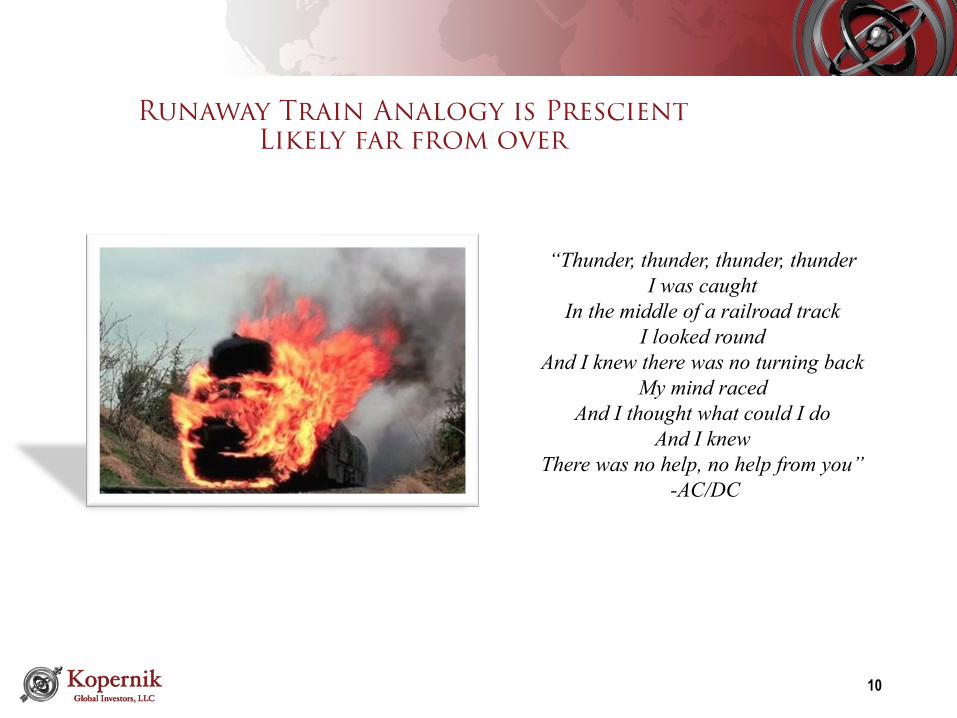
Runaway Train Analogy is Prescient Likely far from over
“Thunder, thunder, thunder, thunderI was caught
In the middle of a railroad trackI looked round
And I knew there was no turning backMy mind raced
And I thought what could I doAnd I knew
There was no help, no help from you”-AC/DC
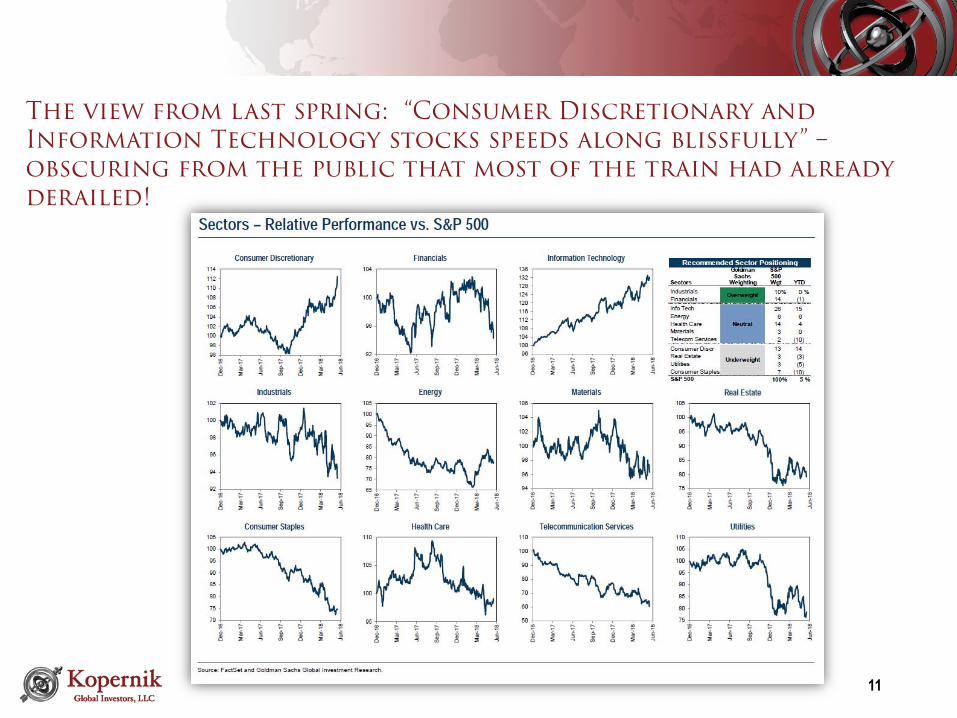
The view from last spring: “Consumer Discretionary and Information Technology stocks speeds along blissfully” –obscuring from the public that most of the train had already derailed!
11
$900
$950
$1,000
$1,050
$1,100
$1,150
$1,200
$1,250
$1,300
$1,350
$1,400
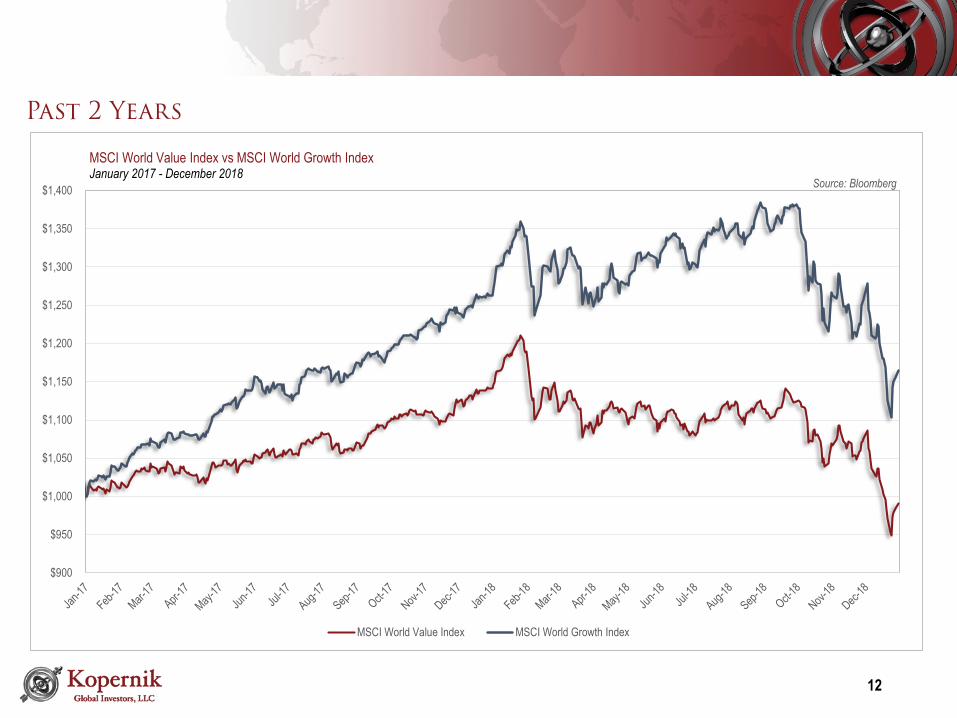
MSCI World Value Index vs MSCI World Growth IndexJanuary 2017 - December 2018
MSCI World Value Index MSCI World Growth Index
12
Past 2 Years
Source: Bloomberg
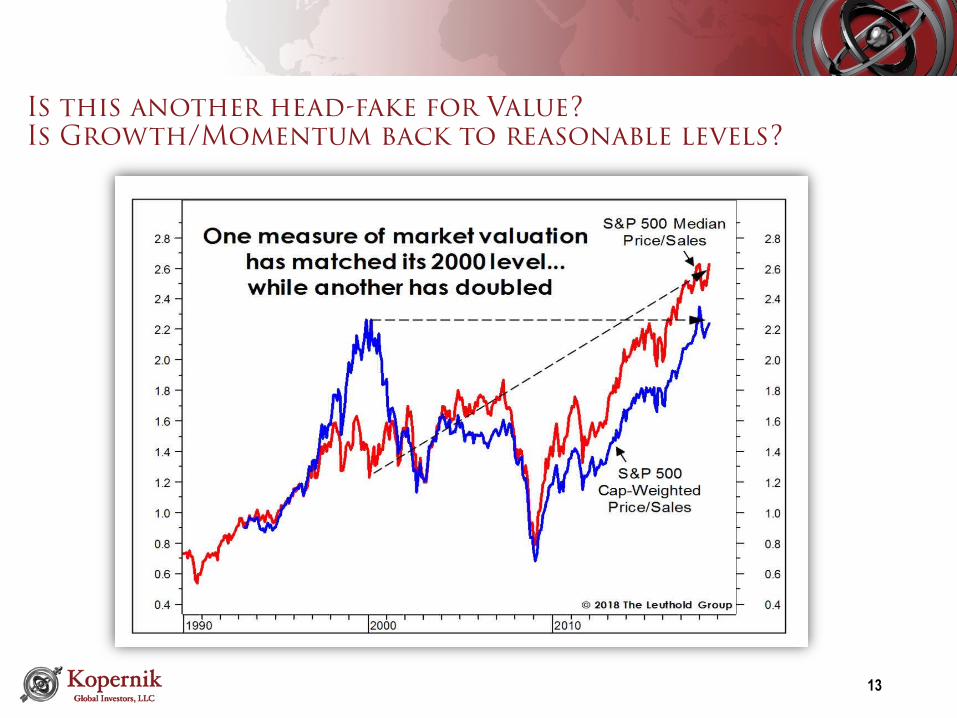
13
Is this another head-fake for Value?Is Growth/Momentum back to reasonable levels?
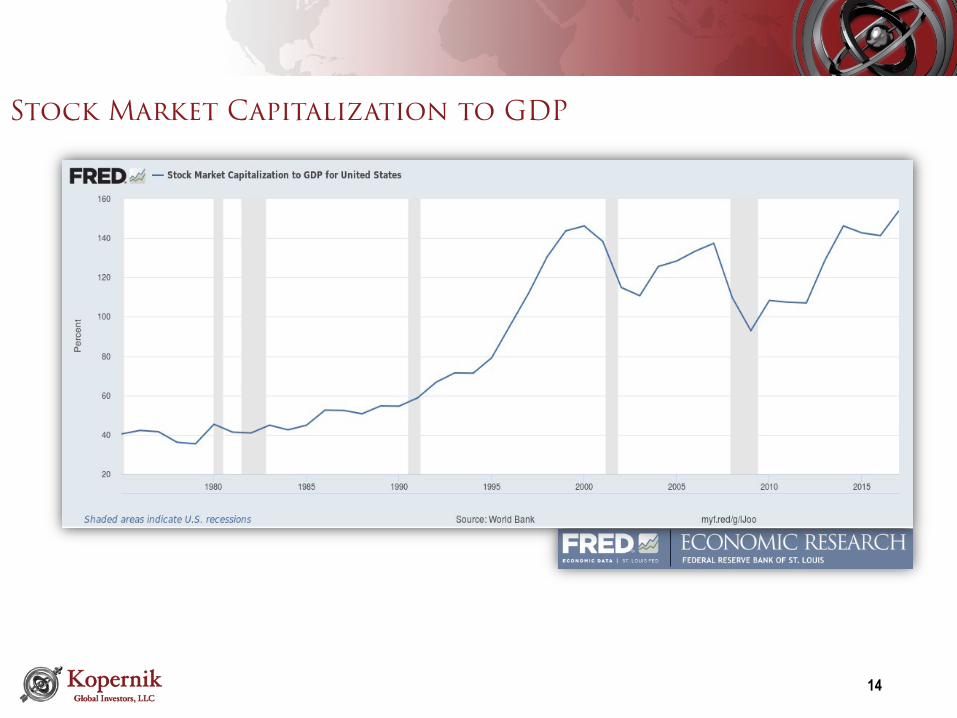
14
Stock Market Capitalization to GDP
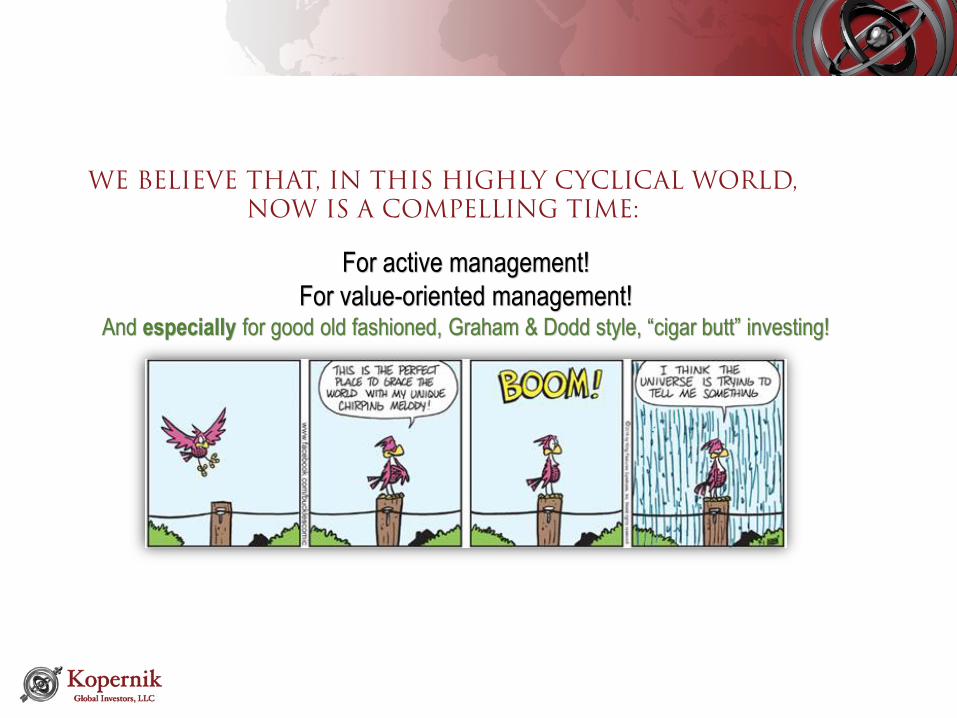
WE BELIEVE THAT, IN THIS HIGHLY CYCLICAL WORLD, NOW IS A COMPELLING TIME:
For active management!For value-oriented management!
And especially for good old fashioned, Graham & Dodd style, “cigar butt” investing!
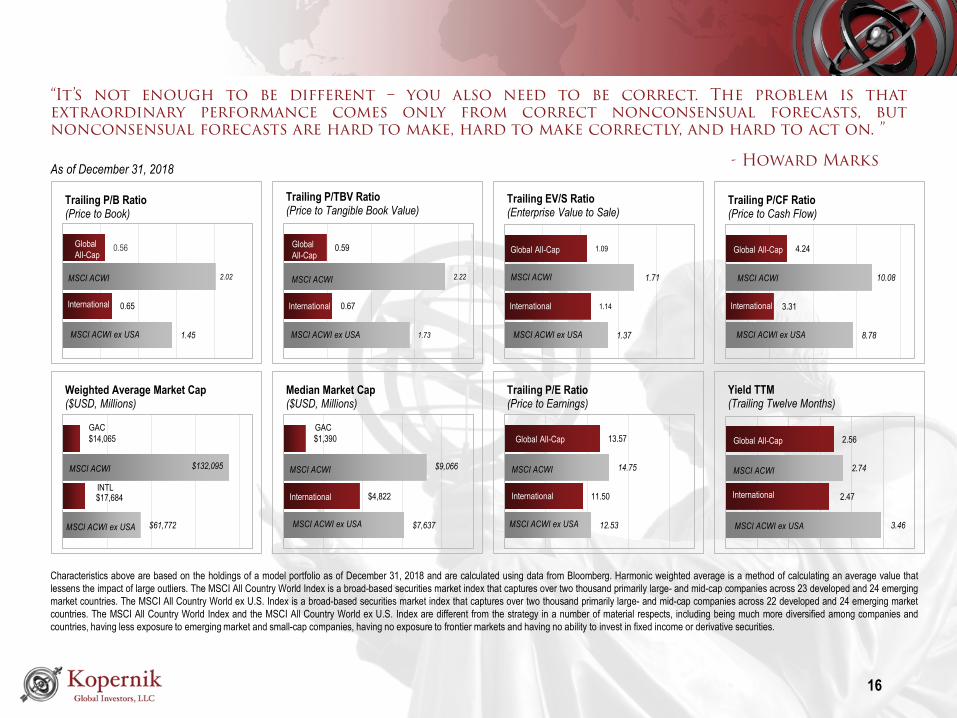
“It’s not enough to be different – you also need to be correct. The problem is thatextraordinary performance comes only from correct nonconsensual forecasts, butnonconsensual forecasts are hard to make, hard to make correctly, and hard to act on. ”
- Howard Marks
Characteristics above are based on the holdings of a model portfolio as of December 31, 2018 and are calculated using data from Bloomberg. Harmonic weighted average is a method of calculating an average value thatlessens the impact of large outliers. The MSCI All Country World Index is a broad-based securities market index that captures over two thousand primarily large- and mid-cap companies across 23 developed and 24 emergingmarket countries. The MSCI All Country World ex U.S. Index is a broad-based securities market index that captures over two thousand primarily large- and mid-cap companies across 22 developed and 24 emerging marketcountries. The MSCI All Country World Index and the MSCI All Country World ex U.S. Index are different from the strategy in a number of material respects, including being much more diversified among companies andcountries, having less exposure to emerging market and small-cap companies, having no exposure to frontier markets and having no ability to invest in fixed income or derivative securities.
16
As of December 31, 2018
1.45
0.65
2.02
0.56
Trailing P/B Ratio(Price to Book)
Global All-Cap
MSCI ACWI
International
MSCI ACWI ex USA
$61,772
$17,684
$132,095
$14,065
Weighted Average Market Cap ($USD, Millions)
MSCI ACWI
MSCI ACWI ex USA
GAC
INTL
1.73
0.67
2.22
0.59
Trailing P/TBV Ratio(Price to Tangible Book Value)
Global All-Cap
MSCI ACWI
International
MSCI ACWI ex USA
$7,637
$4,822
$9,066
$1,390
Median Market Cap ($USD, Millions)
GAC
MSCI ACWI
International
MSCI ACWI ex USA
1.37
1.14
1.71
1.09
Trailing EV/S Ratio(Enterprise Value to Sale)
Global All-Cap
MSCI ACWI
International
MSCI ACWI ex USA
12.53
11.50
14.75
13.57
Trailing P/E Ratio(Price to Earnings)
Global All-Cap
MSCI ACWI
International
MSCI ACWI ex USA
8.78
3.31
10.08
4.24
Trailing P/CF Ratio(Price to Cash Flow)
Global All-Cap
MSCI ACWI
International
MSCI ACWI ex USA
3.46
2.47
2.74
2.56
Yield TTM(Trailing Twelve Months)
Global All-Cap
MSCI ACWI
International
MSCI ACWI ex USA
When the Crowd stops Thinking – Think!
After allThe grabbing hands
Grab all they canAll for themselves
After allIt's a competitive world
Everything counts in large amounts
-Depeche ModeEverything Counts
17
“A good decision is based on knowledge
and not numbers”-Plato
19
When the Crowd stops Analyzing – Analyze!Value is found far from the crowd
only the lonely few still practice active managementA competitive advantage
When the Crowd turns to Silly Academic Orthodoxy – Be Unorthodox
21
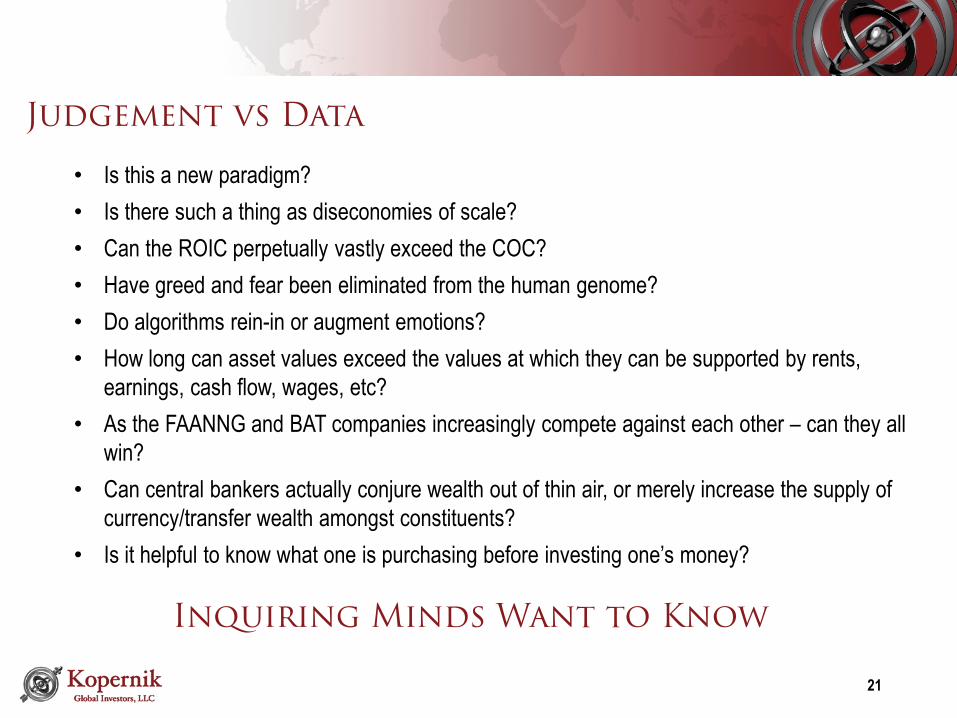
Judgement vs Data• Is this a new paradigm?• Is there such a thing as diseconomies of scale?• Can the ROIC perpetually vastly exceed the COC?• Have greed and fear been eliminated from the human genome?• Do algorithms rein-in or augment emotions?• How long can asset values exceed the values at which they can be supported by rents,
earnings, cash flow, wages, etc?• As the FAANNG and BAT companies increasingly compete against each other – can they all
win?• Can central bankers actually conjure wealth out of thin air, or merely increase the supply of
currency/transfer wealth amongst constituents?• Is it helpful to know what one is purchasing before investing one’s money?
Inquiring Minds Want to Know
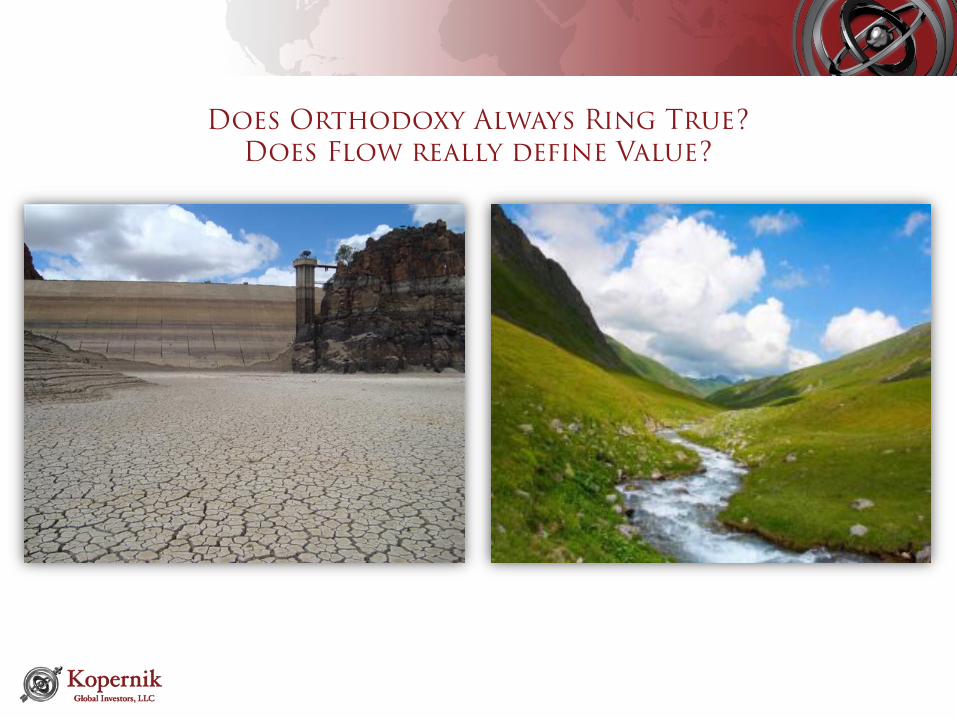
Does Orthodoxy Always Ring True? Does Flow really define Value?
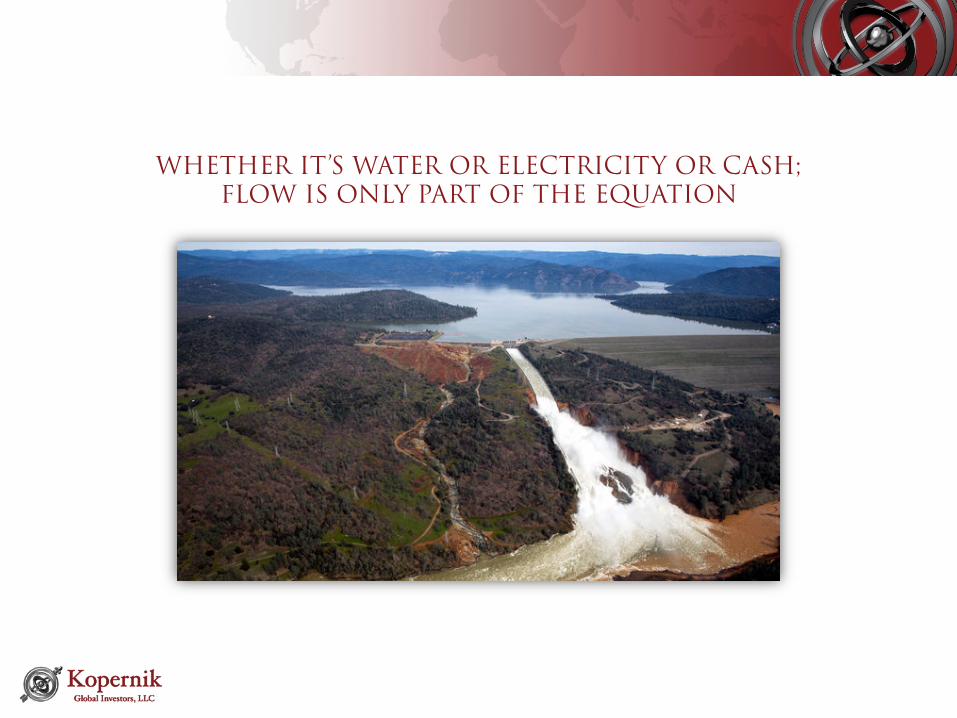
WHETHER IT’S WATER OR ELECTRICITY OR CASH; FLOW IS ONLY PART OF THE EQUATION
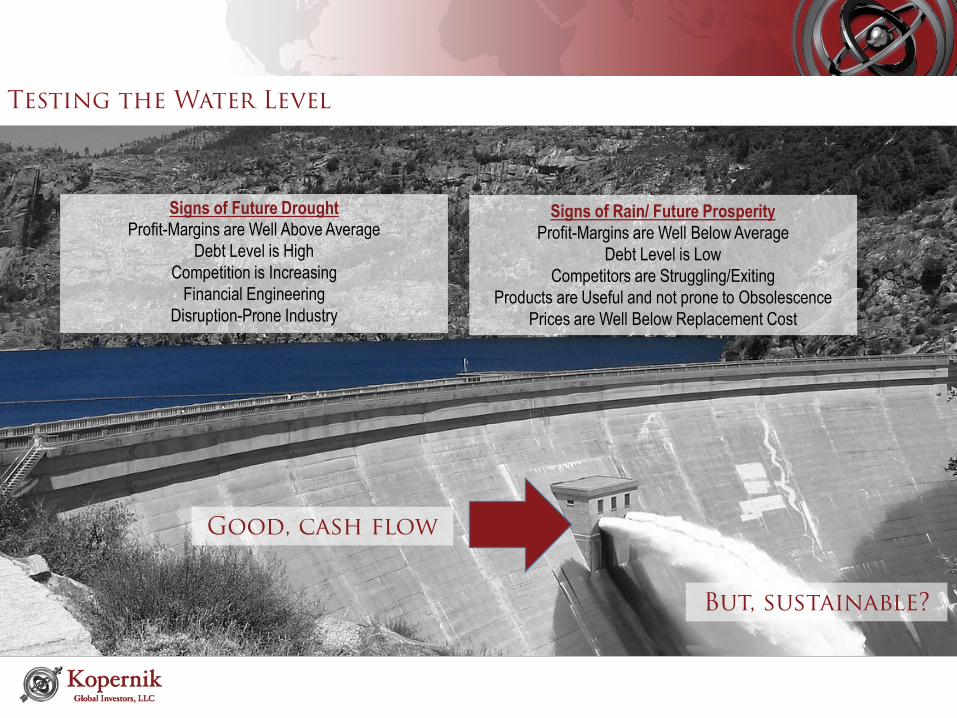
But, sustainable?
Signs of Future DroughtProfit-Margins are Well Above Average
Debt Level is HighCompetition is Increasing
Financial EngineeringDisruption-Prone Industry
Testing the Water Level
Good, cash flow
Signs of Rain/ Future ProsperityProfit-Margins are Well Below Average
Debt Level is LowCompetitors are Struggling/Exiting
Products are Useful and not prone to ObsolescencePrices are Well Below Replacement Cost
Graham & Dodd
THE CONTEMPORARY VIEW
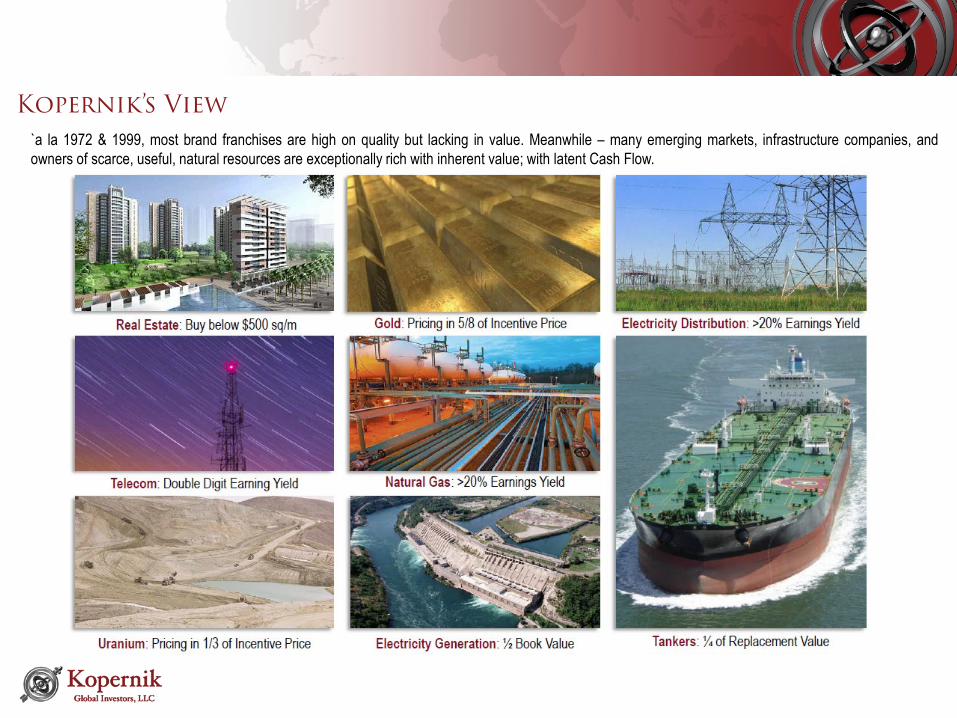
`a la 1972 & 1999, most brand franchises are high on quality but lacking in value. Meanwhile – many emerging markets, infrastructure companies, andowners of scarce, useful, natural resources are exceptionally rich with inherent value; with latent Cash Flow.
Kopernik’s View
27
0
5
10
15
20
25
30
Comm.Services
Cons.Disc.
Cons.Staples
Energy Financials HealthCare
Industrials Info.Tech.
Materials RealEstate
Utilities
0
10
20
30
40
50
60
Canada Emerging Markets Europe Japan Pacific ex Japan US
Portfolio Region Weights*
Portfolio Sector Weights* Top Ten HoldingsName Country Port Weight %
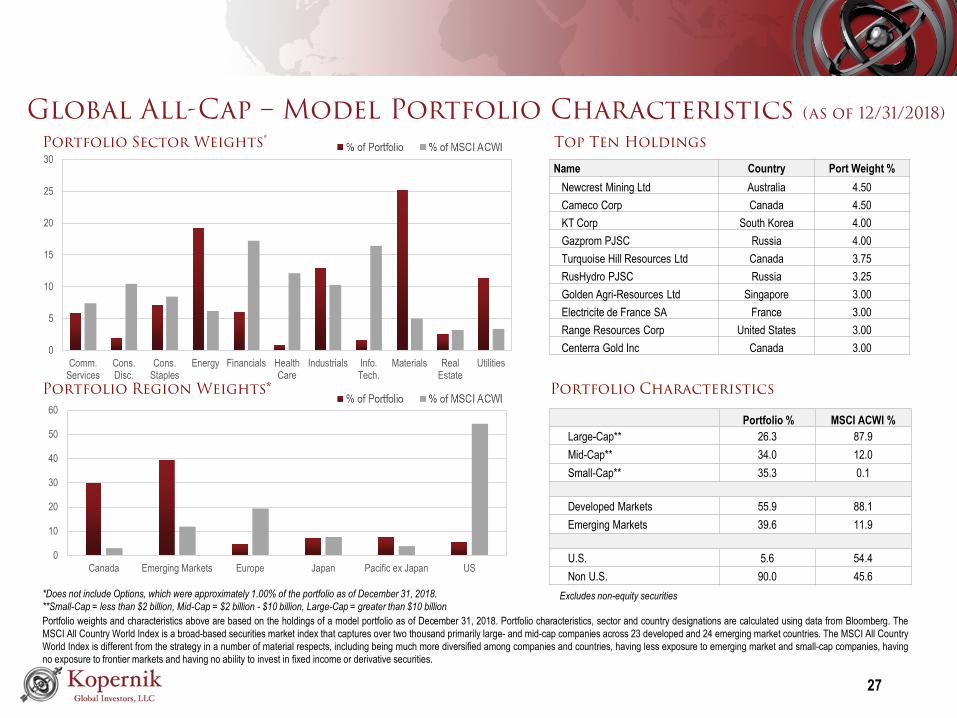
Newcrest Mining Ltd Australia 4.50Cameco Corp Canada 4.50KT Corp South Korea 4.00Gazprom PJSC Russia 4.00Turquoise Hill Resources Ltd Canada 3.75RusHydro PJSC Russia 3.25Golden Agri-Resources Ltd Singapore 3.00Electricite de France SA France 3.00Range Resources Corp United States 3.00Centerra Gold Inc Canada 3.00
Global All-Cap – Model Portfolio Characteristics (as of 12/31/2018)
*Does not include Options, which were approximately 1.00% of the portfolio as of December 31, 2018.**Small-Cap = less than $2 billion, Mid-Cap = $2 billion - $10 billion, Large-Cap = greater than $10 billionPortfolio weights and characteristics above are based on the holdings of a model portfolio as of December 31, 2018. Portfolio characteristics, sector and country designations are calculated using data from Bloomberg. TheMSCI All Country World Index is a broad-based securities market index that captures over two thousand primarily large- and mid-cap companies across 23 developed and 24 emerging market countries. The MSCI All CountryWorld Index is different from the strategy in a number of material respects, including being much more diversified among companies and countries, having less exposure to emerging market and small-cap companies, havingno exposure to frontier markets and having no ability to invest in fixed income or derivative securities.
Portfolio % MSCI ACWI %Large-Cap** 26.3 87.9Mid-Cap** 34.0 12.0Small-Cap** 35.3 0.1
Developed Markets 55.9 88.1Emerging Markets 39.6 11.9
U.S. 5.6 54.4Non U.S. 90.0 45.6
Portfolio Characteristics
Excludes non-equity securities
28
0
5
10
15
20
25
30
Comm.Services
Cons.Disc.
Cons.Staples
Energy Financials HealthCare
Industrials Info.Tech.
Materials RealEstate
Utilities
0
10
20
30
40
50
Canada Emerging Markets Europe Japan Pacific ex Japan US
Portfolio Region Weights*
Portfolio Sector Weights* Top Ten HoldingsName Country Port Weight %
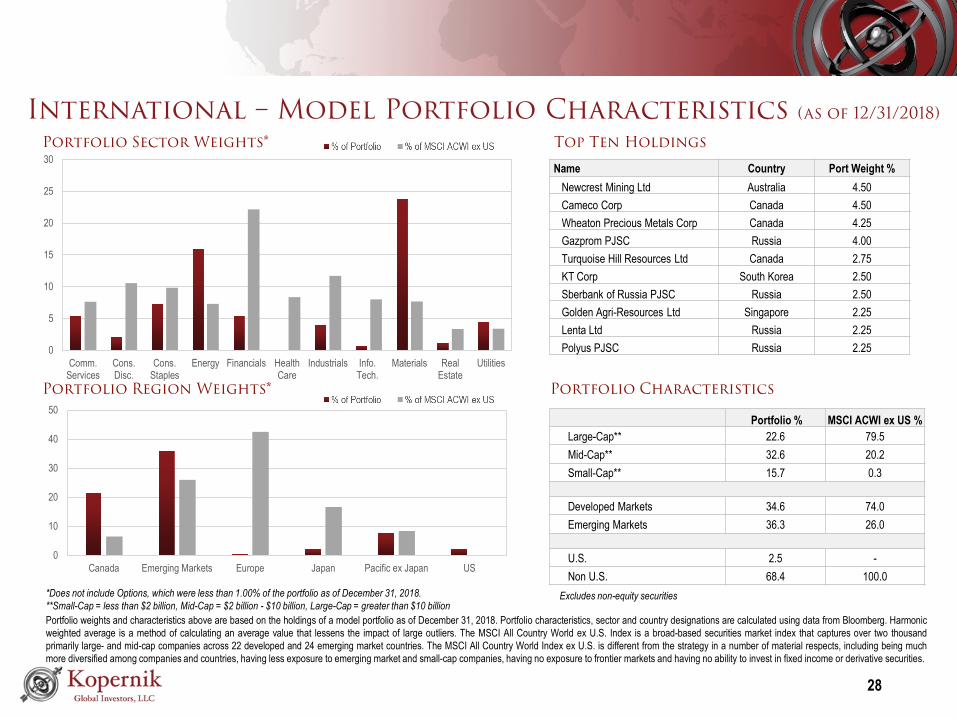
Newcrest Mining Ltd Australia 4.50Cameco Corp Canada 4.50Wheaton Precious Metals Corp Canada 4.25Gazprom PJSC Russia 4.00Turquoise Hill Resources Ltd Canada 2.75KT Corp South Korea 2.50Sberbank of Russia PJSC Russia 2.50Golden Agri-Resources Ltd Singapore 2.25Lenta Ltd Russia 2.25Polyus PJSC Russia 2.25
International – Model Portfolio Characteristics (as of 12/31/2018)
*Does not include Options, which were less than 1.00% of the portfolio as of December 31, 2018.**Small-Cap = less than $2 billion, Mid-Cap = $2 billion - $10 billion, Large-Cap = greater than $10 billionPortfolio weights and characteristics above are based on the holdings of a model portfolio as of December 31, 2018. Portfolio characteristics, sector and country designations are calculated using data from Bloomberg. Harmonicweighted average is a method of calculating an average value that lessens the impact of large outliers. The MSCI All Country World ex U.S. Index is a broad-based securities market index that captures over two thousandprimarily large- and mid-cap companies across 22 developed and 24 emerging market countries. The MSCI All Country World Index ex U.S. is different from the strategy in a number of material respects, including being muchmore diversified among companies and countries, having less exposure to emerging market and small-cap companies, having no exposure to frontier markets and having no ability to invest in fixed income or derivative securities.
Portfolio % MSCI ACWI ex US %Large-Cap** 22.6 79.5Mid-Cap** 32.6 20.2Small-Cap** 15.7 0.3
Developed Markets 34.6 74.0Emerging Markets 36.3 26.0
U.S. 2.5 -Non U.S. 68.4 100.0
Portfolio Characteristics
Excludes non-equity securities
29
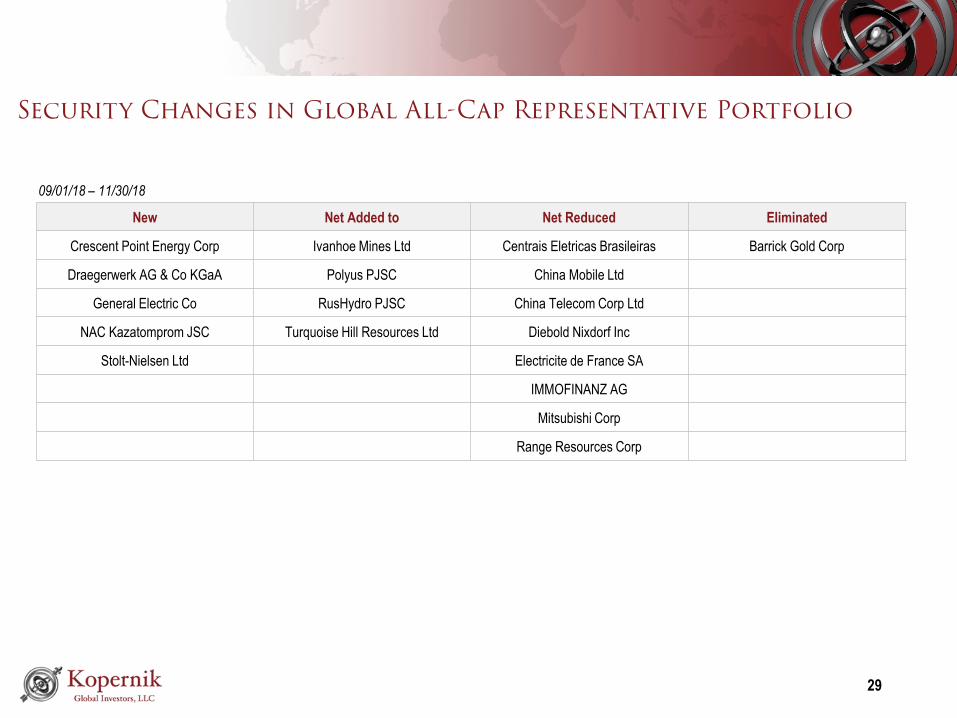
New Net Added to Net Reduced Eliminated
Crescent Point Energy Corp Ivanhoe Mines Ltd Centrais Eletricas Brasileiras Barrick Gold Corp
Draegerwerk AG & Co KGaA Polyus PJSC China Mobile Ltd
General Electric Co RusHydro PJSC China Telecom Corp Ltd
NAC Kazatomprom JSC Turquoise Hill Resources Ltd Diebold Nixdorf Inc
Stolt-Nielsen Ltd Electricite de France SA
IMMOFINANZ AG
Mitsubishi Corp
Range Resources Corp
Security Changes in Global All-Cap Representative Portfolio
09/01/18 – 11/30/18
30
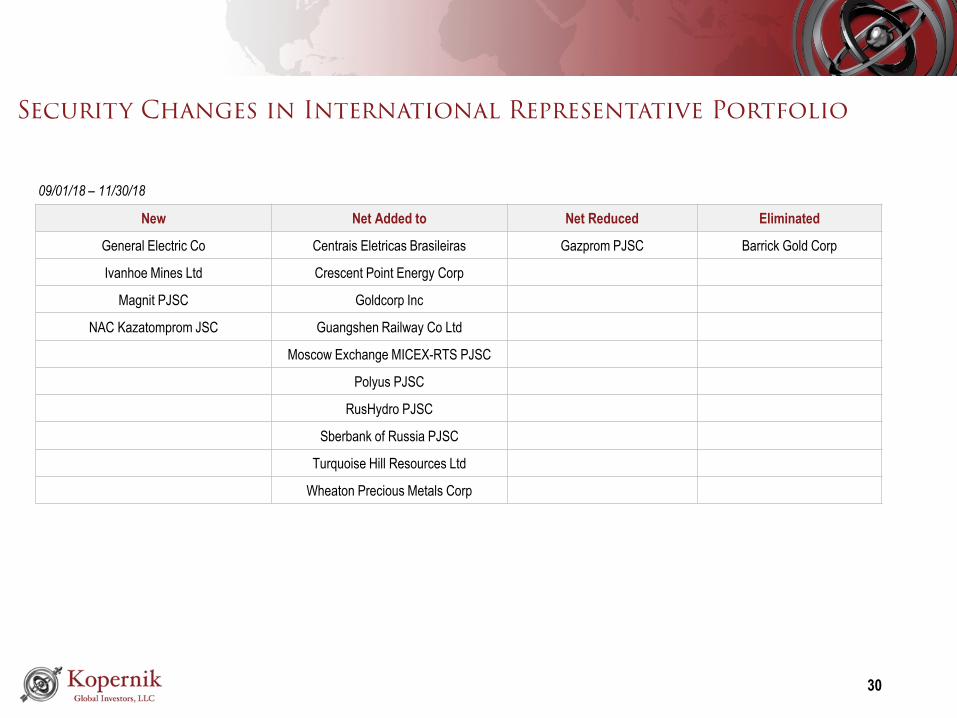
Security Changes in International Representative Portfolio
09/01/18 – 11/30/18
New Net Added to Net Reduced Eliminated
General Electric Co Centrais Eletricas Brasileiras Gazprom PJSC Barrick Gold Corp
Ivanhoe Mines Ltd Crescent Point Energy Corp
Magnit PJSC Goldcorp Inc
NAC Kazatomprom JSC Guangshen Railway Co Ltd
Moscow Exchange MICEX-RTS PJSC
Polyus PJSC
RusHydro PJSC
Sberbank of Russia PJSC
Turquoise Hill Resources Ltd
Wheaton Precious Metals Corp
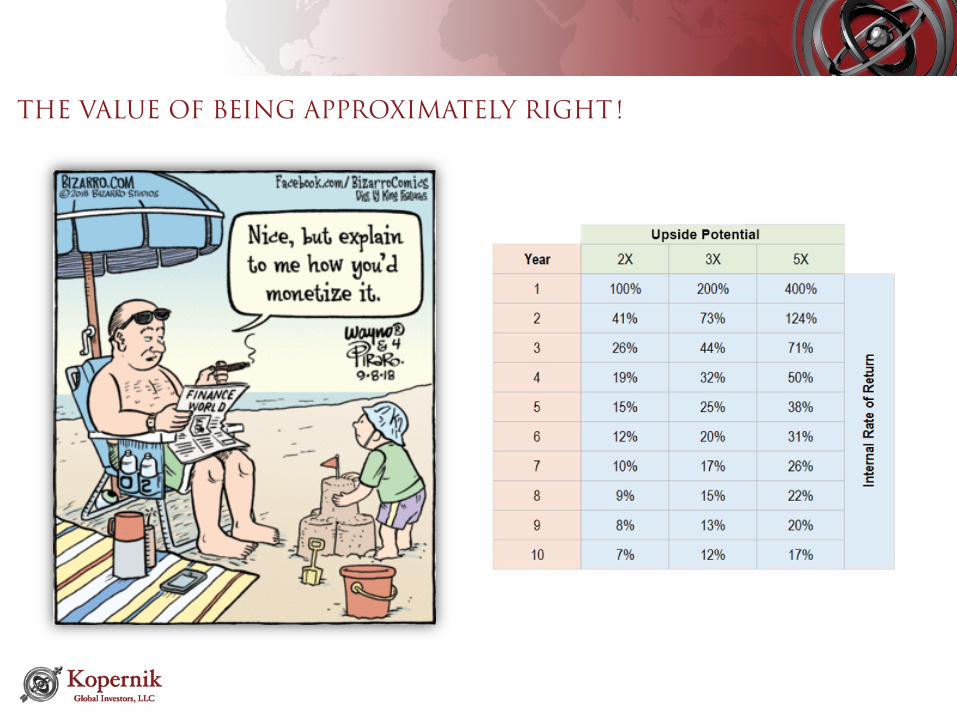
THE VALUE OF BEING APPROXIMATELY RIGHT!
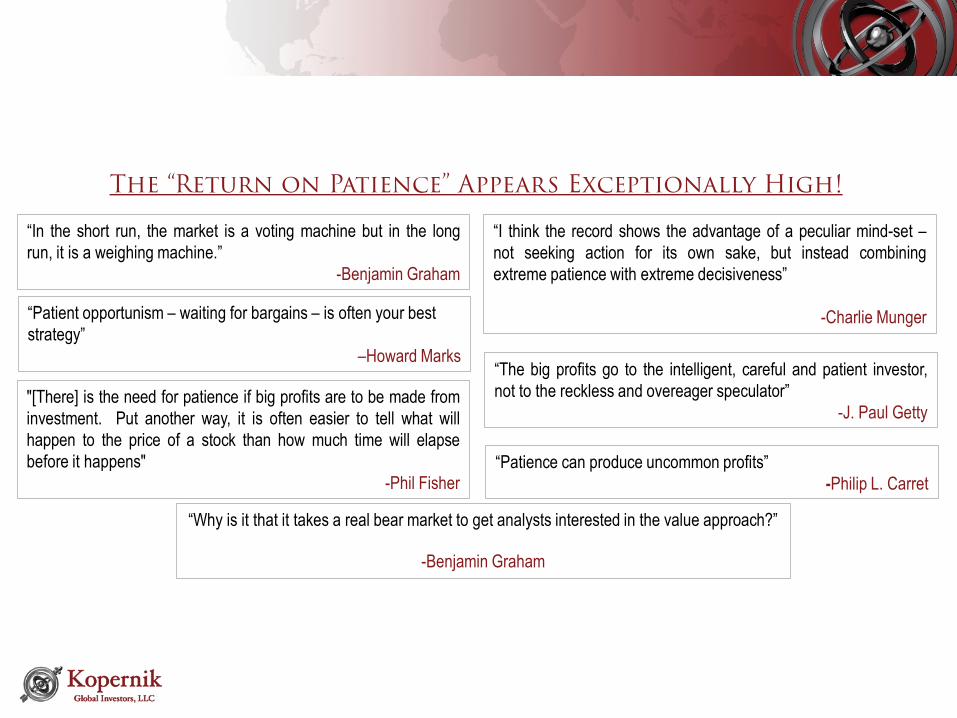
The “Return on Patience” Appears Exceptionally High!
“Why is it that it takes a real bear market to get analysts interested in the value approach?”
-Benjamin Graham
“In the short run, the market is a voting machine but in the longrun, it is a weighing machine.”
-Benjamin Graham
“Patient opportunism – waiting for bargains – is often your best strategy”
–Howard Marks
“I think the record shows the advantage of a peculiar mind-set –not seeking action for its own sake, but instead combiningextreme patience with extreme decisiveness”
-Charlie Munger
“Patience can produce uncommon profits” -Philip L. Carret
“The big profits go to the intelligent, careful and patient investor,not to the reckless and overeager speculator”
-J. Paul Getty"[There] is the need for patience if big profits are to be made frominvestment. Put another way, it is often easier to tell what willhappen to the price of a stock than how much time will elapsebefore it happens"
-Phil Fisher
THANK YOUQ&A Session
The information presented herein is proprietary to Kopernik Global Investors, LLC. This material is approved for a presentation to authorized individuals only and, accordingly, thismaterial is not to be reproduced in whole or in part or used for any purpose except as authorized by Kopernik Global Investors, LLC.
Please consider all risks carefully before investing. The investment strategies managed by Kopernik are subject to certain risks such as market, investment style, interest rate,deflation, and illiquidity risk. Investments in small and mid-capitalization companies also involve greater risk and portfolio price volatility than investments in larger capitalizationstocks. Investing in non-U.S. markets, including emerging and frontier markets, involves certain additional risks, including potential currency fluctuations and controls, restrictionson foreign investments, less governmental supervision and regulation, less liquidity, less disclosure, and the potential for market volatility, expropriation, confiscatory taxation, andsocial, economic and political instability. Investments in energy and natural resources companies are especially affected by developments in the commodities markets, the supplyof and demand for specific resources, raw materials, products and services, the price of oil and gas, exploration and production spending, government regulation, economicconditions, international political developments, energy conservation efforts and the success of exploration projects. There can be no assurances that investment objectives willbe achieved.
Kopernik Global Investors, LLC is an investment adviser registered under the Investment Advisers Act of 1940, as amended.
This document, as of January 2019 is descriptive of how the Kopernik team manages the investment strategies offered by Kopernik. There is no guarantee that any strategy’sinvestment performance objectives will be achieved. This profile is not legally binding on Kopernik Global Investors, LLC or its affiliates.
© 2019 Kopernik Global Investors, LLC | Two Harbour Place | 302 Knights Run Avenue Suite 1225 | Tampa, Florida 33602 | 813.314.6100 | www.kopernikglobal.com
Important Information
34