Embed Size (px)
Citation preview
Kopeopeo Canal Remediation Project
Discharge Water Quality from the Kopeopeo Canal Containment Sites Bay of Plenty Regional Council
Kopeopeo Canal Remediation Project
Discharge Water
Quality from the
Kopeopeo Canal
Containment Sites
Bay of Plenty Regional Council
© Opus International Consultants Ltd 2016
Prepared By Opus International Consultants Ltd
James Gladwin Whakatane Office
Environmental Scientist Level 1, Opus House, 13 Louvain Street
PO Box 800, Whakatane 3158
New Zealand
Reviewed By Telephone: +64 7 308 0139
Peter Askey Facsimile: +64 7 308 4757
Principal Environmental Engineer
Date: April 2016
Reference: 2-34210.02/500WK
Status: Final
Approved for
Release By
Brendon Love
Project Manager Kopeopeo Canal Remediation
Kopeopeo Canal - Discharge Water Quality from the Kopeopeo Canal Containment Sites i
2-34210.02/500WK | April 2016 Opus International Consultants Ltd
Glossary
BOPRC Bay of Plenty Regional Council
Dewatering The removal of water from canal sediments.
Dioxin A group of chemically-related compounds that are persistent organic pollutants (POPs). They are found throughout the world in the environment and they accumulate in the food chain, mainly in the fatty tissue of animals and are highly toxic. They are associated with sawmill contamination due to their presence as a by-product in the historically used timber preservative pentachlorophenol.
Dredging Removal of sediment from the bottom of the canal.
Filtrate Water discharged as a result of the dewatering process.
HDPE High-density polyethylene
I-TEQ Upper International Toxic Equivalency Upper: Maximum theoretical level for dioxin in any given sample. Records dioxins and furans only.
Lowest observed adverse effects level (LOAEL)
The lowest dose or concentration of a toxicant that causes a significant increase in the frequency or severity of an adverse effect when compared to the frequency or severity of the same effect in an unexposed control population.
No observed adverse effects level (NOAEL)
The highest dose or concentration level of a toxicant at which the incidence of a toxic effect was not significantly different from the untreated group (from a statistical and biological assessment). The NOAEL will depend on the sensitivity of the methods used, the sizes of the exposed groups and the differences between estimated exposures or doses. The NOAEL is an observed value that does not take into account the nature or steepness of the dose.
NTU Nephelometric Turbidity Units
pg/L Picogram (10-12) per litre
Turbidity The measure of water clarity i.e. how much the material suspended in water decreases the passage of light through the water.
WHO-TEQ Upper World Health Organisation Toxic Equivalency Upper: Maximum theoretical level for dioxin in any given sample. Records dioxins, furans and PCBs.
Kopeopeo Canal - Discharge Water Quality from the Kopeopeo Canal Containment Sites ii
2-34210.02/500WK | April 2016 Opus International Consultants Ltd
Contents
Glossary ...................................................................................................................... i
1 Introduction ....................................................................................................... 1
2 Scope of Work .................................................................................................... 1
3 Current Methodology ......................................................................................... 1
4 Proposed Methodology ....................................................................................... 2
5 Discussion .......................................................................................................... 3 5.1 Mixing Zones ..................................................................................................................... 3 5.2 Sediment Stability ............................................................................................................. 3
5.3 Methodology Comparison ................................................................................................. 4 5.4 Potential Contaminant Standards .................................................................................... 5 5.5 Trial Data .......................................................................................................................... 6
6 Summary............................................................................................................ 8
7 References ....................................................................................................... 10
8 Appendix 1 - Conceptual design of the containment sites .................................. 11
9 Appendix 1 – Calculations for TEQfish .............................................................. 15
Table 1: Comparison of potential effects associated with the two methods ....................................... 4 Table 2 - Comparison of WHO-TEFs and TEFfish from the CSQGs ..................................................... 5 Table 3 - Summary of filtrate results during the Kopeopeo Dredge Trial ........................................... 6
Kopeopeo Canal - Discharge Water Quality from the Kopeopeo Canal Containment Sites 1
2-34210.02/500WK | April 2016 Opus International Consultants Ltd
1 Introduction
The remediation of the Kopeopeo Canal involves the removal and treatment of dioxin contaminated
sediment from a 5km stretch the Kopeopeo Canal near Whakatane. SKM, ESR and ToxConsult
completed a series of risk assessment reports that were submitted in support of the Assessment of
Effects (AEEs) as part of the original consent application. These assessments concluded that 60pg/g
was a suitable target post remediation for sediments in the canal for the purpose of protecting of
human health. This level was set as a condition in consent 67173. The consented level now forms
the baseline against which the proposed methodology is assessed. A further assessment completed
by Wildlands assessed the remediation methodology and made comment on its effects on ecology.
The currently consented methodology involves the dewatering of sections of the Kopeopeo Canal and
excavating the dioxin contaminated sediment. This is followed by the use of geotextile containment
cells at three locations where the sediment is further dewatered and bioremediated to break down
dioxins into their non-toxic components. The current consent allows for filtrate from these
containment sites along with rainwater to seep through the containment site into groundwater. A
new methodology has been proposed that would utilise dredging sediment from the canal, pumping
the slurry along a pipeline to the containment sites where it is treated and contained within geotextile
bags (geobags) within an impermeable HDPE lined containment cell. The treated water and rainfall
that collects within the containment area is then is then returned into the Kopeopeo Canal.
Two distinct phases of discharge is proposed under the new methodology. Phase 1, the treatment
phase will occur during active dredging when a high volume of dredged and treated canal water is
returned to the canal. During this phase control measures will be in place within the canal that will
limit the migration of any particulate within the canal. Phase 2 occurs following the dredging phase
when residual water and rainfall is discharge back into the canal. During this phase the discharge is
lower in volume but will continue for a number of years.
2 Scope of Work
Bay of Plenty Regional Council (BOPRC) have requested that Opus International Consultants
review the consented and proposed methodologies with specific regard to discharging filtrate back
into the Kopeopeo Canal and not to groundwater.
3 Current Methodology
The current consented methodology involves the dewatering and excavation of the dioxin
contaminated sediment from the canal. This is followed by the use of geotextile containment cells at
three locations where the sediment is further dewatered and bioremediated to break down dioxins
into their non-toxic components. The current consent allows for filtrate from these containment
sites along with rainwater to seep through the containment site into groundwater.
Jacobs (2016) note that “three containment sites are proposed, these are referred to as CS1, CS2
and CS3. The current containment cell design at the containment sites consists of a large bunded
cell, which is divided into sub-cells by the use of internal bunds. Each sub-cell is lined with a
permeable geotextile fabric which is designed to act as a filter and prevent all but the finest
colloidal material from leaving the cell. Excavated sludge is placed directly in the cells, and is
allowed to drain naturally through the base of the cells.
Kopeopeo Canal - Discharge Water Quality from the Kopeopeo Canal Containment Sites 2
2-34210.02/500WK | April 2016 Opus International Consultants Ltd
Once dewatered, the sediment is inoculated with fungi, trees are planted and the bioremediation
process commences” (Baker, 2016).
4 Proposed Methodology
The proposed methodology will use dredging technology to suck contaminated sediment from the
canal bed under water, material is then pumped through a treatment plant where it is dosed with
flocculant and coagulant before it is piped into geotubes. This process causes the fine sediments to
bind together and be trapped within the geofabric of the geotubes which have pores that are 180
microns. Water is able to pass through the geofabric for return to the canal and not soaked back
into groundwater.
Jacobs (2016) note that “the revised construction methodology [for the containment sites] is
fundamentally different from the original design. The key difference is that the containment cells
are lined with an impermeable High Density Polyethylene (HDPE) liner (of approximately 1.5
mm thickness). The sediment removed from the canal will be dewatered in geotubes within the
lined containment cells, and the treated water discharged back into the canal” (Baker, 2016).
“Once dewatered, the sediment is inoculated with fungi, trees are planted and the bioremediation
process commences.
HDPE ponds are constructed by rolling out sheets of HDPE into place. The sheets are then hot
edge welded together to form a water tight seal. This form of construction is typically referred to
as wedge or fusion welding. The process creates a double-track weld along the length of
overlapping sheets of HDPE. The cavity between the sheets is then sealed at each end and pumped
with air until it reaches the test pressure. If the air pressure holds without dropping more than
the allowable percentage over a set period of time, the seam is considered compliant” (Baker,
2016).
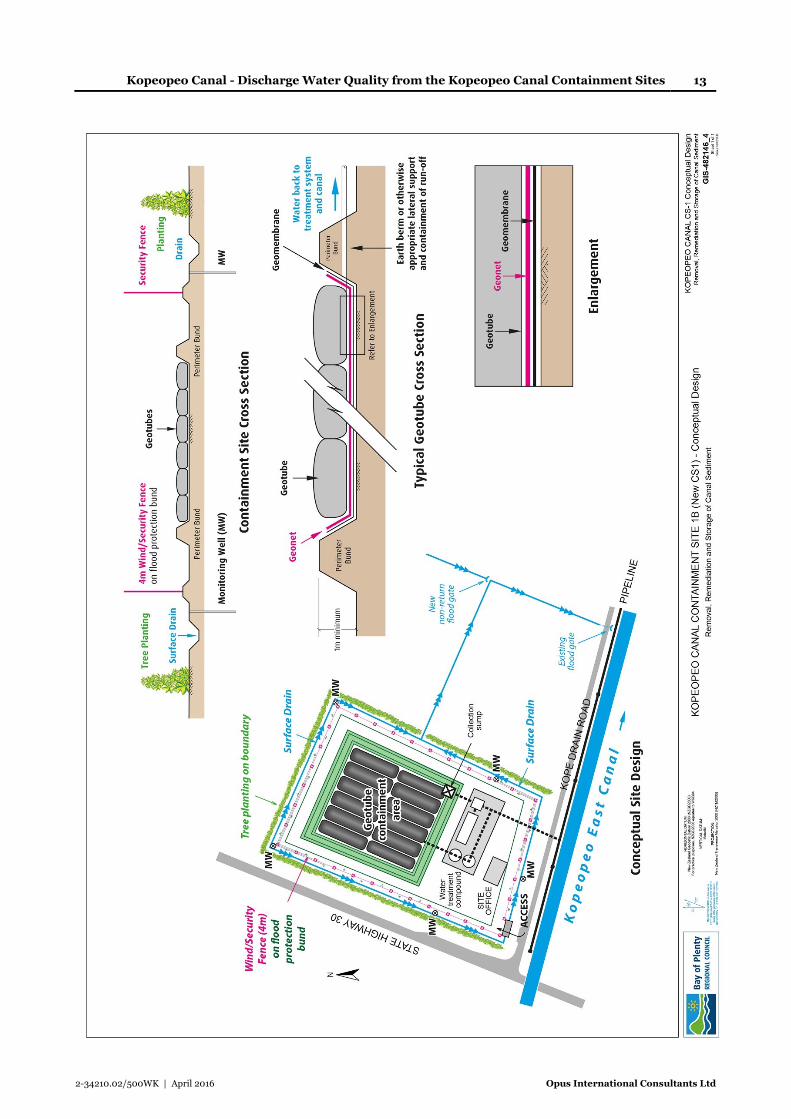
A conceptual design of the containment bunds has been provided in Appendix 1.
Kopeopeo Canal - Discharge Water Quality from the Kopeopeo Canal Containment Sites 3
2-34210.02/500WK | April 2016 Opus International Consultants Ltd
5 Discussion
5.1 Mixing Zones
ANZECC (2000) provides guidance on mixing zones and in Volume 2 Appendix 1 notes:
“Mixing zones are generally designated to manage the controlled discharge of soluble, non
bioaccumulatory toxicants whose impacts on local biota are primarily related to their
concentration. The use of mixing zones is not appropriate for managing the discharge of
nutrients, bio-accumulatory or particulate substances.” (ANZECC, 2000)
As dioxins bioaccumulate and are bound to particulates the use of a mixing zone is not considered
suitable and the concentrations of dioxins being returned to the canal should therefore be
minimised at source.
5.2 Sediment Stability
SKM (2008) note that “sediment in the canal consists of mainly unconsolidated silts of median
diameter of 10 μm which can easily be put in suspension by current velocity of more than 0.01
m/s. Dioxin molecules tend to have a higher affinity to smaller sediment particles of 75um or less.
The flood tide velocity is an order of magnitude in excess of the estimated critical erosion velocity
of the fine silt particles that hold the highest concentration of dioxin. Significant sediment (hence
dioxin) transport in suspension during tidal movements was observed and is expected on every
tidal cycle. Sediment movement will be enhanced by stormwater floods.
“MIKE 11 simulations show that a net migration of bed surface dioxin concentration seaward
occurs over time. This may cause relatively rapid dioxin dilution of dioxin concentrations within
the sediment of the canal bed. MIKE11 simulations indicate that any recontamination is likely to
be temporal during tidal movements as the fine particles are unlikely to settle for long”
(Robotham, Jayaratne, & Chin, 2008).
This indicates that particulates within the filtrate discharge are also likely to be highly mobile
within the receiving environment. Any particulates that are returned into the canal from the
filtrate are likely to move with tides, be push seaward with time and dispersed within the aquatic
environment. Control measures such as silt curtains and sheet pile will help minimise this.
Kopeopeo Canal - Discharge Water Quality from the Kopeopeo Canal Containment Sites 4
2-34210.02/500WK | April 2016 Opus International Consultants Ltd
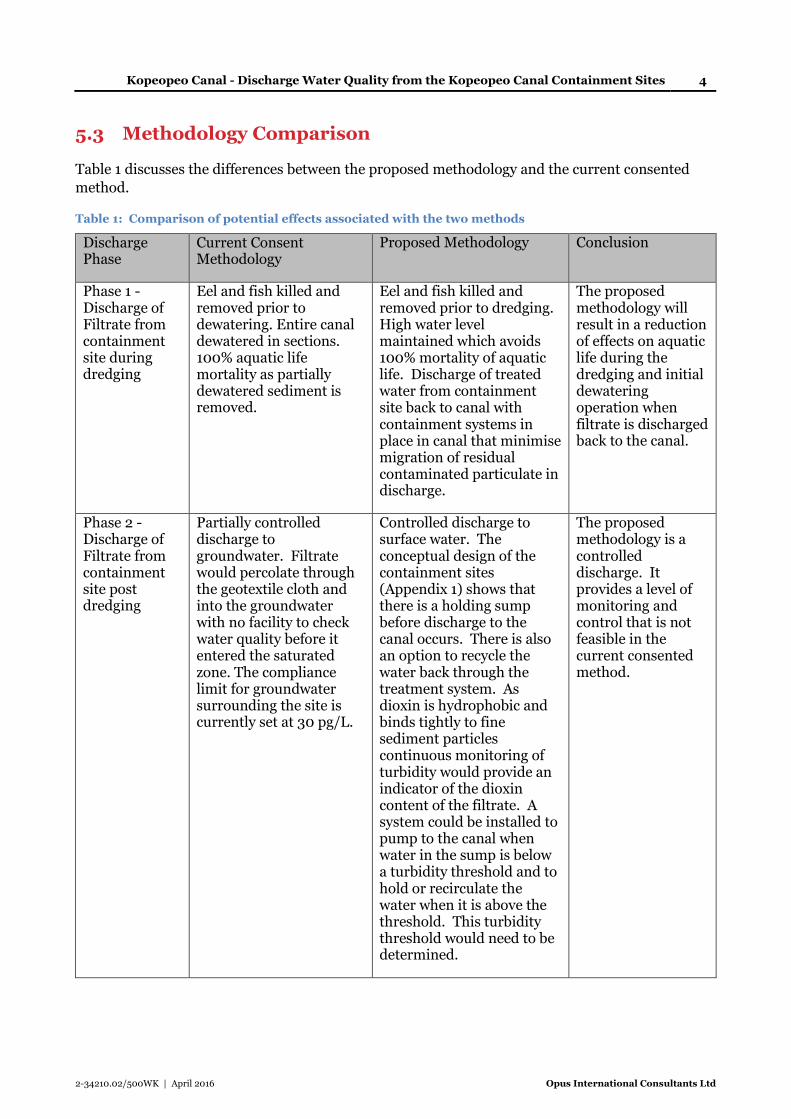
5.3 Methodology Comparison
Table 1 discusses the differences between the proposed methodology and the current consented
method.
Table 1: Comparison of potential effects associated with the two methods
Discharge Phase
Current Consent Methodology
Proposed Methodology Conclusion
Phase 1 - Discharge of Filtrate from containment site during dredging
Eel and fish killed and removed prior to dewatering. Entire canal dewatered in sections. 100% aquatic life mortality as partially dewatered sediment is removed.
Eel and fish killed and removed prior to dredging. High water level maintained which avoids 100% mortality of aquatic life. Discharge of treated water from containment site back to canal with containment systems in place in canal that minimise migration of residual contaminated particulate in discharge.
The proposed methodology will result in a reduction of effects on aquatic life during the dredging and initial dewatering operation when filtrate is discharged back to the canal.
Phase 2 - Discharge of Filtrate from containment site post dredging
Partially controlled discharge to groundwater. Filtrate would percolate through the geotextile cloth and into the groundwater with no facility to check water quality before it entered the saturated zone. The compliance limit for groundwater surrounding the site is currently set at 30 pg/L.
Controlled discharge to surface water. The conceptual design of the containment sites (Appendix 1) shows that there is a holding sump before discharge to the canal occurs. There is also an option to recycle the water back through the treatment system. As dioxin is hydrophobic and binds tightly to fine sediment particles continuous monitoring of turbidity would provide an indicator of the dioxin content of the filtrate. A system could be installed to pump to the canal when water in the sump is below a turbidity threshold and to hold or recirculate the water when it is above the threshold. This turbidity threshold would need to be determined.
The proposed methodology is a controlled discharge. It provides a level of monitoring and control that is not feasible in the current consented method.
Kopeopeo Canal - Discharge Water Quality from the Kopeopeo Canal Containment Sites 5
2-34210.02/500WK | April 2016 Opus International Consultants Ltd
5.4 Potential Contaminant Standards
This section outlines the ecotoxic contaminant standards that have been identified. Research
indicates that there are few contaminants standards for dioxins that consider the effect on the
aquatic environment as most are predominately human health related. ANZECC Guidelines have
no dioxin trigger levels for sediment (Volume 1, Chapter 3, Table 3.5.1) and have determined that
there is “insufficient data to derive a reliable trigger value” in water (Volume 1, Chapter 3, Table
3.4.1) (ANZECC, 2000).
The Canadian Sediment Quality Guidelines have been developed by the CCME (Canadian Council
of Ministers of the Environment) (2001). The Canadian Sediment Quality Guidelines were
developed for the Protection of Aquatic Life from a variety of contaminants including
Polychlorinated Dibenzo-p-Dioxins and Polychlorinated Dibenzofurans (PCDD/Fs). Chemical and
biological data was evaluated from numerous studies to establish a link between concentrations
measured in the sediment. Two assessment values are calculated, the lower threshold effect level
(TEL) and the higher probable effect level (PEL). TEL represents the concentration below which
adverse biological effects (mortality, reproductive success and growth issues) are expected to occur
rarely (<25% of the adverse effects occur below the TEL). PEL defines the level above which
adverse effects are expected to occur frequently (50% of the adverse effects occur above the PEL).
The range between the TEL and PEL is known as the possible effect range with 25% to 50% of
adverse effects occurring. The TEL and PEL for dioxin is 0.85 pg/g and 21.5 pg/g respectively
(Canadian Council of Ministers of the Environment, 2001).
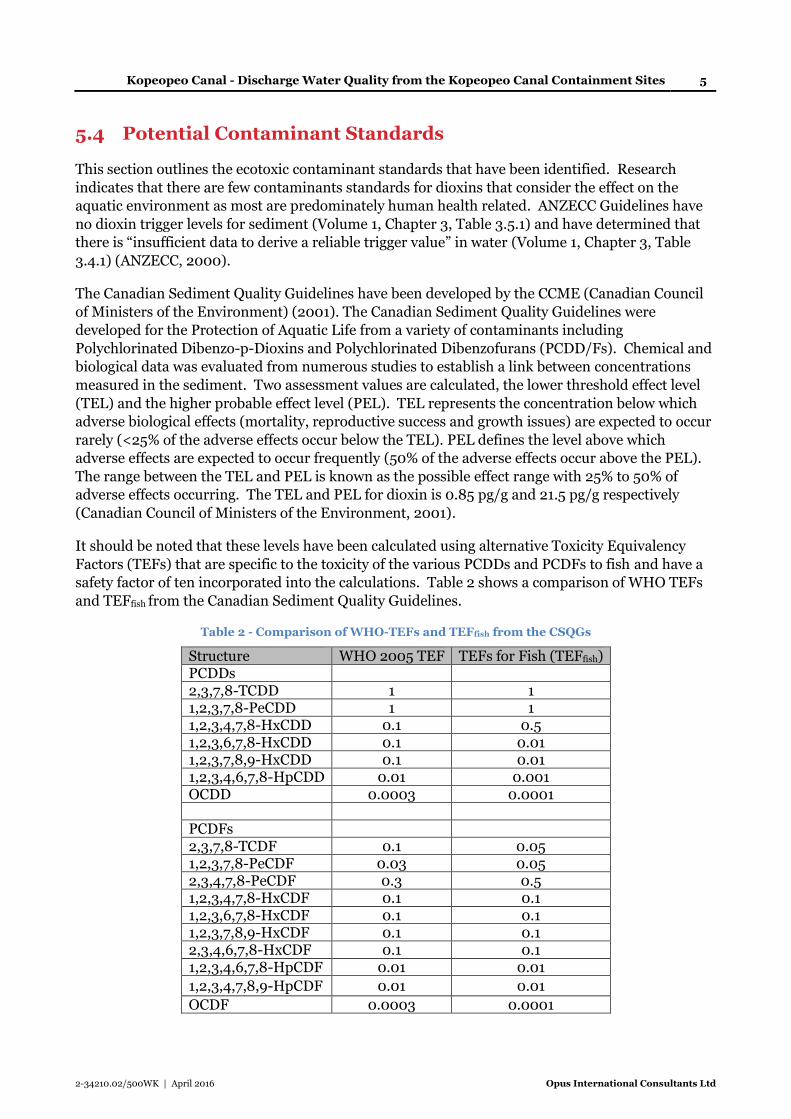
It should be noted that these levels have been calculated using alternative Toxicity Equivalency
Factors (TEFs) that are specific to the toxicity of the various PCDDs and PCDFs to fish and have a
safety factor of ten incorporated into the calculations. Table 2 shows a comparison of WHO TEFs
and TEFfish from the Canadian Sediment Quality Guidelines.
Table 2 - Comparison of WHO-TEFs and TEFfish from the CSQGs
Structure WHO 2005 TEF TEFs for Fish (TEFfish) PCDDs 2,3,7,8-TCDD 1 1 1,2,3,7,8-PeCDD 1 1 1,2,3,4,7,8-HxCDD 0.1 0.5 1,2,3,6,7,8-HxCDD 0.1 0.01 1,2,3,7,8,9-HxCDD 0.1 0.01 1,2,3,4,6,7,8-HpCDD 0.01 0.001 OCDD 0.0003 0.0001 PCDFs 2,3,7,8-TCDF 0.1 0.05 1,2,3,7,8-PeCDF 0.03 0.05 2,3,4,7,8-PeCDF 0.3 0.5 1,2,3,4,7,8-HxCDF 0.1 0.1 1,2,3,6,7,8-HxCDF 0.1 0.1 1,2,3,7,8,9-HxCDF 0.1 0.1 2,3,4,6,7,8-HxCDF 0.1 0.1 1,2,3,4,6,7,8-HpCDF 0.01 0.01
1,2,3,4,7,8,9-HpCDF 0.01 0.01
OCDF 0.0003 0.0001
Kopeopeo Canal - Discharge Water Quality from the Kopeopeo Canal Containment Sites 6
2-34210.02/500WK | April 2016 Opus International Consultants Ltd
This indicates that toxic effects of dioxins on fish are mostly more acute than in humans and
mammals for which WHO TEFs are based on. The TEFfish needs to be applied to existing data from
the Kopeopeo Remediation Project so that a direct comparison can be completed. This has been
completed in section 5.5.
A recommendation was made to the UK National Rivers Authority (precursor of the Environment
Agency) by Grimwood and Dobbs (1995) on the protection of ecosystem receptors from dioxins
(threshold for pollution control and remediation activities). A guideline value of 11 to 38pg/L was
made and appears to have been based on an aquatic toxicity study of 2,3,7,8-tetrachlorodibenzo-p-
dioxin (or for mixtures of congeners expressed as 2,3,7,8-TCDD equivalents). The levels
corresponds to the no observed effect concentration/lowest-observed effect concentration
determined for mortality, growth, and behavioural effects seen in rainbow trout early life stages.
The trout were exposed to 2,3,7,8-TCDD in a flow-through system over a 28-day period, followed
by 28 days of no exposure (Grimwood & Dobbs, 1995; Buckley-Golder, 1999).
Table 2.1 from ‘Technical Report 11 - Ecological risk assessment of dioxins in Australia’ indicates a
study that shows 1.1pg/L is NOAEL and 38pg/L is LOAEL (45% Mortality) for Rainbow Trout swim
up fry with a 28 day exposure and 28 day observation period (Gatehouse, 2004). This information
was sourced from the USEPA (1993) ‘Interim report on data and methods for assessment of
2,3,7,8-tetrachlorodibenzo-p-dioxin risk to aquatic life and associated wildlife’ which accredits the
study to Mehrle et al (1988) ‘Toxicity and bioconcentration of 2,3,7,8-tetrachlorodibenzo-p-dioxin
and 2,3,7,8-tetrachlorodibenzofuran in rainbow trout’ (US EPA, 1993).
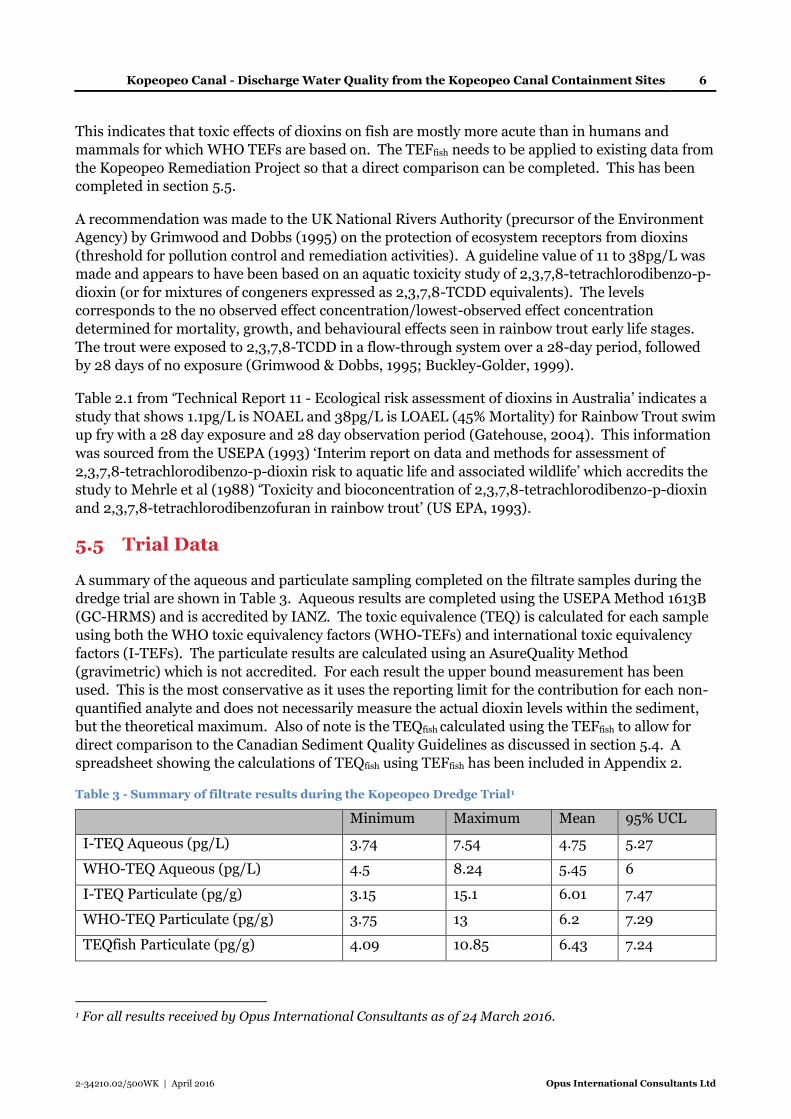
5.5 Trial Data
A summary of the aqueous and particulate sampling completed on the filtrate samples during the
dredge trial are shown in Table 3. Aqueous results are completed using the USEPA Method 1613B
(GC-HRMS) and is accredited by IANZ. The toxic equivalence (TEQ) is calculated for each sample
using both the WHO toxic equivalency factors (WHO-TEFs) and international toxic equivalency
factors (I-TEFs). The particulate results are calculated using an AsureQuality Method
(gravimetric) which is not accredited. For each result the upper bound measurement has been
used. This is the most conservative as it uses the reporting limit for the contribution for each non-
quantified analyte and does not necessarily measure the actual dioxin levels within the sediment,
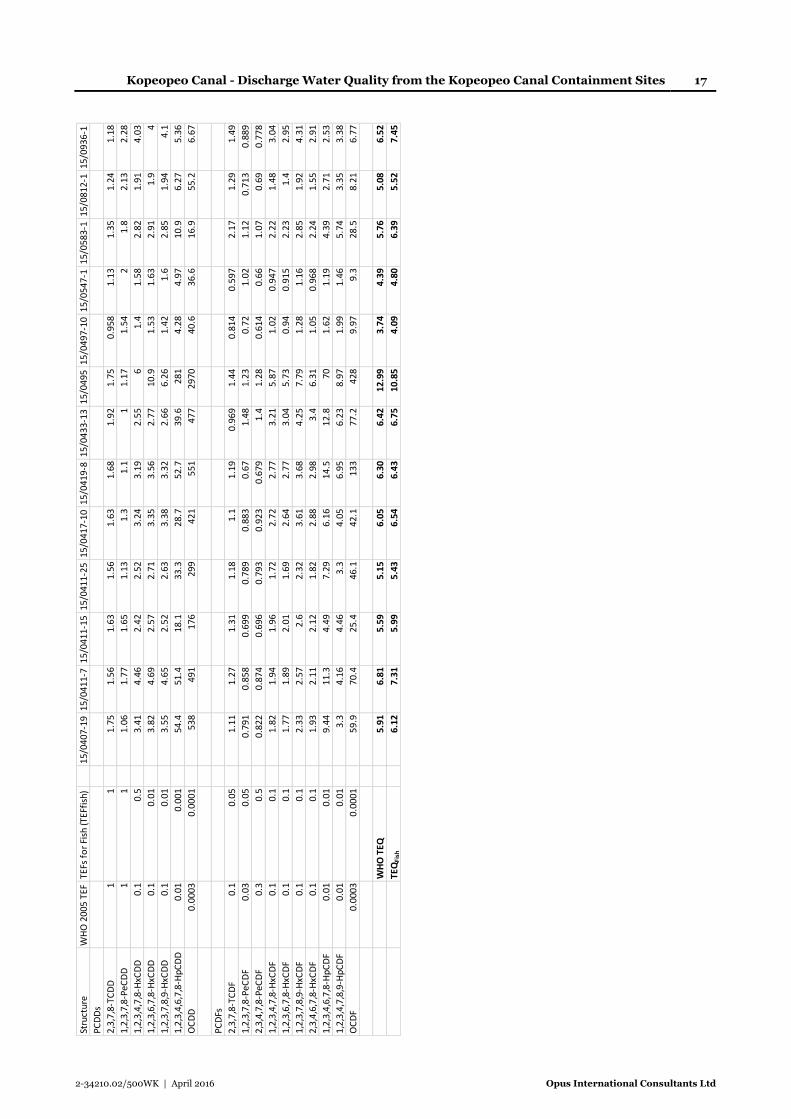
but the theoretical maximum. Also of note is the TEQfish calculated using the TEFfish to allow for
direct comparison to the Canadian Sediment Quality Guidelines as discussed in section 5.4. A
spreadsheet showing the calculations of TEQfish using TEFfish has been included in Appendix 2.
Table 3 - Summary of filtrate results during the Kopeopeo Dredge Trial1
Minimum Maximum Mean 95% UCL
I-TEQ Aqueous (pg/L) 3.74 7.54 4.75 5.27
WHO-TEQ Aqueous (pg/L) 4.5 8.24 5.45 6
I-TEQ Particulate (pg/g) 3.15 15.1 6.01 7.47
WHO-TEQ Particulate (pg/g) 3.75 13 6.2 7.29
TEQfish Particulate (pg/g) 4.09 10.85 6.43 7.24
1 For all results received by Opus International Consultants as of 24 March 2016.
Kopeopeo Canal - Discharge Water Quality from the Kopeopeo Canal Containment Sites 7
2-34210.02/500WK | April 2016 Opus International Consultants Ltd
The trial data in Table 3 shows that the maximum, mean and UCL for the particulate calculations
are all well below the upper limits of the Canadian Sediment Quality Guidelines (PEL of 21.5pg/g).
There is little difference between the I-TEQ, WHO-TEQ and TEQfish. The aqueous results are below
both the Grimwood and Dobbs (1995) guideline values of 11 and 38pg/L and the upper guideline
from Mehrle et all (1988) (38pg/L).
The mean I-TEQ particulate readings are a factor of 1.27 greater than the mean I-TEQ aqueous
readings and the mean WHO-TEQ particulate readings are a factor of 1.13 greater than the mean
WHO-TEQ aqueous readings. If these multiplication factors hold true then this indicates that if the
38pg/L were applied from either the Grimwood and Dobbs (1995) or Mehrle et al (1988) the mean
particulate concentration would be 48.26 pg I-TEQ/g or 42.94 pg WHO-TEQ/g. This is lower than
the consented limit of the canal sediment.
SKM (2008) note that New Zealand background levels are 0.081 to 2.71pg I-TEQ/g, which
although not using TEFfish calculations would likely put background levels within the possible effect
range as defined in the Canadian Sediment Quality Guidelines. The lower guideline TEL value of
0.85 pg/g is therefore not feasible.
The dredge trial shows that there are significant reductions in dioxin contaminants in the filtrate
water compared to the material that was dredged from the canal. Filtrate contained between 3.15
and 15.1 pg ITEQ/g in the particulate phase compared to 110 and 650 pg ITEQ/g in the sediment.
The dioxin levels within the filtrate particulate from the trial are significantly below the consented
remediation target of 60 pg/g.
Kopeopeo Canal - Discharge Water Quality from the Kopeopeo Canal Containment Sites 8
2-34210.02/500WK | April 2016 Opus International Consultants Ltd
6 Summary
ANZECC considers the used of mixing zones for managing the discharge of bio-accumulatory or
particulate substances as “not appropriate”. Any concentrations of dioxins that are returned to the
Kopeopeo canal should therefore be controlled at source.
The current consented methodology has a relatively uncontrolled discharge to groundwater,
meaning that if there was an increase in dioxins coming from the containment sites it would be
difficult to control. The new proposed methodology has a controlled discharge from the
containment sites, the conceptual design of the containment sites (Appendix 1) shows that there is
a holding sump before discharge to the canal. The design also indicates an option to recycle the
water back through the treatment system. As dioxin is hydrophobic and binds tightly to fine
sediment particles continuous monitoring of turbidity could be used as an indicator of the dioxin
content of the filtrate. A system with a turbidity controlled pump could be used to send filtrate to
the canal when water in the sump is below a turbidity threshold and to hold or recirculate the water
when it is above a threshold. The turbidity threshold would need to be determined using field and
laboratory data. Additional sampling (monthly during normal operation) from the outfall would
also need to be completed to check that dioxin levels remain consistent with turbidity levels over
the course of the discharge. It is therefore considered that the proposed methodology provides for
a level of monitoring and control that is not feasible in the current consented method.
The proposed methodology will also result in a reduction of effects on aquatic life during the
dredging and initial dewatering operation when filtrate is discharged back to the canal. This is
because a high water level is maintained which avoids 100% mortality of aquatic life. Discharge of
treated filtrate from containment site back to canal combined with containment systems will
minimise the migration of residual contaminated particulate in discharge.
A level of 60pg/g for the sediment within the Kopeopeo Canal was set as a condition in consent
67173. This consented level forms the baseline against which the proposed methodology is
assessed. Based on the discussions in section 5.5, which compared particulate and aqueous
concentrations, a mean multiplication factor of 1.27 was identified for I-TEQ. This means the
Grimwood and Dobbs (1995) threshold for pollution control and remediation activities of 38pg/L is
likely to have a particulate value in the region of 48pg/g. Any new sediment deposited on the canal
bed from the filtrate using this guideline is therefore likely to be below the consented level of
60pg/g. Based on the mean multiplication factor of 1.27, concentrations in the filtrate would likely
need to be 47.3pg/L or above to exceed the 60pg/g sediment remediation validation limit. Based
on the research undertaken and considering potential effects associated with the existing consent,
cumulative effects of any filtrate discharged from the containment sites at a concentration at or
below 38 pg/L I-TEQ/g is not expected to lead to dioxin concentrations increasing over time to a
point that exceeds the current sediment remediation target.
The aqueous results from the filtrate of the Kopeopeo Dredge Trial were all well below the
Grimwood and Dobbs (1995) threshold for pollution control and remediation activities (38pg/L).
Similar levels of dioxins within the filtrate of the full scale dredge operation should be achievable
provided the treatment process (pump rate, flocculant mix and reaction times etc.) remain
consistent with the trial as described in the EnviroWaste (2015) Dredging Trial Report. This means
that the actual concentration of dioxins in filtrate is likely to be considerably less than the
guidelines discussed.
Kopeopeo Canal - Discharge Water Quality from the Kopeopeo Canal Containment Sites 9
2-34210.02/500WK | April 2016 Opus International Consultants Ltd
Ongoing monitoring is important in maintaining confidence in the treatment process and testing of
the filtrate at the discharge point should be completed on a monthly basis during normal operation.
The TSS/turbidity/dioxin proxy to be developed in accordance with the current consented method
will enable real time monitoring of filtrate discharge quality. BOPRC have already committed to
long term monitoring of dioxins within eel flesh as part of the current consent conditions, which is
probably the most important indicator of the effectiveness of the remediation project.
Kopeopeo Canal - Discharge Water Quality from the Kopeopeo Canal Containment Sites 10
2-34210.02/500WK | April 2016 Opus International Consultants Ltd
7 References
ANZECC. (2000). AUSTRALIAN GUIDELINES FOR WATER QUALITY MONITORING AND
REPORTING. Canberra / Auckland: Australian and New Zealand Environment and
Conservation Council.
Baker, T. (2016). Kopeopeo Canal Remediation - Revised Groundwater Assessment. Wellington:
Jacobs New Zealand Limited.
Buckley-Golder, D. (1999). Compilation of EU Dioxin Exposure. Report produced for European
Commission DG Environment & UK Department of the Environment Transport.
Oxfordshire: AEA Technology PLC .
Canadian Council of Ministers of the Environment. (2001). Canadian Sediment Quality.
Winnipeg: Canadian Council of Ministers of the Environment.
EnviroWaste. (2015). REPORT FOR CONTRACT 2016 0083 - Kopeopeo Canal Remediation
Project - Dredging Trial. Auckland: EnviroWaste.
Gatehouse, R. (2004). Ecological risk assessment of dioxins in Australia. Canberra: Department of
the Environment and Heritage.
Grimwood, M., & Dobbs, T. (1995). A review of the aquatic ecotoxicology of polychlorinated
dibenzo-p-dioxins and dibenzofurans. Environmental Toxicology and Water Quality, 57–
75.
Robotham, D., Jayaratne, R., & Chin, C. (2008). Kopeopeo Canal Dioxin Remediation. Assessment
of Potential Bed Sediment Movement. Auckland: Sinclair Knight Merz.
US EPA. (1993). Interim Report on Data and Methods for Assessment of 2,3,7,8-
Tetrachlorodibenzo-p dioxin Risks to Aquatic Life and Associated wildlife. Washington:
United States Environmental Protection Agency.
Webster, N., Robotham, D., & Clarke, B. (2006). Kopeopeo Canala Remediation Needs and Option
Assessment - Determining Remediation Goals. Auckland: Sinclair Knight Merz (SKM).
Kopeopeo Canal - Discharge Water Quality from the Kopeopeo Canal Containment Sites 11
2-34210.02/500WK | April 2016 Opus International Consultants Ltd
8 Appendix 1 - Conceptual design of the
containment sites

Kopeopeo Canal - Discharge Water Quality from the Kopeopeo Canal Containment Sites 12
2-34210.02/500WK | April 2016 Opus International Consultants Ltd
Kopeopeo Canal - Discharge Water Quality from the Kopeopeo Canal Containment Sites 13
2-34210.02/500WK | April 2016 Opus International Consultants Ltd

Kopeopeo Canal - Discharge Water Quality from the Kopeopeo Canal Containment Sites 14
2-34210.02/500WK | April 2016 Opus International Consultants Ltd
Kopeopeo Canal - Discharge Water Quality from the Kopeopeo Canal Containment Sites 15
2-34210.02/500WK | April 2016 Opus International Consultants Ltd
9 Appendix 1 – Calculations for TEQfish

Kopeopeo Canal - Discharge Water Quality from the Kopeopeo Canal Containment Sites 16
2-34210.02/500WK | April 2016 Opus International Consultants Ltd
Kopeopeo Canal - Discharge Water Quality from the Kopeopeo Canal Containment Sites 17
2-34210.02/500WK | April 2016 Opus International Consultants Ltd
Stru
ctur
eW
HO
200
5 TE
FTE
Fs f
or
Fish
(TEF
fish
)15
/040
7-19
15/0
411-
715
/041
1-15
15/0
411-
2515
/041
7-10
15/0
419-
815
/043
3-13
15/0
495
15/0
497-
1015
/054
7-1
15/0
583-
115
/081
2-1
15/0
936-
1
PCD
Ds
2,3,
7,8-
TCD
D1
11.
751.
561.
631.
561.
631.
681.
921.
750.
958
1.13
1.35
1.24
1.18
1,2,
3,7,
8-Pe
CD
D1
11.
061.
771.
651.
131.
31.
11
1.17
1.54
21.
82.
132.
28
1,2,
3,4,
7,8-
HxC
DD
0.1
0.5
3.41
4.46
2.42
2.52
3.24
3.19
2.55
61.
41.
582.
821.
914.
03
1,2,
3,6,
7,8-
HxC
DD
0.1
0.01
3.82
4.69
2.57
2.71
3.35
3.56
2.77
10.9
1.53
1.63
2.91
1.9
4
1,2,
3,7,
8,9-
HxC
DD
0.1
0.01
3.55
4.65
2.52
2.63
3.38
3.32
2.66
6.26
1.42
1.6
2.85
1.94
4.1
1,2,
3,4,
6,7,
8-H
pCD
D0.
010.
001
54.4
51.4
18.1
33.3
28.7
52.7
39.6
281
4.28
4.97
10.9
6.27
5.36
OC
DD
0.00
030.
0001
538
491
176
299
421
551
477
2970
40.6
36.6
16.9
55.2
6.67
PCD
Fs
2,3,
7,8-
TCD
F0.
10.
051.
111.
271.
311.
181.
11.
190.
969
1.44
0.81
40.
597
2.17
1.29
1.49
1,2,
3,7,
8-Pe
CD
F0.
030.
050.
791
0.85
80.
699
0.78
90.
883
0.67
1.48
1.23
0.72
1.02
1.12
0.71
30.
889
2,3,
4,7,
8-Pe
CD
F0.
30.
50.
822
0.87
40.
696
0.79
30.
923
0.67
91.
41.
280.
614
0.66
1.07
0.69
0.77
8
1,2,
3,4,
7,8-
HxC
DF
0.1
0.1
1.82
1.94
1.96
1.72
2.72
2.77
3.21
5.87
1.02
0.94
72.
221.
483.
04
1,2,
3,6,
7,8-
HxC
DF
0.1
0.1
1.77
1.89
2.01
1.69
2.64
2.77
3.04
5.73
0.94
0.91
52.
231.
42.
95
1,2,
3,7,
8,9-
HxC
DF
0.1
0.1
2.33
2.57
2.6
2.32
3.61
3.68
4.25
7.79
1.28
1.16
2.85
1.92
4.31
2,3,
4,6,
7,8-
HxC
DF
0.1
0.1
1.93
2.11
2.12
1.82
2.88
2.98
3.4
6.31
1.05
0.96
82.
241.
552.
91
1,2,
3,4,
6,7,
8-H
pCD
F0.
010.
019.
4411
.34.
497.
296.
1614
.512
.870
1.62
1.19
4.39
2.71
2.53
1,2,
3,4,
7,8,
9-H
pCD
F0.
010.
013.
34.
164.
463.
34.
056.
956.
238.
971.
991.
465.
743.
353.
38
OC
DF
0.00
030.
0001
59.9
70.4
25.4
46.1
42.1
133
77.2
428
9.97
9.3
28.5
8.21
6.77
WH
O T
EQ5.
916.
815.
595.
156.
056.
306.
4212
.99
3.74
4.39
5.76
5.08
6.52
TEQ
Fish
6.12
7.31
5.99
5.43
6.54
6.43
6.75
10.8
54.
094.
806.
395.
527.
45
Kopeopeo Canal - Discharge Water Quality from the Kopeopeo Canal Containment Sites 18
2-34210.02/500WK | April 2016 Opus International Consultants Ltd

Opus International Consultants Ltd Level 1, Opus House, 13 Louvain Street PO Box 800, Whakatane 3158 New Zealand t: +64 7 308 0139 f: +64 7 308 4757 w: www.opus.co.nz


![Outfall Canal Remediation ProjectsOutfall Canal ...... · Microsoft PowerPoint - 28 Apr 11.ppt [Compatibility Mode] Author: B2HPOCAC Created Date: 4/28/2011 8:19:46 AM](https://img.pdfslide.us/doc/110x75/5f672923dc10a36c3c6040fa/outfall-canal-remediation-projectsoutfall-canal-microsoft-powerpoint-.jpg)


![CANAL [T] Canal Soth Florida](https://img.pdfslide.us/doc/110x75/55cf9803550346d03395034f/canal-t-canal-soth-florida.jpg)