Embed Size (px)
Citation preview

102:3481-3491, 2009. First published Oct 7, 2009; doi:10.1152/jn.00688.2009 J NeurophysiolKoorosh Mirpour, Fabrice Arcizet, Wei Song Ong and James W. Bisley
You might find this additional information useful...
60 articles, 23 of which you can access free at: This article cites http://jn.physiology.org/cgi/content/full/102/6/3481#BIBL
including high-resolution figures, can be found at: Updated information and services http://jn.physiology.org/cgi/content/full/102/6/3481
can be found at: Journal of Neurophysiologyabout Additional material and information http://www.the-aps.org/publications/jn
This information is current as of January 12, 2010 .
http://www.the-aps.org/.American Physiological Society. ISSN: 0022-3077, ESSN: 1522-1598. Visit our website at (monthly) by the American Physiological Society, 9650 Rockville Pike, Bethesda MD 20814-3991. Copyright © 2005 by the
publishes original articles on the function of the nervous system. It is published 12 times a yearJournal of Neurophysiology
on January 12, 2010 jn.physiology.org
Dow
nloaded from
Been There, Seen That: A Neural Mechanism for Performing EfficientVisual Search
Koorosh Mirpour,1 Fabrice Arcizet,1 Wei Song Ong,1,4 and James W. Bisley1,2,3,4
1Department of Neurobiology and 2Jules Stein Eye Institute, David Geffen School of Medicine, 3Department of Psychology and the BrainResearch Institute, and 4Interdepartmental Ph.D. Program for Neuroscience, University of California, Los Angeles, California
Submitted 3 August 2009; accepted in final form 2 October 2009
Mirpour K, Arcizet F, Ong WS, Bisley JW. Been there, seen that:a neural mechanism for performing efficient visual search. J Neuro-physiol 102: 3481–3491, 2009. First published October 7, 2009;doi:10.1152/jn.00688.2009. In everyday life, we efficiently find ob-jects in the world by moving our gaze from one location to another.The efficiency of this process is brought about by ignoring items thatare dissimilar to the target and remembering which target-like itemshave already been examined. We trained two animals on a visualforaging task in which they had to find a reward-loaded target amongfive task-irrelevant distractors and five potential targets. We found thatboth animals performed the task efficiently, ignoring the distractorsand rarely examining a particular target twice. We recorded the singleunit activity of 54 neurons in the lateral intraparietal area (LIP) whilethe animals performed the task. The responses of the neurons differ-entiated between targets and distractors throughout the trial. Further,the responses marked off targets that had been fixated by a reductionin activity. This reduction acted like inhibition of return in saliencymap models; items that had been fixated would no longer be repre-sented by high enough activity to draw an eye movement. Thisreduction could also be seen as a correlate of reward expectancy; aftera target had been identified as not containing the reward the activitywas reduced. Within a trial, responses to the remaining targets did notincrease as they became more likely to yield a result, suggesting thatonly activity related to an event is updated on a moment-by-momentbases. Together, our data show that all the neural activity required toguide efficient search is present in LIP. Because LIP activity is knownto correlate with saccade goal selection, we propose that LIP plays asignificant role in the guidance of efficient visual search.
I N T R O D U C T I O N
People are highly efficient when searching or foraging for anitem in a cluttered environment. To do this, subjects need to beable to ignore objects that are dissimilar to the target item andto keep track of which items they have already examined toavoid looking at the same one repeatedly. To allow stimulisimilar to the target to be highlighted, it has been proposed thatthe brain creates a “priority map” of the outside world thatincorporates both bottom-up and strong top-down inputs (Ser-ences and Yantis 2006). This theory is based on saliency mapmodels of attentional allocation (Julesz 1984; Koch and Ull-man 1985; Treisman and Gelade 1980), in particular themodels of Koch, Itti and colleagues (Itti and Koch 2001).Although saliency maps include both bottom-up and top-downinputs, we prefer the use of the term priority map as it removesany ambiguity about the preferential role of salience (bot-tom-up information) in guiding attention (Fecteau and Munoz
2006; Serences and Yantis 2006). The overall concept is thatincoming visual information is prioritized based on salienceand then integrated with top-down feedback, such as thesuppression of task irrelevant stimuli, modulation due to re-ward contingencies or prior expectations. Our hypothesis isthat covert attention is allocated based on the topography of themap on a moment-by-moment basis, and eye movements areguided to the peak of the map. We believe that the lateralintraparietal area (LIP) of posterior parietal cortex acts as sucha map in which features or locations are represented by levelsof activity related to the attentional priority at that location(Ipata et al. 2009) and which is used to guide both covert(Bisley and Goldberg 2003; 2006) and overt (Gnadt andAndersen 1988; Ipata et al. 2006a; Roitman and Shadlen 2002;Thomas and Pare 2007) attention.
In this study, we asked whether the activity in LIP issufficient to guide efficient search by studying responses whilemonkeys performed a foraging task. Prior studies have shownthat LIP activity differentiates between task-relevant targetsand task-irrelevant distractors as visual search begins (Balanand Gottlieb 2006; Balan et al. 2008; Ipata et al. 2006a;Thomas and Pare 2007). In this study, we asked whether thisdifferentiation is maintained in ongoing search. If so, then theactivity in LIP is sufficient to guide eye movements to target-like stimuli. The second and more novel question we asked waswhether LIP activity maintains a representation of stimuli thathave been examined. If so, then it would allow for the efficientguidance of search by keeping the eyes away from stimuli thathave already been fixated. One potential way of accomplishingthis is the process of “inhibition of return,” which is includedin saliency map models (Itti and Koch 2000; Koch and Ullman1985). Based on a psychophysical finding (Klein 2000; Posnerand Cohen 1984), the process suppresses the activity repre-senting an item or location once it has been examined (Itti andKoch 2001). Thus we hypothesized that the LIP response topotential targets should be reduced once those items have beenfixated.
M E T H O D S
Subjects
All experiments were approved by the Chancellor’s Animal Re-search Committee at UCLA as complying with the guidelines estab-lished in the Public Health Service Guide for the Care and Use ofLaboratory Animals. Two rhesus monkeys (8–10 kg) were implantedwith head posts, scleral coils, and recording cylinders during sterilesurgery under general anesthesia (Bisley and Goldberg 2006); animalswere initially anesthetized with ketamine and xylazine and maintainedwith isofluorane.
Address for reprint requests and other correspondence: K. Mirpour, Dept.Neurobiology, P.O. Box 951763, Los Angeles, CA, 90095-1763 (E-mail:[email protected]).
J Neurophysiol 102: 3481–3491, 2009.First published October 7, 2009; doi:10.1152/jn.00688.2009.
34810022-3077/09 $8.00 Copyright © 2009 The American Physiological Societywww.jn.org
on January 12, 2010 jn.physiology.org
Dow
nloaded from
Physiological recordings
We recorded extracellular single-unit activity from area LIP usingtungsten microelectrodes guided by coordinates from magnetic reso-nance imaging (MRI) images. Recorded neurons were considered tobe in LIP if they showed typical LIP responses, such as a visual burst,delayed sustained activity or a peri-saccadic burst, during the mem-ory-guided delayed saccade task (Barash et al. 1991). After calculat-ing the size and position of the receptive field of each neuron using anautomated memory-guided delayed saccade task covering 9 or 25points, the behavioral task was run and neural data were recorded. Wediscriminated action potentials during the recording epoch using theMEX pattern spike sorter. The experiments were run using the REXsystem (Hays et al. 1982), and sorted spikes were time stamped andstored at 1 kHz.
Task
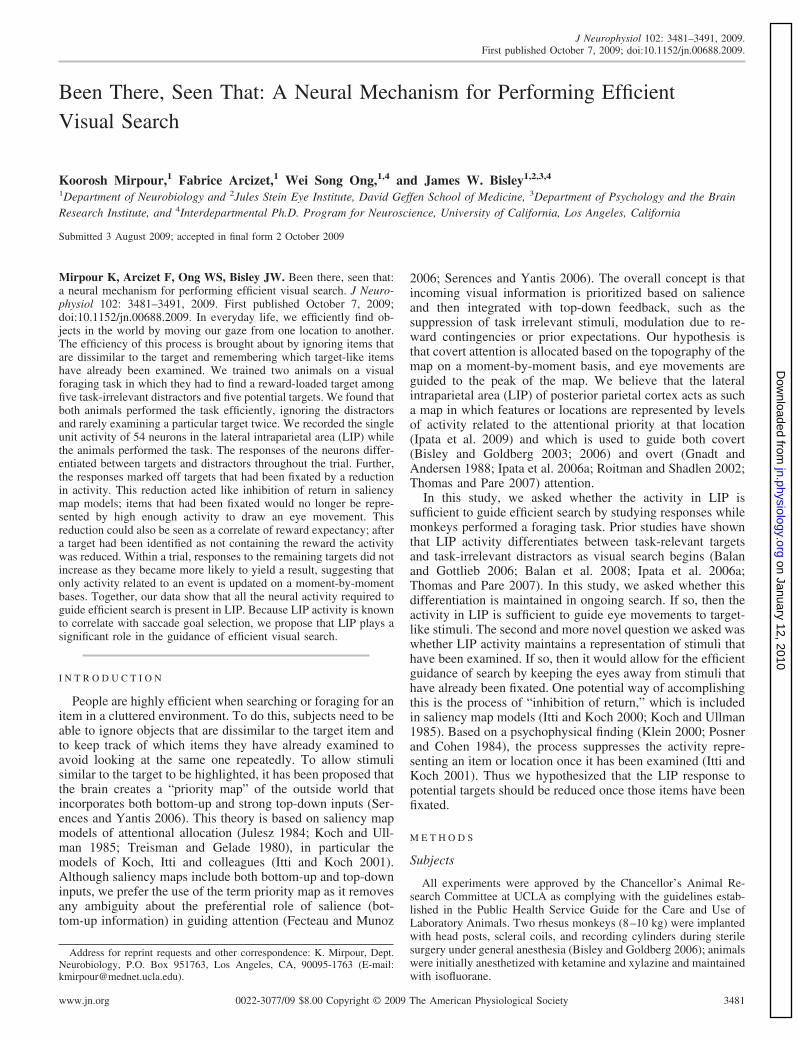
Stimuli were presented on a Samsung SyncMaster 1100DF CRTrunning at 100 Hz. The temporal precision of stimulus onset wascaptured by a photoprobe on the corner of the monitor. To begin a trialof the foraging task (Fig. 1), the monkeys had to fixate a spot placedon the left, right, or center of the screen; the position was chosen at thebeginning of the session and was usually changed once midwaythrough the session. After a delay of 450–700 ms, an array of fivepotential targets (T) and five distractors (�) were presented. One ofthe targets had a juice reward associated with it, such that if themonkey looked at it for 500 ms within 8 s after the start of the trial,he would get the reward. As in previous unrestricted viewing visualsearch tasks (Bichot et al. 2005; Mazer and Gallant 2003), the stimuliwere arranged in such a fashion that when the monkey looked at onestimulus, the receptive field of an LIP neuron encompassed anotherstimulus (black circles and ovals in Fig. 1). The stimuli were alwaysthe same size (1.2° � 0.8°) and large enough for the animals toperform the task exceedingly well at all eccentricities tested. On eachtrial, the spatial arrangement of the stimulus array was identical, butthe positions of the targets and distractors were randomly assigned.
Behavioral analysis
To quantify the animals’ behavior, we looked at all of the animals’informative saccades and compared their search strategy with an idealmodel to elucidate how well the animals were following the basicrules of the task. For this analysis, we considered informative sac-cades to be those that resulted in the monkey looking at a stimulus for�400 ms. We interpreted fixations lasting �400 ms as an indicationthat the monkey was aware that the stimulus he was looking at was notthe target because fixations of this duration would never get rewarded.In other words, if the animal knew a stimulus would not provide areward (i.e., it was a target that had been looked at before or was adistractor), he would move on well before 500 ms. These fixations canbe seen in the bimodal distribution of fixation durations seen inFig. 2A, which shows the distribution of fixation times for the twomonkeys. It is worth noting that the informative saccade designation
is an operational definition based on the distribution of fixation times.This definition helps to exclude saccades that result in short fixationdurations during which the animal is clearly aware that the item he isfixating is not the reward loaded target. Fixations with durations of�500 ms were completely informative; if the monkey was looking ata potential target and did not receive the reward, then he could deducethat the stimulus was not the actual target. We have included fixationswith durations between 400 and 500 ms because these are in the tailof the distribution of long saccades, so it is possible that from themonkey’s perspective they were informative (even though they werenot long enough for him to correctly deduce whether the stimulus hewas fixating was the target).
It is possible that saccades to distractors were made under theassumption that the distractor was a target and only after the animalstarted fixating the distractor did he realize his mistake. However, thefixation durations and distribution shapes were similar to the fixationsmade at previously fixated targets, so we assumed that these saccadeswere being made in the same way as saccades to previously fixatedstimuli. It is possible that some of the saccades were made todistractors under the assumption that they were targets. This wouldmean that we overestimated the animal’s efficiency, but it also meansthat we have underestimated the difference in response betweentargets and distractors by assuming that all distractors are ignoredwhen some may not be. We felt it was more appropriate to underes-timate the difference in response than to overestimate it, as wouldhappen if we assumed all saccades to distractors were made under theassumption that the distractor was actually a target.
MODELING EFFICIENCY OF SEARCH. The model we used to quantifythe animals’ saccadic behavior is based on the variable memory modelof visual search (Arani et al. 1984; Horowitz 2006). This model isaimed at seeing how well the animals followed the basic rules of thetask. The original model had three parameters: encoding probability,recall probability, and target identification probability. We removedthe encoding probability, as our stimuli were clearly distinguishablebut included a parameter that accounted for the fact that not all eyemovements we included were completely informative. The modelsearched through five potential targets and five distractors until itfound the target. Each “saccade” was considered informative, so timewas not incorporated. The first parameter was the target identificationprobability. This is a measure of the probability that the observerknew which stimuli were important (the targets) and which were not(the distractors). When the value is 1, the model never looks at adistractor because it has no attentional priority. When this value iszero, the model is equally likely to look at a target or distractor. Thesecond parameter was the recall probability. This is the probabilitythat the model remembered all of the stimuli it had previouslyexamined. When the value is 1, the model remembers all the locationsit has checked and always finds the target without looking at anystimulus twice. When this value is zero, the model has no knowledgeof what stimuli it has seen and randomly goes to any stimulus (asgoverned by the target identity probability) other than the one it wasalready at. We included a fixed parameter that was set by theproportion of noninformative saccades (i.e., fixations with durations
FIG. 1. Task and behavior. In each trial, 5 dis-tractors (�) and 5 potential targets (T) were pre-sented. One target had a fluid reward linked to it,such that when the monkey looked at it for 500 mswithin an 8-s time limit, he obtained the reward.The stimuli were arranged so that when looking at1 stimulus (small black circle) another stimulus wascentered in the LIP neuron’s receptive field (blackoval). The 2 panels show examples of trials inwhich a target that had not been fixated (left) and atarget that had been fixated (right) are located in thereceptive field. Cyan line: eye path.
3482 K. MIRPOUR, F. ARCIZET, W. S. ONG, AND J. W. BISLEY
J Neurophysiol • VOL 102 • DECEMBER 2009 • www.jn.org
on January 12, 2010 jn.physiology.org
Dow
nloaded from
between 400 and 500 ms) each monkey made. This parameter resultedin the model not retaining information about the stimulus it wascurrently looking at on a proportion of saccades set by the proportionof fixations that lasted between 400 and 500 ms.
The values of our two free parameters were obtained by finding thevalues that produced the best match with the behavioral data. This wasperformed using a brute force method; we tested all value pairs for thetwo parameters varying between 0 and 1 with a resolution of 0.02.Each pair of weights was tested with 50,000 simulated trials. Thedistribution of the number of informative saccades for each weightpair was compared with the actual number of informative saccadesmade by the individual monkey, and an R2 was calculated using all the
points up to and including the last category for which at least one trialhad that number of informative saccades. The parameter values thatproduced the optimal R2 values for each animal were considered thebest estimates for the model.
Neural data analysis
Data were recorded from 54 LIP neurons (29 from monkey E and 25from monkey C). We analyzed neural activity during fixations inwhich there was a single object inside the receptive field. Data werealigned by either the beginning of fixation or by the beginning of thefollowing saccade. Spike density functions were calculated for visu-alization only, by convolving spike trains with a Gaussian kernel witha 10-ms sigma. Quantitative analysis was based on spike rates withintwo windows (gray patches in Figs. 6B and 7B): a 350-ms windowstarting 150 ms after the end of the last saccade (the “fixation”window) and a 100-ms window starting 50 ms before the beginning ofthe next saccade (the “peri-saccadic” window). Fixations were onlyincluded from trials in which the animal performed the task correctly(�97% of trials) and from fixations in which the eye remained on thestimulus for �500 ms. Data were analyzed using custom code writtenin Matlab (Mathworks).
R E S U L T S
To examine whether the activity in LIP could explain effi-cient visual search, we performed extracellular microelectroderecordings from LIP neurons in two rhesus monkeys that weretrained on a visual foraging task (Fig. 1), similar to thescanning task used by Sommer (1994). In this task, monkeyssearched through five potential targets (T) and five distractors(�) to find the target that was loaded with reward. After thestimuli appeared, the monkeys were free to move their eyes tofind the reward-loaded target within 8 s. To get the reward theyhad to fixate the loaded target for 500 ms, this lead to a strategyin which the monkeys usually looked from target to target,waiting at each for �650 ms (Fig. 2).
Behavioral data
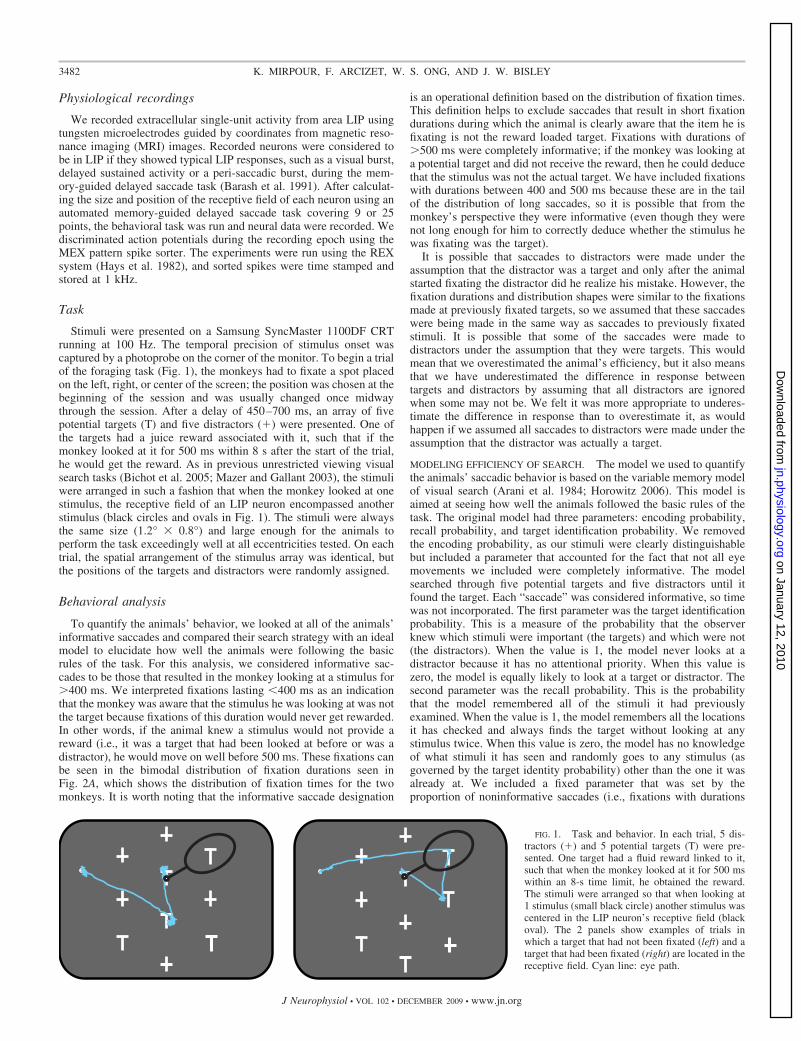
OVERALL SACCADIC BEHAVIOR. Monkeys performed the taskvery well and were usually able to find the rewarded target in�97% of trials per session. With the presence of five targets,an optimal strategy would result in an average of three sac-cades per trial with �500-ms intersaccadic intervals. However,we found that the monkeys made 4.82 saccades per trial.Examination of the data showed that the main reason for theincreased number of saccades was that the animals often didnot fixate every stimulus they saw for a full 500 ms. This canbe seen in Fig. 2A, which shows the distribution of fixationtimes for the two monkeys. Although the majority of thefixations in both animals lasted �500 ms, there was clearly abimodal distribution of fixation times. Almost half (44%) ofthe fixations times of �400 ms were from fixations in whichthe monkey fixated a distractor (white bars). Both monkeysrealized that fixating a distractor would not result in a reward,and so these fixations were usually short; neither monkeyfixated a distractor for �400 ms in �0.62% of fixations. Of theremaining short fixations, only 17.4 and 9.4% went to targets inmonkeys E and C, respectively. The remaining short saccadeswere not toward any stimuli on the array. While these saccadesrepresent close to 40% of the short fixations, they only ac-counted for 8.8 and 14.4% of all saccades in monkey E and C,
0 500 1000
Time of fixation (ms)
Num
ber o
f fix
atio
ns
Time since it was last fixated (ms)
Length of previous fixation (ms)
Leng
th o
f cur
rent
fixat
ion
(ms)
0
500
1000
0 500 1000
0 60003000
Leng
th o
f cur
rent
fixat
ion
(ms)
C
0
500
1000
0
500
1000B
0 500 1000
Monkey E Monkey C
0 500 1000
Mea
n le
ngth
of c
urre
ntfix
atio
n (m
s)
0
500
1000D
0 60003000
A
Time since it was last fixated (ms)0 60003000 0 60003000
FIG. 2. Foraging behavior for monkeys E and C. A: distribution of fixationtimes for the 2 monkeys from all trials in which neural data were collected.Fixations made to distractors are shown by white bars. B: fixation times fromtrials in which the 2 monkeys looked at a target twice. The time spent at thetarget the 2nd time is plotted against the time spent at the target the 1st time.C and D: fixation times (C) and mean fixation times (D) from the 2nd time themonkey looked at a stimulus are plotted against the time since the monkey lastsaw the stimulus for each monkey. —, best-fitting sigmoid (R2 � 0. 092 and0.125 for monkeys E and C, respectively).
3483EFFICIENT SEARCH IN LIP
J Neurophysiol • VOL 102 • DECEMBER 2009 • www.jn.org
on January 12, 2010 jn.physiology.org
Dow
nloaded from
respectively. Often these were rapid zigzag saccades that tookthe eyes out of the array and then quickly back onto it.
When uninformative fixations, i.e., those that lasted �400ms, were removed from the data set, then the mean number ofsaccades per trial was reduced to 3.08. This was significantlygreater than three (P �� 0.001, t-test), suggesting that on someoccasions the animals looked at the same target twice within atrial. To analyze this behavior, we plotted the fixation times onthe first and second fixations of a single target (Fig. 2B). Bothpanels show three main clusters of data: in the top left; bottomright; and top right regions of the plots. In addition to theseclusters, both monkeys show a small proportion of trials inwhich a target was briefly examined twice within a trial(bottom left region). These mostly represent the very smallnumber of trials in which the monkeys made more than twosaccades to a particular target. The cluster on the bottom rightis from trials in which the first fixation lasted �500 ms, but thesecond fixation was brief (�400 ms). This represents trials inwhich the monkey probably remembered that he had fixatedthe object and did not wait for the reward period before leavingit. A second, smaller, cluster is from trials in which the firstfixation of the target lasted �400 ms and the second lasted for�500 ms. These data represent trials in which the monkeycame back to a target that he had fixated and waited the for theappropriate time because he had fixated it for less than the 500ms the first time. The third cluster is from trials in which bothfixations lasted for �500 ms (top right cluster). These data arethe most interesting as they imply that the monkey may haveforgotten that he had already examined the stimulus for 500ms. In monkey E, these fixations account for 5.68% of allfixations that lasted �400 ms, in monkey C, they account foronly 1.84%. Thus while the animals looked at stimuli twice for�400 ms, they did so rarely.
To see how long it took the monkey to forget whether he hadexamined a stimulus for 500 ms when he looked at it a secondtime for �400 ms, we plotted the second time of fixationagainst a measure of the time since he had fixated it last. Figure2C shows the raw data, and D shows the means of these dataplotted against time for the two monkeys. The — show sig-moidal lines of best fit. Because there is mostly a bimodaldistribution of fixation times, the sigmoid fit is really giving anindication of what proportion of current fixations are short andwhat proportion are long. In doing so, we obtain a metric of thetime course of any change. It is clear that the chance of fixatinga target that had already been fixated for �500 ms increased astime went on. This increasing probability reached a plateauaround 3,000 ms, which correlates to approximately six sac-cades. However, at this time, there are still a large number ofsecond fixations that last �400 ms. These data suggest thatthere may be a time course over which the animals start toforget which stimuli they have fixated for 500 ms, but this isnot absolute, as second fixations were occasionally short�3,000 ms and beyond. We should note that from our data weare unable to differentiate between the possibility that theanimals forget which stimuli they fixated and the possibilitythat they forgot how long they fixated the stimulus the first timethey saw it.
SACCADIC BEHAVIOR FROM INFORMATIVE SACCADES. To quan-tify animals’ efficiency on the foraging task, we looked at all ofthe animals’ informative saccades (i.e., those with fixations
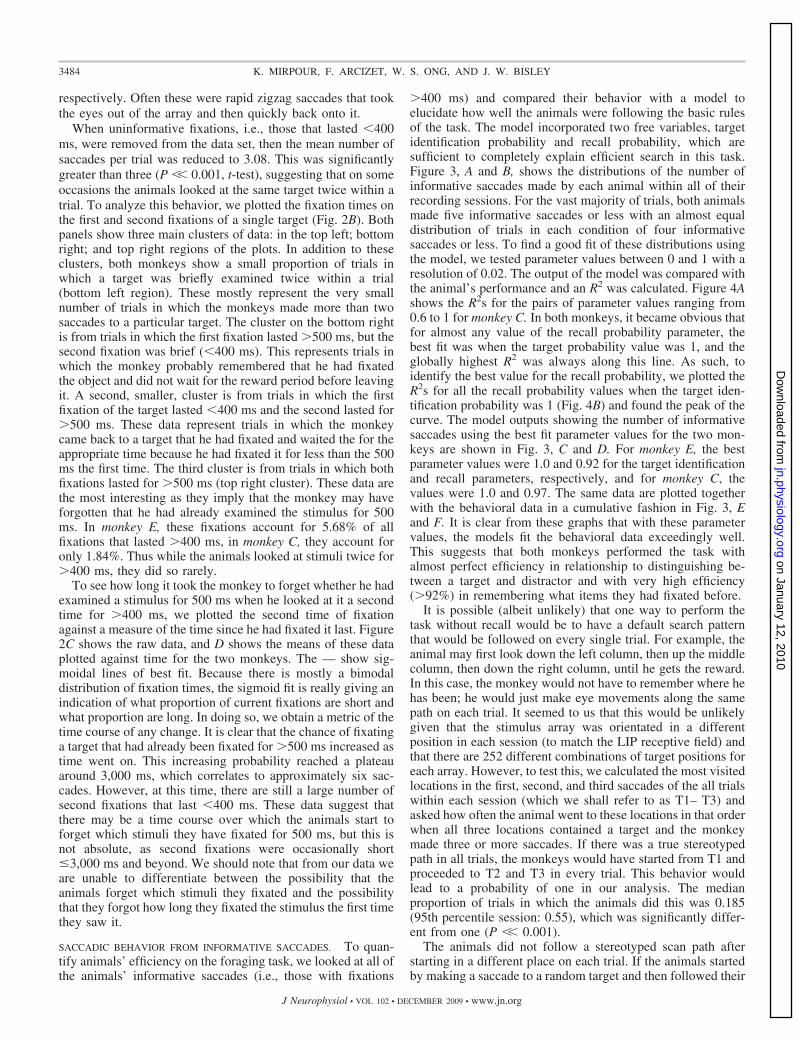
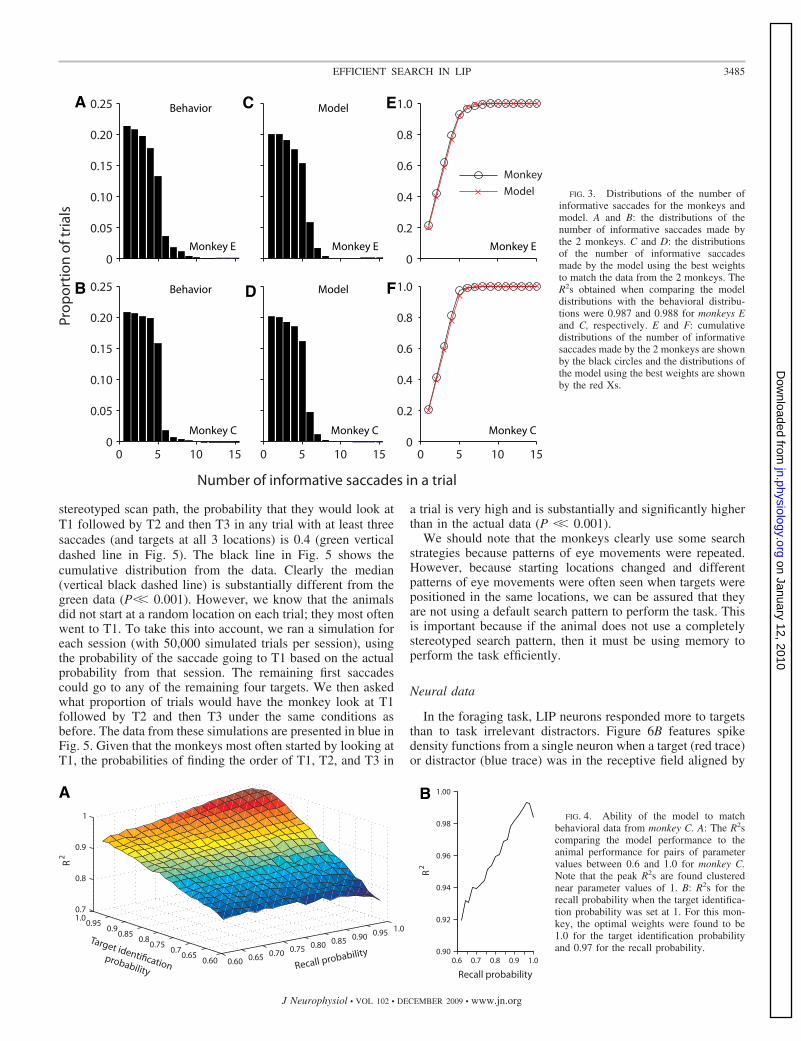
�400 ms) and compared their behavior with a model toelucidate how well the animals were following the basic rulesof the task. The model incorporated two free variables, targetidentification probability and recall probability, which aresufficient to completely explain efficient search in this task.Figure 3, A and B, shows the distributions of the number ofinformative saccades made by each animal within all of theirrecording sessions. For the vast majority of trials, both animalsmade five informative saccades or less with an almost equaldistribution of trials in each condition of four informativesaccades or less. To find a good fit of these distributions usingthe model, we tested parameter values between 0 and 1 with aresolution of 0.02. The output of the model was compared withthe animal’s performance and an R2 was calculated. Figure 4Ashows the R2s for the pairs of parameter values ranging from0.6 to 1 for monkey C. In both monkeys, it became obvious thatfor almost any value of the recall probability parameter, thebest fit was when the target probability value was 1, and theglobally highest R2 was always along this line. As such, toidentify the best value for the recall probability, we plotted theR2s for all the recall probability values when the target iden-tification probability was 1 (Fig. 4B) and found the peak of thecurve. The model outputs showing the number of informativesaccades using the best fit parameter values for the two mon-keys are shown in Fig. 3, C and D. For monkey E, the bestparameter values were 1.0 and 0.92 for the target identificationand recall parameters, respectively, and for monkey C, thevalues were 1.0 and 0.97. The same data are plotted togetherwith the behavioral data in a cumulative fashion in Fig. 3, Eand F. It is clear from these graphs that with these parametervalues, the models fit the behavioral data exceedingly well.This suggests that both monkeys performed the task withalmost perfect efficiency in relationship to distinguishing be-tween a target and distractor and with very high efficiency(�92%) in remembering what items they had fixated before.
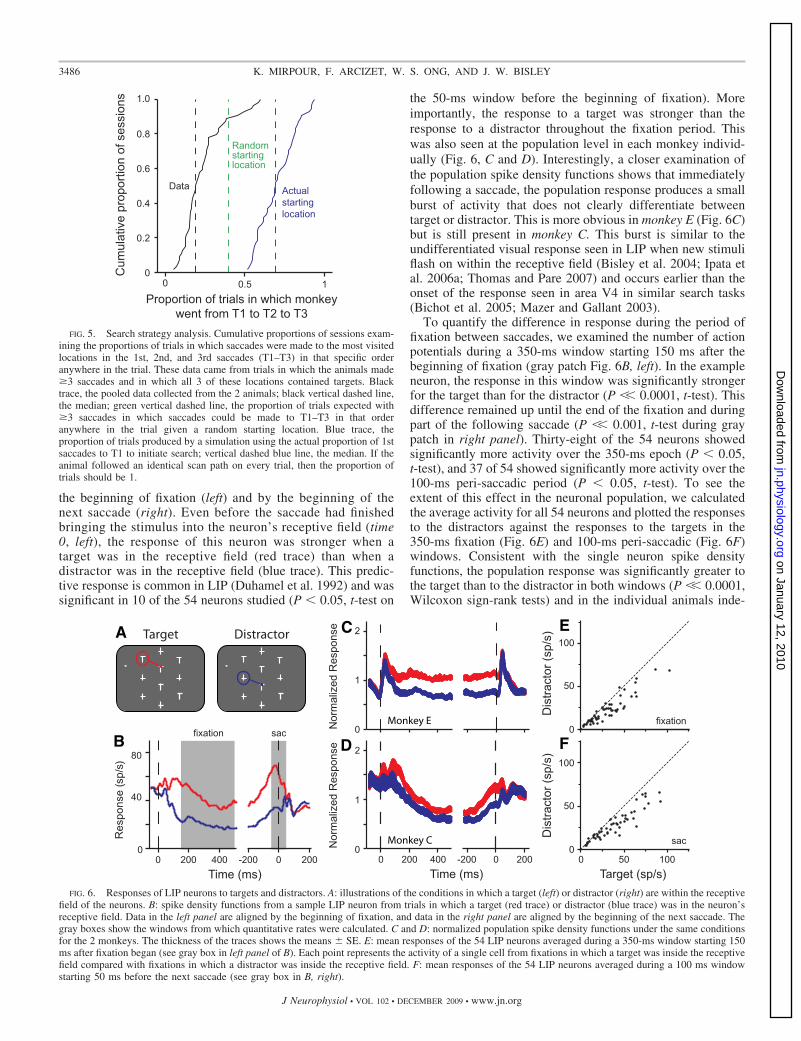
It is possible (albeit unlikely) that one way to perform thetask without recall would be to have a default search patternthat would be followed on every single trial. For example, theanimal may first look down the left column, then up the middlecolumn, then down the right column, until he gets the reward.In this case, the monkey would not have to remember where hehas been; he would just make eye movements along the samepath on each trial. It seemed to us that this would be unlikelygiven that the stimulus array was orientated in a differentposition in each session (to match the LIP receptive field) andthat there are 252 different combinations of target positions foreach array. However, to test this, we calculated the most visitedlocations in the first, second, and third saccades of the all trialswithin each session (which we shall refer to as T1– T3) andasked how often the animal went to these locations in that orderwhen all three locations contained a target and the monkeymade three or more saccades. If there was a true stereotypedpath in all trials, the monkeys would have started from T1 andproceeded to T2 and T3 in every trial. This behavior wouldlead to a probability of one in our analysis. The medianproportion of trials in which the animals did this was 0.185(95th percentile session: 0.55), which was significantly differ-ent from one (P �� 0.001).
The animals did not follow a stereotyped scan path afterstarting in a different place on each trial. If the animals startedby making a saccade to a random target and then followed their
3484 K. MIRPOUR, F. ARCIZET, W. S. ONG, AND J. W. BISLEY
J Neurophysiol • VOL 102 • DECEMBER 2009 • www.jn.org
on January 12, 2010 jn.physiology.org
Dow
nloaded from
stereotyped scan path, the probability that they would look atT1 followed by T2 and then T3 in any trial with at least threesaccades (and targets at all 3 locations) is 0.4 (green verticaldashed line in Fig. 5). The black line in Fig. 5 shows thecumulative distribution from the data. Clearly the median(vertical black dashed line) is substantially different from thegreen data (P�� 0.001). However, we know that the animalsdid not start at a random location on each trial; they most oftenwent to T1. To take this into account, we ran a simulation foreach session (with 50,000 simulated trials per session), usingthe probability of the saccade going to T1 based on the actualprobability from that session. The remaining first saccadescould go to any of the remaining four targets. We then askedwhat proportion of trials would have the monkey look at T1followed by T2 and then T3 under the same conditions asbefore. The data from these simulations are presented in blue inFig. 5. Given that the monkeys most often started by looking atT1, the probabilities of finding the order of T1, T2, and T3 in
a trial is very high and is substantially and significantly higherthan in the actual data (P �� 0.001).
We should note that the monkeys clearly use some searchstrategies because patterns of eye movements were repeated.However, because starting locations changed and differentpatterns of eye movements were often seen when targets werepositioned in the same locations, we can be assured that theyare not using a default search pattern to perform the task. Thisis important because if the animal does not use a completelystereotyped search pattern, then it must be using memory toperform the task efficiently.
Neural data
In the foraging task, LIP neurons responded more to targetsthan to task irrelevant distractors. Figure 6B features spikedensity functions from a single neuron when a target (red trace)or distractor (blue trace) was in the receptive field aligned by
A C E
B D F
Monkey E
Model
Model
Monkey C
Monkey E
Monkey C
Monkey E
Monkey C
Behavior
Behavior
FIG. 3. Distributions of the number ofinformative saccades for the monkeys andmodel. A and B: the distributions of thenumber of informative saccades made bythe 2 monkeys. C and D: the distributionsof the number of informative saccadesmade by the model using the best weightsto match the data from the 2 monkeys. TheR2s obtained when comparing the modeldistributions with the behavioral distribu-tions were 0.987 and 0.988 for monkeys Eand C, respectively. E and F: cumulativedistributions of the number of informativesaccades made by the 2 monkeys are shownby the black circles and the distributions ofthe model using the best weights are shownby the red Xs.
A BFIG. 4. Ability of the model to match
behavioral data from monkey C. A: The R2scomparing the model performance to theanimal performance for pairs of parametervalues between 0.6 and 1.0 for monkey C.Note that the peak R2s are found clusterednear parameter values of 1. B: R2s for therecall probability when the target identifica-tion probability was set at 1. For this mon-key, the optimal weights were found to be1.0 for the target identification probabilityand 0.97 for the recall probability.
3485EFFICIENT SEARCH IN LIP
J Neurophysiol • VOL 102 • DECEMBER 2009 • www.jn.org
on January 12, 2010 jn.physiology.org
Dow
nloaded from
the beginning of fixation (left) and by the beginning of thenext saccade (right). Even before the saccade had finishedbringing the stimulus into the neuron’s receptive field (time0, left), the response of this neuron was stronger when atarget was in the receptive field (red trace) than when adistractor was in the receptive field (blue trace). This predic-tive response is common in LIP (Duhamel et al. 1992) and wassignificant in 10 of the 54 neurons studied (P � 0.05, t-test on
the 50-ms window before the beginning of fixation). Moreimportantly, the response to a target was stronger than theresponse to a distractor throughout the fixation period. Thiswas also seen at the population level in each monkey individ-ually (Fig. 6, C and D). Interestingly, a closer examination ofthe population spike density functions shows that immediatelyfollowing a saccade, the population response produces a smallburst of activity that does not clearly differentiate betweentarget or distractor. This is more obvious in monkey E (Fig. 6C)but is still present in monkey C. This burst is similar to theundifferentiated visual response seen in LIP when new stimuliflash on within the receptive field (Bisley et al. 2004; Ipata etal. 2006a; Thomas and Pare 2007) and occurs earlier than theonset of the response seen in area V4 in similar search tasks(Bichot et al. 2005; Mazer and Gallant 2003).
To quantify the difference in response during the period offixation between saccades, we examined the number of actionpotentials during a 350-ms window starting 150 ms after thebeginning of fixation (gray patch Fig. 6B, left). In the exampleneuron, the response in this window was significantly strongerfor the target than for the distractor (P �� 0.0001, t-test). Thisdifference remained up until the end of the fixation and duringpart of the following saccade (P �� 0.001, t-test during graypatch in right panel). Thirty-eight of the 54 neurons showedsignificantly more activity over the 350-ms epoch (P � 0.05,t-test), and 37 of 54 showed significantly more activity over the100-ms peri-saccadic period (P � 0.05, t-test). To see theextent of this effect in the neuronal population, we calculatedthe average activity for all 54 neurons and plotted the responsesto the distractors against the responses to the targets in the350-ms fixation (Fig. 6E) and 100-ms peri-saccadic (Fig. 6F)windows. Consistent with the single neuron spike densityfunctions, the population response was significantly greater tothe target than to the distractor in both windows (P �� 0.0001,Wilcoxon sign-rank tests) and in the individual animals inde-
0 0.5 10
0.2
0.4
0.6
0.8C
umul
ativ
e pr
opor
tion
of s
essi
ons
Proportion of trials in which monkeywent from T1 to T2 to T3
Randomstartinglocation
Data Actualstartinglocation
1.0
FIG. 5. Search strategy analysis. Cumulative proportions of sessions exam-ining the proportions of trials in which saccades were made to the most visitedlocations in the 1st, 2nd, and 3rd saccades (T1–T3) in that specific orderanywhere in the trial. These data came from trials in which the animals made�3 saccades and in which all 3 of these locations contained targets. Blacktrace, the pooled data collected from the 2 animals; black vertical dashed line,the median; green vertical dashed line, the proportion of trials expected with�3 saccades in which saccades could be made to T1–T3 in that orderanywhere in the trial given a random starting location. Blue trace, theproportion of trials produced by a simulation using the actual proportion of 1stsaccades to T1 to initiate search; vertical dashed blue line, the median. If theanimal followed an identical scan path on every trial, then the proportion oftrials should be 1.
A
D
C E
B F
Monkey E
Monkey C
FIG. 6. Responses of LIP neurons to targets and distractors. A: illustrations of the conditions in which a target (left) or distractor (right) are within the receptivefield of the neurons. B: spike density functions from a sample LIP neuron from trials in which a target (red trace) or distractor (blue trace) was in the neuron’sreceptive field. Data in the left panel are aligned by the beginning of fixation, and data in the right panel are aligned by the beginning of the next saccade. Thegray boxes show the windows from which quantitative rates were calculated. C and D: normalized population spike density functions under the same conditionsfor the 2 monkeys. The thickness of the traces shows the means � SE. E: mean responses of the 54 LIP neurons averaged during a 350-ms window starting 150ms after fixation began (see gray box in left panel of B). Each point represents the activity of a single cell from fixations in which a target was inside the receptivefield compared with fixations in which a distractor was inside the receptive field. F: mean responses of the 54 LIP neurons averaged during a 100 ms windowstarting 50 ms before the next saccade (see gray box in B, right).
3486 K. MIRPOUR, F. ARCIZET, W. S. ONG, AND J. W. BISLEY
J Neurophysiol • VOL 102 • DECEMBER 2009 • www.jn.org
on January 12, 2010 jn.physiology.org
Dow
nloaded from
pendently (P � 0.0038, Wilcoxon sign-rank tests). Theseresults show that the activity in LIP differentiates between thetargets and task-irrelevant distractors, thus contributing to theefficiency of search by highlighting only potential targets.These results are consistent with previous studies that haveshown enhanced activity in LIP to behaviorally relevant stimuli(Colby et al. 1996; Dorris and Glimcher 2004; Gottlieb et al.1998; Platt and Glimcher 1999; Sugrue et al. 2004) but addi-tionally demonstrate that this information continues within thetime scale of a trial and is transferred successfully acrossmultiple saccades.
Although the mean response to a target was significantlygreater than to a distractor, we found that the response to atarget depended on whether the animal had looked at it previ-ously in the trial or not; neurons tended to respond more to atarget that had not been fixated than to a target that had beenfixated. Figure 7B shows the mean spike density functions forthe same neuron as in Fig. 6B under conditions in which thetarget in the receptive field had already been fixated (red) orhad not been fixated before in that trial (blue). The response ofthe neuron was significantly lower when there was a targetinside the receptive field that the monkey had already fixatedcompared with a target that it had not fixated (P �� 0.0001).This sustained difference was seen in the population responsesof both animals (Fig. 7, C and D) and was significant in 28 of54 neurons during the 350-ms epoch and 31 of 54 during the100-ms peri-saccadic period (P � 0.05, t-test). This effect wasalso significant across the population as a whole (P �� 0.0001,Wilcoxon sign-rank tests), in the individual animals (P �0.004; Fig. 7, E and F) and across saccades within trials (P �0.002, Wilcoxon sign-rank tests). Although the response totargets that had been fixated was lower than to targets that hadnot been fixated, it was still higher than the response to adistractor (e.g., black dotted lines in Fig. 7, B–D; P �� 0.0001,Wilcoxon sign-rank tests on population data). This result
suggests that while foraging, once a stimulus of interest hasbeen looked at, the activity representing it in LIP is reduced.
LIP neurons are known to give an enhanced response whena saccade is planned into the receptive field (Gnadt andAndersen 1988). Consistent with this, we found that the re-sponses to targets that had not been fixated and were the goalof the next saccade were significantly higher than to targets thathad not been fixated, but were not the goal of the next saccade(Fig. 8, A and B). Each point in Fig. 8A represents the averageactivity of a neuron during the 350-ms window in conditions inwhich targets that had not been fixated were either the goal ofnext saccade or not. Twenty-five of the 54 neurons showed asignificantly higher response to the targets that had not beenfixated that were the goal of the next saccade compared withthose that were not (P � 0.05, t-test). This effect was magni-fied when the traditional (Barash et al. 1991) peri-saccadicperiod was examined (Fig. 8B). In this window, 40 of the 54neurons had an enhanced response when the next saccade wasmade toward the target in the receptive field. In both cases,these effects were significant at the population level (P ��0.0001, Wilcoxon sign-rank tests) and in the individual animals(P � 0.0002).
The enhanced responses to targets that have not been fixatedcannot be trivially explained by the greater activity in thesubset of fixations in which the target in the receptive field willbe the goal of the next saccade. It is possible that the elevatedactivity seen in the mean population response to targets thathave not been fixated is entirely due to the inclusion offixations in which the next saccade will be made to the targetin the receptive field. To show that this is not the case, wecalculated the average activity in conditions in which the targetin the receptive field had been fixated and in which the targetin the receptive field had not been fixated but was not the goalof the next saccade (Fig. 8, C and D). We found that in both the350-ms fixation period and the peri-saccadic period, the pop-
A
D
C E
B F
Monkey E
Monkey C
FIG. 7. Responses of LIP neurons to targets that have been fixated or not been fixated. A: illustrations of the conditions in which a target has (left) or has not(right) been fixated before within the trial. B: spike density functions from the same sample LIP neuron as in Fig. 6B from trials in which a target that had beenfixated (red trace) or had not been fixated (blue trace) was in the neuron’s receptive field. Left: data are aligned by the beginning of fixation; right: data are alignedby the beginning of the next saccade. The gray boxes show the windows from which quantitative rates were calculated. C and D: normalized population spikedensity functions under the same conditions for the 2 monkeys. The thickness of the traces shows the means � SE. E: mean responses of the 54 LIP neuronsaveraged during a 350-ms window starting 150 ms after fixation began (see gray box in B, left). Each point represents the activity of a single cell from fixationsin which a target was inside the receptive field compared with fixations in which a distractor was inside the receptive field. F: mean responses of the 54 LIPneurons averaged during a 100-ms window starting 50 ms before the next saccade (see gray box in B, right).
3487EFFICIENT SEARCH IN LIP
J Neurophysiol • VOL 102 • DECEMBER 2009 • www.jn.org
on January 12, 2010 jn.physiology.org
Dow
nloaded from
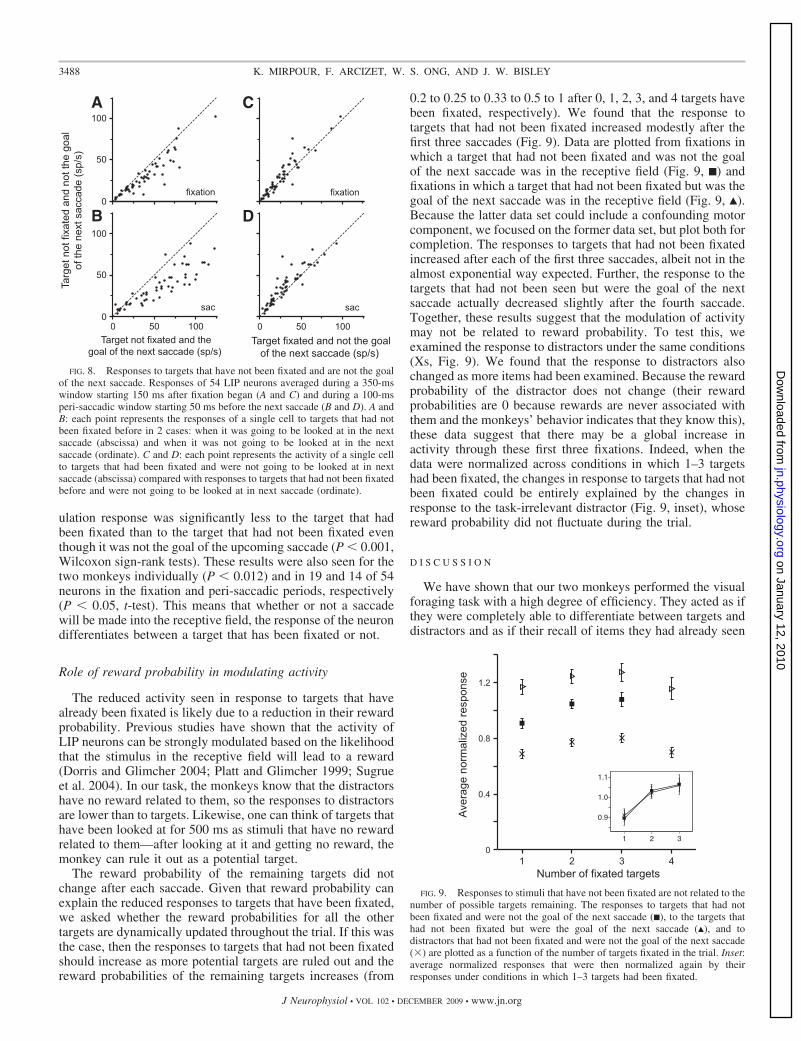
ulation response was significantly less to the target that hadbeen fixated than to the target that had not been fixated eventhough it was not the goal of the upcoming saccade (P � 0.001,Wilcoxon sign-rank tests). These results were also seen for thetwo monkeys individually (P � 0.012) and in 19 and 14 of 54neurons in the fixation and peri-saccadic periods, respectively(P � 0.05, t-test). This means that whether or not a saccadewill be made into the receptive field, the response of the neurondifferentiates between a target that has been fixated or not.
Role of reward probability in modulating activity
The reduced activity seen in response to targets that havealready been fixated is likely due to a reduction in their rewardprobability. Previous studies have shown that the activity ofLIP neurons can be strongly modulated based on the likelihoodthat the stimulus in the receptive field will lead to a reward(Dorris and Glimcher 2004; Platt and Glimcher 1999; Sugrueet al. 2004). In our task, the monkeys know that the distractorshave no reward related to them, so the responses to distractorsare lower than to targets. Likewise, one can think of targets thathave been looked at for 500 ms as stimuli that have no rewardrelated to them—after looking at it and getting no reward, themonkey can rule it out as a potential target.
The reward probability of the remaining targets did notchange after each saccade. Given that reward probability canexplain the reduced responses to targets that have been fixated,we asked whether the reward probabilities for all the othertargets are dynamically updated throughout the trial. If this wasthe case, then the responses to targets that had not been fixatedshould increase as more potential targets are ruled out and thereward probabilities of the remaining targets increases (from
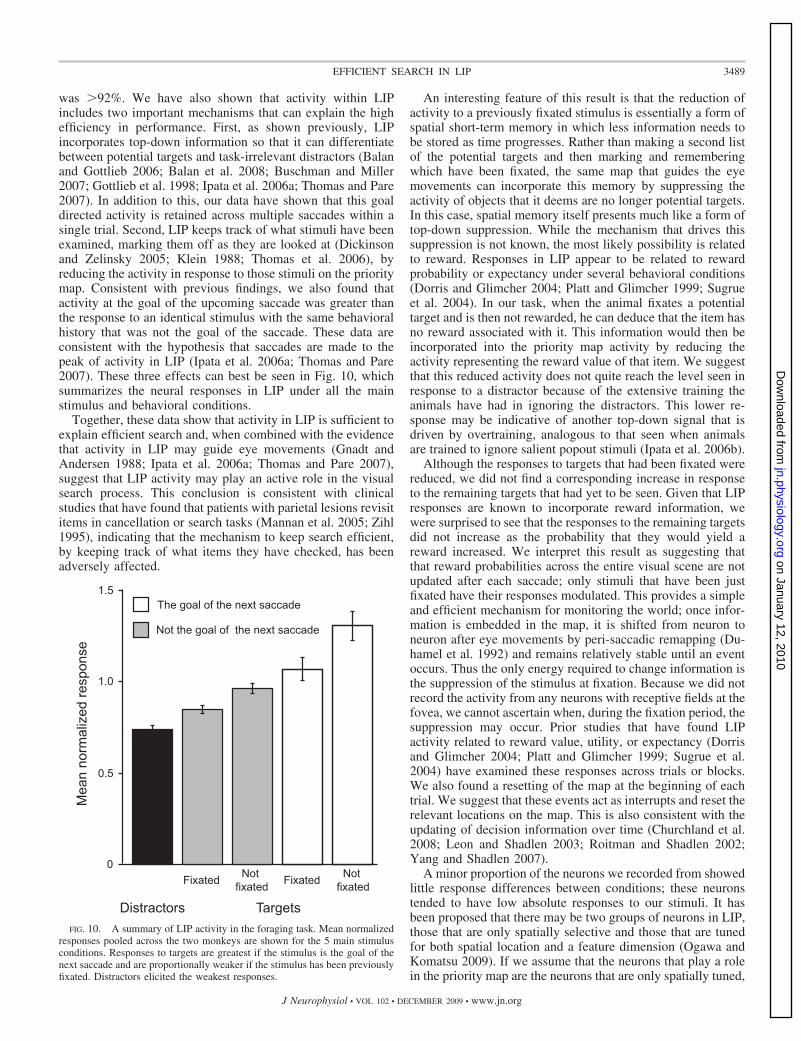
0.2 to 0.25 to 0.33 to 0.5 to 1 after 0, 1, 2, 3, and 4 targets havebeen fixated, respectively). We found that the response totargets that had not been fixated increased modestly after thefirst three saccades (Fig. 9). Data are plotted from fixations inwhich a target that had not been fixated and was not the goalof the next saccade was in the receptive field (Fig. 9, ■) andfixations in which a target that had not been fixated but was thegoal of the next saccade was in the receptive field (Fig. 9, Œ).Because the latter data set could include a confounding motorcomponent, we focused on the former data set, but plot both forcompletion. The responses to targets that had not been fixatedincreased after each of the first three saccades, albeit not in thealmost exponential way expected. Further, the response to thetargets that had not been seen but were the goal of the nextsaccade actually decreased slightly after the fourth saccade.Together, these results suggest that the modulation of activitymay not be related to reward probability. To test this, weexamined the response to distractors under the same conditions(Xs, Fig. 9). We found that the response to distractors alsochanged as more items had been examined. Because the rewardprobability of the distractor does not change (their rewardprobabilities are 0 because rewards are never associated withthem and the monkeys’ behavior indicates that they know this),these data suggest that there may be a global increase inactivity through these first three fixations. Indeed, when thedata were normalized across conditions in which 1–3 targetshad been fixated, the changes in response to targets that had notbeen fixated could be entirely explained by the changes inresponse to the task-irrelevant distractor (Fig. 9, inset), whosereward probability did not fluctuate during the trial.
D I S C U S S I O N
We have shown that our two monkeys performed the visualforaging task with a high degree of efficiency. They acted as ifthey were completely able to differentiate between targets anddistractors and as if their recall of items they had already seen
1 2 3 40
0.4
0.8
1.2
Aver
age
norm
aliz
ed re
spon
se
Number of fixated targets
1 2 3
0.9
1.0
1.1
FIG. 9. Responses to stimuli that have not been fixated are not related to thenumber of possible targets remaining. The responses to targets that had notbeen fixated and were not the goal of the next saccade (■), to the targets thathad not been fixated but were the goal of the next saccade (Œ), and todistractors that had not been fixated and were not the goal of the next saccade(�) are plotted as a function of the number of targets fixated in the trial. Inset:average normalized responses that were then normalized again by theirresponses under conditions in which 1–3 targets had been fixated.
A C
B D
FIG. 8. Responses to targets that have not been fixated and are not the goalof the next saccade. Responses of 54 LIP neurons averaged during a 350-mswindow starting 150 ms after fixation began (A and C) and during a 100-msperi-saccadic window starting 50 ms before the next saccade (B and D). A andB: each point represents the responses of a single cell to targets that had notbeen fixated before in 2 cases: when it was going to be looked at in the nextsaccade (abscissa) and when it was not going to be looked at in the nextsaccade (ordinate). C and D: each point represents the activity of a single cellto targets that had been fixated and were not going to be looked at in nextsaccade (abscissa) compared with responses to targets that had not been fixatedbefore and were not going to be looked at in next saccade (ordinate).
3488 K. MIRPOUR, F. ARCIZET, W. S. ONG, AND J. W. BISLEY
J Neurophysiol • VOL 102 • DECEMBER 2009 • www.jn.org
on January 12, 2010 jn.physiology.org
Dow
nloaded from
was �92%. We have also shown that activity within LIPincludes two important mechanisms that can explain the highefficiency in performance. First, as shown previously, LIPincorporates top-down information so that it can differentiatebetween potential targets and task-irrelevant distractors (Balanand Gottlieb 2006; Balan et al. 2008; Buschman and Miller2007; Gottlieb et al. 1998; Ipata et al. 2006a; Thomas and Pare2007). In addition to this, our data have shown that this goaldirected activity is retained across multiple saccades within asingle trial. Second, LIP keeps track of what stimuli have beenexamined, marking them off as they are looked at (Dickinsonand Zelinsky 2005; Klein 1988; Thomas et al. 2006), byreducing the activity in response to those stimuli on the prioritymap. Consistent with previous findings, we also found thatactivity at the goal of the upcoming saccade was greater thanthe response to an identical stimulus with the same behavioralhistory that was not the goal of the saccade. These data areconsistent with the hypothesis that saccades are made to thepeak of activity in LIP (Ipata et al. 2006a; Thomas and Pare2007). These three effects can best be seen in Fig. 10, whichsummarizes the neural responses in LIP under all the mainstimulus and behavioral conditions.
Together, these data show that activity in LIP is sufficient toexplain efficient search and, when combined with the evidencethat activity in LIP may guide eye movements (Gnadt andAndersen 1988; Ipata et al. 2006a; Thomas and Pare 2007),suggest that LIP activity may play an active role in the visualsearch process. This conclusion is consistent with clinicalstudies that have found that patients with parietal lesions revisititems in cancellation or search tasks (Mannan et al. 2005; Zihl1995), indicating that the mechanism to keep search efficient,by keeping track of what items they have checked, has beenadversely affected.
An interesting feature of this result is that the reduction ofactivity to a previously fixated stimulus is essentially a form ofspatial short-term memory in which less information needs tobe stored as time progresses. Rather than making a second listof the potential targets and then marking and rememberingwhich have been fixated, the same map that guides the eyemovements can incorporate this memory by suppressing theactivity of objects that it deems are no longer potential targets.In this case, spatial memory itself presents much like a form oftop-down suppression. While the mechanism that drives thissuppression is not known, the most likely possibility is relatedto reward. Responses in LIP appear to be related to rewardprobability or expectancy under several behavioral conditions(Dorris and Glimcher 2004; Platt and Glimcher 1999; Sugrueet al. 2004). In our task, when the animal fixates a potentialtarget and is then not rewarded, he can deduce that the item hasno reward associated with it. This information would then beincorporated into the priority map activity by reducing theactivity representing the reward value of that item. We suggestthat this reduced activity does not quite reach the level seen inresponse to a distractor because of the extensive training theanimals have had in ignoring the distractors. This lower re-sponse may be indicative of another top-down signal that isdriven by overtraining, analogous to that seen when animalsare trained to ignore salient popout stimuli (Ipata et al. 2006b).
Although the responses to targets that had been fixated werereduced, we did not find a corresponding increase in responseto the remaining targets that had yet to be seen. Given that LIPresponses are known to incorporate reward information, wewere surprised to see that the responses to the remaining targetsdid not increase as the probability that they would yield areward increased. We interpret this result as suggesting thatthat reward probabilities across the entire visual scene are notupdated after each saccade; only stimuli that have been justfixated have their responses modulated. This provides a simpleand efficient mechanism for monitoring the world; once infor-mation is embedded in the map, it is shifted from neuron toneuron after eye movements by peri-saccadic remapping (Du-hamel et al. 1992) and remains relatively stable until an eventoccurs. Thus the only energy required to change information isthe suppression of the stimulus at fixation. Because we did notrecord the activity from any neurons with receptive fields at thefovea, we cannot ascertain when, during the fixation period, thesuppression may occur. Prior studies that have found LIPactivity related to reward value, utility, or expectancy (Dorrisand Glimcher 2004; Platt and Glimcher 1999; Sugrue et al.2004) have examined these responses across trials or blocks.We also found a resetting of the map at the beginning of eachtrial. We suggest that these events act as interrupts and reset therelevant locations on the map. This is also consistent with theupdating of decision information over time (Churchland et al.2008; Leon and Shadlen 2003; Roitman and Shadlen 2002;Yang and Shadlen 2007).
A minor proportion of the neurons we recorded from showedlittle response differences between conditions; these neuronstended to have low absolute responses to our stimuli. It hasbeen proposed that there may be two groups of neurons in LIP,those that are only spatially selective and those that are tunedfor both spatial location and a feature dimension (Ogawa andKomatsu 2009). If we assume that the neurons that play a rolein the priority map are the neurons that are only spatially tuned,
Distractors
0
1.5
Not the goal of the next saccade
The goal of the next saccade
Fixated Not fixated
0.5
Targets
1.0
Fixated Not fixated
Mea
n no
rmal
ized
resp
onse
FIG. 10. A summary of LIP activity in the foraging task. Mean normalizedresponses pooled across the two monkeys are shown for the 5 main stimulusconditions. Responses to targets are greatest if the stimulus is the goal of thenext saccade and are proportionally weaker if the stimulus has been previouslyfixated. Distractors elicited the weakest responses.
3489EFFICIENT SEARCH IN LIP
J Neurophysiol • VOL 102 • DECEMBER 2009 • www.jn.org
on January 12, 2010 jn.physiology.org
Dow
nloaded from
then we may be underestimating the pooled response on thepriority map by including the neurons that are not responsive toour stimuli. This concept is enticing, not only because itappears to enhance our effects but also because it unites theview of LIP as a priority map with studies that have seennonspatial responses, such as the encoding of directional in-formation (Fanini and Assad 2009), shape information (Serenoand Amador 2006; Sereno and Maunsell 1998), numericalinformation (Roitman et al. 2007), categorical information(Freedman and Assad 2006), and nonspatial information(Freedman and Assad 2009), in LIP.
The reduced responses we find to stimuli that have beenfixated are consistent with the mechanism included in saliencymap models of visual search to mark off what locations havealready been examined (Itti et al. 1998; Koch and Ullman1985). The designers of these models included the suppressionof locations that had already been attended based on thepsychophysical finding of inhibition of return (IOR)—a slow-ing down of reaction times at a location starting 300–500 msafter attention had been transiently allocated to that location(Klein 2000; Posner and Cohen 1984). This was thought of asa way of preferentially guiding attention to novel locations andis a mechanism that optimizes the allocation of attention, justas we have described optimizing the guidance of eye move-ments. Because it has been suggested that LIP plays a role inboth the allocation of covert attention (Bisley and Goldberg2003, 2006) and the guidance of saccades (Andersen andBuneo 2002; Gnadt and Andersen 1988; Ipata et al. 2006a;Thomas and Pare 2007), this mechanism provides a way for asingle area to help accomplish efficient search under bothcircumstances. Munoz and colleagues have suggested thatreaction times may be a function of the time it takes for newneural activity to reach a threshold, and under conditions inwhich IOR is seen, the suppression of activity creates a slowerneural response and thus slower reaction times (Dorris et al.2002; Fecteau and Munoz 2005). In this way, suppression ofactivity in LIP at a preattended location could explain thepsychophysical phenomenon of IOR and is consistent with thehypothesis that parietal cortex may play a role in this phenom-enon (Vivas et al. 2003).
It is worth noting that while we have focused on LIP, areassuch as the frontal eye field (FEF) and the superior colliculus(SC) have also been implicated in the allocation of attention(Cavanaugh and Wurtz 2004; Ignashchenkova et al. 2004;Moore et al. 2003) and, in particular, in visual search (Bus-chman and Miller 2007; McPeek and Keller 2002; Thompsonet al. 1996). Studies in the SC (Dorris et al. 2002; Fecteau andMunoz 2005) and FEF (Bichot and Schall 2002) have alsofound activity that is consistent with the slowing down ofreaction times at previously attended areas but have concludedthat these mechanisms are probably driven from other areas.LIP connects directly to both the SC and FEF (Andersen et al.1990) and thus may drive the modulations reported in theseareas.
A C K N O W L E D G M E N T S
We thank the Goldberg lab and J. Fuster, and D. Bernhardt-Walther forcomments on a previous version of this manuscript and the members of theUCLA DLAM for superb animal care.
G R A N T S
This work was supported by the Gerald Oppenheimer Family Foundation,the Kirchgessner Foundation, a Klingenstein Fellowship Award in the Neuro-sciences, an Alfred P. Sloan Foundation Research Fellowship, and NationalEye Institute Grant R01 EY019273-01.
R E F E R E N C E S
Andersen RA, Asanuma C, Essick G, Siegel RM. Corticocortical connec-tions of anatomically and physiologically defined subdivisions within theinferior parietal lobule. J Comp Neurol 296: 65–113, 1990.
Andersen RA, Buneo CA. Intentional maps in posterior parietal cortex. AnnuRev Neurosci 25: 189–220, 2002.
Arani T, Karwan MH, Drury CG. A variable-memory model of visualsearch. Hum Factors 26: 631–639, 1984.
Balan PF, Gottlieb J. Integration of exogenous input into a dynamic saliencemap revealed by perturbing attention. J Neurosci 26: 9239–9249, 2006.
Balan PF, Oristaglio J, Schneider DM, Gottlieb J. Neuronal correlates ofthe set-size effect in monkey lateral intraparietal area. PLoS Biol 6: e158,2008.
Barash S, Bracewell RM, Fogassi L, Gnadt JW, Andersen RA. Saccade-related activity in the lateral intraparietal area. I. Temporal properties;comparison with area 7a. J Neurophysiol 66: 1095–1108, 1991.
Bichot NP, Rossi AF, Desimone R. Parallel and serial neural mechanisms forvisual search in macaque area V4. Science 308: 529–534, 2005.
Bichot NP, Schall JD. Priming in macaque frontal cortex during popout visualsearch: feature-based facilitation and location-based inhibition of return.J Neurosci 22: 4675–4685, 2002.
Bisley JW, Goldberg ME. Neural correlates of attention and distractibility inthe lateral intraparietal area. J Neurophysiol 95: 1696–1717, 2006.
Bisley JW, Goldberg ME. Neuronal activity in the lateral intraparietal areaand spatial attention. Science 299: 81–86, 2003.
Bisley JW, Krishna BS, Goldberg ME. A rapid and precise on-response inposterior parietal cortex. J Neurosci 24: 1833–1838, 2004.
Buschman TJ, Miller EK. Top-down versus bottom-up control of attention inthe prefrontal and posterior parietal cortices. Science 315: 1860–1862, 2007.
Cavanaugh J, Wurtz RH. Subcortical modulation of attention counterschange blindness. J Neurosci 24: 11236–11243, 2004.
Churchland AK, Kiani R, Shadlen MN. Decision-making with multiplealternatives. Nat Neurosci 11: 693–702, 2008.
Colby CL, Duhamel JR, Goldberg ME. Visual, presaccadic, and cognitiveactivation of single neurons in monkey lateral intraparietal area. J Neuro-physiol 76: 2841–2852, 1996.
Dickinson CA, Zelinsky GJ. Marking rejected distractors: a gaze-contingenttechnique for measuring memory during search. Psychon Bull Rev 12:1120–1126, 2005.
Dorris MC, Glimcher PW. Activity in posterior parietal cortex is correlatedwith the relative subjective desirability of action. Neuron 44: 365–378,2004.
Dorris MC, Klein RM, Everling S, Munoz DP. Contribution of the primatesuperior colliculus to inhibition of return. J Cogn Neurosci 14: 1256–1263,2002.
Duhamel JR, Colby CL, Goldberg ME. The updating of the representationof visual space in parietal cortex by intended eye movements. Science 255:90–92, 1992.
Fanini A, Assad JA. Direction selectivity of neurons in the macaque lateralintraparietal area. J Neurophysiol 101: 289–305, 2009.
Fecteau JH, Munoz DP. Correlates of capture of attention and inhibition ofreturn across stages of visual processing. J Cogn Neurosci 17: 1714–1727,2005.
Fecteau JH, Munoz DP. Salience, relevance, and firing: a priority map fortarget selection. Trends Cogn Sci 10: 382–390, 2006.
Freedman DJ, Assad JA. Distinct encoding of spatial and nonspatial visualinformation in parietal cortex. J Neurosci 29: 5671–5680, 2009.
Freedman DJ, Assad JA. Experience-dependent representation of visualcategories in parietal cortex. Nature 443: 85–88, 2006.
Gnadt JW, Andersen RA. Memory related motor planning activity in pos-terior parietal cortex of macaque. Exp Brain Res 70: 216–220, 1988.
Gottlieb JP, Kusunoki M, Goldberg ME. The representation of visualsalience in monkey parietal cortex. Nature 391: 481–484, 1998.
Hays AV, Richmond BJ, Optican LM. Unix-based multiple-process system,for real-time data acquisition and control. WESCON Conf Proc 2: 1–10,1982.
3490 K. MIRPOUR, F. ARCIZET, W. S. ONG, AND J. W. BISLEY
J Neurophysiol • VOL 102 • DECEMBER 2009 • www.jn.org
on January 12, 2010 jn.physiology.org
Dow
nloaded from
Horowitz TS. Revisiting the variable memory model of visual search. VisCogn 14: 668–684, 2006.
Ignashchenkova A, Dicke PW, Haarmeier T, Thier P. Neuron-specificcontribution of the superior colliculus to overt and covert shifts of attention.Nat Neurosci 7: 56–64, 2004.
Ipata AE, Gee AL, Bisley JW, Goldberg ME. Neurons in the lateralintraparietal area create a priority map by the combination of disparatesignals. Exp Brain Res 192: 479–488, 2009.
Ipata AE, Gee AL, Goldberg ME, Bisley JW. Activity in the lateralintraparietal area predicts the goal and latency of saccades in a free-viewingvisual search task. J Neurosci 26: 3656–3661, 2006a.
Ipata AE, Gee AL, Gottlieb J, Bisley JW, Goldberg ME. LIP responses toa popout stimulus are reduced if it is overtly ignored. Nat Neurosci 9:1071–1076, 2006b.
Itti L, Koch C. A saliency-based search mechanism for overt and covert shiftsof visual attention. Vision Res 40: 1489–1506, 2000.
Itti L, Koch C. Computational modelling of visual attention. Nat Rev Neurosci2: 194–203, 2001.
Itti L, Koch C, Niebur E. A model of saliency-based visual attention for rapidscene analysis. IEEE Trans Pattern Anal Mach Intell 20: 1254–1259, 1998.
Julesz B. A brief outline of the texton theory of human vision. TrendsNeurosci 7: 41–48, 1984.
Klein R. Inhibitory tagging system facilitates visual search. Nature 334:430–431, 1988.
Klein RM. Inhibition of return. Trends Cogn Sci 4: 138–147, 2000.Koch C, Ullman S. Shifts in selective visual attention: towards the underlying
neural circuitry. Hum Neurobiol 4: 219–227, 1985.Leon MI, Shadlen MN. Representation of time by neurons in the posterior
parietal cortex of the macaque. Neuron 38: 317–327, 2003.Mannan SK, Mort DJ, Hodgson TL, Driver J, Kennard C, Husain M.
Revisiting previously searched locations in visual neglect: role of rightparietal and frontal lesions in misjudging old locations as new. J CognNeurosci 17: 340–354, 2005.
Mazer JA, Gallant JL. Goal-related activity in V4 during free viewing visualsearch. Evidence for a ventral stream visual salience map. Neuron 40:1241–1250, 2003.
McPeek RM, Keller EL. Saccade target selection in the superior colliculusduring a visual search task. J Neurophysiol 88: 2019–2034, 2002.
Moore T, Armstrong KM, Fallah M. Visuomotor origins of covert spatialattention. Neuron 40: 671–683, 2003.
Ogawa T, Komatsu H. Condition-dependent and condition-independent tar-get selection in the macaque posterior parietal cortex. J Neurophysiol 101:721–736, 2009.
Platt ML, Glimcher PW. Neural correlates of decision variables in parietalcortex. Nature 400: 233–238, 1999.
Posner MI, Cohen Y. Components of visual orienting. In: Attention andPerformance, edited by Bouma H, Bouwhuis D. Hillside, NJ: Erlbaum,1984, p. 531–556.
Roitman JD, Brannon EM, Platt ML. Monotonic coding of numerosity inmacaque lateral intraparietal area. PLoS Biol 5: e208, 2007.
Roitman JD, Shadlen MN. Response of neurons in the lateral intraparietalarea during a combined visual discrimination reaction time task. J Neurosci22: 9475–9489, 2002.
Serences JT, Yantis S. Selective visual attention and perceptual coherence.Trends Cogn Sci 10: 38–45, 2006.
Sereno AB, Amador SC. Attention and memory-related responses of neuronsin the lateral intraparietal area during spatial and shape-delayed match-to-sample tasks. J Neurophysiol 95: 1078–1098, 2006.
Sereno AB, Maunsell JH. Shape selectivity in primate lateral intraparietalcortex. Nature 395: 500–503, 1998.
Sommer MA. Express saccades elicited during visual scan in the monkey.Vision Res 34: 2023–2038, 1994.
Sugrue LP, Corrado GS, Newsome WT. Matching behavior and the repre-sentation of value in the parietal cortex. Science 304: 1782–1787, 2004.
Thomas LE, Ambinder MS, Hsieh B, Levinthal B, Crowell JA, Irwin DE,Kramer AF, Lleras A, Simons DJ, Wang RF. Fruitful visual search:inhibition of return in a virtual foraging task. Psychon Bull Rev 13:891–895, 2006.
Thomas NW, Pare M. Temporal processing of saccade targets in parietalcortex area LIP during visual search. J Neurophysiol 97: 942–947, 2007.
Thompson KG, Hanes DP, Bichot NP, Schall JD. Perceptual and motorprocessing stages identified in the activity of macaque frontal eye fieldneurons during visual search. J Neurophysiol 76: 4040–4055, 1996.
Treisman AM, Gelade G. A feature-integration theory of attention. CognitPsychol 12: 97–136, 1980.
Vivas AB, Humphreys GW, Fuentes LJ. Inhibitory processing followingdamage to the parietal lobe. Neuropsychologia 41: 1531–1540, 2003.
Yang T, Shadlen MN. Probabilistic reasoning by neurons. Nature 447:1075–1080, 2007.
Zihl J. Visual scanning behavior in patients with homonymous hemianopia.Neuropsychologia 33: 287–303, 1995.
3491EFFICIENT SEARCH IN LIP
J Neurophysiol • VOL 102 • DECEMBER 2009 • www.jn.org
on January 12, 2010 jn.physiology.org
Dow
nloaded from


![Fabrice Romelard [MVP] Intranet – Extranet CTO SGS](https://img.pdfslide.us/doc/110x75/56649d445503460f94a20350/fabrice-romelard-mvp-intranet-extranet-cto-sgs.jpg)