Embed Size (px)
Citation preview

KONICA MINOLTA HOLDINGS, INC.
ANNUAL REPORT 2008

Profile
Disclaimer regarding Forward-Looking StatementsThe plans, strategies and statements related to the outlook for future results in this document are in accordance with assumptions and beliefs deter mined by management based on currently available information. However, it should be noted that there is a possibility that actual results could differ significantly due to such factors as social and economic conditions.
Konica Minolta Holdings, Inc. was established in
August 2003 through the management integration
between Konica Corporation and Minolta Co.,
Ltd., creating a comprehensive imaging company.
The Konica Minolta Group is pursuing growth
by leveraging collective Group resources in the
two major business domains of equipment and
services, and components. The Group has annual
sales of more than ¥1 trillion, conducts business
operations in approximately 40 nations worldwide
and has approximately 32,000 employees. Based
on an underlying management principle of “New
Value Creation” and driven by the corporate mes-
sage of “the essentials of imaging”, the Konica
Minolta Group aims to provide inspired creativity
in the fi eld of imaging by becoming an innovative,
technologically sophisticated, reliable and market-
leading global company that is able to enhance
corporate value and respond to the expectations of
its stakeholders through corporate creativity.


2
Our Production Printing Business Strategies
4
21 3
Pursuing Brand Leadership in Production Printing
One goal of Konica Minolta’s genre-top strategy is to become the dominant brand in the promising
production printing field. We will reach that goal by cultivating advanced proprietary imaging
technologies and taking advantage of our industry-leading imaging, materials and paper-handling
technologies, market-driven product development, and our business base in the printing industry.

3
High-Accuracy Laser Exposure ControllerWe created a fully digital laser-driven pulse-width modulator that ensures high precision and fast output by controlling nanosecond laser unit pulses to deliver swift and stable four-color pixel writing.
Post-Processing System for Print-on-Demand ApplicationsWe have drawn on paper processing expertise from years in the production printing business to create numerous post-processing technologies, notably for saddle and side stitching, folding, hole punching, and booklet finishing. We are an industry—leading supplier of online post-processing systems.
High-Accuracy Laser Exposure Controller created a fully digital laser-driven pulse-width modulator that ensuresWe h precision and fast output by controlling nanosecond laser unit pulses ghhig
deliver swift and stable four-color pixel writing.dto d
Post-Processing System for Print-on-Demand Applications have drawn on paper processing expertise from years in the production printing business to create numerous We
st-processing technologies, notably for saddle and side stitching, folding, hole punching, and booklet finishing.posare an industrWe yrr —yy leading supplier of online post-processing systems.
Proprietary S.E.A.D. TechnologyOur Screen-Enhancing Active Digital Processing (S.E.A.D.), incorporates an application-specific integrated circuit to provide micron-level image control and optimally process images and text. S.E.A.D. employs technology to stabilize high-speed image quality, for results comparable to those of offset printers.
Pulverized Toner Polymerized Toner
Color material
Composition of Polymerized Toner
Wax
1
2
3
4
Proprietary S.E.A.D. TechnologyP r Screen-Enhancing Active Digital rOurcessing (S.E.A.D.), incorporates an ocPro
plication-specific integrated circuit to pappappvide micron-level image control and ovproimally process images and text. S.E.A.D.tioptploys technology to stabilize high-speed pempage quality, for results comparable to aimase of offset printers. stho
3
Polymerized TonerOur polymerized toner features the industry’s finest and most uniform particles to achieve highly defined image quality. Since the toner enhances low-temperature fusing, it reduces paper curls and buckling and increases paper-handling capability. In addition, this toner reduces environmental load comprehensively from production to end use.
High-Accuracy Laser Exposure Controller
Polygon mirror
Drum
Fθ Iens
Laser unit

Why We Are Focusing onthe Production Printing Market
What Is Production Printing?Production printing is a generic term referring to printing by high-speed digital printer. The term encompasses office printing, on-site internal corporate printing, commercial printing and what is called “digital press” in the offset printing industry. Production printing basically is about printing small jobs on demand, contrasting with the large runs that offset processes entail. It is also called POD, and both phrases refer essentially to the same thing. The main production printing users are print shops, copy service bureaus, and central reprographic departments (CRDs). The prime advantage of production printing are as follows. (1) short-run printing, (2) short turnaround printing, (3) variable data printing. These are the growth areas of the market.
The Production Printing MarketThis market was worth around ¥1 trillion in 2006, with in-house jobs accounting for about 70% of the total and commercial printing representing another 20%. We anticipate demand should reach ¥1.4 trillion by 2011. The value of commercial printing should surge from ¥195 billion in 2006, to ¥490 billion by 2011. We based these estimates on manufacturer shipments of units, cut-sheet, electrophotographic system and dry toner. Trends that enabled us to make such projections include growth in small job runs amid expansion in the direct marketing industry, increasing demand for short turnarounds, and rising in-house production in companies to safeguard information and streamline internal controls. We look for the mainstay color printing market to balloon from ¥440 billion in 2006 to ¥810 billion by 2011, while monochrome printing demand will likely remain fl at during that period. We can capture signifi cant new opportunities in the color market because of our highly competitive design and materials technologies, as well as our product development and marketing foundations.
Production Printing Market Estimateby Market Segment
0
5,00
1,000
1,500
06
95195
670
100490
810
07 08 09 10 11
(Cut-sheet / Based on manufacturer shipments)
Other
Corporate/in-house printing
Commercial printing
Source: Konica Minolta estimate
(Calendar years)
(Billions of Yen)
Production Printing Market EstimateColor vs. Monochrome
(Billions of Yen)
0
500
1,000
1,500
06 07 08 09 10 11
Source: Konica Minolta estimate
(Cut-sheet / Based on manufacturer shipments)
Color Monochrome
(Calendar years)
440
520
810
590
SECTION I
4

Business Trends and Competitive PositionOur unit sales in the key color production printing segment grew 10% year on year in the fi scal year ended March 2008, compared with a 4% rise in overall MFP sales and 20% year-on-year value growth. In terms of market share, we achieved high market shares in the fi scal year ended March 2008 in color production printing after fi rst entering this market in the fi scal year ended March 2004. We project a double-digit increase in unit shipments for the fi scal year ending March 2009, which would also drive demand for toner and other consumables. We intend to maintain and build our top market position and sustain growth by cultivating new sales channels and by continuing to collaborate with business partners.
Technological CompetitivenessKonica Minolta’s unique polymerized toner is an industry leader for its outstanding image quality, low noise, and fast output capabilities. Our production printing models incorporate diverse technologies that give us an excellent competitive edge. Our toner is perfect for production printing equipment because the particles are smooth and uniform and fuse at low temperatures, enabling copiers and printers to output quickly at high resolutions. The results are as natural as those from offset printing, notably in terms of uniform images, broad color gamuts, and low-gloss output due to oil-free fusing. On top of that, excellent fusing performance enables printing on everything from regular thin-coated papers to high-quality thick stock.
Our Strategies
Konica Minolta’s Production Printing Business Growth
New product introductions
Color
Monochrome
bizhub PRO 8050
bizhub PRO 1050
bizhub PRO C500 bizhub PRO C6500
bizhub PRO 1050ebizhub PRO 920
bizhub PRO C5500
08070605040
25
50
75
100(Fiscal years ended March)(Billions of Yen)
Expansionof toner
plant
Expansion of photo
conductorplant
SECTION II
0
10,000
20,000
+10%
+15%
Konica Minolta’s Production PrintingUnit Sales Growth
07 08 09Projection
(Fiscal years ended March)
(Units)
Note: Production printing sales amount for the fi scal year ended March 2004 is not available because this is the fi rst year we entered the market.
5

Another advantage of polymerized toner is that it results in 40% lower carbon dioxide emissions than pulverized toner and such emissions are reduced during the printing process around 30% because it fuses at lower temperatures. The particles of polymerized toner are fi ner than those of pulverized powder, for 30% less toner consumption and signifi cantly lower carbon dioxide emissions over product life cycles. There is no major competitors to our unique polymerized toner, for which we have a large number of patents pending—likely an industry record. Our advanced production technologies represent another prime advantage, and we aim to maintain our dominance. Our organic photoconductors, which employ the coating technologies we amassed in photo fi lms, are cost-competitive and safer than inorganic photoconductors and far more sensitive. Proprietary S.E.A.D. technology delivers high-precision printing and more stable image quality. It provides micron-level image control and optimally processes images and text to stabilize image quality even at high output speeds. Post-processing systems are vital for production printing. We have created numerous such technologies, notably for saddle and side stitching, folding, hole punching, and binding. We are an industry-leading supplier of post-processing systems. Our high-accuracy laser exposure controller enables fast and stable writing for all pixel colors, which has helped us greatly to increase the competitiveness of our color offerings. One feature of our production printing capabilities is that we draw on years of experience in the printing business to plan systems that we believe our customers need. Unlike our competitors, we are committed to offering products and services that help customers develop their business models. We will build brand dominance in production printing by employing our outstanding technologies and unique business concepts.
SECTION II
Polymerizedtoner
Pulverizedtoner
Comparison of Polymerized Toner and Pulverised Toner (Internal Test)
Advantages of Konica MinoltaPolymerized Toner
– Color Reproduction Range –
Polymerized toner Offset printing
Green
Magenta
Yellow Red
Cyan Blue
Shapes and Surface Composition
Polymerized toner Pulverized toner
6

Future StrategiesIn the years ahead, we will invest heavily to develop unparalleled technologies and improve our products. We have introduced a new polymerized toner that has more advanced features than our current product, expanding the color gamut and matching the bright and vivid reproduction of Super Video Graphic Array (SVGA) displays, one standard used for PC displays. Such a new toner delivers image quality in production printing on a par with offset printing, thereby enabling us to expand further in a printing industry where image quality is so crucial. We aim to expand our product range beyond the light production printing area to encompass the middle-to-heavy production printing area. We will use the marketing networks of both Graphic Imaging business and Business Technologies business to enhance synergies within the Group while reinforcing ties with external partners so that we can expand our lineup and marketing channels. Our global strategies will include using our alliance with the Netherlands-based Océ N.V., one of the top players in production printing, to strengthen our presence in Europe. We will reinforce sales in North America through Danka Office Imaging Company (DOIC), a leading seller of imaging equipment in the United States. That acquisition will enable us to increase market share to dominate the local production printing sector.
SECTION II
Two Key AlliancesIn April 2008, we concluded a strategic business alliance with Océ N.V., which is headquartered in Venlo, the Netherlands. This company has an array of high-speed printing technologies, and has built strong direct sales and service networks in the offi ce and production printing fi elds. The arrangement entails jointly developing fast monochrome and color models for the highly promising light and mid-range production printing segments. The sales strategy will be for us to provide Océ N.V. with all our offi ce multi-functional peripheral (MFP) product line on an OEM basis. Both sides will supply each other with production printing equipment for marketing through both brands and sales channels. The alliance will enable us to become an industry-leading equipment and software supplier in offi ce and printing production systems alike. In June 2008, we completed the acquisition of Danka Offi ce Imaging Company (DOIC) of St. Petersburg, Florida, U.S.A. We will employ DOIC’s impressive customer base and sales and support structure to boost our North American market share. The acquisi-tion will greatly expand our production printing sales force and accelerate efforts to strengthen that business area. We will also be able to use DOIC’s sales network to step up sales of our offi ce MFPs and printers. These moves in Europe and North America are part of what will be an even more concerted global drive in the years ahead to accelerate sustainable Group growth.
7

For the Year: Net sales Operating income Net income Capital expenditure R&D costs
At Year-End: Total assets Total net assets
¥1,027,630104,00672,54264,00072,142
¥ 951,052368,624
2008 2007
Millions of yen
Thousands ofU.S. dollars
(Note 1)
2008
Per Share of Common Stock: Net income—basic Net assets Cash dividends
¥136.67692.39
10
YenU.S. dollars
(Note 1)
Financial Ratios: Equity ratio Return on assets Return on equity
38.6% 11.221.9
Percent
Notes: 1. U.S. dollar amounts above and elsewhere in this report for the Company are translated from yen, for convenience only, at the rate of ¥100.19=US$1, the approximate exchange rate prevailing at March 31, 2008. 2. Equity ratio = (Total net assets – minority interests – share subscription rights) ÷ total assets × 100 (%) Return on assets = (Operating income + interest and dividend income) ÷ average total assets × 100 (%) Return on equity = Net income ÷ average (total net assets – minority interests – share subscription rights) × 100 (%)
* Supported by favorable growth in the main Business Technologies and Optics businesses, operating income increased 15.0% year on year and operating income ratio improved 1.1 percentage points to 11.2% as operating income recorded a new historical high.
¥1,071,568119,606
68,82975,29581,370
¥ 970,538418,310
$10,695,3591,193,792
686,985751,522812,157
$9,686,9754,175,167
¥129.71786.20
15
43.0% 12.7 17.5
*
Consolidated Financial HighlightsKonica Minolta Holdings, Inc. and Consolidated SubsidiariesFor the fiscal years ended March 31, 2008 and 2007
$1.297.850.15
8

Our Production Printing Business Strategies1
Consolidated Financial Highlights8
To Our Shareholders11
Update on FORWARD 0814
At a Glance17
Business Technologies18
Optics20
Medical and Graphic Imaging22
Sensing24
Industrial Inkjet25
Corporate Social Responsibility (CSR)26
Corporate Governance28
Financial Section29
The Konica Minolta Group56
Board of Directors and Executive Officers58
Corporate Data58
Investor Information59


10
Yoshikatsu OtaPresident and CEO

11
FORWARD 08 Progressing Well
We started a new growth phase with our FORWARD 08 medium-term management plan. In the fiscal year ended March 2008, we
reached the consolidated earnings targets of this three-year initiative a year ahead of schedule.
Sales of our core Business Technologies business advanced 6.4%, to ¥701.0 billion, with operating income climbing 12.6%, to ¥90.1
billion. Optics business sales were up 31.2%, to ¥182.3 billion; operating income gained 48.8%, to ¥31.3 billion.
As a result, consolidated net sales for the period under review came to ¥1,071.6 billion, up 4.3% year on year despite the ¥47.8
billion negative impact on sales from our exit from the Photo Imaging business. Consequently, we posted operating income of ¥119.6
billion, up 15.0% year on year and a record high for the third consecutive period.
Genre-Top Strategy Bears Fruit
As part of FORWARD 08, which we announced in May 2006, we have deployed groupwide operations that harness our genre-top
strategy. This strategy entails concentrating management resources on potential growth markets and business fields to boost our
competitiveness, achieving greater growth than our competitors and earning a top position in the market.
Genre-top priorities in the Business Technologies business are color multi-functional peripherals (MFPs) for general office use and
production printing models. We have reinforced our capabilities in these areas, which have excellent growth potential. We differentiated
ourselves from the outset by equipping our offerings with tandem engines and accumulated production technologies, thus winning top
marks from customers for consistent quality. At the same time, we have optimally sited production while stepping up local procurement
to hone our cost-competitiveness.
Image quality is a key differentiator, and we were accordingly swift to employ polymerized toner across our color and production
printing lineups. We are constantly refining our polymerized toner technologies as we pursue world-class performance in terms of
low-temperature fusing, color reproduction, and minimal environmental impact. On top of that, we have upgraded manufacturing
facilities to achieve industry-leading toner production capacity.
11
To Our Shareholders

12
Operating incomeOperating income ratio (%)
2006 2007 2008
Net Sales(Billions of Yen)
1,068.4 1,027.6 1,071.6
2006 2007 2008
Net Income (Loss)(Billions of Yen)
72.5
(54.3)
68.8
Total assetsEquity*Equity ratio (%)
* Equity = Total net assets – minority interests – share subscription rights
2006 2007 2008
Total Assets, Equityand Equity Ratio
(Billions of Yen)
293.8
951.1944.1
367.5
970.5
417.2
2006 2007 2008
Operating Income and Operating Income Ratio
(Billions of Yen)
83.4
7.8
104.0
10.111.2
119.6
31.138.6
43.0

13
The genre-top strategy has enabled us to lead our competitors by helping us to refine proprietary technologies, bring out outstanding
competitive offerings, and expand the installed base of color and high-speed MFPs.
The genre-top strategy drives progress in the Optics business. We have drawn on our advanced thin-film technologies to commer-
cialize second- and third-generation triacetyl cellulose (TAC) film for vertical allignment (VA) mode LCDs and boost our market share in
TAC films. We dominate the market for next-generation DVD pickup lenses. Our market share is surging in glass hard disk substrates
using perpendicular magnetic recording system.
These examples underscore our determination to target and dominate growth markets by continuing to outpace our competitors in
commercializing outstanding products and services. The genre-top strategy offers tremendous value and potential. I believe that the
consistent accumulation of solid genre-top positions in various markets will transform our positioning in the industry.
Other key Group management priorities in the drive to raise our market and customer presences are growth, change and speed.
Focusing on these keywords, we will further promote Group management and raise our presence in the marketplace and with
customers. We are confident that we can create new corporate value by building a unique position.
Dividend Policy
We recognize enhancing shareholder value as an important management issue. Raising our dividend steadily in line with increases in
corporate performance, we raised dividends for the fiscal year ended March 2008 by ¥5 per share compared to the previous fiscal year,
to ¥15 per share. We target a payout ratio of at least 25% over the medium to long term. We set dividends from retained earnings
from the basic standpoint of maintaining a steady payout to shareholders, taking into overall consideration of consolidated operating
performance and strategic investment in growth fields. Going forward, we aim to maximize Group growth and corporate value.
Emphasizing Environmental Management
We cannot expand without considering the environment, which is an important global issue. Management’s commitment to creating
new value goes well beyond product innovation. We believe that our mission as a manufacturer is to create offerings that excel in terms
of environmental performance.
Working together as a group, we proactively pursue product development and manufacturing that conserve energy and resource use,
as well as promote green procurement. Furthermore, through groupwide efforts, we aim to reduce emissions, promote the reuse of
resources and lower the generation of hazardous substances. In these endeavors, we aim to be in the top class of our industry.
Looking Ahead
Management will complete FORWARD 08 in the fiscal year ending March 2009, ensuring that it achieves all action plans speedily to
fuel concentrated groupwide efforts to maintain and accelerate sustainable growth. I look forward to your ongoing understanding and
support as we move ahead.
June 2008
Yoshikatsu Ota
President and CEO

14
Update on FORWARD 08
Basic Policies
(1) Promote growth by leveraging collective
Group resources
(2) Build a new corporate image
(3) Promote world-class CSR management
FORWARD 08 Achievements in the Fiscal Year
Ended March 2008
In the fiscal year ended March 2008, the second year
of this initiative, our Business Technologies and Optics
businesses achieved excellent performance on the
strength of strategic investments and business efforts.
Consolidated operating income was ¥119.6 billion,
comfortably exceeding the targets of ¥110.0 billion
that we originally set for the fiscal year ending March
2009, the last year of the plan.
We overhauled FORWARD 08 in April 2007 to
ensure that we could reach our objectives and accel-
erate ongoing expansion. We set short-, medium-, and
long-term priorities for each business area and swiftly
executed action plans.
In Business Technologies business, where we are
making groupwide efforts under our genre-top
strategy, we strengthened competitiveness by launch-
ing five new color MFPs for general office use and
one production printing model during the term.
We acquired leading German and U.S. MFP deal-
ers in September and November 2007, respectively,
to bolster our genre-top strategy. In April 2008, we
entered into a strategic partnership with Océ N.V., a
leader in the European production printing market,
to solidify our regional foundations. In June 2008, we
completed the acquisition of Danka Office Imaging
Company (DOIC) in the United States to enhance sales
and market share as part of efforts to accelerate our
ongoing expansion.
In Optics business, we began operating a fifth TAC
film plant in Kobe, Japan in November 2007 to take
advantage of rising LCD demand, which helped us to
increase our market share for TAC film with viewing
angle expansion function and other high- performance
products for VA mode LCDs. Sales have been solid
for high-end products, including optical pickup lenses
for next- generation DVDs. We have won accolades
for our glass hard disk substrates that have particular
com patibility with perpendicular magnetic recording
systems, to which the market is shifting, and are
Konica Minolta deployed FORWARD 08, a three-year
medium-team business plan started in April 2006 to maximize
new added value in its businesses and optimize its corporate value.

15
expanding sales in this field. Responding to such
rising demand, we augmented production capacity
by building a plant in Malaysia in February 2008. We
consolidated optical technology development at our
Osakasayama site in Osaka in April 2008 to promote
effective development systems.
In the Medical and Graphic Imaging business, we
are cultivating compact and easy-to-operate computed
radiography and peripheral systems and solutions that
promote digitally based medical care at clinics.
Future FORWARD 08 Endeavors
Our next essential growth step will be derived from
our Business Technologies and Optics business base
and technological foundations, so that we can expand
into peripheral fields.
Specific efforts in Business Technologies business
will be to offer advanced services beyond equipment
sales solutions. In Optics business, we will optimize
production capacity in TAC films, glass hard disk
substrates, and next-generation optical pickup lenses
in a timely manner. We will strengthen our digital
X-ray image input/output systems in the Medical and
Graphic Imaging business.
In terms of initiatives in new fields of business, we
plan to enter the promising lighting business in 2010,
drawing on our organic electroluminescence (EL) tech-
nologies and a partnership with the General Electric
Company. We also foster new earnings sources, notably
by using atmospheric pressure glow plasma technolo-
gies to enhance our film coating capabilities and by
applying Super Inkjet technology to industrial products.
Strengthening Financials to Support
FORWARD 08 Growth Strategies
Free cash flow for the fiscal year ended March 2008
was ¥46.2 billion, up ¥35.9 billion compared to the
previous fiscal year, on the strength of record earnings.
We continued to lower interest-bearing debt, which
was ¥226.0 billion at year-end, down ¥3.3 billion
compared to the previous fiscal year. The equity ratio
was 43.0% at the close of the term.
Capital investment will remain essential to strength-
ening our development, manufacturing, and market-
ing capabilities, so that we can pursue sustainable
growth. We will further enhance our financial position
to help fund these efforts.

16
(Fiscal Years Ended/Ending March)
Projection
Business Technologies
Optics
Medical and Graphic Imaging
Other
Segment Total
2008 20092007
Performance Targets by Business Segment
(Billions of Yen)
Net sales
Operating income
Net sales
Operating income
Net sales
Operating income
Net sales
Operating income
Net sales
Operating income
Net sales
Operating income (loss)
Net sales
Operating income
PlanActualPlanActualPlan
¥ 700.0
80.0
185.0
30.0
180.0
12.0
26.0
4.0
1,091.0
126.0
9.0
(16.0)
1,100.0
110.0
¥ 720.0
94.0
210.0
33.0
150.0
5.0
20.0
2.5
1,100.0
134.5
10.0
(14.5)
1,110.0
120.0
¥ 701.0
90.1
182.3
31.3
161.1
7.8
16.8
2.1
1,061.2
131.2
10.4
(11.6)
1,071.6
119.6
¥ 670.0
73.0
155.0
24.0
165.0
10.0
22.0
3.2
1,012.0
110.2
8.0
(18.2)
1,020.0
92.0
¥ 658.7
80.0
139.0
21.0
158.7
8.9
16.0
2.9
972.3
112.8
55.3
(8.8)
1,027.6
104.0
¥640.0
69.0
130.0
20.0
155.0
8.5
17.0
3.0
942.0
100.5
38.0
(20.5)
980.0
80.0
Holdings, Others, Eliminations and Corporate
Group Total
Net Sales
(Billions of Yen)
Operating Income (Loss)
(Billions of Yen)
Holdings, Others
Other
Optics
Medical andGraphic Imaging
BusinessTechnologies
ActualPlan
2007
ActualPlan
2008
Projec-tionPlan
2009
ActualPlan
2007
ActualPlan
2008
Projec-tionPlan
2009
0 –50
150
100
50
0300
600
900
1,200
Notes: 1. Other includes Sensing and Industrial Inkjet businesses. 2. Holdings, Others, Eliminations and Corporate in 2007 includes Photo Imaging business.

17
At a Glance
Business Technologies
Optics
Medical and Graphic Imaging
Sensing
Main Products: MFPs, LBPs, facsimile machines, consumables,
software, system solutions, service
Main Products: Optical pickup lenses, lens units, microcamera
units, TAC film for LCD, glass substrates for hard disks
Main Products: X-ray image processing systems, X-ray film,
contrast media for diagnostic purposes, digital color proofing
systems, graphic film
Main Products: 3-D digitizers; color, and light measuring
instruments, medical measuring instruments
Industrial Inkjet
Main Products: Industrial inkjet heads, consumables,
textile printers and others
1.1%0.6%0.9%
Sales Composition(Fiscal Year Ended March 2008)
Net Sales by Geographical Region(Fiscal Year Ended March 2008)
BusinessTechnologiesOptics
SensingIndustrial Inkjet
Medical andGraphic Imaging
Others
Japan
North America
Europe
Asia,Other
Net Sales(Billions of Yen)
564.
8
26.9%
29.1% 22.9%
21.0%
65.4%17.0%
15.0%
Net Sales(Billions of Yen)
91.7
110.
4
139.
0
Net Sales(Billions of Yen)
Net Sales(Billions of Yen)
Net Sales(Billions of Yen)
129.
9
146.
6
158.
7
5.3
625.
885
.812
0.9
8.0
5.8
10.0
0.8
4.4
6.0
701.
018
2.3
161.
19.
96.
9
606.
7
658.
7
04 05 06 07 08
04 05 06 07 08
04 05 06 07 08
04 05 06 07 08
04 05 06 07 08

In the fiscal year ended March
2008, concerted efforts enabled us
to significantly increase sales in the
expanding domestic and international
markets for color MFPs for general
offices. We consequently posted
record segment operating income.
Akio KitaniPresidentKonica Minolta Business Technologies, Inc.
18
19
Business Technologies
Under our genre-top strategy, one key focus was to boost sales
of color MFPs for general offices. Another priority was to raise
production printing sales for the internal printing departments
of large companies and commercial digital printing companies.
We bolstered our range of highly competitive offerings by
releasing five bizhub color MFP models for the general office
market and one bizhub PRO color model for production printing.
The U.S. market began slowing down in the second half of the
term because of the subprime mortgage woes. Nonetheless, we
maintained a high unit sales growth rate in color MFPs. Sales
were similarly solid in Europe and other regions.
In September and November 2007, we acquired leading
dealers in Germany and the United States, respectively.
As a result of these factors, we achieved favorable sales of color
MFPs worldwide for general offices and maintained our ranking in
the top group in the core European and American markets.
We are prioritizing production printing because of the high
growth potential of this area. The main target customers for
these systems are the internal printing departments of large
companies and commercial digital printing companies. We aug-
mented the popular bizhub PRO C6500 with the bizhub PRO
C5500, a new high-speed color MFP.
We concluded a strategic partnership with Europe’s Océ N.V.,
which has outstanding technological capabilities and experience,
as part of a global strategy of solidifying our position in growth
markets. We additionally acquired Danka Office Imaging
Company (DOIC) to harness its broad marketing channels and
top-quality customer base in the United States.
In the laser printer segment, we merged printer and MFP
sales companies in Europe and United States, and worked to
strengthen our sales organization for general office-use products
as we emphasized sales in the general office segment where
print volume growth is expected.
Business Technologies net sales thus rose 6.4%, to ¥701.0
billion. Operating income gained 12.6%, to a record-high level
of ¥90.1 billion.
We will continue to expand our sales channels in the current
fiscal year to maintain growth in color MFP and production
printing operations. We will keep striving in line with our genre-
top strategy to retain our shares of the European and American
markets for color MFPs for general offices and dominate in the
expanding production printing field.
We aim to boost sales to office users of color laser printers
by promoting the building of high-quality machine-in-the-field
(MIF), where print volume growth is expected.
Net Sales(Billions of Yen)
04 05 06 07 08 04 05 06 07 08
625.
8
564.
8
606.
7
658.
7
701.
0
Operating Income(Billions of Yen)
62.9
55.8 65
.1
80.0 90
.1
Color MFP for general officesbizhub C550
Combined productivity and modern design Color LBP magicolor 4650DN
New model of production printing bizhub PRO C6501

Takashi MatsumaruPresidentKonica Minolta Opto, Inc.
In the fiscal year ended March
2008, we generated solid sales
of viewing angle expansion films
for large-screen LCD televisions
and optical pickup lenses for
next-generation DVDs and
strove to bolster production
capacity. Segment sales
and earnings outstripped
projections to reach
new highs.
20

21
Optics
Sales increased on the strength of a recovery in demand for
display materials, notably TAC films used in large-screen LCD
televisions. High-value-added TAC films with viewing angle
expansion function were key sales drivers. We commercialized
several TAC films for VA mode to serve the growing market for
large-screen LCD televisions. In November 2007, we boosted
capacity by starting operations at our fifth TAC film plant,
enabling us to raise market share in retardation films for VA
mode LCD panels.
Core memory devices are optical pickup lenses, which
contributed significantly to earnings through favorable sales
for next-generation DVD formats. These lenses incorporate our
industry-leading optical and precision engineering, and other
advanced technologies, helping us to maintain our dominant
market position.
Despite customers’ inventory adjustments in the first half of
the term, sales of glass hard disk substrates were solid, reflect-
ing a demand recovery in the second half and high marks for
compatibility with perpendicular magnetic recording systems.
We expanded production capacity in December 2007 by starting
operations at a Malaysian factory.
In our digital camera lens unit business, we increased ship-
ments of high-zoom lenses, which harness our superior optical
technologies. Sales of components for camera-equipped mobile
phones rocketed because we were able to satisfy demand for
high-end lenses, contributing to our business expansion.
As a result of these factors, Optics business net sales rose
31.2%, to ¥182.3 billion, with operating income increasing
48.8%, year on year to ¥31.3 billion.
In order to further solidify our positions in the core TAC film
and pickup lens markets, we increased TAC film production
capacity in June 2008 by starting operations at our sixth plant.
At the same time, we are working to boost productivity in
other businesses.
Our new Osakasayama site in Osaka houses all western Japan
optical, mechanical design, and production engineers; they used
to work at sites around the region. We will use the synergies of
these people to cultivate operations by enhancing our develop-
ment and manufacturing technologies, creating high-precision
products, and improving productivity.
We will continue to comprehensively reinforce our Optics
business to become a dominant company.
Net Sales(Billions of Yen)
85.8
91.7 11
0.4 13
9.0
182.
3
Operating Income(Billions of Yen)
15.3
16.0 17
.6 21.0
31.3
04 05 06 07 08 04 05 06 07 08
Takashi MatsumaruPresidentKonica Minolta Opto, Inc.
Glass hard disk substratesTAC film production process Optical pickup lenses for next-generation DVDs
Lens unit for camera-equipped mobile phones

22
Kiyofumi TanidaPresidentKonica Minolta Medical & Graphic, Inc.
We steadily increased domestic sales
of digital medical equipment in fiscal
year ended March 2008, offsetting
sluggish demand for X-ray film in
the trend of digitization. Operating
profit declined, however,
because of higher spending
on digital equipment
R&D and surging
silver costs.

23
Medical and Graphic Imaging
During the term in the medical/healthcare field, we strove to
expand sales of digital diagnostic imaging business in response
to digitization and networking at medical facilities. In June
2007, we marketed the REGIUS MODEL 110 for clinics and
other small sites. Key advantages of this computed radiog-
raphy system are that it is compact and simple to operate.
We simultaneously launched REGIUS Unitea (ImagePilot out-
side Japan), a peripheral system that integrates imaging and
filing capabilities. Demand stagnated for X-ray film, while
sales of digital equipment were favorable in addition to the
REGIUS series.
In the graphic imaging field, we strengthened sales of digital
printing systems in line with the market’s shift to digital processes.
We focused on domestically and internationally marketing on-
demand printing systems for short-run printing that incorporate
proprietary raster image processor technology.
Net sales for the year for the Medical and Graphic Imaging
business thus advanced 1.5%, to ¥161.1 billion. Operating
income dropped 12.4%, to ¥7.8 billion, however, owing to an
increase in R&D expenditure for digital equipment and much
higher silver costs.
We intend to focus our business on digital equipment and
solutions as the market shifts from films. We will further expand
sales of digital equipment, particularly the REGIUS MODEL 110
and REGIUS Unitea (ImagePilot outside Japan).
Net Sales(Billions of Yen)
120.
9
129.
9
146.
6
158.
7
161.
1
Operating Income(Billions of Yen)
7.9
6.7
11.7
8.9
7.8
04 05 06 07 08 04 05 06 07 08
Manmography systemREGIUS PureView Type-M
On-demand printing system Pagemaster Pro 6500 (Outside Japan: LD-6500)
X-ray image readerREGIUS MODEL 110
All-in-one console/viewer/ filing system REGIUS Unitea (Outside Japan: ImagePilot)

24
Sensing
During the year, we met diverse customer needs by provid-
ing products that harness our patented optical measurement
technologies. They included instruments for measuring color,
luminance, and intensity, as well as blood oxygen, jaundice, and
3D shapes.
Sales of the core color measurement business were solid
because of the favorable receptions of new products. They
included the CS-2000 spectroradiometer, which very precisely
measures display contrasts for the growing LCD and plasma
We commercialized several new colorimetric, object color, and 3D measurement instruments
in the fiscal year ended March 2008, and set about boosting our competitiveness in such
mainstay businesses.
Net Sales(Billions of Yen)
8.0
5.3 5.
8
10.0
9.9
Operating Income(Billions of Yen)
04 05 06 07 08 04 05 06 07 08
1.8
1.6
1.9
1.6
1.2
television markets. Also contributing to performance were the
new CM-700d/600d spectrophotometers for color management
in various industries.
We stepped up sales of 3D measuring instruments, including
the RANGE7 noncontact digitizer for industrial and academic
applications.
Net sales for the Sensing business were almost unchanged, at
¥9.9 billion. Operating income declined 26.2%, to ¥1.2 billion.
World’s top level capability to detect extremely low luminanceSpectroradiometer CS-2000
Compact and portable color measuring instrument Spectrophotometer CM-700d/600d
Non-contact 3D digitizerKONICA MINOLTA RANGE7
25
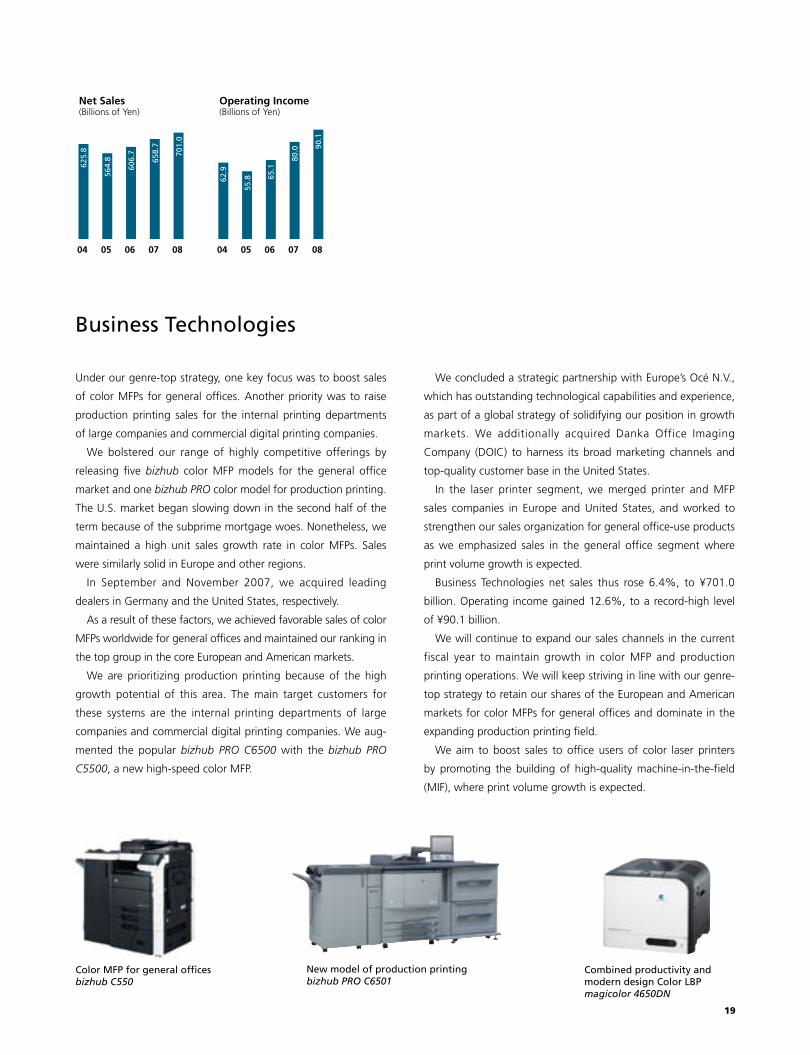
Industrial Inkjet
In the year under review, we focused on marketing high-
definition printer heads and printers to leading printer
manufacturers. These offerings employ proprietary inkjet and
ink technologies.
Domestic sales of ink were favorable because demand rose
steadily for high-definition printer heads. We won orders from
several major Chinese printer manufacturers for large outdoor
advertisement printers. We also developed new customers in
Europe, which helped us to boost sales of high-definition printer
heads and textile printers.
Net sales for the Industrial Inkjet business increased 15.4%,
to ¥6.9 billion, although operating income fell 31.8%, to ¥0.9
billion.
We cultivated new customers in China and Europe during the year to expand our industrial
inkjet business.
Net Sales(Billions of Yen)
0.8
4.4
6.0
6.9
Operating Income(Billions of Yen)
0.2
0.9
1.3
0.9
04 05 06 07 08 04 05 06 07 08
A high-resolution monochrome inkjet print unit SP-M0320HR
The digital ink jet textile printer system Nassenger V

26
Corporate Social Responsibility (CSR)
Basic Concepts
CSR activities underpin Group management, which honors a philosophy of creating new value and the spirit of the Konica
Minolta Group Charter of Corporate Behavior. That document defines our relationships with communities and how we can
change to better contribute to society. A fundamental goal of the charter, which champions creating new value, is to ensure
that the Group engages in CSR activities that make it vital to a sustainable society with collective groupwide efforts.
Prioritizing the Environment
Environmental preservation is a prime CSR focus. Indeed, we cannot expand without addressing this important global issue.
The primary concept of our product design is to employ energy and resources conservation ideas. In production, our mission
is to minimize the energy consumption of our plants. We champion green purchasing, collaborating with suppliers to eliminate
hazardous chemical substances from parts.
Our dedication to innovations that offer outstanding environmentally conceived performance translates into MFPs that mini-
mize electric power consumption and the new organic electroluminescent lightning system based on our proprietary environ-
mental technologies.
All Group activities are in line with a drive to become the industry leader by making consistent efforts in strengthening
the environmental and quality fundamentals as a manufacturing while cutting waste, reusing resources, and emitting fewer
hazardous substances.
Environmental Protection
Energy Conservation Prize
The bizhub C650/C550 color MFPs won Director General Prize in the 18th Energy
Conservation Awards for 2007 of Japan’s Agency for Natural Resources and
Energy. We released those models earlier that year. Their key environmental features
include an inductive-heating fusing process to shorten warmups and reduce standby
power consumption and our new polymerized toner, which fuses at lower temperatures.
Blue Angel Certification
We have worked assiduously to clear Germany’s Blue Angel standards, which set stringent
standards on levels of noise, vibration and volatile organic compounds emitted by prod-
ucts during use. Despite the introduction of increasingly strict standards, machines in the
bizhub series received Blue Angel certification in the fiscal year ended March 2008, the
best record in our industry.
Pursuing world-class corporate social responsibility management is a key tenet of Konica Minolta’s FORWARD 08 initiative.
We have accordingly undertaken ongoing efforts from economic, social, and environmental perspectives to ensure sustain-
able Group growth while earning society’s trust.
Highlights for the Fiscal Year Ended March 2008
FTSE4Good Global Index
Konica Minolta Holdings has been a consecutive constituent of the FTSE4Good Global
index as of June 2008, an index used by CSR and sustainability-conscious investors as well
as SRI (Socially Responsible Investment) funds, since being first chosen in March 2003.
What is FTSE4Good Global?
The FTSE4Good Index Series has been designed by FTSE International, an independent company
jointly owned by the U.K. newspaper The Financial Times and the London Stock Exchange, to mea-
sure the performance of companies that meet globally recognized corporate responsibility standards
from three perspectives—the environment, society, and human rights. Currently, approximately 900
companies have been included in this Index.

27
Preventing Global Warming
Our efforts to help prevent global warming include a worldwide initiative that we
deployed to comprehensively reduce carbon dioxide emissions throughout product life-
cycle to 80% of the level of the fiscal year ended March 2001 by the fiscal year ending
March 2011. Cuts would encompass production, logistics, and customer usage emissions.
For the fiscal year ended March 2008, such carbon dioxide emissions were 582,000
metric tons, or 21.7% less than in the fiscal year ended March 2001.
Zero-Waste Initiatives
In production, our efforts seek to recycle wastes and minimize landfill. All our plants in
Japan fulfilled the Level 2 zero-waste criteria in the fiscal year ended March 2008. Three
Chinese production sites satisfied Level 1 requirements. They included Konica Minolta
Opto (SHANGHAI) Co., Ltd., which by January 2008 raised its resource recovery rate to
97% and trimmed the final disposal rate to 3%.
Zero-Waste Criteria
Level 1: Resource recovery rate: Over 90%
Final disposal rate: Less than 5% (including secondary residue)
Cost reduction: Over 90% reduction in external payments
(from fiscal year ended March 1999 levels)
Level 2: Reduce volume of waste externally disposed of by 30% per sales unit
(from fiscal year ended March 2002 levels)
Contribution to Society
Helping Protect Red-Crowned Cranes
We have assisted the Tsurui Ito Red-Crowned Crane Sanctuary since the Wild Bird Society
of Japan established it in 1987.
Establishing Colorful Tomorrow Foundation
Konica Minolta Business Solutions U.S.A., Inc. established the non-
profit Konica Minolta Colorful Tomorrow Foundation in February
2007 to raise funds for community groups and projects around the
United States, including youth education initiatives.
Reductionin total
ProductsKonica Minolta
Production
ProductsTruck, ship, airplane, railway
Logistics
ProductsCustomer
Usage
CO2 Reduction at the Product Life Cycle
CO2
CO2
CO2
Inspection of the site by CSR Officer
Konica Minolta Colorful Tomorrow Foundation supports students of “McDonogh15 School”
Charity photo contest 2007 Excellence Award

28
Priorizing corporate governance as an important management
matter, Konica Minolta has separated management supervision
and execution while reinforcing these roles to ensure fairness,
transparency, and efficiency.
We separated oversight and implementation by deploying
a company-with-committees system that includes the Audit,
Nominating, and Compensation committees, which are integral
to the Board of Directors. These bodies help us operate more
transparently and fairly and accelerate decision-making.
We have seven non-executive directors on the 13-person
Board to ensure proper supervision. These directors include four
outside directors. Of the three internal non-executive directors,
two also serve on committees and the third chairs the Board.
The other six Board members have executive positions, including
the President and CEO, executive officers in charge of corpo-
rate strategy, accounting and finance, technology strategy, and
compliance, and the Group’s largest operating company.
All committee chairs are outside directors, rounding out a very
advanced and transparent governance structure. Attendance
among the four outside directors at the 12 Board meetings and
three committees in the fiscal year ended March 2008 averaged
more than 90%.
The Nominating Committee chooses outside director
nominees for the Board, assessing their professional records
and visions, ensuring that they have done no material busi-
ness with the Group and are strictly independent from the
Company. Other requirements are that candidates can devote
sufficient time to Board and committee duties. The Nominating
Committee’s rules encompass independence standards for
outside directors and a principle limiting their terms.
We have nominated outside directors with top corporate
management experience to date, as we consider such people
ideal for monitoring executives and for being able to make
important management decisions on the Board.
The Compensation Committee maintains a system for direc-
tors and executive officers to attract and retain talented people
and better motivate them to consistently improve results over
the medium and long terms to satisfy shareholders and opti-
mize Group value. Inside director compensation comprises
base salary and stock compensation to encourage long-term
performance. The remuneration of outside directors is base
salary only. Executive officer incentives intentionally exceed
the average for Japanese companies. The target composition
of executive officer packages is 60% in base salary, 20% in
short-term performance-based cash bonus, and 20% in stock
compensation. We maintain a guideline on own shareholdings
for internal directors and executive officers.
The Audit Committee evaluates whether executive man-
agement decisions are legal and efficient, reviews internal
control systems, and assesses and chooses accounting auditors.
The Audit Committee Office provides assistance and functions
as a secretariat.
The Corporate Audit Division, Risk Management Committee,
and Compliance Committee are integral to the internal control
system. Each body reports regularly to the Audit Committee.
Each must swiftly inform the committee of pressing issues
and responses and otherwise act at the committee’s behest.
The Audit Committee can send representatives to executive
meetings or other key gatherings. Those people can request
executive officers overseeing the Corporate Audit Division,
Risk Management Committee, and Compliance Committee to
conduct research or prepare reports.
Company auditors at all Group business companies and
common function companies keep in close contact with the
work of the Audit Committee.
The Audit Committee, Corporate Audit Division, and all the
other company auditors collaborate to improve their quality and
efficiency without compromising their independence.
After completing company internal auditing, the Corporate
Audit Division sends its audit report to the CEO and the Audit
Committee. The Audit Committee, the Corporate Audit Division,
and company auditors convene a quarterly Konica Minolta Group
Audit Liaison Conference to share information, knowledge, and
experiences to enhance auditing accuracy.
The Audit Committee can require the Corporate Audit Division
to audit a specific subject.
We instituted the Konica Minolta Group Compliance
Guidelines to ensure adherence to laws, regulations, corpo-
rate ethics and internal regulations in all business activities,
thereby boosting corporate value and securing stakeholder
trust. We also have in place a compliance officer and supporting
department, maintain a Compliance Committee, and set up a
Group compliance hotline.
Other initiatives to ensure transparent governance and
improve corporate and shareholder value include directors’
annual reviews of all Board and committee activities and discus-
sions between outside directors, the Chairman of the Board,
and the President and CEO.
Corporate Governance

Financial Section
29
Consolidated Financial Review30
Intellectual Property Update34
Consolidated Balance Sheets38
Consolidated Statements of Income40
Consolidated Statements of Changes in Net Assets41
Consolidated Statements of Cash Flows42
Notes to the Consolidated Financial Statements43
Independent Auditors’ Report55

30
Consolidated Financial Review
Scope of Consolidation
The Konica Minolta Group comprises Konica Minolta Holdings, Inc., 108 subsidiaries, 23 non-
consolidated subsidiaries and seven affiliates.
The Group maintains five segments that reflect the nature of its products, markets, businesses,
and administration. These segments are Business Technologies, Optics, Medical and Graphic
Imaging, Sensing, and Other Businesses. The Group exited its Photo Imaging business in the fiscal
year ended March 31, 2008.
Performance
Net Sales
Net sales in the fiscal year ended March 31, 2008 rose ¥43.9 billion, to ¥1,071.6 billion. We
achieved this year-on-year increase despite exiting the Photo Imaging business, which cut ¥47.8
billion from revenues, owing to substantial growth in the core Business Technologies and Optics
segments. Sales growth was particularly pronounced in the mainstay Optics segment, which
contributed significantly to overall revenues.
Business Technologies sales increased 6.4%, to ¥701.0 billion, on strong lineups of color and
production printing MFPs and contributions from direct marketing operations and alliances with
leading dealers. Optics sales rose 31.2%, to ¥182.3 billion, reflecting significant market share
growth in high-performance TAC films and outstanding performances in such memory areas as
optical pickup lenses, glass hard disk substrates, and image input and output components.
Medical and Graphic Imaging sales were up 1.5%, to ¥161.1 billion, owing to concentrated
marketing of digital systems for the medical and healthcare and printing fields. Sensing sales
were almost unchanged, at ¥9.9 billion. Performance benefited from a focus on developing key
next-generation products, which led to three new offerings that complemented efforts to boost
competitiveness. Sales from the Industrial Inkjet business, which is included in Other business,
increased 15.4%, to ¥6.9 billion, on higher domestic revenues and successful marketing to
overseas manufacturers.
Cost of Sales and Selling, General and Administrative Expenses
The cost of sales was ¥540.2 billion. The cost of sales ratio was 50.4%, down 1.4 percentage points
from the preceding year, owing to higher sales and the implementation of cost-cutting programs.
Selling, general and administrative expenses increased ¥20.8 billion, to ¥411.7 billion, and
represented 38.4% of net sales, up 0.3 percentage point. Main factors were higher R&D invest-
ments in the Business Technologies and Optics businesses and personnel expansion, which raised
labor spending.
Business TechnologiesOpticsMedical and Graphic ImagingSensing, Industrial InkjetHoldings, OthersPhoto Imaging
Net Sales(Billions of Yen)
0
300
600
900
1,200
06 07 08
Cost of Sales (left scale)Cost of Sales Ratio (right scale)
Cost of Sales and Cost of Sales Ratio(Billions of Yen, %)
0
15
30
45
60
0
200
400
600
800
06 07 08

31
Research and Development Costs
These expenditures rose ¥9.2 billion, to ¥81.4 billion. Business Technologies spending was ¥48.9
billion, and accounted for 60.1% of the total, largely for developing color MFPs and for R&D in
solutions software and applications. Optics R&D costs increased, to ¥11.0 billion, or 13.5% of the
total, primarily for work on display materials and memory devices. In Medical and Graphic
Imaging, R&D spending advanced to ¥11.3 billion, or 13.9% of the total, mainly to develop digital
equipment. We also invested in such areas as organic electroluminescent technologies to cultivate
new businesses.
Segment Information
Business Technologies sales increased 6.4%, to ¥701.0 billion, with operating income rising
12.6%, to ¥90.1 billion. One driver was a stronger lineup across the performance range, reflect-
ing the launches of two medium- and high-speed color MFPs in the first half and introductions of
three low- and medium-speed color MFPs in the second half. New production printing models
also contributed to results.
Optics sales rose 31.2%, to ¥182.3 billion. Operating income increased 48.8%, to ¥31.3
billion. Domestic and overseas market shares surged for display materials, especially high-
performance TAC films used in large-screen LCD televisions. In November 2007, the Group
boosted capacity by starting operations at its fifth TAC film plant, in Kobe, Japan, helping to sig-
nificantly expand TAC film sales. In memory devices, sales were favorable for mainstay optical
pickup lenses for the Blu-Ray Disk, as next-generation DVD formats moved into the mainstream.
Demand recovered after summer 2007 for glass hard disk substrates, for solid second-half sales
of these offerings. In image input and output components, sales rocketed for microcamera lenses
used in camera-equipped mobile phones and for digital camera zoom lenses.
Medical and Graphic Imaging sales advanced 1.5%, to ¥161.1 billion. Operating income
dropped 12.4%, to ¥7.8 billion. In Medical Imaging, as digitization and networking accelerated
at medical facilities, the Group expanded sales by broadening its market focus, releasing new
systems for clinics and other small facilities. In Graphic Imaging, the Group focused on strength-
ening sales of digital printing equipment. Operating income in this area declined, however,
reflecting high costs for silver used in film and additional R&D costs.
Sensing sales were almost unchanged, at ¥9.9 billion. Operating income declined 26.2%, to
¥1.2 billion, owing to higher selling costs that offset efforts to expand sales by developing core
next-generation colorimetric, light source color, object color, and 3D measurement instruments,
and the release of three new products.
Industrial Inkjet business sales increased 15.4%, to ¥6.9 billion, although operating income
fell 31.8%, to ¥0.9 billion, owing to higher R&D spending. The Group cultivated sales of inks
employing its proprietary inkjet, chemical, and ink technologies.
Operating Income (left scale)Operating Income Ratio (right scale)
Operating Income and Operating Income Ratio(Billions of Yen, %)
0
30
60
90
120
06 07 08 0
3
6
9
12
Net Income (Loss) (left scale)Basic Net Income per Share (right scale)
Net Income (Loss) and Basic Net Income per Share(Billions of Yen, Yen)
–80
–40
0
40
80
06 07 08 –150
–75
0
75
150

32
Earnings Analysis
The operating income ratio increased 1.1 percentage points, to 11.2%. This gain stemmed from
solid performances in core businesses, with higher-value-added and more price-competitive
products enabling the Group to raise the gross margin.
Net other expenses were ¥20.6 billion, down ¥21.5 billion from a year earlier. This was attrib-
utable largely to the yen’s swift appreciation in the second half, which resulted in ¥7.6 billion in
net foreign exchange loss, compared to ¥3.4 billion gain a year earlier. Other factors included
a ¥6.0 billion decline in the gain on sales of fixed assets, and a ¥2.8 billion reduction in the gain
on sales of investment securities owing to our exit from the Photo Imaging business in the previous
year. In addition, loss on impairment of fixed assets increased ¥5.1 billion because book values for
recoverable values decreased, notably for production facilities and goodwill in the Medical and
Graphic Imaging business and goodwill in the Business Technologies business. Partially offsetting
these changes was ¥8.1 billion in patent-related income for the Photo Imaging business.
Income before income taxes and minority interests was thus ¥99.0 billion. Net income declined
¥3.7 billion to ¥68.8 billion. Basic net income per share of common stock was ¥129.71, and the
return on equity was 17.5%.
Financial Position and Liquidity
Assets, Liabilities, and Net Assets
At the close of the term, total assets were ¥970.5 billion, up ¥19.5 billion from a year earlier.
Trade notes and accounts receivable were down ¥22.5 billion despite an increase in net sales,
as efforts to shorten collection periods in the Optics business bore fruit. Short-term investment
securities surged to ¥33.0 billion because the Group restated negotiable deposits issued by
domestic companies as part of short-term investment securities, instead of part of cash on hand
and in banks, in keeping with revised consolidated financial reporting guidelines.
Net property, plant and equipment increased ¥15.9 billion, reflecting Optics business initiatives
that included building a fifth plant, in Kobe, Japan, for TAC films and constructing a glass hard
disk substrate facility in Malaysia.
Total liabilities decreased ¥30.2 billion, to ¥552.2 billion.
Current portion of long-term loans was down ¥10.7 billion, although short-term debt rose
¥13.9 billion. Current portion of bonds increased ¥5.0 billion, although there were effectively
no changes to total liabilities because this rise stemmed from a restatement of bonds previ-
ously included in long-term liabilities. Also contributing to a decrease in liabilities was a ¥16.4
billion drop in the reserve for discontinued operations in keeping with the exit from the Photo
Imaging business.
Equity Ratio(%)
06 07 080
45
30
15
Interest Coverage Ratio(Times)
06 07 080
10
20
30

33
Retained earnings were ¥176.7 billion, up ¥61.0 billion, mainly because from the contribution
of ¥68.8 billion in net income. The unrealized gains on securities, net of taxes, and the foreign
currency translation adjustments were down ¥4.5 billion and ¥6.3 billion, respectively, owing to
sluggish equity markets and a higher yen. Total net assets thus rose ¥49.7 billion. The equity ratio
was 43.0%, up 4.4 percentage points.
Capital Expenditure and Depreciation and Amortization
Capital expenditure increased ¥11.3 billion, to ¥75.3 billion, mainly to expand production facilities.
Spending for the core Business Technologies business declined ¥7.9 billion, to ¥16.6 billion,
although Optics business allocations rose ¥17.5 billion, to ¥42.0 billion. Medical and Graphic
Imaging business expenditures were ¥4.6 billion.
Noteworthy developments during the term included the construction of a fifth TAC film plant,
in Kobe, Japan, and spending on a glass hard disk substrate facility in Malaysia.
Cash Flows
Net cash provided by operating activities was ¥123.0 billion, up ¥56.3 billion. This reflected lower
outflows from a decrease in reserve for discontinued operations in line with the exit from the
Photo Imaging business and higher inflows from a decrease in trade notes and accounts receivable.
Net cash used in investing activities was ¥76.8 billion, up ¥20.4 billion. This stemmed from
a significant fall in inflows from proceeds from sales of property, plant and equipment, and
outflows from payment for acquisition of newly consolidated subsidiaries.
Net cash used in financing activities was ¥10.5 billion, up ¥5.4 billion. Key factors included an
increase in repayment of long-term loans payable and the restoration of interim cash dividend
payments, which raised dividend outlays.
Cash and cash equivalents at the end of the year were thus ¥122.2 billion, up ¥35.6 billion
from the start of the term.
Future Financial Strategies
The Group will accelerate sustainable growth to ensure superior global competitiveness, com-
pleting its steady progress toward targets it set in its FORWARD 08 medium-term management
strategy. Management seeks a net asset ratio exceeding 50% and a debt-to-equity ratio of less
than 0.5 times.
Capital Expenditure(Billions of Yen)
0
20
40
60
80
06 07 08
Total Assets (left scale)Net Assets (left scale)Return on Equity (ROE) (right scale)
Total Assets, Net Assets and Return on Equity (ROE)(Billions of Yen, %)
0
250
500
750
1,000
06 07 08
0
15
30
–30
–15

34
Intellectual Property Update
1. Intellectual Property Strategies
The Group maintains a system to improve the quality of patent applications and harnesses the
Patent Cooperation Treaty (PCT) in line with the global nature of its operations. During the year
under review, we recorded 3,945 patent applications including PCT-based and Japanese
regulation-based applications.
The Business Technologies and Optics segments together accounted for 52% of that number,
reflecting concerted efforts under our intellectual property strategies, which are integral to our
business strategies. The proportion of published patents in basic and advanced technologies has
risen every year, reaching 24% of all such publications in the fiscal year ended March 2008. We
will continue to apply for patents in the years ahead to support our white-light-emitting organic
electroluminescent device and other businesses.
2. R&D, Intellectual Property Organization, and Alliances and Collaboration
(1) R&D and Intellectual Property Organization
The Group’s R&D organization covers development operations within each business company and
the Konica Minolta Technology Center, Inc., which explores basic and advanced areas.
The business companies focus resources on their specific fields to create superior technologies.
The Konica Minolta Technology Center reinforces basic technologies and tackles new fields to
drive Group progress.
The Intellectual Property Center, the organizational core of the Group’s intellectual property
activities, is part of the above-mentioned Konica Minolta Technology Center. Here, we monitor
the creation of intellectual property by each business company. Through these organizational and
strategic efforts, the center works with each business company to fulfill intellectual property
strategies that are in keeping with their business strategies.
The center’s branches, located within our R&D units, collaborate closely with those operations,
helping them formulate business and R&D strategies for key themes according to priority. The
center plans, implements and works with R&D departments to polish and evaluate inventions
through activities that foster close-knit relationships with people at R&D sites.
The center stations personnel overseas and promotes intellectual property activities from
a global perspective. Deploying staff in China enables the center to strengthen its local intellec-
tual property activities and respond swiftly to the discovery of counterfeit products. The center
also regularly dispatches its employees to U.S. development subsidiaries to conduct intellectual
property activities locally.
Business TechnologiesOpticsMedical and Graphic ImagingSensingIndustrial InkjetShared Basic Technologies, Leading-Edge TechnologiesPhoto Imaging
Proportion of Disclosed Patents by Business Segment (%)
0
100
80
60
40
20
06 07 08
35
(2) R&D Alliances and Collaboration
The Group actively promotes R&D alliances. In Business Technologies, we concluded a strategic
office and production printing alliance with Océ N.V. of the Netherlands in April 2008. The two
companies are taking advantage of their respective strengths to help each other develop tech-
nologies and products for the office information equipment and digital printing markets.
We drew on our core functional organic materials synthesis technologies to develop a white-
light-emitting organic electroluminescent device that features the world’s best luminous effi-
ciency and durability. Collaboration with Universal Disk Corporation and a strategic alliance with
the General Electric Company, both of the United States, help us accelerate work to develop and
commercialize organic electroluminescent technologies for lighting applications.
We are participating in several projects for Japan’s Ministry of Economy, Trade and Industry.
3. Acquiring and Overseeing Intellectual Property, Managing Trade Secrets, and
Maintaining Policies to Prevent Technology Leaks
Intellectual property is a crucial resource that the Group uses to create business assets and apply
its rights to them. We implemented “Regulations for the Management of Industrial Property
Rights” in the fiscal year ended March 31, 2006 to encourage employee inventiveness in line with
Article 35 of the Japanese Patent Law.
The in-house expertise that we have created, as well as other confidential information, consti-
tute important technology assets, and the inappropriate disclosure of such information could
reduce competitive advantages stemming from our technologies and harm the healthy develop-
ment of our businesses. Similarly, confidential information that other companies have disclosed to
us are important technology assets of their own. In addition to damaging its reputation, any leaks
of such information by the Group could result in a variety of legal issues. Consequently, the
Group has created “Standards for the Management of Confidential Information” and formed
a robust structure to prevent leaks of confidential information.
4. Business Contributions of Licensing Activities
The Group strategically employs its many patents to differentiate our products and gain competi-
tive advantages in businesses in which we enjoy technological leads.
We pursue cross-licensing strategies in domains where technologies are increasingly
advanced and complex to sustain businesses and maintain R&D freedom. We license from
other companies when we conclude that such agreements ensure business freedom and shorten
development cycles.

36
5. Business Contributions of Patents and Other Intellectual Property
(1) Patent Portfolio Contributions to Business
Konica Minolta believes that seeking and obtaining patents to the fruits of R&D helps ensure the
superiority of each business.
We maintain strong patent positions by prioritizing technologies to expand and dominate
business areas and by systematically pursuing innovations and acquiring patent rights. We also
choose the right countries in which to apply for patents and maintain policies to swiftly obtain
protection. Our domestic and international patent initiatives contribute to our businesses.
We held 6,450 patents in Japan and 5,852 in the United States as of March 31, 2008. The
Business Technologies and Optics segments accounted for around 60% of our patents in both
countries, where our patent numbers have surged since the fiscal year ended March 2006.
In the Japan Patent Annual Report 2008, Konica Minolta Holdings ranked 30th in 2007, with
662 patents granted. Konica Minolta Business Technologies was 74th, with 307. Our own
research shows that we obtained 1,071 patents that year, for a ranking of 19th.
In the United States, a key country, we again rose up the patent filing and grant rankings in
2007, placing 40th overall and 15th among Japanese companies.
Estimated Group Ranking in U.S. Patents Granted
Calendar year 2003 2004 2005 2006 2007
Patents Granted 380 404 316 497 509
Ranking (Est.) 55 50 56 44 40
Note: Estimate of aggregate ranking of Konica Minolta Group companies based on data compiled by the IntellectualProperty Owners Association.
(2) Business Contributions of Other Intellectual Property
The Konica Minolta brand is an invaluable Group asset. We created a brand management unit
because exiting the photographic film and digital camera business made maintaining and improv-
ing our brand image even more important. The Intellectual Property Center seeks and maintains
trademark protection in more than 200 countries to safeguard our brand.
The center also works with businesses to combat rising product counterfeiting in Japan
and abroad.
In the design arena, in the fiscal year ended March 2008 we won Good Design Awards, which
are sponsored by the Japan Industrial Design Promotion Organization, for the bizhub
C650/C550/C451, color MFPs based on a new design concept that launched in 2007, and the
REGIUS Unitea (marketed as ImagePilot outside Japan), a next-generation multi-unit for medical
clinics. These products attest to the success of our efforts to enhance the Konica Minolta brand
image through product design.
Proportion of Japanese Patents by Business Segment
Business TechnologiesOpticsMedical and Graphic ImagingSensingIndustrial InkjetShared Basic Technologies, Leading-Edge TechnologiesPhoto Imaging
4%1%
56%
9%
11%
6%
13%
Proportion of U.S. Patents by Business Segment
4%1% 48%
11%
9%
9%
18%

37
Trend of Japanese Patents in Business Technologies and Optics
0
600
450
300
150
0
1,000
2,000
3,000
4,000
Business Technologies(left scale)Optics (right scale)
05 06 07 08
Trend of U.S. Patents in Business Technologies and Optics
0
150
300
450
600
0
700
1,400
2,100
2,800
05 06 07 08
6. Intellectual Property Portfolio Policies
These portfolios are especially important for the core Business Technologies and strategic Optics
segments. We are expanding patent applications in these businesses while enhancing patent
quality by more effectively searching prior art documents and evaluating inventions. We will
continue to emphasize patent applications abroad as we globalize.
We regularly inventory our patents and manage the portfolio to help capitalize on earnings
opportunities and foster new internal and external uses of our patents. We are identifying uses
for patents from the defunct Photo Imaging business. Examples are silver-halide photographic
materials and processing equipment and film and digital cameras. We are transferring such
patent assets to Group companies and third parties or have licensed them.
7. Risk Response Information
At the date of this report, the Konica Minolta Group was not involved in any intellectual property
disputes or litigation that would materially affect operations.

38
Thousands ofU.S. dollars
Millions of yen (Note 3)
March 31 March 31
2008 2007 2008
Assets
Current Assets:
Cash on hand and in banks (Note 4) ¥ 89,218 ¥ 70,677 $ 890,488
Notes and accounts receivable—trade 234,862 257,380 2,344,166
Short-term investment securities (Notes 4 and 5) 33,000 15,909 329,374
Inventories 132,936 133,550 1,326,839
Deferred tax assets (Note 7) 37,086 41,336 370,157
Other accounts receivable 14,284 10,999 142,569
Other current assets 21,330 19,489 212,895
Allowance for doubtful accounts (5,608) (5,106) (55,974)
Total current assets 557,110 544,237 5,560,535
Property, Plant and Equipment (Note 11):
Buildings and structures 162,931 163,895 1,626,220
Machinery and equipment 238,891 215,227 2,384,380
Tools and furniture 147,581 143,672 1,473,011
Land 35,961 33,065 358,928
Construction in progress 5,201 12,406 51,911
Rental business-use assets 68,746 73,793 686,156
Total 659,313 642,060 6,580,627
Accumulated depreciation (413,324) (411,965) (4,125,402)
Net property, plant and equipment 245,989 230,094 2,455,225
Intangible Fixed Assets:
Goodwill (Note 11) 75,809 82,074 756,652
Other intangible fixed assets 18,038 15,897 180,038
Total intangible fixed assets 93,848 97,971 936,700
Investments and Other Assets:
Investment securities (Note 5) 28,651 33,948 285,967
Long-term loans 430 614 4,292
Long-term prepaid expenses 3,589 4,393 35,822
Deferred tax assets (Note 7) 28,604 27,306 285,498
Other 12,743 13,037 127,188
Allowance for doubtful accounts (430) (552) (4,292)
Total investments and other assets 73,589 78,748 734,494
Total assets ¥ 970,538 ¥ 951,052 $ 9,686,975
The accompanying Notes to the Consolidated Financial Statements are an integral part of these financial statements.
Consolidated Balance SheetsKonica Minolta Holdings, Inc. and Consolidated Subsidiaries
March 31, 2008 and 2007

39
Thousands ofU.S. dollars
Millions of yen (Note 3)
March 31 March 31
2008 2007 2008
Liabilities and Net Assets
Current Liabilities:
Short-term debt (Note 6) ¥ 93,875 ¥ 79,927 $ 936,970
Current portion of long-term debt (Note 6) 11,363 17,105 113,415
Notes and accounts payable—trade 109,413 121,707 1,092,055
Accrued expenses 48,734 50,563 486,416
Accrued income taxes (Note 7) 16,449 14,171 164,178
Reserve for discontinued operations 11,727 28,097 117,048
Other current liabilities 74,007 65,496 738,667
Total current liabilities 365,570 377,069 3,648,767
Long-Term Liabilities:
Long-term debt (Note 6) 120,786 132,331 1,205,569
Accrued retirement benefits (Note 17) 53,367 57,947 532,658
Accrued retirement benefits for
directors and statutory auditors 544 459 5,430
Deferred tax liabilities on land revaluation (Note 7) 4,010 4,028 40,024
Other long-term liabilities 7,946 10,590 79,309
Total long-term liabilities 186,656 205,358 1,863,020
Contingent Liabilities (Note 10)
Net Assets (Notes 9 and 21):
Common stock:
Authorized—1,200,000,000 shares in 2008 and 2007
Issued—531,664,337 shares in 2008 and 2007 37,519 37,519 374,478
Capital surplus 204,140 204,143 2,037,529
Retained earnings 176,684 115,704 1,763,489
Less: Treasury stock, at cost; Common stock,
1,055,317 shares in 2008 and
939,214 shares in 2007 (1,340) (1,097) (13,375)
Unrealized gains on securities, net of taxes 2,913 7,454 29,075
Unrealized losses on hedging derivatives, net of taxes (319) (90) (3,184)
Foreign currency translation adjustments (2,431) 3,834 (24,263)
Share subscription rights (Notes 6 and 19) 286 108 2,855
Minority interests 858 1,048 8,564
Total net assets 418,310 368,624 4,175,167
Total liabilities and net assets ¥ 970,538 ¥ 951,052 $9,686,975

40
Thousands ofU.S. dollars
Millions of yen (Note 3)
March 31 March 31
2008 2007 2008
Net Sales ¥1,071,568 ¥1,027,630 $10,695,359
Cost of Sales (Note 8) 540,225 532,714 5,392,005
Gross profit 531,343 494,916 5,303,354
Selling, General and Administrative Expenses (Note 8) 411,736 390,909 4,109,552
Operating income 119,606 104,006 1,193,792
Other Income (Expenses):
Interest and dividend income 2,643 2,316 26,380
Interest expenses (4,465) (5,088) (44,565)
Foreign exchange gain (loss), net (7,637) 3,432 (76,225)
Gain (loss) on sales and disposals of property, plant and equipment, net (3,224) 4,484 (32,179)
Write-down of investment securities (313) (26) (3,124)
Write-down of investment in affiliated companies (54) — (539)
Loss on disposal of inventories (7,065) (7,054) (70,516)
Gain on sales of investment securities, net 19 2,744 190
Gain on sales of investments in affiliated companies, net 47 580 469
Loss on impairment of fixed assets (Note 11) (5,702) (640) (56,912)
Gain on discontinued operations (Note 12) 590 — 5,889
Loss on discontinued operations (Note 12) — (935) —
Equity in net income (losses) of unconsolidated subsidiaries and affiliates 182 (160) 1,817
Patent-related income (Note 13) 8,080 — 80,647
Environmental expenses (1,856) — (18,525)
Other extraordinary losses of overseas subsidiaries (Note 14) (1,731) — (17,277)
Other, net (120) 1,233 (1,198)
Total (20,609) 884 (205,699)
Income before income taxes and minority interests 98,996 104,890 988,083
Income Taxes (Note 7):
Current 29,496 27,307 294,401
Deferred 544 4,827 5,430
Total 30,040 32,135 299,830
Minority Interests in Net Income of Consolidated Subsidiaries 126 213 1,258
Net Income ¥ 68,829 ¥ 72,542 $ 686,985
U.S. dollarsYen (Note 3)
March 31 March 31
2008 2007 2008
Per Share Data (Notes 9 and 21):
Net income—Basic ¥129.71 ¥136.67 $1.29
—Diluted 122.44 134.00 1.22
Cash dividends 15 10 0.15
The accompanying Notes to the Consolidated Financial Statements are an integral part of these financial statements.
Consolidated Statements of IncomeKonica Minolta Holdings, Inc. and Consolidated Subsidiaries
For the fiscal years ended March 31, 2008 and 2007

41
Millions of yenUnrealized
Unrealized losses on ForeignShares of gains on hedging currency Share
issued Common Capital Retained Treasury securities, derivatives, translation subscription Minoritycommon stock stock surplus earnings stock net of taxes net of taxes adjustments rights interests Total
(From April 1, 2006 to March 31, 2007)
Net Assets at April 1, 2006 531,664,337 ¥37,519 ¥226,069 ¥ 20,088 ¥ (915) ¥10,180 ¥ — ¥ 875 ¥ — ¥ 2,753 ¥296,571
Net income 72,542 72,542
Change in the scope of consolidation 527 527
Transfer from capital surplusto retained earnings (21,928) 21,928 —
Purchase of treasury stock (190) (190)
Re-issuance of treasury stock 2 7 9
Actuarial gains and losses of overseas subsidiaries defined benefit retirement plans (Note 15) 618 618
Net changes during the year (2,725) (90) 2,958 108 (1,705) (1,455)
Total changes during the period — (21,926) 95,616 (182) (2,725) (90) 2,958 108 (1,705) 72,053
Balance at March 31, 2007 531,664,337 ¥37,519 ¥204,143 ¥115,704 ¥(1,097) ¥ 7,454 ¥ (90) ¥ 3,834 ¥108 ¥ 1,048 ¥368,624
(From April 1, 2007 to March 31, 2008)
Net Assets at April 1, 2007 531,664,337 ¥37,519 ¥204,143 ¥115,704 ¥(1,097) ¥ 7,454 ¥ (90) ¥ 3,834 ¥108 ¥ 1,048 ¥368,624
Dividends paid from retained earnings (9,287) (9,287)
Net income 68,829 68,829
Change in the scope of consolidation 405 405
Purchase of treasury stock (289) (289)
Re-issuance of treasury stock (2) (28) 46 16
Actuarial gains and losses of overseas subsidiaries defined benefit retirement plans (Note 15) 1,059 1,059
Net changes during the year (4,541) (228) (6,266) 177 (189) (11,048)
Total changes during the period — (2) 60,979 (242) (4,541) (228) (6,266) 177 (189) 49,686
Balance at March 31, 2008 531,664,337 ¥37,519 ¥204,140 ¥176,684 ¥(1,340) ¥ 2,913 ¥(319) ¥(2,431) ¥286 ¥ 858 ¥418,310
Thousands of U.S. dollars (Note 3)Unrealized
Unrealized losses on ForeignShares of gains on hedging currency Share
issued Common Capital Retained Treasury securities, derivatives, translation subscription Minoritycommon stock stock surplus earnings stock net of taxes net of taxes adjustments rights interests Total
(From April 1, 2007 to March 31, 2008)
Net Assets at April 1, 2007 531,664,337 $374,478 $2,037,559 $1,154,846 $(10,949) $74,399 $(898) $38,267 $1,078 $10,460 $3,679,249
Dividends paid from retained earnings (92,694) (92,694)
Net income 686,985 686,985
Change in the scope of consolidation 4,042 4,042
Purchase of treasury stock (2,885) (2,885)
Re-issuance of treasury stock (20) (279) 459 160
Actuarial gains and losses of overseas subsidiaries defined benefit retirement plans (Note 15) 10,570 10,570
Net changes during the year (45,324) (2,276) (62,541) 1,767 (1,886) (110,270)
Total changes during the period — (20) 608,634 (2,415) (45,324) (2,276) (62,541) 1,767 (1,886) 495,918
Balance at March 31, 2008 531,664,337 $374,478 $2,037,529 $1,763,489 $(13,375) $29,075 $(3,184) $(24,263) $2,855 $8,564 $4,175,167
The accompanying Notes to the Consolidated Financial Statements are an integral part of these financial statements.
Consolidated Statements of Changes in Net AssetsKonica Minolta Holdings, Inc. and Consolidated Subsidiaries
For the fiscal years ended March 31, 2008 and 2007

42
Thousands ofU.S. dollars
Millions of yen (Note 3)
March 31 March 31
2008 2007 2008
Cash Flows from Operating Activities:Income before income taxes and minority interests ¥ 98,996 ¥104,890 $ 988,083Depreciation and amortization 60,443 52,692 603,284Loss on impairment of fixed assets 5,702 640 56,912Amortization of goodwill 7,171 6,476 71,574Increase (decrease) in allowance for doubtful accounts 780 (4,378) 7,785Interest and dividend income (2,643) (2,316) (26,380)Interest expense 4,465 5,088 44,565Loss (gain) on sales and disposals of property, plant and equipment 3,224 (4,484) 32,179Loss (gain) on sale and write-down of investment securities 293 (2,717) 2,924Loss (gain) on sale and write-down of investments in affiliated companies 6 (580) 60Patent-related income (8,080) — (80,647)Reversal of reserve for discontinued operations (590) — (5,889)Loss on discontinued operations — 935 —Legal-related expenses 625 — 6,238Environmental expenses 1,856 — 18,525Additional retirement expenses 460 — 4,591Other extraordinary losses of overseas subsidiaries 1,731 — 17,277Decrease in accrued retirement benefits (4,462) (8,383) (44,535)Decrease in reserve for discontinued operations (16,370) (29,980) (163,390)(Increase) decrease in trade notes and accounts receivable 11,157 (976) 111,358(Increase) decrease in inventories (6,422) 19,262 (64,098)Decrease in trade notes and accounts payable (2,027) (5,064) (20,232)Increase (decrease) in accrued consumption tax payable 904 (1,969) 9,023Reversal of reserve for loss on impairment of lease assets (171) (3,129) (1,707)Transfer of rental business-use assets (11,847) (10,168) (118,245)Other 7,468 (17,700) 74,538
Subtotal 152,674 98,137 1,523,845Interest and dividend income received 2,681 2,473 26,759Interest paid (4,444) (5,220) (44,356)Additional payments of retirement allowance (355) (6,484) (3,543)Income taxes paid (27,543) (22,193) (274,908)
Net cash provided by operating activities 123,014 66,712 1,227,807Cash Flows from Investing Activities:
Payment for acquisition of property, plant and equipment (62,969) (62,517) (628,496)Proceeds from sales of property, plant and equipment 2,907 12,064 29,015Payment for acquisition of intangible fixed assets (5,864) (6,703) (58,529)Payment for acquisition of additional shares of consolidated subsidiaries (855) (2,744) (8,534)Proceeds from sales of investments in consolidated subsidiaries — 1,744 —Payment for acquisition of newly consolidated subsidiaries (6,832) — (68,190)Payment for loans receivable (113) (891) (1,128)Proceeds from collection of loans receivable 265 1,142 2,645Payment for acquisition of investment securities (1,718) (1,411) (17,147)Proceeds from sales of investment securities 35 3,461 349Payment for acquisition of other investments (2,609) (2,129) (26,041)Other 939 1,585 9,372
Net cash used in investing activities (76,815) (56,401) (766,693)Cash Flows from Financing Activities:
Net increase (decrease) in short-term loans payable 16,314 (53,125) 162,831Repayment of long-term loans payable (17,159) (8,079) (171,265)Proceeds from issuance of bonds — 70,300 —Payment for redemption of bonds (30) (14,002) (299)Proceeds from disposal of treasury stock 16 9 160Payment for purchase of treasury stock (289) (190) (2,885)Dividend payments (9,271) (12) (92,534)Dividend payments to minority shareholders in consolidated subsidiaries (126) (70) (1,258)
Net cash used in financing activities (10,545) (5,170) (105,250)Effect of Exchange Rate Changes on Cash and Cash Equivalents (347) 322 (3,463)Increase in Cash and Cash Equivalents 35,305 5,463 352,380Cash and Cash Equivalents at the Beginning of the Year 86,587 80,878 864,228Increase in Cash and Cash Equivalents Due to Newly Consolidated Subsidiaries 294 245 2,934
Cash and Cash Equivalents at the End of the Year ¥122,187 ¥ 86,587 $1,219,553
The accompanying Notes to the Consolidated Financial Statements are an integral part of these financial statements.
Consolidated Statements of Cash FlowsKonica Minolta Holdings, Inc. and Consolidated Subsidiaries
For the fiscal years ended March 31, 2008 and 2007

43
Notes to the Consolidated Financial StatementsKonica Minolta Holdings, Inc. and Consolidated Subsidiaries
For the fiscal years ended March 31, 2008 and 2007
1. Basis of Presenting Financial StatementsThe accompanying consolidated financial statements of KonicaMinolta Holdings, Inc., (the “Company”) and its consolidatedsubsidiaries (the “Companies”) are prepared on the basis ofaccounting principles generally accepted in Japan, which aredifferent in certain respects as to application and disclosurerequirements of International Financial Reporting Standards, andare compiled from the consolidated financial statements preparedby the Company as required by the Securities and Exchange Lawof Japan. Accounting principles generally accepted in Japan allowconsolidation of foreign subsidiaries based on their financial state-ments in conformity with accounting principles generally acceptedin their respective country of domicile.
The accompanying consolidated financial statements incor-porate certain reclassifications in order to present them in a formthat is more familiar to readers outside Japan. In addition, thenotes to the consolidated financial statements include informationthat is not required under generally accepted accounting principlesin Japan, but which is provided herein as additional information.
Certain comparative amounts have been reclassified toconform to the current year classifications.
As permitted under the Securities and Exchange Law of Japan,amounts of less than one million have been omitted. As a result,the totals shown in the accompanying consolidated financial state-ments (both in yen and in dollars) do not necessarily agree withthe sums of the individual amounts.
2. Summary of Significant Accounting Policies
(a) Principles of ConsolidationThe consolidated financial statements include the accounts of theCompany and, with certain exceptions which are not material,those of its 108 subsidiaries (120 subsidiaries for 2007) in which ithas control. All significant intercompany transactions, balancesand unrealized profits among the Companies are eliminated onconsolidation.
Investments in 8 unconsolidated subsidiaries (10 uncon-solidated subsidiaries for 2007) and 3 significant affiliates (3significant affiliates for 2007) are accounted for using the equitymethod. Investments in other unconsolidated subsidiaries andaffiliates are stated at cost, since they have no material effect onthe consolidated financial statements.
The excess of cost over the underlying investments insubsidiaries is recognized as goodwill and is amortized on astraight-line basis over a period not exceeding 20 years.
(b) Translation of Foreign Currencies
Translation of Foreign Currency Transactions and BalancesAll monetary assets and liabilities denominated in foreigncurrencies, whether long-term or short-term, are translated intoJapanese yen at the exchange rates prevailing at the balance sheetdate and revenues and costs are translated using the averageexchange rates for the period.
Translation of Foreign Currency Financial StatementsThe translation of foreign currency financial statements ofoverseas consolidated subsidiaries into Japanese yen is made byapplying the exchange rates prevailing at the balance sheet datesfor balance sheet items, except common stock, additional paid-incapital and retained earnings accounts, which are translated atthe historical rates, and the statements of income and retainedearnings which are translated at average exchange rates.
(c) Cash and Cash EquivalentsCash and cash equivalents in the consolidated cash flow state-ments comprises cash on hand and short-term investments that
are due for redemption in three months or less and that are easilyconverted into cash with little risk to a change in value.
(d) Allowance for Doubtful AccountsThe allowance for doubtful accounts is provided for possible lossesfrom uncollectible receivables based on specific doubtful accountsand considering historic experience.
(e) InventoriesThe Company and its domestic consolidated subsidiaries’ invento-ries are mainly stated at cost as determined by the averagemethod. Overseas consolidated subsidiaries’ inventories aremainly stated at the lower of cost or market value, where cost isdetermined using the first-in, first-out method.
(f) Property, Plant and EquipmentDepreciation of property, plant and equipment for the Companyand domestic consolidated subsidiaries is computed mainly usingthe declining balance method, except for depreciation of buildingsacquired after April 1, 1998, based on the estimated useful lives ofthe assets. Depreciation of buildings acquired after April 1, 1998 iscomputed using the straight-line method. Depreciation foroverseas consolidated subsidiaries is computed mainly using thestraight-line method.
Changes in Accounting PolicyEffective from the year ended March 31, 2008, the Company andits domestic consolidated subsidiaries changed their depreciationmethod for tangible fixed assets acquired on or after April 1, 2007in accordance with the revision of Japanese Corporate Tax Law(Partial Revision of Income Tax Law, Law No. 6 of March 30, 2007;Partial Revision of Income Tax Law Enforcement Ordinance,Cabinet Order No. 83 of March 30, 2007). As a result of thischange, compared with the method employed for the previousfiscal year, operating income and ordinary income were each¥2,894 million ($28,885 thousand) lower than the previousmethod and income before income taxes and minority interestswas ¥2,886 million ($28,805 thousand) lower than it would havebeen under the previous method.
Pursuant to an amendment to the Japanese Corporate TaxLaw, effective from the year ended March 31, 2008, the Companyand its domestic consolidated subsidiaries depreciate the differ-ence between the original residual value of 5% of acquisition costof assets acquired before April 1, 2007 and the new residual valueof 1 Yen (memorandum value) by the straight line method over 5years commencing from the fiscal year following the year in whichthe asset becomes fully depreciated to the original residual value.As a result of this change in accounting method, for the fiscal yearunder review, operating income was ¥1,240 million ($12,376thousand) lower, ordinary income was ¥1,241 million ($12,386thousand) lower and income before income taxes and minorityinterests was ¥1,030 million ($10,280 thousand) lower than underthe previous method for calculating depreciation.
(g) Income TaxesDeferred income taxes are recognized based on temporarydifferences between the tax basis of assets and liabilities and thoseas reported in the consolidated financial statements.
(h) Research and Development CostsResearch and development costs are expensed as incurred.
(i) Financial Instruments
DerivativesAll derivatives are stated at fair value, with changes in fair valueincluded in net income for the period in which they arise, exceptfor derivatives that are designated as “hedging instruments” (seeHedge Accounting below).
44
SecuritiesInvestments by the Companies in equity securities issued byunconsolidated subsidiaries and affiliates are accounted for usingthe equity method; however, investments in certain unconsoli-dated subsidiaries and affiliates are stated at cost because theeffect of application of the equity method would be immaterial.
Other securities for which market quotations are available arestated at fair value. Net unrealized gains or losses on these securitiesare reported, net of tax, as a separate component of net assets.
Other securities for which market quotations are unavailableare stated at cost, except in cases where the fair value of equitysecurities issued by unconsolidated subsidiaries and affiliates orother securities has declined significantly and such impairment ofvalue is deemed other than temporary. In these instances, securi-ties are written down to the fair value and the resulting losses arecharged to income during the period.
Hedge AccountingGains or losses arising from changes in fair value of derivativesdesignated as “hedging instruments” are deferred as an asset or aliability and charged or credited to income in the same period thatthe gains and losses on the hedged items or transactions arerecognized.
Derivatives designated as hedging instruments by theCompanies are principally interest rate swaps, commodity swapsand forward foreign currency exchange contracts. The relatedhedged items are trade accounts receivable and payable, rawmaterials, long-term bank loans and debt securities issued by theCompanies.
The Companies have a policy to utilize the above hedginginstruments in order to reduce the Companies’ exposure to the riskof interest rate, commodity price and exchange rate fluctuations.As such, the Companies’ purchases of the hedging instrumentsare limited to, at maximum, the amounts of the hedged items.
The Companies evaluate the effectiveness of their hedgingactivities by reference to the accumulated gains or losses on thehedging instruments and the related hedged items from thecommencement of the hedges.
(j) LeasesFinance leases held by the Company and its domestic consolidatedsubsidiaries, other than those which are deemed to transfer theownership of the leased assets to lessees, are accounted for usinga method similar to that used for ordinary operating leases.
(k) Retirement Benefit Plans
Retirement Benefits for EmployeesThe Company, domestic consolidated subsidiaries and certainoverseas consolidated subsidiaries have obligations to makedefined benefit retirement payments to their employees and,therefore, provide accrued retirement benefits based on the esti-mated amount of projected benefit obligations and the fair valueof plan assets.
For the Company and its domestic consolidated subsidiaries,unrecognized prior service cost is amortized by the straight-linemethod over a 10-year period, which is shorter than the averageremaining years of service of the eligible employees. Unrecognizednet actuarial gain or loss is primarily amortized from the followingyear by the straight-line method over a 10-year period, which isshorter than the average remaining years of service of the eligibleemployees.
Accrued Retirement Benefits for Directors and StatutoryAuditorsDomestic consolidated subsidiaries record a reserve for retirementbenefits for directors and statutory auditors based on the amountpayable accumulated at the end of the period based on theinternal regulations.
(l) Accounting Standard for Stock OptionsOn December 27, 2005, the Accounting Standards Board of Japanissued Financial Accounting Standard No.8 “Accounting Standardfor Stock Options”. Further, on May 31, 2006, the AccountingStandards Board of Japan issued Financial Accounting StandardsImplementation Guidance No. 11 – “Application Guidance onAccounting Standard for Stock Options”.
The Company and its domestic consolidated subsidiariesadopted this standard from the year ended March 31, 2007. As aresult, operating income and income before income taxes andminority interests decreased by ¥108 million ($915 thousand) forthe year ended March 31, 2007 as compared with the amountswhich would have been reported if the previous standard hadbeen applied consistently.
(m) Accounting Standard for Retirement Benefits in theUnited States
Effective from the year ended March 31, 2007, consolidatedsubsidiary Konica Minolta Business Solutions U.S.A., Inc., adopteda new accounting standard for retirement benefits in the UnitedStates.
As a result of adoption of this new standard, retained earn-ings increased by ¥137 million as of March 31, 2007 and actuarialgains and losses were charged directly to retained earnings fromthe year ended March 31, 2007.
(n) Per Share DataNet income per share of common stock has been computed basedon the weighted-average number of shares outstanding duringthe year.
Cash dividends per share shown for each year in the accom-panying consolidated statements are dividends declared asapplicable to the respective year.
(o) Accounting Standard for Presentation of Net Assets inthe Balance Sheets
Effective from the year ended March 31, 2007, the Company andits domestic consolidated subsidiaries adopted the new accountingstandard, “Accounting Standard for Presentation of Net Assets inthe Balance Sheet” (Statement No.5 issued by the AccountingStandards Board of Japan, on December 9, 2005), and the imple-mentation guidance for the accounting standard for presentationof net assets in the balance sheet (The Financial AccountingStandard Implementation Guidance No.8 issued by theAccounting Standards Board of Japan, on December 9, 2005).
The consolidated balance sheet as of March 31, 2007 andfollowing periods prepared in accordance with the new account-ing standard comprises three sections, which are the assets,liabilities and net assets sections.
The adoption of the new accounting standard had no impacton the consolidated statement of income for the year ended March31, 2007. If the new accounting standards had not been adoptedat March 31, 2007, shareholders’ equity amounting to ¥367,558million would have been presented.

45
(p) Short-Term Investment SecuritiesDue to the revision of consolidated financial reporting guidelines,negotiable deposits issued by domestic companies, which wereincluded within “cash on hand and in banks” in the consolidatedbalance sheet in the previous fiscal year, are included in “short-term investment securities” from the fiscal year under review andcomparative amounts have been reclassified.
Negotiable deposits issued by domestic companies as of March 31, 2007 ¥15,000 million
Negotiable deposits issued by domestic companies as of March 31, 2008 ¥33,000 million
($329,374 thousand)
3. U.S. Dollar AmountsThe translation of Japanese yen amounts into U.S. dollars isincluded solely for the convenience of the reader, using the pre-vailing exchange rate at March 31, 2008, which was ¥100.19 toU.S.$1.00. The translations should not be construed as representa-tions that the Japanese yen amounts have been, could have been,or could in the future be, converted into U.S. dollars at this or anyother exchange rate.
4. Cash and Cash EquivalentsCash and cash equivalents as of March 31, 2008 and 2007,consist of:
Thousands ofMillions of yen U.S. dollars
March 31 March 31
2008 2007 2008
Cash on hand and in banks ¥89,218 ¥70,677 $ 890,488Time deposits (over 3 months) (31) — (309)Short-term investments 33,000 15,909 329,374
Cash and cash equivalents ¥122,187 ¥86,587 $1,219,553
5. Investment SecuritiesAs of March 31, 2008(1) Other Securities with Quoted Market Values
Millions of yen
Market valueat the
Original consolidated Unrealizedpurchase balance gains
value sheet date (losses)
Securities for which the amounts in the consolidated balancesheet exceed the original purchase value
(1) Shares ¥ 9,064 ¥16,515 ¥ 7,450(2) Bonds 3 5 1(3) Other 1 1 —
Subtotal ¥ 9,069 ¥16,522 ¥ 7,452
Securities for which the amounts in the consolidated balancesheet do not exceed the original purchase value
(1) Shares ¥ 9,388 ¥ 6,862 ¥(2,526)(2) Bonds 21 14 (6)(3) Other — — —
Subtotal ¥ 9,410 ¥ 6,876 ¥(2,533)
Total ¥18,479 ¥23,399 ¥ 4,919
Thousands of U.S. dollars
Total $184,440 $233,546 $49,097
(2) Other Securities Sold during the Year Ended March 31,2008
Millions of yen
Sale value Total profit Total loss
Other securities ¥ 23 ¥ 20 ¥0
Thousands of U.S. dollars
Other securities $230 $200 $0
(3) Composition and Amounts on the Consolidated BalanceSheet of Other Securities without Market Values
Thousands ofMillions of yen U.S. dollars
Negotiable deposits ¥33,000 $329,374Unlisted stocks 863 8,614
As of March 31, 2007(1) Other Securities with Quoted Market Values
Millions of yen
Market valueat the
Original consolidated Unrealizedpurchase balance gains
value sheet date (losses)
Securities for which the amounts in the consolidated balancesheet exceed the original purchase value
(1) Shares ¥11,638 ¥24,836 ¥13,198(2) Bonds 24 24 —(3) Other 214 214 —
Subtotal ¥11,877 ¥25,075 ¥13,198
Securities for which the amounts in the consolidated balancesheet do not exceed the original purchase value
(1) Shares ¥ 5,697 ¥ 5,057 ¥ (640)(2) Bonds — — —(3) Other — — —
Subtotal ¥ 5,697 ¥ 5,057 ¥ (640)
Total ¥17,575 ¥30,132 ¥12,557
(2) Other Securities Sold during the Year Ended March 31,2007
Millions of yen
Sale value Total profit Total loss
Other securities ¥5,629 ¥2,788 ¥44
(3) Composition and Amounts on the Consolidated BalanceSheet of Other Securities without Market Values
Millions of yen
Negotiable deposits ¥15,000Unlisted stocks 378Foreign investment fund 909

46
6. Short-Term Debt and Long-Term DebtShort-term debt was principally unsecured and generally representsbank overdrafts. The amounts as of March 31, 2008 and 2007were ¥93,875 million ($936,970 thousand) and ¥79,927 million,respectively, and the weighted-average interest rates wereapproximately 3.4% and 3.3%, respectively.
Long-term debt as of March 31, 2008 and 2007, includingcurrent portion, consisted of the following:
Bonds Thousands ofMillions of yen U.S. dollars
March 31 March 31
2008 2007 2008
2.3% bonds due in 2007 ¥ — ¥ 9 $ —2.5% bonds due in 2007 — 9 —2.4% bonds due in 2007 — 9 —2.825% unsecured
bonds due in 2008 5,000 5,000 49,905Zero coupon convertible
unsecured bonds due in 2009 30,166 30,266 301,088
Zero coupon convertible unsecured bonds due in 2016 40,000 40,000 399,241
¥75,166 ¥75,296 $750,235Less—Current portion included in current liabilities (5,000) (29) (49,905)
¥70,166 ¥75,266 $700,329
Zero coupon convertible unsecured bonds due in 2009 and2016 above are bonds with share subscription rights issued onDecember 7, 2006. Details of the share subscription rights are asfollows:
2009 bonds 2016 bonds
Class of stock Common Stock Common StockIssue price of shares (Yen) Zero ZeroInitial conversion prices
(Yen/per share) ¥2,175 ¥2,383Total issue price
(Millions of yen) ¥30,000 ¥40,000Ratio of granted rights (%) 100 100Period share subscription From December From December
rights can be exercised 21, 2006 to 21, 2006 toDecember 1, November 22, 2009 2016
Long-term loans Thousands ofMillions of yen Interest U.S. dollars
March 31 rate March 31
2008 2007 2008 2008
Loans principally from banks, due through 2020 ¥56,983 ¥ 74,140 1.4% $568,749
Less—Current portion included in current liabilities (6,363) (17,075) (63,509)
¥50,620 ¥ 57,065 $505,240
The aggregate annual maturities of long-term loans at March31, 2008 are as follows:
Amount
Thousands ofYears ending March 31 Millions of yen U.S. dollars
2009 ¥ 6,363 $ 63,5092010 12,103 120,8002011 27,502 274,4982012 11,002 109,8112013 2 20
7. Income TaxesThe income taxes of the Company and its domestic consolidatedsubsidiaries consist of corporate income taxes, local inhabitants’taxes and enterprise taxes.
The reconciliation of the Japanese statutory income tax rate tothe effective income tax rate for the years ended March 31, 2008and 2007 is as follows:
2008 2007
Statutory income tax rate 40.7% 40.7%Decrease in valuation allowance (4.9) (9.3)Tax credits (4.3) (2.6) Non-taxable income (4.7) (0.7)Difference in statutory tax rates
of foreign subsidiaries (0.0) (0.3)Expenses not deductible for
tax purposes 2.6 1.7Amortization of goodwill 2.7 1.9Other, net (1.8) (0.8)
Effective income tax rate per consolidated statements of income 30.3% 30.6%
At March 31, 2008 and 2007, significant components ofdeferred tax assets and liabilities in the consolidated financialstatements are as follows:
Thousands ofMillions of yen U.S. dollars
March 31 March 31
2008 2007 2008
Deferred tax assets:Net operating tax loss carried forward ¥ 27,061 ¥ 25,244 $ 270,097
Accrued retirement benefits 26,973 28,949 269,218Elimination of unrealized intercompany profits 20,131 18,121 200,928
Reserve for discontinued operations 9,565 12,901 95,469
Accrued bonuses 5,768 5,181 57,571Depreciation and amortization 5,710 4,298 56,992Write-down of assets 4,151 7,658 41,431Enterprise taxes 2,059 2,148 20,551Tax effects related to investments 1,721 8,720 17,177
Allowance for doubtful accounts 1,169 986 11,668
Other 8,657 16,194 86,406Gross deferred tax assets 112,970 130,405 1,127,558Valuation allowance (34,639) (49,902) (345,733)Total deferred tax assets 78,331 80,502 781,825
Deferred tax liabilities:Retained earnings of overseas subsidiaries (5,455) (3,194) (54,447)
Unrealized gains on securities (3,265) (6,374) (32,588)Gains on securities contributed to employees’ retirement benefit trust (3,042) (3,124) (30,362)
Special tax-purpose reserve for condensed booking of fixed assets (800) (1,086) (7,985)
Other (377) (291) (3,763)Total deferred tax liabilities (12,941) (14,072) (129,165)Net deferred tax assets ¥ 65,389 ¥ 66,430 $ 652,650
Deferred tax liabilities related to revaluation:
Deferred tax liabilities on land revaluation ¥ (4,010) ¥ (4,028) $ (40,024)

47
Net deferred tax assets are included in the following items inthe consolidated balance sheets:
Thousands ofMillions of yen U.S. dollars
March 31 March 31
2008 2007 2008
Current assets – deferred tax assets ¥37,086 ¥41,336 $370,157
Fixed assets – deferred tax assets 28,604 27,306 285,498
Current liabilities – other current liabilities (248) (21) (2,475)
Long-term liabilities – other long-term liabilities (53) (2,191) (529)
Net deferred tax assets ¥65,389 ¥66,430 $652,650
8. Research and Development CostsResearch and development costs included in cost of sales andselling, general and administrative expenses for the years endedMarch 31, 2008 and 2007 are ¥81,370 million ($812,157thousand) and ¥72,142 million, respectively.
9. Net AssetsThe Japanese Corporate Law became effective on May 1, 2006,replacing the Commercial Code. Under Japanese laws andregulations, the entire amount paid for new shares is required tobe designated as common stock. However, a company may, by aresolution of the Board of Directors, designate an amount notexceeding one half of the price of the new shares as additionalpaid-in capital, which is included in capital surplus.
The Japanese Corporate Law provides that an amount equalto 10% of distributions from retained earnings paid by theCompany and its Japanese subsidiaries be appropriated as addi-tional paid-in capital or legal earnings reserve. Legal earningsreserve is included in retained earnings in the accompanyingconsolidated balance sheets. No further appropriations arerequired when the total amount of the additional paid-in capitaland the legal earnings reserve equals 25% of their respectivestated capital. The Japanese Corporate Law also provides thatadditional paid-in capital and legal earnings reserve are availablefor appropriations by the resolution of the Board of Directors.
Cash dividends and appropriations to the additional paid-incapital or the legal earnings reserve charged to retained earningsfor the years ended March 31, 2008 and 2007 represent dividendspaid out during those years and the related appropriations to theadditional paid-in capital or the legal earnings reserve.
Retained earnings at March 31, 2008 do not reflect currentyear-end dividends in the amount of ¥3,979 million ($39,715thousand) approved by the Board of Directors, which will bepayable in May 2008.
The amount available for dividends under the JapaneseCorporate Law is based on the amount recorded in the Company’snonconsolidated books of account in accordance with accountingprinciples generally accepted in Japan.
On November 1, 2007, the Board of Directors approved cashdividends to be paid to shareholders of record as of September30, 2007, totaling ¥3,980 million ($39,725 thousand), at a rate of¥7.5 per share. On May 9, 2008, the Board of Directors approvedcash dividends to be paid to shareholders of record as of March31, 2008, totaling ¥3,979 million ($39,715 thousand), at a rate of¥7.5 per share.
10. Contingent LiabilitiesThe Companies were contingently liable at March 31, 2008 forloan and lease guarantees of ¥3,266 million ($32,598 thousand)and at March 31, 2007 for loan and lease guarantees of ¥2,236million.
11. Loss on Impairment of Fixed AssetsThe Companies have recognized loss on impairment of ¥5,702million ($56,912 thousand) and ¥640 million for the followinggroups of assets for the years ended March 31, 2008 and 2007,respectively:
Description Classification Amount
Thousands ofMillions of yen U.S. dollars
March 31 March 31
2008 2007 2008
Manufacturing Machinery and ¥2,361 ¥ — $23,565facilities of equipment, medical and Tools andgraphic film furniture, OthersRental assets Rental business- 91 117 908
use assetsIdle assets Land, 328 522 3,274
Buildings and structures, Machinery, Others
Others Goodwill 2,921 — 29,155Total ¥5,702 ¥640 $56,912
(1) Identifying the cash-generating unit to which an asset belongsEach cash-generating unit is identified based on product linesand geographical areas as a group of assets. For rental assets,cash-generating units are identified based on rental contractsand each geographical area. Each idle asset is also identifiedas a cash-generating unit.
(2) The Companies have written the assets down to the recover-able value and recognized an impairment loss due to worsen-ing of the market environment in the Medical and Graphicbusiness, the decline in real estate value, poor performanceand profitability of rental and idle assets, and the revaluationof goodwill.
(3) Details of impairment of fixed assetsAmount
Thousands ofMillions of yen U.S. dollars
March 31 March 31
2008 2007 2008
Buildings and structures ¥ — ¥ 87 $ —Rental business-use assets — 117 —Machinery and equipment 2,451 — 24,464Goodwill 2,921 — 29,155Others 330 435 3,294
(4) Measuring recoverable amountThe recoverable amount of a cash-generating unit is the fairvalue less costs to sell. The fair value is supported by anappraisal report for land and buildings and structures, or amanagement estimate for rental business-use assets.

48
12. Discontinued OperationsThe amounts included in the statements of income for discon-tinued operations for the years ended March 31, 2008 and 2007represent:
Amount
Thousands ofMillions of yen U.S. dollars
March 31 March 31
2008 2007 2008
Reversal of excess reserve made for discontinued operations in the previous fiscal year ¥ 8,425 ¥17,567 $ 84,090
Loss on discontinued operations in the fiscal year under review (7,834) (18,502) (78,191)
¥ 590 ¥ (935) $ 5,889
13. Patent-Related Income Regarding patent-related income, amounts for patents related tothe Photo Imaging business are aggregate figures that includeboth patent royalties and gains on patent transfers.
14. Extraordinary Losses of Overseas SubsidiariesExtraordinary losses of overseas subsidiaries include ¥581 million($5,799 thousand) of additional allowance for doubtful accountsand correction of deferred income in a British subsidiary; ¥838million ($8,364 thousand) of correction of inventory amounts in a British subsidiary; and ¥312 million ($3,114 thousand) ofcorrection of deferred income in the Danish subsidiary.
15. Actuarial Gains and Losses of Overseas SubsidiariesDefined Benefit Retirement Plans
The actuarial gains and losses of overseas subsidiaries definedbenefit retirement plans included in retained earnings in theconsolidated statements of changes in net assets results fromthe accounting treatment of retirement benefits that affectedcertain consolidated subsidiaries in the United Kingdom and theUnited States.
16. Lease TransactionsProforma information on the Company and its domestic consoli-dated subsidiaries’ finance lease transactions (except for thosewhich are deemed to transfer the ownership of the leased assetsto the lessee) and operating lease transactions is as follows:
As Lessee1) Finance Leases
Thousands ofMillions of yen U.S. dollars
March 31 March 31
2008 2007 2008
Purchase cost:Buildings and structures ¥ 8,426 ¥ 8,841 $ 84,100Machinery and equipment 2,466 2,435 24,613Tools and furniture 6,074 11,348 60,625Rental business-use assets 2,750 4,173 27,448Intangible fixed assets 153 358 1,527
19,871 27,158 198,333Less: Accumulated
depreciation (12,369) (16,037) (123,455)Loss on impairment of leased assets (21) (15) (210)
Net book value ¥ 7,480 ¥ 11,106 $ 74,658
The scheduled maturities of future lease rental payments onsuch lease contracts at March 31, 2008 and 2007 are as follows:
Thousands ofMillions of yen U.S. dollars
March 31 March 31
2008 2007 2008
Due within one year ¥3,037 ¥ 2,913 $30,312Due over one year 4,464 8,236 44,555
Total ¥7,502 ¥11,150 $74,878
Lease rental expenses and depreciation equivalents under thefinance leases which are accounted for in the same manner asoperating leases for the years ended March 31, 2008 and 2007are as follows:
Lease rental expenses for the period ¥3,395 ¥ 4,168 $33,886
Depreciation equivalents ¥3,378 ¥ 1,081 $33,716
Depreciation equivalents are calculated based on the straight-line method over the lease terms of the leased assets.
Accumulated loss on impairment of leased assets as of March31, 2008 and 2007 are as follows:
Thousands ofMillions of yen U.S. dollars
March 31 March 31
2008 2007 2008
Reserve for loss ¥21 ¥15 $210
Loss on impairment and reversals of loss on impairment of leasedassets for the years ended March 31, 2008 and 2007 are asfollows:
Thousands ofMillions of yen U.S. dollars
March 31 March 31
2008 2007 2008
Loss on impairment ¥23 — $230
Reversals of loss ¥16 ¥3,087 $160
2) Operating LeasesThe scheduled maturities of future operating lease rental pay-ments as of March 31, 2008 and 2007 are as follows:
Thousands ofMillions of yen U.S. dollars
March 31 March 31
2008 2007 2008
Due within one year ¥ 5,468 ¥ 5,052 $ 54,576Due over one year 14,016 14,676 139,894
Total ¥19,485 ¥19,728 $194,480

49
On March 1, 2004, the Ministry of Health, Labour andWelfare permitted that the substitutional portion of the MinoltaWelfare Pension Fund be returned to the government, and theremaining portion of the Fund was integrated into a CDBP. A por-tion of the Minolta lump-sum payament plan was transferred to aCDBP on the same date.
On April 1, 2004, a portion of the Minolta lump-sum paymentplan was transferred to a defined contribution pension plan.
The reserve for retirement benefits as of March 31, 2008 and2007 is analyzed as follows:
Thousands ofMillions of yen U.S. dollars
March 31 March 31
2008 2007 2008
a. Retirement benefit obligations ¥(144,011) ¥(149,936) $(1,437,379)
b. Plan assets 91,360 108,766 911,867c. Unfunded retirement
benefit obligations (a+b) (52,651) (41,170) (525,512)
d. Unrecognized actuarial differences 10,276 (4,528) 102,565
e. Unrecognized prior service costs (8,131) (9,557) (81,156)
f. Net amount on consolidated balance sheets (c+d+e) (50,506) (55,256) (504,102)
g. Prepaid pension costs 2,861 2,690 28,556
h. Accrued retirement benefits (f-g) ¥ (53,367) ¥ (57,947) $ (532,658)
Note: Certain subsidiaries use a simplified method for the calculation ofbenefit obligation.
Net retirement benefit costs for the years ended March 31,2008 and 2007 are as follows:
Thousands ofMillions of yen U.S. dollars
March 31 March 31
2008 2007 2008
a. Service costs ¥ 5,662 ¥ 6,383 $ 56,513b. Interest costs 4,410 4,244 44,016c. Expected return on
plan assets (3,095) (2,887) (30,891)d. Amortization of
actuarial differences 1,248 338 12,456e. Amortization of
prior service costs (1,426) (1,529) (14,233)
f. Retirement benefit costs (a+b+c+d+e) 6,799 6,549 67,861
g. Contributions to defined contribution pension plans 3,199 2,745 31,929
Total (f+g) ¥ 9,998 ¥ 9,295 $ 99,790
Note: Retirement benefit costs of consolidated subsidiaries using a sim-plified method are included in “a. Service costs”.In addition to the above retirement benefit costs, ¥460 million($4,591 thousand) of additional retirement expenses were recordedin other income (expenses) for the year ended March 31, 2008.
As Lessor1) Finance Leases
Thousands ofMillions of yen U.S. dollars
March 31 March 31
2008 2007 2008
Leased rental business-use assets:
Purchase cost ¥ 22,648 ¥ 28,524 $ 226,051Less: Accumulated depreciation (13,523) (17,940) (134,974)
Net book value ¥ 9,125 ¥ 10,584 $ 91,077
The scheduled maturities of future finance lease rental incomeas of March 31, 2008 and 2007 are as follows:
Thousands ofMillions of yen U.S. dollars
March 31 March 31
2008 2007 2008
Due within one year ¥4,179 ¥5,089 $41,711Due over one year 4,945 3,953 49,356
Total ¥9,125 ¥9,043 $91,077
Lease rental income and depreciation under the finance leaseswhich are accounted for in the same manner as operating leasesfor the years ended March 31 , 2008 and 2007 are as follows:
Lease rental income for the period ¥4,267 ¥5,638 $42,589
Depreciation ¥3,936 ¥5,312 $39,285
2) Operating LeasesThe scheduled maturities of future operating lease rental incomeas of March 31, 2008 and 2007 are as follows:
Thousands ofMillions of yen U.S. dollars
March 31 March 31
2008 2007 2008
Due within one year ¥2,238 ¥1,694 $22,338Due over one year 3,420 1,677 34,135
Total ¥5,658 ¥3,372 $56,473
17. Retirement Benefit PlansThe Companies have defined benefit retirement plans that includecorporate defined benefit pensions plans (CDBPs), which are gov-erned by the Japanese Welfare Pension Insurance Law, tax-qualifiedpension plans and lump-sum payment plans. In addition, theCompanies may pay additional retirement benefits to employeesat their discretion.
The Company and certain of its domestic subsidiaries changedtheir retirement plans, as follows:
On April 1, 2003, Konica’s tax-qualified benefit plan wastransferred to a CDBP.
On April 30, 2003, a portion of the Konica lump-sum pay-ment plan was transferred to a defined contribution pension plan.
On February 1, 2004, the Ministry of Health, Labour andWelfare permitted that the substitutional portion of the KonicaWelfare Pension Fund be returned to the government, and theremaining portion of the Fund was integrated into a CDBP.

50
A summary of derivative instruments at March 31, 2008 and 2007 is as follows:
(1) Currency-Related DerivativesMillions of yen Thousands of U.S. dollars
March 31 March 31
2008 2007 2008
Contract value Contract value Contract value(notional (notional (notionalprincipal Fair Unrealized principal Fair Unrealized principal Fair Unrealizedamount) value gain (loss) amount) value gain (loss) amount) value gain (loss)
Forward foreign currency exchange contracts:
To sell foreign currencies:US$ ¥34,670 ¥32,782 ¥ 1,887 ¥36,861 ¥36,817 ¥ 44 $346,043 $327,198 $ 18,834EURO 30,954 30,983 (28) 25,352 25,664 (311) 308,953 309,242 (279)
To buy foreign currencies:US$ ¥15,103 ¥13,912 ¥(1,191) ¥ 8,354 ¥ 8,508 ¥ 153 $151,013 $138,856 $(11,887)EURO — — — 1,277 1,286 9 — — —
Total ¥80,729 ¥77,678 ¥ 667 ¥71,846 ¥72,276 ¥(104) $805,759 $775,307 $ 6,657
Notes: 1. Fair value is calculated based on the forward foreign currency exchange rates prevailing as of March 31, 2008 and 2007, respectively.2. Derivative instruments for which hedge accounting is applied are excluded from the above table.
Assumptions used in the calculation of the above informationfor the main schemes of the Company and its domestic consoli-dated subsidiaries are as follows:
2008 2007
Method of attributing Periodic Periodic retirement benefits allocation allocation to periods of service method method
for projected for projected benefit benefit obligations obligations
Discount rate Mainly Mainly 2.5% 2.5%
Expected rate of return Mainly Mainly on plan assets 1.25% 1.25%
Amortization of Mainly Mainly unrecognized prior 10 years 10 yearsservice cost
Amortization of Mainly Mainlyunrecognized actuarial 10 years 10 yearsdifferences
18. DerivativesThe Companies utilize derivative instruments including forwardforeign currency exchange contracts, interest rate swaps and com-modity futures, to hedge against the adverse effects of fluctua-tions in foreign currency exchange rates, interest rates andmaterial prices. The Companies utilize these derivatives as hedgesto effectively reduce the risks inherent in their assets and liabilities.Additionally, the Companies have a policy of limiting the purposeof such transactions to hedging identified exposures only and theyare not held for speculative or trading purposes.
Risks associated with derivative instrumentsAlthough the Companies are exposed to credit-related risks andrisks associated with the changes in interest rates and foreignexchange rates, such derivative instruments are limited to hedgingpurposes only and the risks associated with these transactions arelimited. All derivative contracts entered into by the Companies arewith selected major financial institutions based upon their creditratings and other factors. Such credit-related risks are not antici-pated to have a significant impact on the Companies’ results.
Risk control system for derivative instrumentsIn order to manage market and credit risks, the Finance Divisionof the Company is responsible for setting or managing the posi-tion limits and credit limits under the Company’s internal poli-cies for derivative instruments. Resources are assigned to eachfunction, including transaction execution, administration, and riskmanagement, independently, in order to clarify the responsibilityand the role of each function.
The principal policies on foreign currency exchange instru-ments and other derivative instruments of the Company and itsmajor subsidiaries are approved by the Management Committeeof the Company. Additionally, a Committee, which consists ofmanagement from the Company and its major subsidiaries, meetsregularly, at which time the principal policies on foreign currencyexchange instruments and other derivative instruments arereaffirmed and the market risks are assessed. All derivative instru-ments are reported monthly to the respective responsible officers.Market risks and credit risks for other subsidiaries are controlledand assessed based on internal rules and the derivative instru-ments are approved by the respective President or equivalent ofeach subsidiary.
Interest rate swap contracts are approved by the FinanceManager of the Company and the President or equivalent of othersubsidiaries, respectively.

51
19. Stock Option PlansThe following tables summarize details of stock option plans as of March 31, 2008.
Position and number of grantees Directors and Executive Officers: 26Class and number of stock Common Stock: 194,500Date of issue August 23, 2005Condition of settlement of rights No provisionsPeriod grantees provide service in return for stock options From August 23, 2005 to June 30, 2006Period stock options can be exercised From August 23, 2005 to June 30, 2025
Position and number of grantees Directors and Executive Officers: 23Class and number of stock Common Stock: 105,500Date of issue September 1, 2006Condition of settlement of rights No provisionsPeriod grantees provide service in return for stock options From September 1, 2006 to June 30, 2007Period stock options can be exercised From September 2, 2006 to June 30, 2026
Position and number of grantees Directors and Executive Officers: 24Class and number of stock Common Stock: 113,000Date of issue August 22, 2007Condition of settlement of rights No provisionsPeriod grantees provide service in return for stock options From August 22, 2007 to June 30, 2008Period stock options can be exercised From August 23, 2007 to June 30, 2027
The following table summarizes the movement of outstanding stock options for the years ended March 31, 2008 and 2007.
Number of Shares
Stock options outstanding at March 31, 2006 194,500Granted 105,500Exercised —Forfeited 3,000
Stock options outstanding at March 31, 2007 297,000 Granted 113,000Exercised 29,500Forfeited 1,500
Stock options outstanding at March 31, 2008 379,000
The following table summarizes price information of stock options exercised during th period and outstanding stock options as of March31, 2008.
Per unit information Exercised Outstanding at March 31, 2008
Exercise price of stock options ¥ 1 ¥ 1Average market price of the stock at the time of exercise 1,842 —Fair value per unit (as of grant date) — 1,634
(2) Interest Rate-Related DerivativesMillions of yen Thousands of U.S. dollars
March 31 March 31
2008 2007 2008
Contract value Contract value Contract value(notional (notional (notionalprincipal Fair Unrealized principal Fair Unrealized principal Fair Unrealizedamount) value gain (loss) amount) value gain (loss) amount) value gain (loss)
Interest rate swaps: Pay fixed, receive floating ¥12,655 ¥(62) ¥(62) ¥8,022 ¥34 ¥34 $126,310 $(619) $(619)
Notes: 1. Fair value is provided by the financial institutions with whom the derivative contracts were concluded.2. Contract value (notional principal amount) does not indicate the level of risk associated with interest rate swaps.3. Derivative transactions for which hedge accounting or certain hedging criteria are met are excluded from the above table.

52
20. Segment Information
(1) Business Segment InformationBusiness segment information of the Companies for the years ended March 31, 2008 and 2007 is presented as follows:
Business segment Related business segment products
Business Technologies: Copy machines, printers and othersOptics: Optical devices, electronic materials and othersPhoto Imaging: Photographic film and materials, ink-jet products, cameras and othersMedical and Graphic Imaging: X-ray and graphic film, equipment for medical or graphic use and othersSensing: Industrial and medical measurement instruments and othersOther: Others products not categorized in the above segments
Millions of yen
Business Medical and Eliminations andTechnologies Optics Graphic Imaging Sensing Other Total Corporate Consolidated
2008: Net salesExternal ¥700,969 ¥182,262 ¥161,105 ¥ 9,910 ¥17,320 ¥1,071,568 ¥ — ¥1,071,568Intersegment 5,175 1,083 3,566 768 62,798 73,392 (73,392) —
Total 706,145 183,345 164,671 10,678 80,119 1,144,961 (73,392) 1,071,568
Operating expenses 616,051 152,089 156,896 9,460 76,626 1,011,124 (59,162) 951,962
Operating income ¥ 90,093 ¥ 31,255 ¥ 7,775 ¥ 1,218 ¥ 3,493 ¥ 133,836 ¥ (14,229) ¥ 119,606
Assets ¥445,939 ¥181,938 ¥113,141 ¥ 9,505 ¥73,869 ¥ 824,394 ¥146,143 ¥ 970,538
Depreciation 31,286 15,968 6,048 293 1,996 55,593 4,850 60,443
Impairment losses 1,024 21 4,460 — — 5,506 195 5,702
Capital expenditure 16,588 42,012 4,595 370 2,468 66,035 9,259 75,295
Notes:1. Operating expenses not able to be properly allocated that are included in Eliminations and Corporate are principally R&D expenses incurred by the
Company and expenses associated with head office functions. Such expenses amounted to ¥30,792 million for the year ended March 31, 2008.2. Included within the Eliminations and Corporate figure for assets are ¥183,225 million of corporate assets, which primarily include the holding company’s
surplus operating funds (cash and short-term investment securities) and long-term investment funds (investment securities) as well as other assets heldby the holding company.
3. Changes to business segments:1) The Photo Imaging business was previously listed as a business segment but the importance of that business has decreased due to the discontinua-
tion of that business in accordance with the decision publicly announced on January 19, 2006. Consequently, beginning from the fiscal year underreview, the Photo Imaging business segment is no longer separately listed and is included in the Other segment. As a result of this change, the Otherfigure for operating expenses was increased ¥318 million, the Other figure for operating income was reduced by the same figure and the Otherfigure for assets was increased ¥23,555 million as of and for the year ended March 31, 2008.
2) A part of the Company’s functions and the Group’s U.S.-based holding company were previously included in the Other segment but following thereevaluation of the Company as a pure holding company resulting from reorganization measures based on a re-assessment of the functions of theGroup’s shared functions company and the parent company, from the fiscal year under review, these units are included in the Eliminations andCorporate segment. As a result of this change, the Other figure for intersegment sales was increased ¥9,290 million, the Other figure for operatingexpenses was increased ¥13,974 million, the Other figure for operating income was decreased ¥4,683 million and the Other figure for assets wasdecreased ¥441,613 million as of and for the year ended March 31, 2008.
Millions of yen
Business Photo Medical and Eliminations andTechnologies Optics Imaging Graphic Imaging Sensing Other Total Corporate Consolidated
2007: Net salesExternal ¥658,693 ¥138,960 ¥ 47,752 ¥ 158,705 ¥10,003 ¥ 13,516 ¥1,027,630 ¥ — ¥1,027,630Intersegment 3,955 1,396 9,700 12,249 859 58,313 86,476 (86,476) —
Total 662,648 140,356 57,453 170,955 10,863 71,830 1,114,106 (86,476) 1,027,630
Operating expenses 582,666 119,355 58,278 162,074 9,213 60,164 991,753 (68,129) 923,624
Operating income ¥ 79,982 ¥ 21,000 ¥ (825) ¥ 8,880 ¥ 1,649 ¥ 11,665 ¥ 122,353 ¥ (18,346) ¥ 104,006
Assets ¥479,938 ¥155,413 ¥ 47,704 ¥ 124,727 ¥10,046 ¥486,872 ¥1,304,702 ¥ (353,650) ¥ 951,052
Depreciation 30,050 10,806 — 5,138 210 6,487 52,692 — 52,692
Impairment losses 537 46 — — — 56 640 — 640
Capital expenditure 24,510 24,464 — 8,793 400 5,831 64,000 — 64,000

53
Thousands of U.S. dollars
Business Medical and Eliminations andTechnologies Optics Graphic Imaging Sensing Other Total Corporate Consolidated
2008: Net salesExternal $6,996,397 $1,819,164 $1,607,995 $ 98,912 $172,872 $10,695,359 $ — $10,695,359Intersegment 51,652 10,809 35,592 7,665 626,789 732,528 (732,528) —
Total 7,048,059 1,829,973 1,643,587 106,578 799,671 11,427,897 (732,528) 10,695,359
Operating expenses 6,148,827 1,518,006 1,565,985 94,421 764,807 10,092,065 (590,498) 9,501,567
Operating income $ 899,221 $ 311,957 $ 77,603 $ 12,157 $ 34,864 $ 1,335,822 $ (142,020) $ 1,193,792
Assets $4,450,933 $1,815,930 $1,129,264 $ 94,870 $737,289 $ 8,228,306 $1,458,659 $ 9,686,975
Depreciation 312,267 159,377 60,365 2,924 19,922 554,876 48,408 603,284
Impairment losses 10,221 210 44,515 — — 54,956 1,946 56,912
Capital expenditure 165,565 419,323 45,863 3,693 24,633 659,098 92,414 751,522
(2) Geographic Segment InformationMillions of yen
North Asia and Eliminations and Japan America Europe Other Total Corporate Consolidated
2008: Net salesExternal ¥469,989 ¥233,834 ¥305,687 ¥ 62,056 ¥1,071,568 ¥ — ¥1,071,568Intersegment 353,597 2,848 868 204,822 562,136 (562,136) —
Total 823,586 236,683 306,555 266,879 1,633,704 (562,136) 1,071,568
Operating expenses 702,701 235,561 296,079 261,940 1,496,282 (544,320) 951,962
Operating income ¥120,885 ¥ 1,122 ¥ 10,476 ¥ 4,938 ¥ 137,422 ¥ (17,815) ¥ 119,606
Assets ¥722,432 ¥108,208 ¥162,036 ¥ 91,278 ¥1,083,956 ¥(113,418) ¥ 970,538
Notes:1. Operating expenses not able to be properly allocated that are included in Eliminations and Corporate are principally R&D expenses incurred by the
Company and expenses associated with head office functions. Such expenses amounted to ¥30,792 million for the year ended March 31, 2008.2. Included within the Eliminations and Corporate figure for assets are ¥183,225 million of corporate assets, which primarily include the holding company’s
surplus operating funds (cash and short-term investment securities) and long-term investment funds (investment securities) as well as other assets heldby the holding company.
3. Changes to business segments: A part of the Company’s functions and the Group’s U.S. based holding company were previously included in the Japanand North America segments but, following the reevaluation of the Company as a pure holding company resulting from reorganization measures basedon a re-assessment of the functions of the Group’s shared functions company and the Company, from the fiscal year under review, these units areincluded in the Eliminations and Corporate segment. As a result of this change, the Japan figure for intersegment sales was increased ¥23,065 million,the Japan figure for operating expenses was increased ¥27,947 million, the Japan figure for operating income was decreased ¥4,881 million and theJapan figure for assets was decreased ¥165,221 million as of and for the year ended March 31, 2008. In addition the North America figure for interseg-ment sales was decreased ¥146 million, the North America figure for operating expenses was decreased ¥223 million, the North America figure foroperating income was increased ¥76 million and the North America figure for assets was decreased ¥46,823 million as of and for the year endedMarch 31, 2008.
Millions of yen
North Asia Eliminations and Japan America Europe and Other Total Corporate Consolidated
2007: Net salesExternal ¥460,196 ¥246,786 ¥263,702 ¥ 56,945 ¥1,027,630 ¥ — ¥1,027,630Intersegment 292,774 2,247 969 183,885 479,877 (479,877) —
Total 752,970 249,033 264,672 240,830 1,507,507 (479,877) 1,027,630
Operating expenses 639,740 244,932 254,632 239,016 1,378,321 (454,697) 923,624
Operating income ¥113,230 ¥ 4,100 ¥ 10,040 ¥ 1,814 ¥ 129,186 ¥ (25,179) ¥ 104,006
Assets ¥865,962 ¥179,007 ¥155,426 ¥ 92,420 ¥1,292,817 ¥(341,765) ¥ 951,052

54
Thousands of U.S. dollars
North Asia Eliminations andJapan America Europe and Other Total Corporate Consolidated
2008: Net salesExternal $4,690,977 $2,333,906 $3,051,073 $ 619,383 $10,695,359 $ — $10,695,359Intersegment 3,529,264 28,426 8,664 2,044,336 5,610,700 (5,610,700) —
Total 8,220,242 2,362,342 3,059,737 2,663,729 16,306,058 (5,610,700) 10,695,359
Operating expenses 7,013,684 2,351,143 2,955,175 2,614,433 14,934,445 (5,432,878) 9,501,567
Operating income $1,206,558 $ 11,199 $ 104,561 $ 49,286 $ 1,371,614 $ (177,812) $ 1,193,792
Assets $7,210,620 $1,080,028 $1,617,287 $ 911,049 $10,819,004 $(1,132,029) $ 9,686,975
Note: Major countries or areas other than Japan are as follows:North America ...................U.S.A. and CanadaEurope...............................Germany, France and U.K.Asia and Other...................Australia, China and Singapore
(3) Overseas SalesThousands of Percentage
Millions of yen U.S. dollars of net sales
2008 2007 2008 2008
North America ¥245,486 ¥257,160 $2,450,205 22.9%Europe 312,115 279,324 3,115,231 29.1%Asia and Other 225,182 204,623 2,247,550 21.0%
Notes: 1. Major countries or areas are as follows:North America ...............U.S.A. and CanadaEurope...........................Germany, France and U.K.Asia and Other...............Australia, China and Singapore
2. “Overseas sales” represents sales recognized outside of Japan by the Companies.
21. Net Income per ShareCalculations of net income per share for the years ended March 31, 2008 and 2007, are as follows:
Thousands ofMillions of yen U.S. dollars
March 31 March 31
2008 2007 2008
Net incomeIncome attributable to common shares ¥68,829 ¥72,542 $686,985Income available to common stockholders 68,757 72,518 686,266
Thousands of shares
Weighted average number of common shares outstanding:Basic 530,660 530,778 530,660Diluted 561,580 541,168 561,580
Yen U.S. dollars
Net income per common share:Basic ¥129.71 ¥136.67 $1.29Diluted 122.44 134.00 1.22
22. Significant Subsequent Events1) On April 8, 2008 (U.S. time), Konica Minolta Business Technologies, Inc., which is an operating company of the Business Technologies
business segment, reached agreement with U.K.-based Danka Business Systems PLC regarding the acquisition by Konica MinoltaBusiness Technologies through a U.S.-based subsidiary, Konica Minolta Business Solutions U.S.A., Inc., of U.S.-based Danka OfficeImaging Company (approximately $450 million in sales for the year ended March 31, 2007), which is a wholly owned subsidiary of DankaBusiness Systems. It is anticipated that the transaction procedures will be completed during June 2008 and that the acquisition price willbe approximately $240 million.
2) On April 1, 2008, Konica Minolta Medical & Graphic, Inc., which is an operating company of the Medical and Graphic Imaging businesssegment, transferred ownership of Konica Minolta ID System Co., Ltd., and related business assets to an entity outside the Group. Thegain from this transfer is estimated at approximately ¥5.8 billion ($58 million) for the fiscal year ending March 31, 2009.

55
Independent Auditors’ ReportKonica Minolta Holdings, Inc. and Consolidated Subsidiaries
To the Shareholders and Board of Directors of
Konica Minolta Holdings, Inc.:
We have audited the accompanying consolidated balance sheets of Konica Minolta Holdings, Inc. and consolidated subsidiaries
as of March 31, 2008 and 2007, and the related consolidated statements of income, changes in net assets and cash flows for
the years then ended, expressed in Japanese yen. These consolidated financial statements are the responsibility of the
Company’s management. Our responsibility is to independently express an opinion on these consolidated financial statements
based on our audits.
We conducted our audits in accordance with auditing standards generally accepted in Japan. Those standards require that we plan
and perform the audit to obtain reasonable assurance about whether the financial statements are free of material misstatement.
An audit includes examining, on a test basis, evidence supporting the amounts and disclosures in the financial statements. An
audit also includes assessing the accounting principles used and significant estimates made by management, as well as
evaluating the overall financial statement presentation. We believe that our audits provide a reasonable basis for our opinion.
In our opinion, the consolidated financial statements referred to above present fairly, in all material respects, the consolidated
financial position of Konica Minolta Holdings, Inc. and subsidiaries as of March 31, 2008 and 2007, and the consolidated
results of their operations and their cash flows for the years then ended, in conformity with accounting principles generally
accepted in Japan.
The U.S. dollar amounts in the accompanying consolidated financial statements with respect to the year ended March 31, 2008
are presented solely for convenience of the reader. Our audit also included the translation of yen amounts into U.S. dollar amounts
and, in our opinion, such translation has been made on the basis described in Note 3 to the consolidated financial statements.
Tokyo, Japan
June 13, 2008

56
The Konica Minolta GroupAs of June 30, 2008
Business Technologies
COUNTRY
BUSINESS COMPANY
Konica Minolta Business Technologies, Inc. Japan
PRODUCTION COMPANIES
Konica Minolta Electronics Co., Ltd. JapanKonica Minolta Supplies Manufacturing Co., Ltd. JapanKonica Minolta Supplies Manufacturing Kansai Co., Ltd. JapanToyohashi Precision Products Co., Ltd. JapanKonica Minolta Supplies Manufacturing U.S.A., Inc. U.S.A.Konica Minolta Supplies Manufacturing France S.A.S. FranceKonica Minolta Business Technologies (DONGGUAN) Ltd. ChinaKonica Minolta Business Technologies (WUXI) Co., Ltd. ChinaKonica Minolta Business Technologies
Manufacturing (HK) Ltd. China(Hong Kong)
SALES COMPANIES
Konica Minolta Bizcom Co., Ltd. JapanKonica Minolta Business Solutions Japan Co., Ltd. JapanKonica Minolta Printing Solutions Japan Co., Ltd. JapanKonica Minolta Software Laboratory Co., Ltd. JapanPowerprint, Inc. JapanKonica Minolta Business Solutions do Brasil Ltda. BrazilKonica Minolta Business Solutions (Canada) Ltd. CanadaKonica Minolta Business Solutions (MONTREAL) Inc. CanadaKonica Minolta Business Solutions de Mexico SA de CV. MexicoAlbin Industries, Inc. U.S.A.Frontier Business Systems, Inc. U.S.A.Hughes-Calihan Corporation U.S.A.Konica Minolta Business Solutions U.S.A., Inc. U.S.A.Konica Minolta Danka Imaging Company U.S.A.Konica Minolta Systems Laboratory, Inc. U.S.A.Konica Minolta Business Solutions Austria GmbH AustriaKonica Minolta Business Solutions (BELGIUM) N.V. BelgiumKonica Minolta BH-Poslovna Rjesenja d.o.o. Bosnia and
HerzegovinaKonica Minolta Croatia-Business Solutions d.o.o. CroatiaKonica Minolta Business Solutions Czech spol. Sr.o. Czech
RepublicKonica Minolta Business Solutions Denmark a/s DenmarkKonica Minolta Business Solutions Finland Oy FinlandKonica Minolta Business Solutions France S.A.S. FranceRepro Conseil S.A.S. FranceDevelop GmbH Germanydots Gesellschaft für Softwareentwicklung mbh GermanyECS Buero-und Datensysteme GmbH GermanyKonica Minolta Business Solutions Deutschland GmbH GermanyKonica Minolta Business Solutions Europe GmbH GermanyOffice-boerse. de Internet GmbH GermanyPlankopie Gesellschaft für Burosysteme
(Monchengladbach) mbH Germany
Veenman Deutschland GmbH GermanyKonica Minolta Business Solutions Greece S.A. GreeceKonica Minolta Hungary Business Solutions Ltd. HungaryKonica Minolta Business Solutions Italia S.p.A. ItalyKonica Minolta Baltia UAB LithuaniaKonica Minolta Printing Solutions Benelux B.V. NetherlandsKonica Minolta Business Solutions Norway AS NorwayKonica Minolta Business Solutions Polska s.p. z.o.o. PolandKonica Minolta Business Solutions Portugal,
Unipessoal Lda. PortugalNEA Rent-Aluguer e Comercio de Equipamentos S.A. PortugalKonica Minolta Business Solutions Romania s.r.l. RomaniaKonica Minolta Business Solutions Russia LLC RussiaKonica Minolta Business Solutions SE, Ltd. SerbiaKonica Minolta Slovakia spol. s.r.o. SlovakiaKonica Minolta Business Solutions Slovenia d.o.o. SloveniaKonica Minolta Business Solutions Spain S.A. SpainKonica Minolta Business Solutions Sweden AB SwedenKonica Minolta Business Solutions East Ltd. U.K.Konica Minolta Business Solutions (Ideal) Ltd. U.K.Konica Minolta Business Solutions (UK) Ltd. U.K.Konica Minolta Ukraine UkraineKonica Minolta Business Solutions Australia Pty. Ltd. AustraliaKonica Minolta Printing Solutions Asia Pty. Ltd. AustraliaKonica Minolta Business Solutions (CHINA) Co., Ltd. ChinaKonica Minolta Business Solutions (Shenzhen) Co., Ltd. ChinaKonica Minolta Consulting (SHENZHEN) Co., Ltd. ChinaKonica Minolta Software Development (Dalian) Co., Ltd. ChinaKonica Minolta Business Solutions (HK) Ltd. China
(Hong Kong)Konica Minolta Business Solutions (M) Sdn. Bhd. MalaysiaKonica Minolta Business Solutions (S) Pte. Ltd. Singapore
Optics
COUNTRY
BUSINESS COMPANY
Konica Minolta Opto, Inc. Japan
PRODUCTION COMPANIES
Konica Minolta Components Co., Ltd. JapanKonica Minolta Glass Tech. Co., Ltd. JapanKonica Minolta Opto Devices Co., Ltd. JapanKonica Minolta Opto Products Co., Ltd. JapanKonica Minolta Optical Products (SHANGHAI) Co., Ltd. ChinaKonica Minolta Opto (DALIAN) Co., Ltd. ChinaKonica Minolta Glass Tech Malaysia Sdn. Bhd. Malaysia
SALES COMPANY
Konica Minolta Opto (SHANGHAI) Co., Ltd. China

57
Medical and Graphic Imaging
COUNTRY
BUSINESS COMPANY
Konica Minolta Medical & Graphic, Inc. Japan
PRODUCTION COMPANIES
Konica Minolta Repro Co., Ltd. JapanKonica Minolta Technoproducts Co., Ltd. JapanAmerican Litho Inc. U.S.A.
SALES COMPANIES
Chuo Medical JapanKonica Minolta Graphic Imaging Japan Co., Ltd. JapanKonica Minolta Health Care Co., Ltd. JapanKonica Minolta Health Care System Support Co., Ltd. JapanME Kikai JapanToho Chemical Laboratory Co., Ltd. JapanKonica Minolta Graphic Imaging U.S.A., Inc. U.S.A.Konica Minolta Medical Imaging U.S.A., Inc. U.S.A.Konica Minolta Medical & Graphic Imaging
Europe GmbH GermanyKonica Minolta Medical & Graphic Imaging
Europe B.V. NetherlandsKonica Minolta Medical Systems Russia RussiaKonica Minolta Medical & Graphic (SHANGHAI)
Co., Ltd. China
Sensing
COUNTRY
BUSINESS COMPANY
Konica Minolta Sensing, Inc. Japan
SALES COMPANIES
Konica Minolta Sensing Americas, Inc. U.S.A.Konica Minolta Sensing Europe B.V. GermanyKonica Minolta Sensing Singapore, Pte. Ltd. Singapore
Industrial Inkjet
COUNTRY
BUSINESS COMPANY
Konica Minolta IJ Technologies, Inc. Japan
Other Businesses
COUNTRY
Konica Minolta Business Expert, Inc. JapanKonica Minolta Chemical Corporation JapanKonica Minolta Engineering Co., Ltd. JapanKonica Minolta Information System Corporation JapanKonica Minolta Logistics Co., Ltd. JapanKonica Minolta Planetarium Co., Ltd. JapanKonica Minolta Sogo Service Co., Ltd. JapanKonica Minolta Technology Center, Inc. JapanKonica Minolta Technosearch Corporation JapanKonica Minolta Holdings U.S.A., Inc. U.S.A.Konica Minolta Technology U.S.A., Inc. U.S.A.Konica Minolta (CHINA) INVESTMENT Ltd. China
(In order of business, region and alphabetical order by country name.)

58
Board of DirectorsAs of June 19, 2008
Company NameKonica Minolta Holdings, Inc.
Address1-6-1 Marunouchi, Chiyoda-ku, Tokyo 100-0005, JapanTel: (81) 3-6250-2100Fax: (81) 3-3218-1368URL: http://konicaminolta.com
EstablishedAugust 2003
Paid-in Capital¥37,519 million (US$375 million)
Number of EmployeesParent company: 160 Group: 31,717
Investor Relations ContactTel: (81) 3-6250-2011Fax: (81) 3-3218-1362E-mail: [email protected]
Yoshikatsu Ota
Tadao NamikiPresident of Namiki Office
Tadaaki JagawaAdvisor to the Board, Hino Motors, Ltd.*
Takeo HiguchiChairman and CEO Daiwa House Industry Co., Ltd.
Tohru TsujiSenior Corporate Advisor Member of the Board MARUBENI CORPORATION
Masanori Hondo
Hisao Yasutomi
Hiroshi Ishiko
Shoei Yamana
Akio Kitani
Yasuo Matsumoto
Masatoshi Matsuzaki
*New title as of June 25, 2008
Corporate Data As of March 31, 2008
Yoshikatsu OtaPresident and CEO
Senior Executive Officers
Shoei YamanaIn charge of Corporate StrategyChairman of Risk Management Committee
Hiroshi IshikoIn charge of CSR, Legal Affairs, General Affairs, and ComplianceGeneral Manager, Kansai Headquarters
Yoshihiko SomeyaIn charge of Human Resources, and Corporate Branding
Takashi MatsumaruPresident, Konica Minolta Opto, Inc.
Toshifumi HoriPresident, Konica Minolta Business Expert, Inc.
Akio KitaniIn charge of Supply Chain Management (SCM)President, Konica Minolta Business Technologies, Inc.
Kiyofumi TanidaPresident, Konica Minolta Medical & Graphic, Inc.
Masatoshi MatsuzakiIn charge of Technology StrategyPresident, Konica Minolta Technology Center, Inc.
Yasuo MatsumotoIn charge of Corporate Accounting,Corporate Finance, and IT Innovation
Chairman of the Board
Fumio Iwai
Directors
Executive OfficersAs of June 19, 2008
Executive Officers
Tomohisa SaitoDirector, Konica Minolta Business Technologies, Inc.
Hideki OkamuraExecutive Director, Konica Minolta Business Technologies, Inc.President, Konica Minolta Business Solutions Europe GmbH
Atsushi KodamaExecutive Director, Konica Minolta Business Technologies, Inc.
Takashi SugiyamaExecutive Director, Konica Minolta Business Technologies, Inc.
Takumi KawakamiDirector, Konica Minolta Business Technologies, Inc.President, Konica Minolta Business Solutions Japan Co., Ltd.
Hisashi TokumaruIn charge of New Business Development
Yoshiaki AndoGeneral Manager, Corporate Finance Division
Masaru KameiDirector, Konica Minolta Technology Center, Inc.General Manager, Intellectual Property Center
Yoshifumi JohnoGeneral Manager, Corporate Audit Division
Masami AkiyamaExecutive Director, Konica Minolta Opto, Inc.
Nobuyasu IeujiIn charge of Production InnovationExecutive Director, Konica Minolta Business Technologies, Inc.
Toshihiko KarasakiPresident, Konica Minolta Sensing, Inc.

Investor InformationKonica Minolta Holdings, Inc.
As of March 31, 2008
Common StockAuthorized: 1,200,000,000 sharesOutstanding: 531,664,337 shares
Stock Exchange ListingsTokyo, Osaka, 1st Sections
Number of Shareholders32,599
Independent AuditorKPMG AZSA & CO.
Transfer Agent for Common StockMitsubishi UFJ Trust and Banking Corporation1-4-5, Marunouchi, Chiyoda-ku, Tokyo 100-0005, Japan
Stock Price Chart
Types of Shareholders
Non-Japanese Institutions46.6%
Individuals and Others8.3%
Other Japanese Institutions3.5%
Financial CommodityDealers1.7%
Financial Institutions39.7%
Treasury Stock0.2%
(Point)(Yen)
’06/1 2 3 4 5 6 7 8 9 10 11 12 ’07/1 2 3 4 5 6 7 8 9 10 11 12 ’08/1 2 3 4 5
2.500
2,000
1,500
1,000
500
0
150
75
0
(Million shares)
Share price (left scale) TOPIX average (left scale) Stock turnover (right scale)
Principal ShareholdersInvestment in Konica Minolta Holdings, Inc.
Number of shares held Investment ratio Shareholders (Thousand shares) (%)
Japan Trustee Services Bank, Ltd. (Trust account) 35,834 6.8The Master Trust Bank of Japan, Ltd. (Trust account) 32,328 6.1JPMorgan Chase Bank 380055 29,927 5.6State Street Bank and Trust Company 21,500 4.1The Bank of Tokyo-Mitsubishi UFJ, Ltd. 15,494 2.9Nippon Life Insurance Company 12,009 2.3Japan Trustee Services Bank, Ltd. (Chuo Mitsui Asset Trust and Banking Company,
11,875 2.2Limited Retrust Portion, Sumitomo Mitsui Banking Corporation Pension Trust Account)
The Nomura Trust and Banking Co., Ltd.10,801 2.0
(Holder in Retirement Benefit Trust for The Bank of Tokyo-Mitsubishi UFJ, Ltd.)The Chase Manhattan Bank 385036 9,783 1.8Daido Life Insurance Company 9,040 1.7Note: Although significant shareholder reports from five joint shareholders including The Bank of Tokyo-Mitsubishi UFJ, Ltd., member of the Mitsubishi UFJ Financial
Group, claim that they hold shares of Konica Minolta as set forth below, the Company is unable to confirm the exact number of shares held at period end. Forthis reason only the top 10 shareholders as per the shareholders’ register have been listed.
Reporting obligation Number of shares held Percentage of Companies submitting significant shareholder reports accrual date (Thousand shares) shares held
Mitsubishi UFJ Financial Group, Inc. (Joint holding) December 10, 2007 51,715 9.7%
Note: Although significant shareholder reports from the following companies claim that they hold substantial numbers of shares in Konica Minolta Holdings, Inc. as ofMarch 31, 2008 the Company is unable to confirm the number of shares held and hence these companies have not been included in the major shareholdersoverview stated above.
Reporting obligation Number of shares held Percentage of Companies submitting significant shareholder reports accrual date (Thousand shares) shares held
Fidelity Investments Japan Limited (Joint holding) January 15, 2008 44,548 8.4%
Templeton Asset Management Limited (Joint holding) March 14, 2008 41,512 7.8%
Barclays Global Investors Japan Trust & Banking Co., Ltd. (BTB) (Joint holding) June 29, 2007 23,496 4.4%
AllianceBernstein Japan Ltd. (Joint holding) February 15, 2008 16,700 3.1%
59

Printed in Japan
1-6-1 Marunouchi, Chiyoda-ku, Tokyo 100-0005, Japan Tel (81) 3-6250-2100 Fax (81) 3-3218-1368http://konicaminolta.com
KONICA MINOLTA HOLDINGS, INC.
Printed with ink made fromaroma-free soy bean oil.