Embed Size (px)
Citation preview
KONE Q2INTERIM REPORTFOR JANUARy–JUNE 2012
Cool Vintage design for European residental buildings.
Organic designs for a nostalgic yet progressive look and feel. Warm, earthy colors and the beauty of natural materials are enhanced with a modern twist to create car interiors that look to the past to create the future.
2Q2
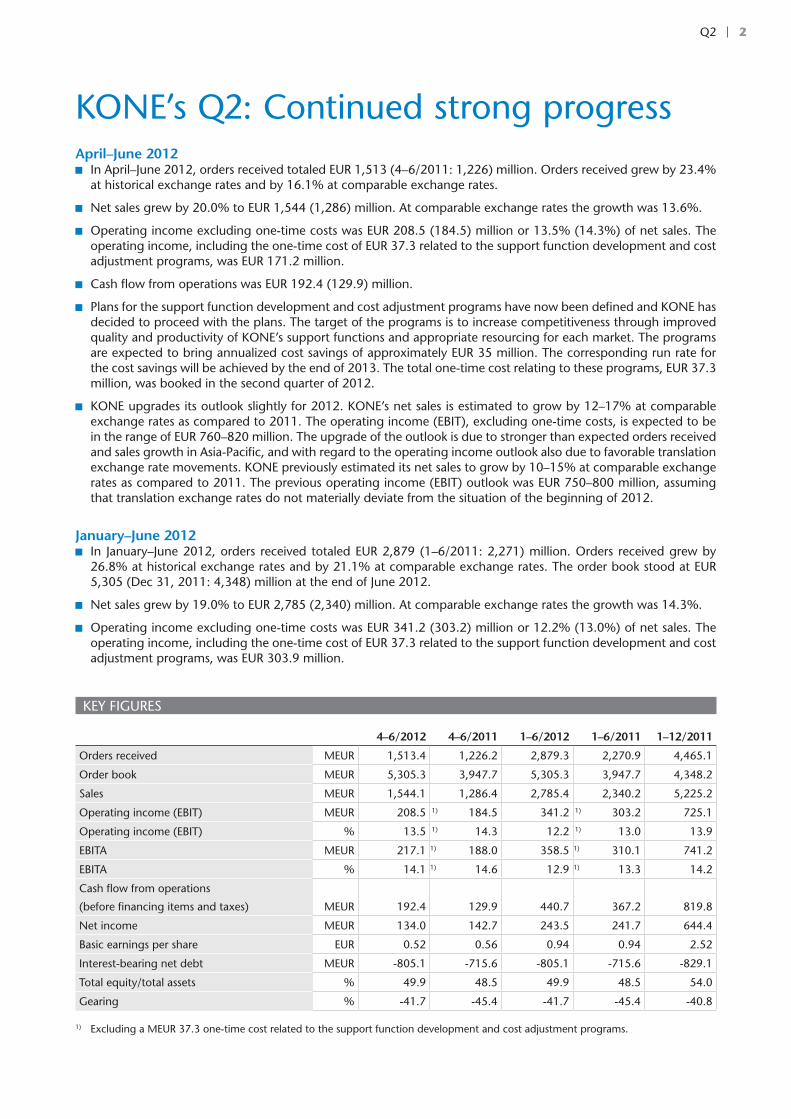
KONE’s Q2: Continued strong progress April–June 2012 In April–June 2012, orders received totaled EUR 1,513 (4–6/2011: 1,226) million. Orders received grew by 23.4%
at historical exchange rates and by 16.1% at comparable exchange rates.
Net sales grew by 20.0% to EUR 1,544 (1,286) million. At comparable exchange rates the growth was 13.6%.
Operating income excluding one-time costs was EUR 208.5 (184.5) million or 13.5% (14.3%) of net sales. The operating income, including the one-time cost of EUR 37.3 related to the support function development and cost adjustment programs, was EUR 171.2 million.
Cash flow from operations was EUR 192.4 (129.9) million.
Plans for the support function development and cost adjustment programs have now been defined and KONE has decided to proceed with the plans. The target of the programs is to increase competitiveness through improved quality and productivity of KONE’s support functions and appropriate resourcing for each market. The programs are expected to bring annualized cost savings of approximately EUR 35 million. The corresponding run rate for the cost savings will be achieved by the end of 2013. The total one-time cost relating to these programs, EUR 37.3 million, was booked in the second quarter of 2012.
KONE upgrades its outlook slightly for 2012. KONE’s net sales is estimated to grow by 12–17% at comparable exchange rates as compared to 2011. The operating income (EBIT), excluding one-time costs, is expected to be in the range of EUR 760–820 million. The upgrade of the outlook is due to stronger than expected orders received and sales growth in Asia-Pacific, and with regard to the operating income outlook also due to favorable translation exchange rate movements. KONE previously estimated its net sales to grow by 10–15% at comparable exchange rates as compared to 2011. The previous operating income (EBIT) outlook was EUR 750–800 million, assuming that translation exchange rates do not materially deviate from the situation of the beginning of 2012.
January–June 2012 In January–June 2012, orders received totaled EUR 2,879 (1–6/2011: 2,271) million. Orders received grew by
26.8% at historical exchange rates and by 21.1% at comparable exchange rates. The order book stood at EUR 5,305 (Dec 31, 2011: 4,348) million at the end of June 2012.
Net sales grew by 19.0% to EUR 2,785 (2,340) million. At comparable exchange rates the growth was 14.3%.
Operating income excluding one-time costs was EUR 341.2 (303.2) million or 12.2% (13.0%) of net sales. The operating income, including the one-time cost of EUR 37.3 related to the support function development and cost adjustment programs, was EUR 303.9 million.
KEy FIgUREs
4–6/2012 4–6/2011 1–6/2012 1–6/2011 1–12/2011
Orders received MEUR 1,513.4 1,226.2 2,879.3 2,270.9 4,465.1
Order book MEUR 5,305.3 3,947.7 5,305.3 3,947.7 4,348.2
sales MEUR 1,544.1 1,286.4 2,785.4 2,340.2 5,225.2
Operating income (EBIT) MEUR 208.5 1) 184.5 341.2 1) 303.2 725.1
Operating income (EBIT) % 13.5 1) 14.3 12.2 1) 13.0 13.9
EBITA MEUR 217.1 1) 188.0 358.5 1) 310.1 741.2
EBITA % 14.1 1) 14.6 12.9 1) 13.3 14.2
Cash flow from operations
(before financing items and taxes) MEUR 192.4 129.9 440.7 367.2 819.8
Net income MEUR 134.0 142.7 243.5 241.7 644.4
Basic earnings per share EUR 0.52 0.56 0.94 0.94 2.52
Interest-bearing net debt MEUR -805.1 -715.6 -805.1 -715.6 -829.1
Total equity/total assets % 49.9 48.5 49.9 48.5 54.0
gearing % -41.7 -45.4 -41.7 -45.4 -40.8
1) Excluding a MEUR 37.3 one-time cost related to the support function development and cost adjustment programs.
3Q2
Matti Alahuhta, President and CEO, in conjunction with the review:
“Our business progressed well in the second quarter of the year. Orders received growth was strong in particular due to our continued good development in Asia-Pacific. Order intake grew by 23% at historical rates and 16% at comparable rates. I am particularly pleased with the continued improvement of the orders received margins. sales grew in all businesses. The growth was 20% at historical rates and close to 14% at comparable rates. New equipment sales grew very rapidly, as a result of which the share of new equipment sales grew to 51% of total sales. Asia-Pacific accounted for 36% of our total sales in the second quarter.
In April we communicated that we would commence the planning of two programs. The target of the first program is to improve the quality and productivity of our support functions through the clarification of roles and simplification of processes, and the target of the second program is to adjust our resourcing in some countries, where the markets have dropped to a clearly lower level in the past years. The plans for these programs have now been defined. We expect these programs to reduce approximately 550 jobs globally during the next 18 months. Our objective is to manage this change through natural attrition and reduced temporary labor to the largest extent possible. We expect to get annualized cost savings of approximately EUR 35 million. The corresponding run rate for the cost savings will be achieved by the end of 2013. The total one-time cost relating to the programs, which was booked in the second quarter, is EUR 37.3 million.
Our operating income for the April–June 2012 period excluding the one-time cost totaled EUR 208.5 (184.5) million or 13.5% (14.3%) of net sales. Operating income grew as a result of continued strong new equipment sales growth in Asia-Pacific and a good development in the maintenance business. In addition, the favorable development of translation exchange rates as compared to the prior year contributed to the improvement. The growth of the oper-ating income remained burdened by intangible asset amortizations resulting from the consolidation of giantKONE as a subsidiary, intense price competition, increased labor costs in Asia and higher raw material costs. Cash flow was strong at EUR 192.4 (129.9) million. I am very pleased with the development of our business, and I want to thank all of our people, who have again done a good job.
We announced in June the introduction of a new innovative global volume elevator offering. This is KONE’s most important product launch in 16 years. We expect this new offering to cover a very significant part of KONE’s new elevator and full elevator replacement volumes in the coming years. We will start selling the new elevator offering in Europe and Asia-Pacific during the second half of 2012 and in the Americas in the first half of 2013. With the new offering, we take major steps forward in the areas of eco-efficiency, ride comfort, visual design and space efficiency. We are very excited about this development, in particular as we are introducing these new elevators while our current product competitiveness is already strong.
We have upgraded our business outlook slightly for 2012 due to stronger than expected orders received and sales growth in Asia-Pacific as well as favorable translation exchange rate movements. While we look forward with confi-dence thanks to our competitiveness and strong order book, the uncertainty in the development of the global econ-omy has clearly increased during the last few months. We have to be prepared for increasingly challenging market scenarios. We aim to again take the difficult market situation as an opportunity – as we did already in 2008–2009.”
4Q2
Accounting PrinciplesKONE Corporation’s Interim Report for January–June 2012 has been prepared in line with IAs 34, `Interim Financial Report-ing´. KONE has applied the same accounting principles in the preparation of this Interim Report as in its Financial state-ments for 2011, published on January 26, 2012. Additionally, the effective changes in IAs/IFRs standards during 2012 have been adopted. These changes have no material impact on the Interim Report. The information presented in this Interim Report has not been audited.
April–June 2012 review
Operating environment in April–June The development of the operating environment was largely in line with KONE’s expectations and no substantial changes in the overall market trends were seen in the second quarter of 2012. In the Europe, Middle East and Africa (EMEA) region, the new equipment market declined somewhat in Central and North Europe, but remained at a relatively good level. The new equipment market declined further from an already weak level in south Europe. The new equipment market in the Ameri-cas region continued to gradually recover. The market in Asia-Pacific continued to grow, although the growth rate slowed down somewhat as compared to the first quarter of 2012. The major projects segment remained active, in particular in Asia-Pacific and the Middle East. The global modernization market declined slightly, although with regional variations. Mainte-nance markets continued to develop favorably in all regions. The pricing environment continued to be challenging in all businesses, in particular in markets suffering from a prolonged weakness in the new equipment market.
In the EMEA region, the new equipment market declined somewhat in Central and North Europe. The market grew in germany, Austria and switzerland. The market declined in sweden and showed some signs of weakening in the residen-tial segment in Belgium. The market remained, however, at a good level in both countries. The markets in Ireland and the Netherlands continued to decline. In south Europe, the new equipment market declined further from an already low level in spain and Italy. A decline was seen also in France, where the market developed positively in the first quarter of the year. The market grew in Turkey. In the Middle East, the new equipment market remained strong in saudi Arabia and showed signs of recovery in Qatar as well as Dubai in the United Arab Emirates. The new equipment market in Russia continued to grow. The modernization market declined in Central and North Europe from a relatively good level of the second quarter of 2011. The modernization market in south Europe continued to decline. Maintenance markets continued to develop well in the EMEA region, but price competition remained intense in particular in the non-residential segments.
In the Americas region, the new equipment market contin-ued to gradually recover. The new equipment market recovery in the United states continued to be primarily driven by mid-sized projects in the residential and office segments. The infra-structure segment and other publicly funded projects remained at a low level. Vacancy rates in the office segment developed favorably in particular on the West Coast and in Texas. Follow-ing a prolonged period of decline, market conditions started to gradually improve also in markets such as Florida and the Mid-
west. The new equipment market grew slightly in Canada and was stable in Mexico. The modernization market grew slightly in the Americas. Maintenance markets developed well, but price competition remained intense in particular in the non-residential segments.
In the Asia-Pacific region, the growth of the new equipment markets continued. In China, all segments grew, albeit at a somewhat lower rate than in the first quarter. The growth in the residential segment continued to be driven by the afford-able housing segment in both higher- and lower-tier cities as well as other residential segments in the inland lower-tier cit-ies. In large cities, the residential segments other than afford-able housing continued to be impacted by the Chinese gov-ernment’s measures aiming to manage the development of housing prices and overall inflation. The commercial segment continued to grow supported by increased focus from the developers on non-residential segments as a result of the gov-ernment policies impacting the opportunities in the residential segment. The infrastructure segment developed favorably due to growth in metro and airport activity, while high-speed rail-way investments have stabilized at a low level. The new equip-ment market in India continued to grow moderately driven primarily by the residential segment despite general economic uncertainties. In Australia, both the new equipment and the modernization market were relatively stable, although with regional variations. The southeast Asian markets remained on the growth path with the new equipment markets in Indonesia, Thailand and Malaysia growing the fastest. Maintenance mar-kets in Asia-Pacific continued to develop favorably. The pricing environment remained challenging in all markets.
Financial performance in April-JuneOrders received increased by 23.4% as compared to April–June 2011, and totaled EUR 1,513 (4–6/2011: 1,226) million. Excluding giantKONE, which was consolidated as a subsidiary as of December 2011, orders received grew by 11.2%. At com-parable exchange rates, KONE’s orders received increased by 16.1%. The positive development in the orders received mar-gin continued.
New equipment orders received grew strongly and KONE was successful in both the volume and the major projects businesses. Modernization orders received declined some-what. KONE does not include maintenance contracts in orders received.
The growth in orders received was the strongest in Asia-Pacific, where orders received grew the most in China and in southeast Asia. Orders received declined somewhat in the EMEA region, both in Central and North Europe and in south Europe. The best development was seen in Finland, Austria, switzerland, Russia and the Middle East. KONE’s order intake grew clearly in the Americas with growth in all of KONE’s main markets.
KONE’s largest orders during the second quarter included an order in Finland to deliver 60 escalators and 41 elevators to the West Metro project. In China, KONE won an order to sup-ply 82 escalators to the new Wuxi metro line in Jiangsu Prov-ince, an order to deliver 67 elevators and 82 escalators to The Hub in shanghai, and an order to deliver 44 elevators and 34 escalators to the Riverside Century Plaza in Wuhu, Anhui Prov-ince. In Thailand, KONE won an order to deliver 32 elevators to a new residential development Noble Ploenchit in Bangkok.
Interim Report for January–June 2012
5Q2
KONE’s January–June 2012 review
KONE’s net sales grew by 20.0% as compared to April–June 2011, and totaled EUR 1,544 (4–6/2011: 1,286) million. Net sales growth excluding giantKONE was 14.0%. At comparable exchange rates KONE’s net sales growth was 13.6%. Net sales grew in all geographic regions.
New equipment sales accounted for EUR 784.8 (610.4) mil-lion and represented an increase of 28.6% over the comparison period. At comparable exchange rates, new equipment sales grew by 19.8%.
service (maintenance and modernization) sales grew by 12.3% and totaled EUR 759.3 (676.0) million. At comparable exchange rates, the increase was 7.9%. Both maintenance and modernization sales grew at a good rate, modernization sales at a somewhat higher rate than maintenance sales.
In connection with its first-quarter results announcement, KONE announced that it would commence the planning of two programs targeting increased competitiveness. KONE has now defined plans for these programs and decided to proceed with the plans. The first of the programs targets improved qual-ity and productivity of KONE’s support functions, and the other program an adjustment in resourcing in such countries, where the market has declined more permanently to a weak level. Regarding the latter program, the adjustment to the changed business environment has now already progressed in some markets. In the program to develop KONE’s support functions, the principal aim is to improve their quality and productivity through further harmonization, clarification of roles and sim-plification. The implementation of the programs will take place over a period of 18 months. Overall, the programs described above are expected to bring annualized cost savings of approx-imately EUR 35 million. The corresponding run rate for the cost savings will be achieved by the end of 2013. Approximately 550 jobs globally are expected to be affected. The implications to personnel will be managed through natural attrition and reduced temporary labor to the largest extent possible. KONE will simultaneously continue to recruit in selected markets to support future growth. The total one-time cost relating to the programs, EUR 37.3 million, has been booked in the second quarter of 2012 and almost all of the cost has been recognised as a restructuring provision at the end of the reporting period.
KONE’s operating income for the April–June 2012 period excluding one-time costs totaled EUR 208.5 (184.5) million or 13.5% (14.3%) of net sales. The operating income, including the one-time cost of EUR 37.3 million related to the support function development and cost adjustment programs, was EUR 171.2 million. The growth in operating income was a result of continued strong new equipment sales growth in Asia-Pacific, a good development in the maintenance business as well as a favorable development of translation exchange rates as com-pared to the prior year. The growth of the operating income
remained burdened by intangible asset amortizations resulting from the consolidation of giantKONE as a subsidiary, intense price competition, increased labor costs in Asia and higher raw material costs. The impact of the amortizations relating to the consolidation of giantKONE on the relative operating income was 0.3 percentage points. KONE also continued to increase fixed costs in areas that support the growth of the business, in particular in Asia-Pacific, research and development and pro-cess development. In addition, the growth of the share of new equipment sales relative to total sales burdens KONE’s relative operating income in 2012.
Cash flow from operations before financing items and taxes in April–June 2012 was strong at EUR 192.4 (129.9) million. The primary driver of the strong cash flow was the growth in operating income. Net working capital before financing items and taxes remained at a good level.
January–June 2012 review
Orders received and Order book in January–JuneDuring January–June 2012, the new equipment market declined slightly in Central and North Europe but remained at a relatively good level, whereas the market situation in south Europe weakened further. The gradual recovery of the new equipment market in the Americas continued to progress. The growth of the new equipment markets in Asia-Pacific contin-ued, albeit at a clearly lower rate than in the previous year. Modernization markets declined slightly. Maintenance markets continued to grow. The pricing environment was challenging in all businesses, in particular in markets suffering from a pro-longed weakness in the new equipment market.
Orders received grew by 26.8% as compared to January–June 2011, and totaled EUR 2,879 (1–6/2011: 2,271) million. Excluding giantKONE, which was consolidated as a subsidiary as of December 2011, orders received growth was 16.9%. At comparable exchange rates, KONE’s orders received grew by 21.1%. The orders received margin developed positively. KONE does not include maintenance contracts in orders received.
The order book grew from the end of 2011 by 22.0% and stood at a record high level of EUR 5,305 (Dec 31, 2011: 4,348) million at the end of June 2012. At comparable exchange rates, the increase was 19.8%. The margin of the order book remained at a healthy level. The margin of the order book declined in 2011, and started to improve during the first half of 2012.
In the EMEA region, orders received grew slightly as com-pared to January–June 2011. The new equipment order intake growth was the fastest in the Middle East, Russia, Austria, switzerland and the Nordic countries. New equipment orders
sAlEs By gEOgRAPHICAl REgIONs, MEUR
4–6/2012 % 4–6/2011 % 1–6/2012 % 1–6/2011 % 1–12/2011 %
EMEA 1) 758.1 49 709.9 55 1,418.7 51 1,306.6 56 2,893.7 55
Americas 233.6 15 202.8 16 438.6 16 429.8 18 947.3 18
Asia-Pacific 552.4 36 373.7 29 928.1 33 603.8 26 1,384.2 27
Total 1,544.1 1,286.4 2,785.4 2,340.2 5,225.2
1) EMEA = Europe, Middle East, Africa
6Q2
received declined in the United Kingdom, the Netherlands, Italy, spain and Ireland. KONE’s modernization order intake in the EMEA region declined slightly as compared to January–June 2011. Modernization orders received grew the most in Austria, Belgium, switzerland and Russia, and declined the most in ger-many, the United Kingdom, spain, Italy and the Netherlands.
In the Americas, KONE’s orders received grew clearly com-pared to January–June 2011. New equipment orders received grew very strongly in Canada and significantly in the United states and Mexico. The modernization order intake declined slightly.
In Asia-Pacific, orders received grew very strongly as com-pared to the first half of 2011. Orders received grew in China, southeast Asia and India. China and southeast Asia had the highest growth rates. Orders received declined in Australia. Modernization orders received declined somewhat.
Net salesKONE’s net sales grew by 19.0% as compared to January–June 2011, and totaled EUR 2,785 (1–6/2011: 2,340) million. Net sales growth excluding giantKONE was 13.5%. At comparable exchange rates, KONE’s net sales grew by 14.3%.
New equipment sales accounted for EUR 1,318 (1,028) mil-lion and represented an increase of 28.2% over the comparison period. At comparable exchange rates, new equipment sales grew by 21.4%.
service (maintenance and modernization) sales increased by 11.9% and totaled EUR 1,468 (1,312) million. At comparable exchange rates, the increase was 8.6%. Both maintenance and modernization sales grew at a good rate, modernization sales at a slightly higher rate than maintenance sales.
sales in the EMEA region grew clearly as compared to January–June 2011. sales grew in all businesses.
sales in the Americas declined somewhat in local curren-cies as compared to the first half of 2011. New equipment sales decreased due to the weak new equipment order intake in 2010. In the American market, the time lag from order to deliv-ery is longer than in other markets. Maintenance sales grew somewhat and modernization sales was stable.
sales in Asia-Pacific grew very strongly as compared to January–June 2011. sales grew in all businesses.
The geographical distribution of net sales was 51% (56%) EMEA, 16% (18%) Americas and 33% (26%) Asia-Pacific.
Financial resultKONE’s operating income (EBIT) excluding one-time costs grew and reached EUR 341.2 (1–6/2011: 303.2) million or 12.2% (13.0%) of net sales. The operating income, including the one-time cost of EUR 37.3 related to the support function development and cost adjustment programs, was EUR 303.9 million. The growth in operating income was a result of contin-ued strong new equipment sales growth in Asia-Pacific, a good development in the maintenance business as well as a favorable development of translation exchange rates as compared to the prior year. The growth of the operating income was burdened by intangible asset amortizations resulting from the consolida-tion of giantKONE as a subsidiary, intense price competition, increased labor costs in Asia and higher raw material costs. The impact of the amortizations relating to the consolidation of giantKONE on the relative operating income was 0.3 per-centage points. KONE also continued to increase fixed costs in
areas that support the growth of the business, in particular in Asia-Pacific, research and development and process develop-ment. In addition, the growth of the share of new equipment sales relative to total sales burdens KONE’s relative operating income in 2012.
Net financing items was EUR 10.4 (4.5) million. KONE’s income before taxes was EUR 316.7 (312.0) million. Taxes totaled EUR 73.2 (70.3) million, taking into account taxes proportionate to the amount estimated for the financial year and certain prior year tax benefits booked during the report-ing period. The estimated effective tax rate for the full finan-cial year, excluding these prior year tax benefits, is 24.0%. Net income for the period under review was EUR 243.5 (241.7) million.
Earnings per share was EUR 0.94 (0.94). Equity per share was EUR 7.49 (6.16).
Consolidated statement of financial position and Cash flowKONE’s financial position was very strong and the company had a clearly positive net cash position at the end of June 2012. Cash flow from operations before financing items and taxes in January–June 2012 was EUR 440.7 (1–6/2011: 367.2) million. Net working capital before financing items and taxes improved. The primary reasons for the good cash flow were the good level of advance payments received relative to inventories, as well as an increase in accounts payable. At the end of June 2012, net working capital was EUR -465.0 (December 31, 2011: -361.4) million, including financing items and taxes.
Interest-bearing assets exceeded interest-bearing debts and the net cash position totaled EUR 805.1 (December 31, 2011: 829.1) million. gearing was -41.7%, compared with -40.8% at the end of 2011. KONE’s total equity/total assets ratio was 49.9% (December 31, 2011: 54.0%) at the end of June.
Capital expenditure and acquisitionsKONE’s capital expenditure, including acquisitions, totaled EUR 71.0 (1–6/2011: 39.7) million. Capital expenditure, excluding acquisitions, was mainly related to facilities and equipment in production, R&D and IT. Acquisitions accounted for EUR 19.2 (18.3) million of this figure.
KONE announced in July 2010 the relocation and expansion of its manufacturing and R&D unit within Kunshan, China. The construction works have progressed well and are completed in phases during 2012 and 2013. Most of the production was moved to the new facilities during the second quarter of 2012. The investments related to these production facilities have been reported as capital expenditure during the second quarter of 2012. The remaining production facilities as well as the office building and R&D units will be completed in phases during the second half of 2012 and 2013. KONE receives a reloca-tion grant from the city of Kunshan, the majority of which has already been received. This grant reduced the net investment in the first half of 2012.
During January–June 2012, KONE acquired the business of Eagle Elevator Corporation, an independent elevator service company in Minnesota, UsA. In addition, KONE completed a number of small acquisitions of European maintenance compa-nies during the reporting period. The acquisitions completed during the reporting period do not individually or as a whole
KONE’s January–June 2012 review
7Q2
have a material impact on the result or financial position of KONE.
Research and developmentResearch and development expenses totaled EUR 42.6 (1–6/2011: 39.4 million), representing 1.5% (1.7) of net sales. R&D expenses include the development of new product and service concepts and the further development of existing solu-tions and services. KONE’s elevators and escalators are based on industry-leading energy efficient technology.
KONE’s customers and end users are at the centre of its research and development efforts. In accordance with its vision of delivering the best People Flow™ experience, KONE focuses on understanding the needs of its customers and the users of its solutions in order to ease people flow in buildings and improve user experience. One of KONE’s five development programs, Innovative solutions for People Flow, is targeted to developing innovative products for an increasingly urbanizing world with a focus on eco-efficiency, ride comfort and visual design.
During the reporting period, KONE announced the intro-duction of a new innovative volume elevator offering. This new elevator offering will cover a significant part of KONE’s new equipment deliveries globally and is expected to eventually cover 60% of KONE’s new equipment volume and 90% of its full replacement volume in modernization. The new offering will be available in Europe and Asia-Pacific during the second half of 2012 and in the Americas in the first half of 2013.
The new offering will further improve KONE’s product competitiveness from the already high current level. The most important improvements are in the area of eco-efficiency, ride comfort, visual design as well as space efficiency. The new offer-ing includes the machine-room-less KONE Monospace® for the global markets, and the KONE N Minispace™ with a small machine room for the Asian markets.
The new elevators are up to 35% more energy-efficient compared to the already high levels of energy efficiency achieved by KONE in 2010. KONE announced in 2010 that it had reached its target of reducing the energy consumption of its volume elevators by 50% compared to the 2008 level. The continued significant improvement in energy efficiency of the new product offering is delivered by the completely renewed KONE EcoDisc® hoisting machine, an efficient drive and enhanced standby solutions.
In addition, a systematic and holistic redesign effort has enabled KONE to introduce a new level of ride comfort to its volume range elevators. This is achieved by significant improvements in multiple areas that impact elevator ride com-fort, including a new motor control system, a new braking sys-tem, a new hoisting machine and system, and an improved car structure. A comprehensive test on the elevator’s ride per-formance, which will be conducted on every KONE elevator before handover, is a further significant improvement to the installation process, contributing to enhanced ride comfort.
The new offering features also completely new designs for KONE’s elevator interior elements, including a new expanded KONE Design Collection, which offers over 50 car interiors for both new elevator installations and elevator modernization projects. The availability of a wide range of designs enables KONE’s customers to choose elevator interiors to fit seamlessly in the design of their building. KONE continues to differenti-ate with attractive product design, which was also noted by
the design industry in the form of design awards during the reporting period.
The improved space efficiency of the new offering expands KONE’s addressable market in modernization, as the new eleva-tors can be fitted in smaller shafts compared to previous mod-els. This is expected to significantly improve the competiveness of KONE’s solutions in modernization.
During January–June 2012, KONE also launched Direct Drive, an innovative and energy-efficient escalator drive sys-tem designed for escalators and autowalks for the infrastructure and commercial segments. The new solution contributes to the reduction of the energy consumption of a typical escalator con-figuration by 19% from the 2010 base value.
Changes in the Executive BoardKONE announced in May 2012 changes in the KONE Executive Board and organization. KONE’s management structure for its geographical areas changed as of July 1, 2012. This change was made to reflect the rapid growth of the elevator and escala-tor market in Asia-Pacific, in particular in China. Following the change, KONE’s business in China was separated from the Asia-Pacific area. The new greater China area comprises of Mainland China, Hong Kong and Taiwan. William B. Johnson, who has been the country manager of China since 2004, was appointed Executive Vice President, greater China. He became a member of the Executive Board and reports to Matti Alahuhta, President and CEO. In the new structure, KONE Middle East is part of the new Asia-Pacific and Middle East area. Noud Veeger continues to lead the area, now as Executive Vice President, Asia-Pacific and Middle East.
Juho Malmberg, Executive Vice President, Customer Expe-rience left KONE as of June 30, 2012. In addition to his cur-rent role, Ari lehtoranta, Executive Vice President, Central and North Europe assumed responsibility for the Customer Experi-ence development program, one of the five key development programs in KONE.
KONE announced in June 2012 the appointment of larry g. Wash as Executive Vice President, Americas as of July 23, 2012, following Vance Tang, who decided to leave KONE. larry Wash will be a Member of the Executive Board and report to Matti Alahuhta, President and CEO.
PersonnelThe objective of KONE’s personnel strategy is to help the com-pany meet its business targets. The main goals of this strategy are to further secure the availability, engagement, motivation and continuous development of its personnel. All of KONE’s activities are guided by ethical principles. The personnel’s rights and responsibilities include the right to a safe and healthy work-ing environment, personal well-being as well as the prohibition of any kind of discrimination.
KONE identified Employee Engagement as one of its five development programs as of the beginning of 2011, and launched an action plan focusing on the further development of leadership capabilities, on providing growth and develop-ment opportunities for KONE employees, and on ensuring well-being and safety at work. During the reporting period, KONE piloted new learning packages on change management and on branch management, completed an education mate-rial package on preventing physical injuries as well as launched new toolkits for communication on well-being.
KONE’s January–June 2012 review
8Q2
During January–June 2012, KONE’s seventh annual employee survey was conducted with an all-time high response rate. The results were discussed with all employees during the second quarter of the year, and workshops were held to put action plans together. The delivery of learning programs such as the supervisor Development Program and KONE leader continued as planned.
KONE had 38,317 (December 31, 2011: 37,542) employees at the end of June 2012. The average number of employees was 37,901 (1–6/2011: 34,122).
The geographical distribution of KONE employees was 49% (December 31, 2011: 50%) in EMEA, 14% (14%) in the Ameri-cas and 37% (36%) in Asia-Pacific.
EnvironmentKONE’s aim is to be the eco-efficiency leader in its industry. The focus in the development of eco-efficient solutions is on further improving energy-saving stand-by and hoisting solu-tions for elevators. The most significant environmental impact of KONE’s business globally relates to the amount of electric-ity used by KONE equipment in their lifetime. This underlines the importance of energy-efficient innovations for elevators and escalators. The most significant impact on KONE’s carbon footprint from its own operations relates to the company’s car fleet, electricity consumption and logistics.
During January–June 2012, KONE continued to work on further decreasing the energy consumption of its elevators and further increasing energy efficient references globally, for example by installing elevators to net zero energy buildings. During the reporting period, KONE announced the launch of a new global volume elevator offering, which is up to 35% more energy-efficient compared to levels of energy-efficiency achieved in 2010 for previous models.
During the reporting period, KONE published its Corporate Responsibility Report 2011, which follows the B application level of the global Reporting Initiative guidelines. The reported greenhouse gas emissions in 2011 have been assured by an objective third party. KONE has identified new environmental targets to further improve the energy efficiency of the next generation KONE elevators and escalators. The other ambi-tious targets in the Environmental Excellence program for 2011–2013 focus on reducing greenhouse gas emissions from KONE’s operations. KONE also continues to focus on the envi-ronmental aspects of its supply chain network.
Other events KONE announced in March 2010 that certain municipalities, public authorities and companies in Austria had filed civil dam-age claims against leading elevator and escalator companies, including KONE ’s Austrian subsidiary KONE Ag. The claims relate to the 2007 decision of the Austrian Cartel Court con-cerning practices prior to mid-2004. some further claims have been served since the announcement. All claims are indepen-dent and progress procedurally in different stages, with some processes having ended favourably to KONE. The total amount claimed jointly and severally from all of the defendants together amounted to EUR 169 million at the end of June 2012. KONE’s position is that the claims are without merit. No provision has been made.
KONE announced in January 2011 that certain companies and public entities had filed civil damage claims against KONE’s
german subsidiary KONE gmbH and certain other elevator and escalator companies operating in germany. The claims relate to activities on the german market and are a result of the deci-sion by the European Commission in 2007 on the respective companies concerning alleged anticompetitive practices in the local markets before early 2004. some further claims have been served since the announcement. All claims are indepen-dent and progress procedurally in different stages. The total amount claimed jointly and severally from all of the defendants together amounted to EUR 78 million at the end of June 2012. KONE’s position is that the claims are without merit. No provi-sion has been made.
Risk managementKONE is exposed to risks, which may arise from its operations or changes in the business environment. The risk factors described below can potentially have an adverse effect on KONE’s busi-ness operations and financial position and hence the value of the company. Other risks, which are currently either unknown or considered immaterial to KONE may, however, become material in the future.
A significant weakening of the global new equipment mar-kets, in China in particular, could result in a decrease in orders received, cancellations of agreed deliveries, delays in the com-mencement of projects, further intensified price competition and as a result negatively affect KONE’s profitability.
The continued uncertain global economic environment also exposes KONE to counterparty risks in respect of financial insti-tutions and customers. The exposure to the counterparty risks related to financial institutions arises through the significant amounts of liquid funds deposited into financial institutions in Europe and in China. In order to diversify the financial credit risk KONE deposits its funds into several banks and invests a part of its liquidity into highly liquid money market funds. KONE also manages its counterparty risk by accepting only counterparties with high creditworthiness. The size of each counterparty limit reflects the creditworthiness of the counterparty and KONE constantly evaluates such limits.
KONE is also exposed to risks related to the liquidity and payment schedules of its customers, which may lead to credit losses. To mitigate this risk, defined rules for tendering, levels of approval authority and credit control have been established. The risks related to accounts receivable are minimized also through the use of advance payments, documentary credits and guarantees in KONE’s payment terms. KONE’s customer base consists of a large number of customers in several market areas and no individual customer represents a material share of KONE’s sales.
KONE operates internationally and is thus exposed to risks arising from foreign exchange rate fluctuations related to cur-rency flows from revenues and expenses and from the transla-tion of income statement and statement of financial position items of foreign subsidiaries into euros. The KONE Treasury is responsible for the centralized management of financial risks in accordance with the KONE Treasury Policy approved by the Board of Directors. For further information regarding financial risks, please refer to note 2 in the consolidated Financial state-ments.
KONE’s business activities are dependent on the uninter-rupted operation, quality and reliability of sourcing channels, production plants, logistics processes and the IT systems used.
KONE’s January–June 2012 review
9Q2
A significant part of KONE’s component suppliers and supply capacity is located in China. These risks are controlled by ana-lyzing and improving the fault tolerance of processes, accurate forecasting, close cooperation with KONE’s suppliers and by increasing the readiness for transferring the manufacturing of critical components from one production line or supplier to another. KONE actively monitors the operations and financial strength of its key suppliers. The aim is also to secure the avail-ability of alternative sourcing channels for critical components and services. Additionally, KONE has a global property damage and business interruption insurance program in place.
Changes in raw material and component prices are reflected directly in the production costs of elevators, escalators and automatic doors. The increases in raw material and compo-nent prices have had and may continue to have a negative impact on KONE’s profitability. In order to reduce material and sourcing price fluctuation KONE aims to enter into fixed price contracts with its major suppliers for a part of its raw material and component purchases. The maintenance business deploys a significant fleet of service vehicles, and fuel price fluctuations therefore have an effect on the cost of maintenance.
KONE operates in certain markets with high growth rates, where there are challenges in the availability of skilled techni-cians. This can lead to delays in deliveries and increases in costs, which can have an adverse impact on the profitability of the company. KONE manages this risk by proactive project and resource planning in order to ensure that required resources are available.
A significant part of KONE’s sales consists of services which are less susceptible to the effects of economic cycles, but which are very labor-intensive. The profit development of KONE could be adversely affected if its productivity improvement targets were not met, in particular if salaries and costs increased more than KONE would be able to increase its prices or if it were not possible to adapt its resources in response to changing business opportunities and environments. These risks are managed by proactive planning and forecasting processes, by the constant development of pricing processes and productivity as well as by the outsourcing of certain activities.
Decisions of the Annual General MeetingKONE Corporation’s Annual general Meeting was held in Hel-sinki on March 5, 2012. The meeting approved the financial statements and discharged the responsible parties from liability for the January 1–December 31, 2011 financial period.
The general Meeting approved to amend paragraphs 4 and 8 of the Articles of Association concerning the number of the members of the Board of Directors and the publishing of the summons to shareholders’ general Meeting, respectively.
The number of Members of the Board of Directors was con-firmed as nine. Re-elected as Members of the Board were Matti Alahuhta, Anne Brunila, Reino Hanhinen, Antti Herlin,sirkka Hämäläinen-lindfors, Juhani Kaskeala and sirpa Pietikäinen and as new Members of the Board were elected shinichiro Akiba and Jussi Herlin.
At its meeting held after the general Meeting, the Board of Directors elected from among its members Antti Herlin as its Chair and sirkka Hämäläinen-lindfors as Vice Chair.
Antti Herlin was elected as Chairman and sirkka Hämäläinen-lindfors, Anne Brunila and Jussi Herlin as members of the Audit Committee. sirkka Hämäläinen-lindfors and Anne Brunila are
independent of both the company and of significant share-holders.
Antti Herlin was elected as Chairman and Reino Hanhinen, Juhani Kaskeala and Jussi Herlin as members of the Nomination and Compensation Committee. Reino Hanhinen and Juhani Kaskeala are independent of both the company and of signifi-cant shareholders.
The general Meeting confirmed an annual compensation of EUR 54,000 for the Chairman of the Board, EUR 44,000 for the Vice Chairman and EUR 33,000 for Board Members. In addi-tion, a compensation of EUR 500 was approved for attendance at Board and Committee meetings.
The general Meeting approved the authorization for the Board of Directors to repurchase KONE’s own shares. Alto-gether no more than 25,570,000 shares may be repurchased, of which no more than 3,810,000 may be class A shares and 21,760,000 class B shares. The minimum and maximum con-sideration for the shares to be purchased is determined for both class A and class B shares on the basis of the trading price for class B shares determined on the NAsDAQ OMX Helsinki ltd. on the time of purchase. The authorization shall remain in effect for a period of one year from the date of decision of the general Meeting.
Authorized public accountants Heikki lassila and Pricewater-houseCoopers Oy were re-nominated as the Company´s audi-tors.
The Annual general Meeting approved the Board’s proposal for dividends of EUR 1.395 for each of the 38,104,356 class A shares and EUR 1.40 for the 216,635,414 outstanding class B shares. The date of record for dividend distribution was March 8, 2012, and the dividends were paid on March 15, 2012.
Share capital and Market capitalizationIn 2007, KONE granted a conditional option program. The 2007 stock options were listed on the NAsDAQ OMX Helsinki ltd. as of April 1, 2010. Each option right entitled its owner to subscribe for two (2) existing class B shares held by the company at a price of, from March 6, 2012, EUR 20.545 per share. As the subscription period expired on April 30, 2012, the 888,000 KONE 2007 option rights held by KONE Capital Oy, a subsidiary of KONE Corporation, and otherwise unused 2,520 option rights expired. The rest of the remaining 1,109,480 options had been used.
The Annual general Meeting in 2010 authorized the Board of Directors to decide on the issuance of options and other special rights entitling to shares. The authorization is limited to a maximum of 3,810,000 class A shares and 21,760,000 class B shares. The authorization concerns both the issuance of new shares as well as the transfer of treasury shares, and the issuance of shares and of special rights entitling to shares may be carried out in deviation from the shareholders’ pre-emptive rights. The authorization will remain in effect for a period of five years from the date of the decision of the general Meeting.
In 2010, KONE granted a conditional option program to approximately 430 key employees. A maximum total of 3,000,000 options can be granted. Each option entitles its holder to subscribe for one (1) new or existing class B KONE share held by the company. The share subscription period for the stock options 2010 will be April 1, 2013–April 30, 2015. The share subscription period begins only if the financial per-formance of the KONE group for the financial years 2010–
KONE’s January–June 2012 review
10Q2
2012 based on the total consideration of the Board of Directors is equal to or better than the average performance of key com-petitors of KONE. If the above-mentioned prerequisite is not fulfilled, stock options expire based on the consideration and in the extent and manner decided by the Board of Directors and the terms of the stock options.
On June 30, 2012, KONE’s share capital was EUR 65,134,030.00, comprising 222,431,764 listed class B shares and 38,104,356 unlisted class A shares.
KONE’s market capitalization was EUR 12,212 million on June 30, 2012, disregarding own shares in the KONE’s pos-session. Market capitalization is calculated on the basis of both the listed B shares and the unlisted A shares excluding treasury shares. Class A shares are valued at the closing price of the class B shares at the end of the reporting period.
Shares in KONE’s possessionOn the basis of the Annual general Meeting’s authorization, the Board of Directors decided to commence the possible repurchasing of shares at the earliest on March 13, 2012.
During January–June 2012, KONE used its previous autho-rization to repurchase own shares in February, and bought back in total 834,174 of its own class B shares. In April KONE assigned 208,295 of its own class B shares to a share-based incentive plan. In addition in April 1,445,616 class B shares owned by KONE were subscribed with the 2007 option rights. In June 8,950 class B shares were returned free of consideration to KONE by virtue of the terms of KONE’s share-based incentive program for the years 2010–2012. At the end of June 2012, KONE had 4,151,389 class B shares in its possession. The shares in the KONE’s possession represent 1.9% of the total number of class B shares. This corresponds to 0.7% of the total voting rights.
Shares traded on the NASDAQ OMX Helsinki Ltd.The NAsDAQ OMX Helsinki ltd. traded 65.2 million KONE Corporation’s class B shares in January–June 2012, equivalent to a turnover of EUR 2,846 million. The daily average trading volume was 525,722 shares (1–6/2011: 566,480). The share price on June 30, 2012 was EUR 47.63. The volume weighted average share price during the period was EUR 43.68. The high-est quotation during the period under review was EUR 48.05 and the lowest EUR 39.19. In addition to the NAsDAQ OMX Helsinki stock Exchange, KONE’s class B share is traded also on various alternative trading platforms. The volume of KONE’s B shares traded on the NAsDAQ OMX Helsinki stock Exchange represented approximately 42% of the total volume of KONE’s class B shares traded in January–June 2012 (source: Fidessa Fragmentation Index, www.fragmentation.fidessa.com).
The number of registered shareholders was 30,402 at the beginning of the review period and 30,358 at its end. The number of private households holding shares totaled 27,874 at the end of the period, which corresponds to approximately 13% of the listed B shares.
According to the nominee registers, 46.5% of the listed class B shares were owned by foreigners on June 30, 2012. Other foreign ownership at the end of the period totaled 6.3%. Thus a total of 52.8% of KONE’s listed class B shares were owned by international investors, corresponding to approximately 19% of the total votes in the company.
KONE’s January–June 2012 review
Flagging notificationsOn June 28, 2012 Capital Management and Research Com-pany announced to KONE Corporation pursuant to the securi-ties Markets Act, chapter 2, section 9, that its holding in KONE Corporation had exceeded five (5) percent of the share capital. The date of change in the holdings was June 26, 2012.
Market outlook 2012In new equipment, the markets in Asia-Pacific are expected to be relatively stable or grow somewhat as compared with the second half of 2011. The markets in Central and North Europe are expected to decline slightly, and the markets in south Europe are expected to further decline from an already weak level. The market in North America is expected to continue to gradually recover from a low level. The modernization markets are expected to be at about the same level or decline slightly as compared to the second half of 2011. The maintenance mar-kets are expected to continue to develop well.
Business outlook 2012KONE upgrades its outlook slightly for 2012. The upgrade of the outlook is due to stronger than expected orders received and sales growth in Asia-Pacific, and with regard to the operat-ing income outlook also due to favorable translation exchange rate movements.
KONE’s net sales is estimated to grow by 12–17% at com-parable exchange rates as compared to 2011.
The operating income (EBIT), excluding one-time costs, is expected to be in the range of EUR 760–820 million.
Previous business outlook 2012KONE’s net sales is estimated to grow by 10–15% at comparable exchange rates as compared to 2011.
The operating income (EBIT) is expected to be in the range of EUR 750–800 million, assuming that translation exchange rates do not materially deviate from the situation of the beginning of 2012.
Helsinki, July 19, 2012KONE Corporation’s Board of Directors
11Q2
MEUR 4–6/2012 % 4–6/2011 % 1–6/2012 % 1–6/2011 % 1–12/2011 %
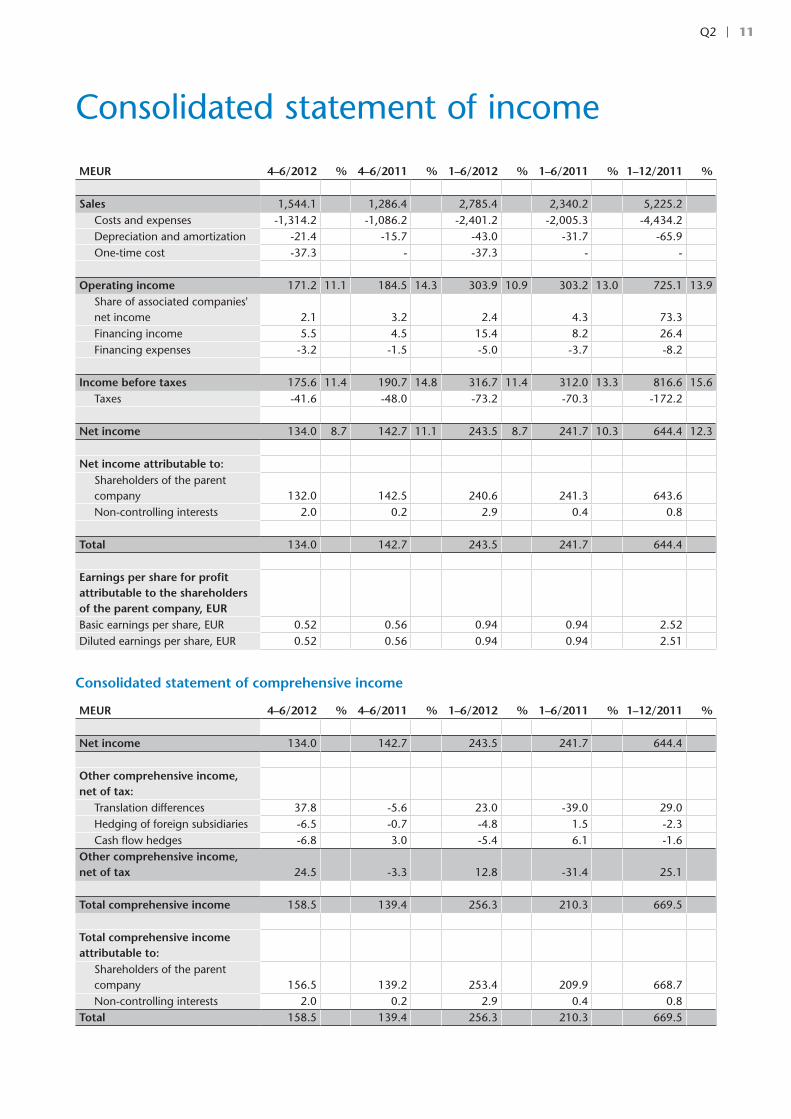
Sales 1,544.1 1,286.4 2,785.4 2,340.2 5,225.2Costs and expenses -1,314.2 -1,086.2 -2,401.2 -2,005.3 -4,434.2Depreciation and amortization -21.4 -15.7 -43.0 -31.7 -65.9One-time cost -37.3 - -37.3 - -
Operating income 171.2 11.1 184.5 14.3 303.9 10.9 303.2 13.0 725.1 13.9share of associated companies' net income 2.1 3.2 2.4 4.3 73.3Financing income 5.5 4.5 15.4 8.2 26.4Financing expenses -3.2 -1.5 -5.0 -3.7 -8.2
Income before taxes 175.6 11.4 190.7 14.8 316.7 11.4 312.0 13.3 816.6 15.6Taxes -41.6 -48.0 -73.2 -70.3 -172.2
Net income 134.0 8.7 142.7 11.1 243.5 8.7 241.7 10.3 644.4 12.3
Net income attributable to:shareholders of the parent company 132.0 142.5 240.6 241.3 643.6Non-controlling interests 2.0 0.2 2.9 0.4 0.8
Total 134.0 142.7 243.5 241.7 644.4
Earnings per share for profit attributable to the shareholders of the parent company, EURBasic earnings per share, EUR 0.52 0.56 0.94 0.94 2.52Diluted earnings per share, EUR 0.52 0.56 0.94 0.94 2.51
Consolidated statement of comprehensive income
MEUR 4–6/2012 % 4–6/2011 % 1–6/2012 % 1–6/2011 % 1–12/2011 %
Net income 134.0 142.7 243.5 241.7 644.4
Other comprehensive income, net of tax:
Translation differences 37.8 -5.6 23.0 -39.0 29.0Hedging of foreign subsidiaries -6.5 -0.7 -4.8 1.5 -2.3Cash flow hedges -6.8 3.0 -5.4 6.1 -1.6
Other comprehensive income, net of tax 24.5 -3.3 12.8 -31.4 25.1
Total comprehensive income 158.5 139.4 256.3 210.3 669.5
Total comprehensive income attributable to:
shareholders of the parent company 156.5 139.2 253.4 209.9 668.7Non-controlling interests 2.0 0.2 2.9 0.4 0.8
Total 158.5 139.4 256.3 210.3 669.5
Consolidated statement of income
12Q2
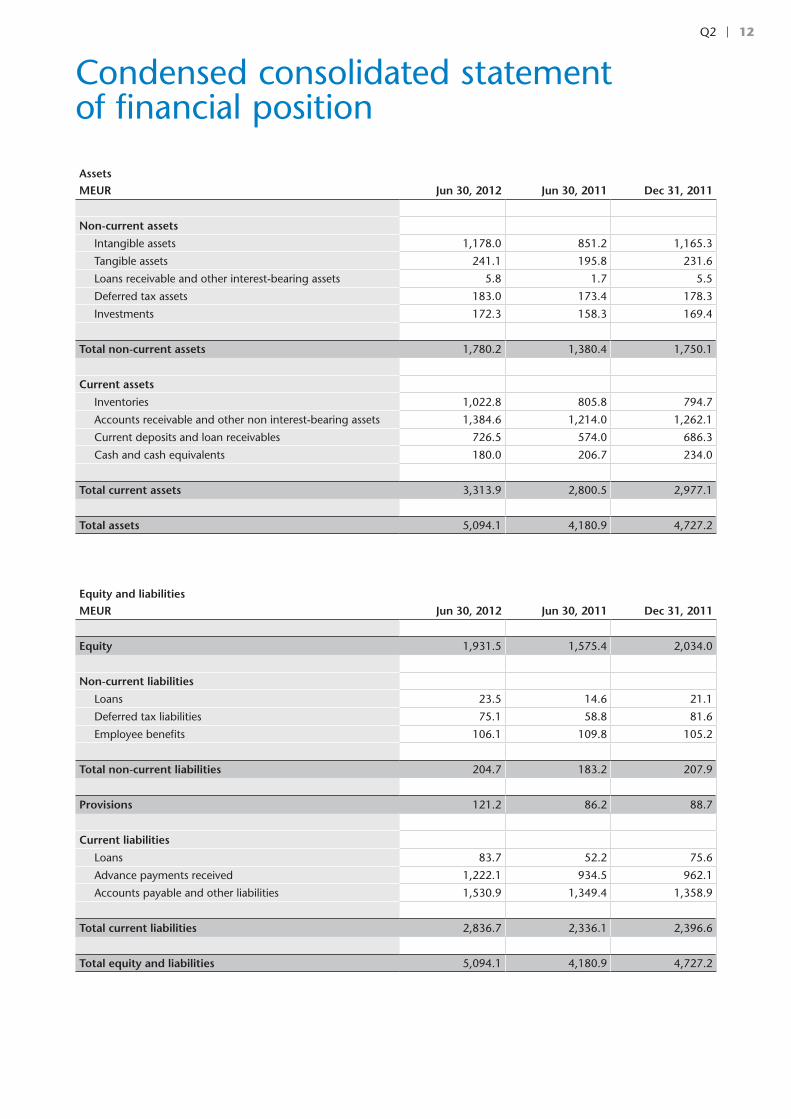
Condensed consolidated statement of financial position
Assets MEUR Jun 30, 2012 Jun 30, 2011 Dec 31, 2011
Non-current assets
Intangible assets 1,178.0 851.2 1,165.3
Tangible assets 241.1 195.8 231.6
loans receivable and other interest-bearing assets 5.8 1.7 5.5
Deferred tax assets 183.0 173.4 178.3
Investments 172.3 158.3 169.4
Total non-current assets 1,780.2 1,380.4 1,750.1
Current assets
Inventories 1,022.8 805.8 794.7
Accounts receivable and other non interest-bearing assets 1,384.6 1,214.0 1,262.1
Current deposits and loan receivables 726.5 574.0 686.3
Cash and cash equivalents 180.0 206.7 234.0
Total current assets 3,313.9 2,800.5 2,977.1
Total assets 5,094.1 4,180.9 4,727.2
Equity and liabilities MEUR Jun 30, 2012 Jun 30, 2011 Dec 31, 2011
Equity 1,931.5 1,575.4 2,034.0
Non-current liabilities
loans 23.5 14.6 21.1
Deferred tax liabilities 75.1 58.8 81.6
Employee benefits 106.1 109.8 105.2
Total non-current liabilities 204.7 183.2 207.9
Provisions 121.2 86.2 88.7
Current liabilities
loans 83.7 52.2 75.6
Advance payments received 1,222.1 934.5 962.1
Accounts payable and other liabilities 1,530.9 1,349.4 1,358.9
Total current liabilities 2,836.7 2,336.1 2,396.6
Total equity and liabilities 5,094.1 4,180.9 4,727.2
13Q2
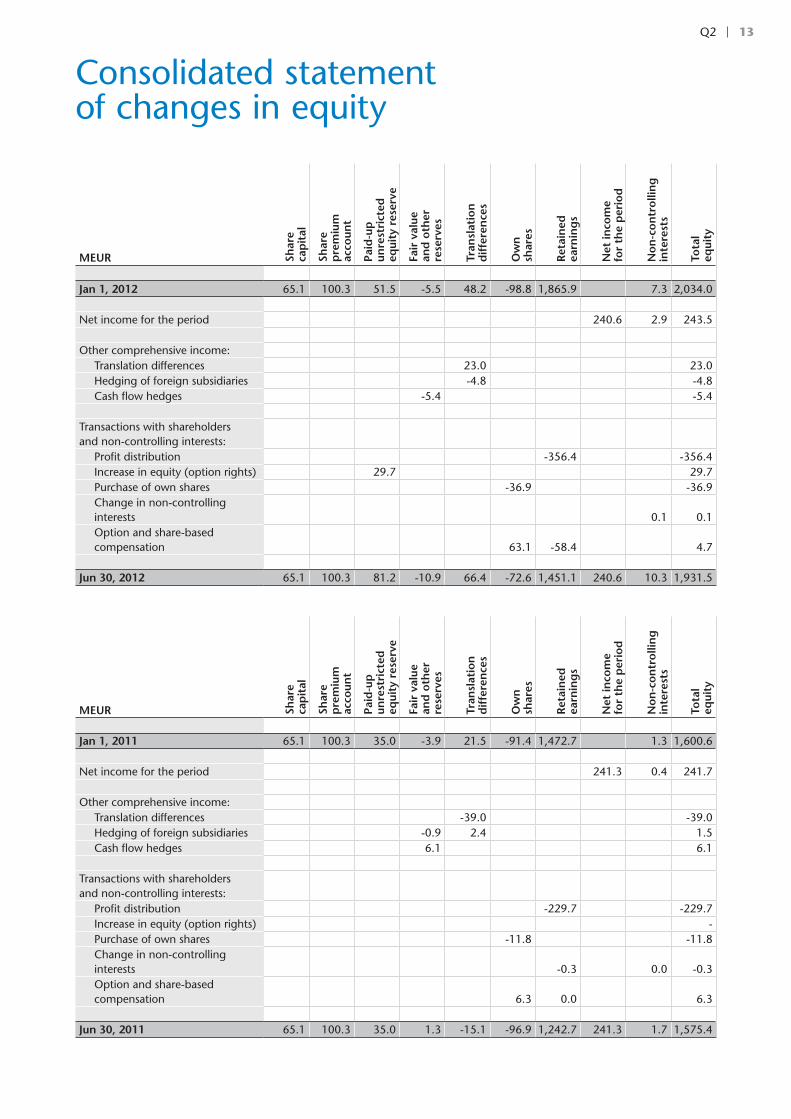
Consolidated statement of changes in equity
MEUR Shar
e ca
pit
al
Shar
e
pre
miu
m
acco
unt
Paid
-up
un
rest
rict
ed
equi
ty r
eser
ve
Fair
val
ue
and
oth
er
rese
rves
Tran
slat
ion
d
iffe
ren
ces
Ow
n
shar
es
Ret
ain
ed
earn
ing
s
Net
inco
me
fo
r th
e p
erio
d
No
n-c
on
tro
llin
g
inte
rest
s
Tota
l eq
uity
Jan 1, 2012 65.1 100.3 51.5 -5.5 48.2 -98.8 1,865.9 7.3 2,034.0
Net income for the period 240.6 2.9 243.5
Other comprehensive income:Translation differences 23.0 23.0Hedging of foreign subsidiaries -4.8 -4.8Cash flow hedges -5.4 -5.4
Transactions with shareholders and non-controlling interests:
Profit distribution -356.4 -356.4Increase in equity (option rights) 29.7 29.7Purchase of own shares -36.9 -36.9Change in non-controlling interests 0.1 0.1Option and share-based compensation 63.1 -58.4 4.7
Jun 30, 2012 65.1 100.3 81.2 -10.9 66.4 -72.6 1,451.1 240.6 10.3 1,931.5
MEUR Shar
e ca
pit
al
Shar
e
pre
miu
m
acco
unt
Paid
-up
un
rest
rict
ed
equi
ty r
eser
ve
Fair
val
ue
and
oth
er
rese
rves
Tran
slat
ion
d
iffe
ren
ces
Ow
n
shar
es
Ret
ain
ed
earn
ing
s
Net
inco
me
fo
r th
e p
erio
d
No
n-c
on
tro
llin
g
inte
rest
s
Tota
l eq
uity
Jan 1, 2011 65.1 100.3 35.0 -3.9 21.5 -91.4 1,472.7 1.3 1,600.6
Net income for the period 241.3 0.4 241.7
Other comprehensive income:Translation differences -39.0 -39.0Hedging of foreign subsidiaries -0.9 2.4 1.5Cash flow hedges 6.1 6.1
Transactions with shareholders and non-controlling interests:
Profit distribution -229.7 -229.7Increase in equity (option rights) -Purchase of own shares -11.8 -11.8Change in non-controlling interests -0.3 0.0 -0.3Option and share-based compensation 6.3 0.0 6.3
Jun 30, 2011 65.1 100.3 35.0 1.3 -15.1 -96.9 1,242.7 241.3 1.7 1,575.4
14Q2
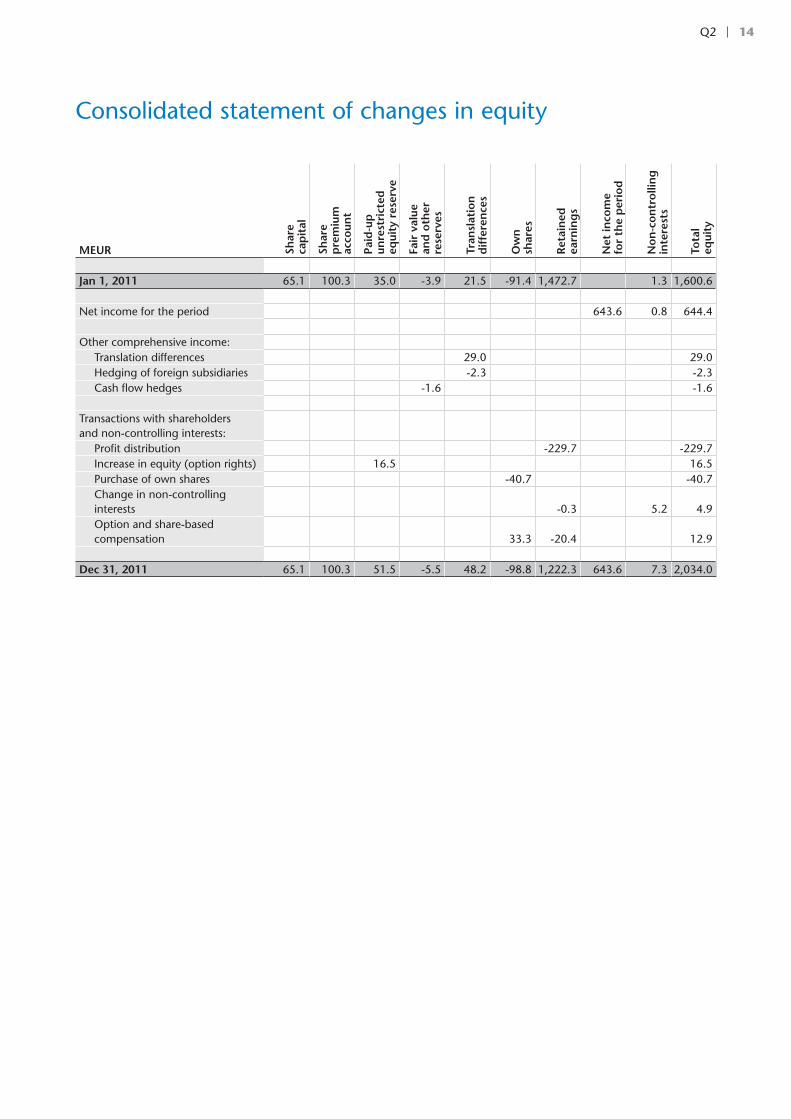
Consolidated statement of changes in equity
MEUR Shar
e ca
pit
al
Shar
e
pre
miu
m
acco
unt
Paid
-up
un
rest
rict
ed
equi
ty r
eser
ve
Fair
val
ue
and
oth
er
rese
rves
Tran
slat
ion
d
iffe
ren
ces
Ow
n
shar
es
Ret
ain
ed
earn
ing
s
Net
inco
me
fo
r th
e p
erio
d
No
n-c
on
tro
llin
g
inte
rest
s
Tota
l eq
uity
Jan 1, 2011 65.1 100.3 35.0 -3.9 21.5 -91.4 1,472.7 1.3 1,600.6
Net income for the period 643.6 0.8 644.4
Other comprehensive income:Translation differences 29.0 29.0Hedging of foreign subsidiaries -2.3 -2.3Cash flow hedges -1.6 -1.6
Transactions with shareholders and non-controlling interests:
Profit distribution -229.7 -229.7Increase in equity (option rights) 16.5 16.5Purchase of own shares -40.7 -40.7Change in non-controlling interests -0.3 5.2 4.9Option and share-based compensation 33.3 -20.4 12.9
Dec 31, 2011 65.1 100.3 51.5 -5.5 48.2 -98.8 1,222.3 643.6 7.3 2,034.0
15Q2
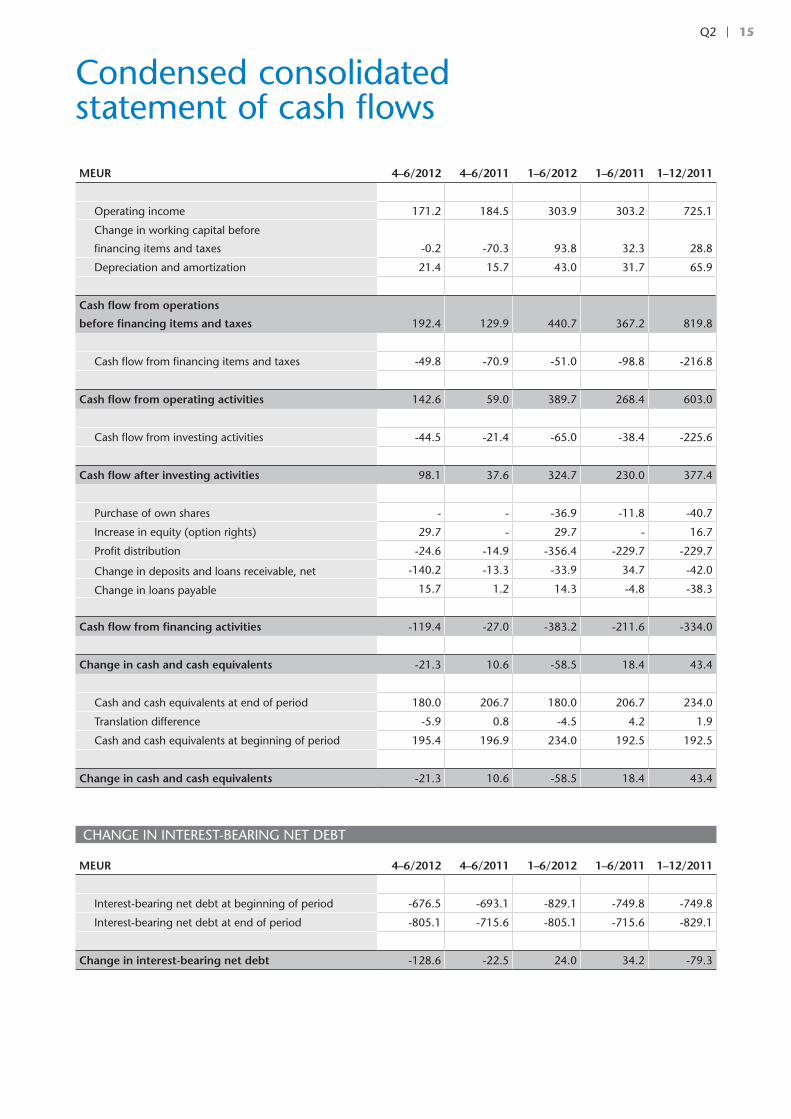
MEUR 4–6/2012 4–6/2011 1–6/2012 1–6/2011 1–12/2011
Operating income 171.2 184.5 303.9 303.2 725.1
Change in working capital before
financing items and taxes -0.2 -70.3 93.8 32.3 28.8
Depreciation and amortization 21.4 15.7 43.0 31.7 65.9
Cash flow from operations
before financing items and taxes 192.4 129.9 440.7 367.2 819.8
Cash flow from financing items and taxes -49.8 -70.9 -51.0 -98.8 -216.8
Cash flow from operating activities 142.6 59.0 389.7 268.4 603.0
Cash flow from investing activities -44.5 -21.4 -65.0 -38.4 -225.6
Cash flow after investing activities 98.1 37.6 324.7 230.0 377.4
Purchase of own shares - - -36.9 -11.8 -40.7
Increase in equity (option rights) 29.7 - 29.7 - 16.7
Profit distribution -24.6 -14.9 -356.4 -229.7 -229.7
Change in deposits and loans receivable, net -140.2 -13.3 -33.9 34.7 -42.0
Change in loans payable 15.7 1.2 14.3 -4.8 -38.3
Cash flow from financing activities -119.4 -27.0 -383.2 -211.6 -334.0
Change in cash and cash equivalents -21.3 10.6 -58.5 18.4 43.4
Cash and cash equivalents at end of period 180.0 206.7 180.0 206.7 234.0
Translation difference -5.9 0.8 -4.5 4.2 1.9
Cash and cash equivalents at beginning of period 195.4 196.9 234.0 192.5 192.5
Change in cash and cash equivalents -21.3 10.6 -58.5 18.4 43.4
CHANgE IN INTEREsT-BEARINg NET DEBT
MEUR 4–6/2012 4–6/2011 1–6/2012 1–6/2011 1–12/2011
Interest-bearing net debt at beginning of period -676.5 -693.1 -829.1 -749.8 -749.8
Interest-bearing net debt at end of period -805.1 -715.6 -805.1 -715.6 -829.1
Change in interest-bearing net debt -128.6 -22.5 24.0 34.2 -79.3
Condensed consolidated statement of cash flows
16Q2
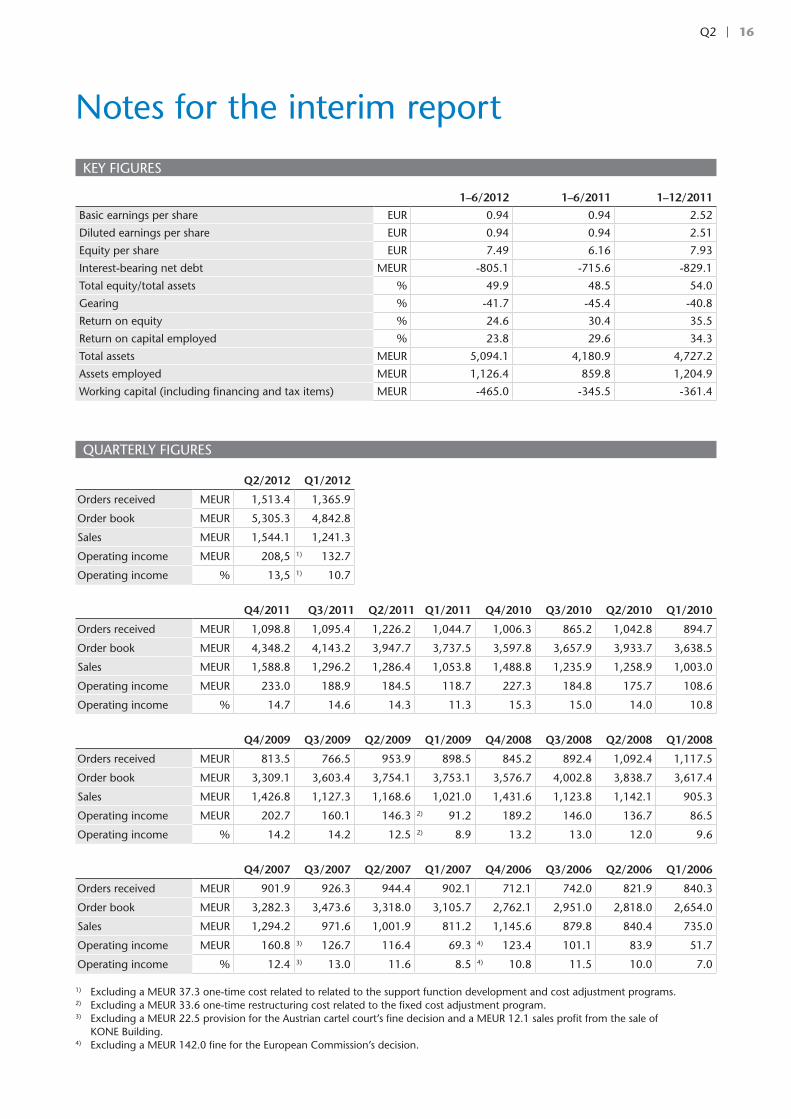
KEy FIgUREs
1–6/2012 1–6/2011 1–12/2011
Basic earnings per share EUR 0.94 0.94 2.52
Diluted earnings per share EUR 0.94 0.94 2.51
Equity per share EUR 7.49 6.16 7.93
Interest-bearing net debt MEUR -805.1 -715.6 -829.1
Total equity/total assets % 49.9 48.5 54.0
gearing % -41.7 -45.4 -40.8
Return on equity % 24.6 30.4 35.5
Return on capital employed % 23.8 29.6 34.3
Total assets MEUR 5,094.1 4,180.9 4,727.2
Assets employed MEUR 1,126.4 859.8 1,204.9
Working capital (including financing and tax items) MEUR -465.0 -345.5 -361.4
QUARTERly FIgUREs
Q2/2012 Q1/2012
Orders received MEUR 1,513.4 1,365.9
Order book MEUR 5,305.3 4,842.8
sales MEUR 1,544.1 1,241.3
Operating income MEUR 208,5 1) 132.7
Operating income % 13,5 1) 10.7
Q4/2011 Q3/2011 Q2/2011 Q1/2011 Q4/2010 Q3/2010 Q2/2010 Q1/2010
Orders received MEUR 1,098.8 1,095.4 1,226.2 1,044.7 1,006.3 865.2 1,042.8 894.7
Order book MEUR 4,348.2 4,143.2 3,947.7 3,737.5 3,597.8 3,657.9 3,933.7 3,638.5
sales MEUR 1,588.8 1,296.2 1,286.4 1,053.8 1,488.8 1,235.9 1,258.9 1,003.0
Operating income MEUR 233.0 188.9 184.5 118.7 227.3 184.8 175.7 108.6
Operating income % 14.7 14.6 14.3 11.3 15.3 15.0 14.0 10.8
Q4/2009 Q3/2009 Q2/2009 Q1/2009 Q4/2008 Q3/2008 Q2/2008 Q1/2008
Orders received MEUR 813.5 766.5 953.9 898.5 845.2 892.4 1,092.4 1,117.5
Order book MEUR 3,309.1 3,603.4 3,754.1 3,753.1 3,576.7 4,002.8 3,838.7 3,617.4
sales MEUR 1,426.8 1,127.3 1,168.6 1,021.0 1,431.6 1,123.8 1,142.1 905.3
Operating income MEUR 202.7 160.1 146.3 2) 91.2 189.2 146.0 136.7 86.5
Operating income % 14.2 14.2 12.5 2) 8.9 13.2 13.0 12.0 9.6
Q4/2007 Q3/2007 Q2/2007 Q1/2007 Q4/2006 Q3/2006 Q2/2006 Q1/2006
Orders received MEUR 901.9 926.3 944.4 902.1 712.1 742.0 821.9 840.3
Order book MEUR 3,282.3 3,473.6 3,318.0 3,105.7 2,762.1 2,951.0 2,818.0 2,654.0
sales MEUR 1,294.2 971.6 1,001.9 811.2 1,145.6 879.8 840.4 735.0
Operating income MEUR 160.8 3) 126.7 116.4 69.3 4) 123.4 101.1 83.9 51.7
Operating income % 12.4 3) 13.0 11.6 8.5 4) 10.8 11.5 10.0 7.0
1) Excluding a MEUR 37.3 one-time cost related to related to the support function development and cost adjustment programs.2) Excluding a MEUR 33.6 one-time restructuring cost related to the fixed cost adjustment program.3) Excluding a MEUR 22.5 provision for the Austrian cartel court’s fine decision and a MEUR 12.1 sales profit from the sale of
KONE Building.4) Excluding a MEUR 142.0 fine for the European Commission’s decision.
Notes for the interim report
17Q2
Notes for the interim report
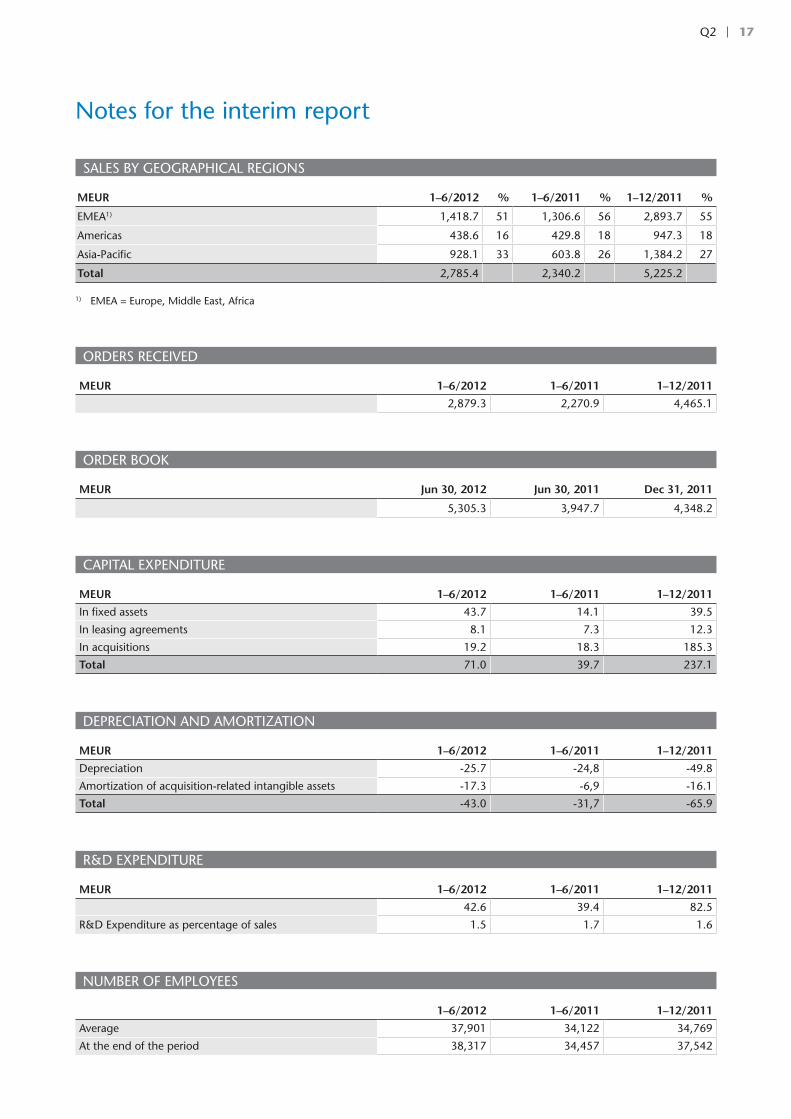
sAlEs By gEOgRAPHICAl REgIONs
MEUR 1–6/2012 % 1–6/2011 % 1–12/2011 %
EMEA1) 1,418.7 51 1,306.6 56 2,893.7 55
Americas 438.6 16 429.8 18 947.3 18
Asia-Pacific 928.1 33 603.8 26 1,384.2 27
Total 2,785.4 2,340.2 5,225.2
1) EMEA = Europe, Middle East, Africa
ORDERs RECEIVED
MEUR 1–6/2012 1–6/2011 1–12/2011
2,879.3 2,270.9 4,465.1
ORDER BOOK
MEUR Jun 30, 2012 Jun 30, 2011 Dec 31, 2011
5,305.3 3,947.7 4,348.2
CAPITAl EXPENDITURE
MEUR 1–6/2012 1–6/2011 1–12/2011
In fixed assets 43.7 14.1 39.5
In leasing agreements 8.1 7.3 12.3
In acquisitions 19.2 18.3 185.3
Total 71.0 39.7 237.1
DEPRECIATION AND AMORTIzATION
MEUR 1–6/2012 1–6/2011 1–12/2011
Depreciation -25.7 -24,8 -49.8
Amortization of acquisition-related intangible assets -17.3 -6,9 -16.1
Total -43.0 -31,7 -65.9
R&D EXPENDITURE
MEUR 1–6/2012 1–6/2011 1–12/2011
42.6 39.4 82.5
R&D Expenditure as percentage of sales 1.5 1.7 1.6
NUMBER OF EMPlOyEEs
1–6/2012 1–6/2011 1–12/2011
Average 37,901 34,122 34,769
At the end of the period 38,317 34,457 37,542
18Q2
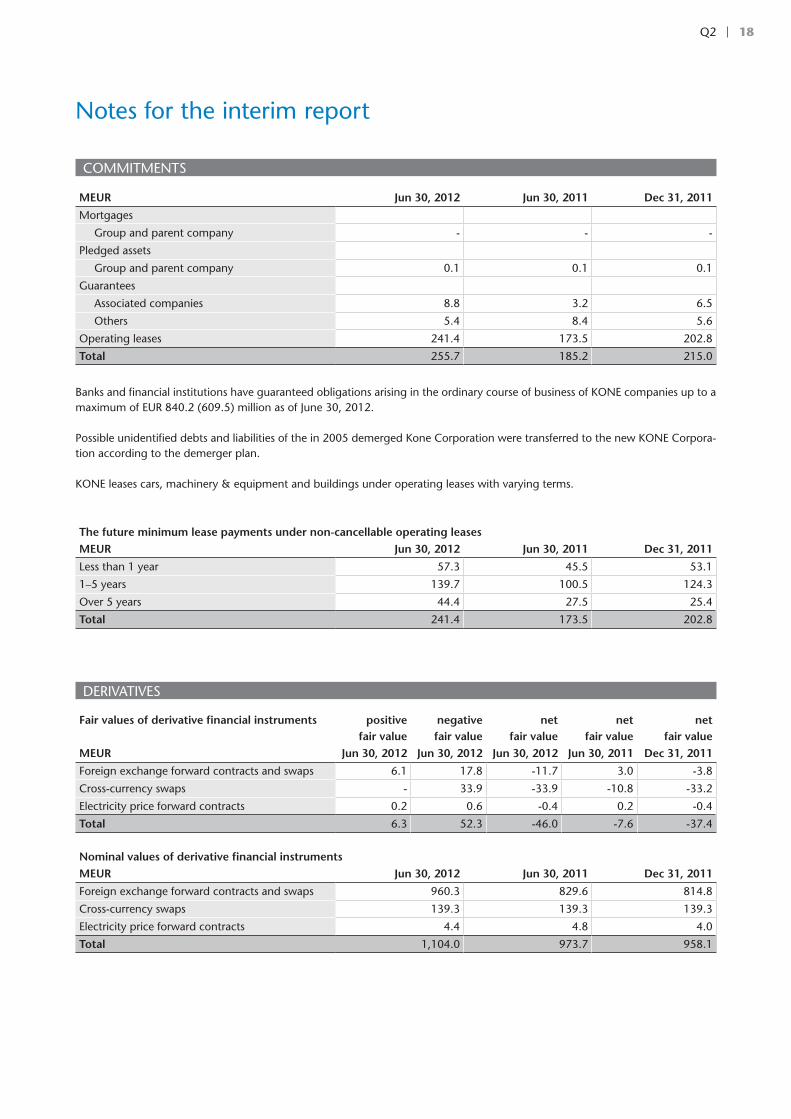
COMMITMENTs
MEUR Jun 30, 2012 Jun 30, 2011 Dec 31, 2011
Mortgages
group and parent company - - -
Pledged assets
group and parent company 0.1 0.1 0.1
guarantees
Associated companies 8.8 3.2 6.5
Others 5.4 8.4 5.6
Operating leases 241.4 173.5 202.8
Total 255.7 185.2 215.0
Banks and financial institutions have guaranteed obligations arising in the ordinary course of business of KONE companies up to a maximum of EUR 840.2 (609.5) million as of June 30, 2012.
Possible unidentified debts and liabilities of the in 2005 demerged Kone Corporation were transferred to the new KONE Corpora-tion according to the demerger plan.
KONE leases cars, machinery & equipment and buildings under operating leases with varying terms.
The future minimum lease payments under non-cancellable operating leasesMEUR Jun 30, 2012 Jun 30, 2011 Dec 31, 2011
less than 1 year 57.3 45.5 53.1
1–5 years 139.7 100.5 124.3
Over 5 years 44.4 27.5 25.4
Total 241.4 173.5 202.8
DERIVATIVEs
Fair values of derivative financial instruments positivefair value
negativefair value
netfair value
netfair value
netfair value
MEUR Jun 30, 2012 Jun 30, 2012 Jun 30, 2012 Jun 30, 2011 Dec 31, 2011
Foreign exchange forward contracts and swaps 6.1 17.8 -11.7 3.0 -3.8
Cross-currency swaps - 33.9 -33.9 -10.8 -33.2
Electricity price forward contracts 0.2 0.6 -0.4 0.2 -0.4
Total 6.3 52.3 -46.0 -7.6 -37.4
Nominal values of derivative financial instrumentsMEUR Jun 30, 2012 Jun 30, 2011 Dec 31, 2011
Foreign exchange forward contracts and swaps 960.3 829.6 814.8
Cross-currency swaps 139.3 139.3 139.3
Electricity price forward contracts 4.4 4.8 4.0
Total 1,104.0 973.7 958.1
Notes for the interim report
19Q2
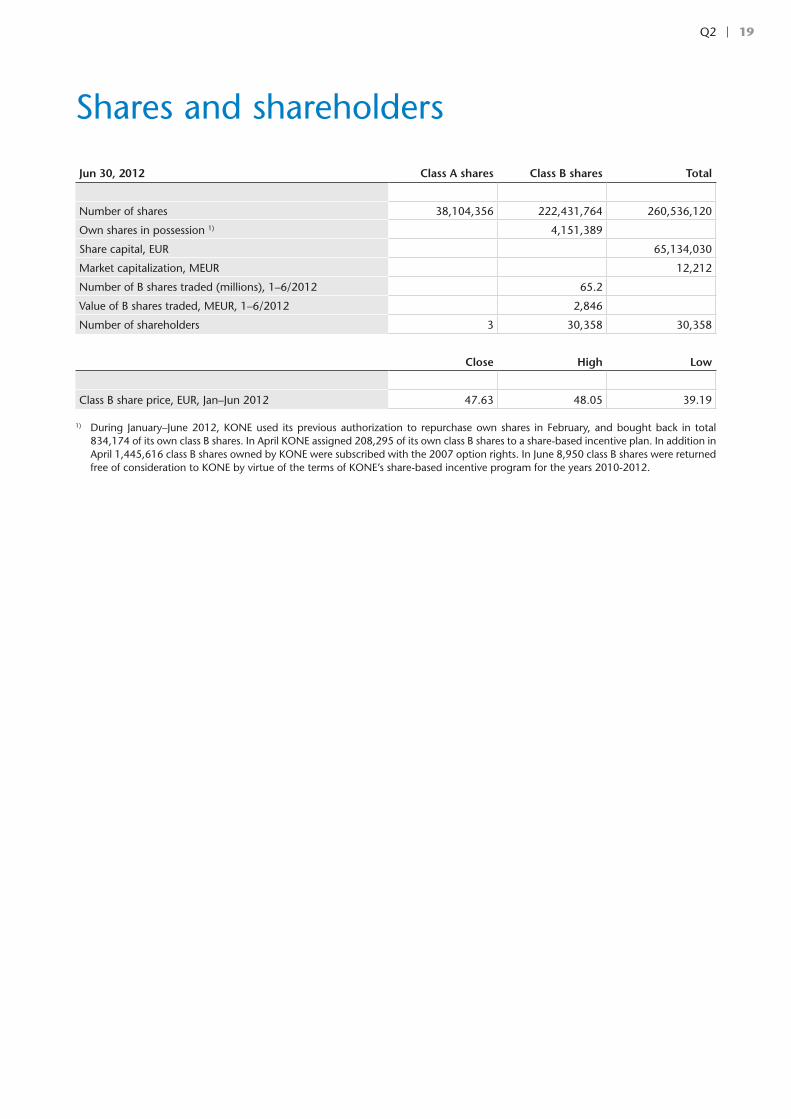
Jun 30, 2012 Class A shares Class B shares Total
Number of shares 38,104,356 222,431,764 260,536,120
Own shares in possession 1) 4,151,389
share capital, EUR 65,134,030
Market capitalization, MEUR 12,212
Number of B shares traded (millions), 1–6/2012 65.2
Value of B shares traded, MEUR, 1–6/2012 2,846
Number of shareholders 3 30,358 30,358
Close High Low
Class B share price, EUR, Jan–Jun 2012 47.63 48.05 39.19
1) During January–June 2012, KONE used its previous authorization to repurchase own shares in February, and bought back in total 834,174 of its own class B shares. In April KONE assigned 208,295 of its own class B shares to a share-based incentive plan. In addition in April 1,445,616 class B shares owned by KONE were subscribed with the 2007 option rights. In June 8,950 class B shares were returned free of consideration to KONE by virtue of the terms of KONE’s share-based incentive program for the years 2010-2012.
shares and shareholders
KONE Corporation
Corporate OfficesKeilasatama 3P.O. Box 7FI-02151 Espoo, FinlandTel. +358 (0)204 751Fax +358 (0)204 75 4496
www.kone.com
For further information please contact:Henrik EhrnroothCFOTel. +358 (0)204 75 4260
Karla lindahlDirector, Investor RelationsTel. +358 (0)204 75 4441
KONE is one of the global leaders in the elevator and escalator industry. The company has been committed to under-standing the needs of its customers for the past century, providing industry-leading elevators, escalators and automatic building doors as well as innovative solutions for modernization and maintenance. The company’s objective is to offer the best People Flow™ experience by developing and delivering solutions that enable people to move smoothly, safely, comfortably and without waiting in buildings in an increasingly urbanizing environment. In 2011, KONE had annual net sales of EUR 5.2 billion and on average 35,000 employees. KONE class B shares are listed on the NASDAQ OMX Helsinki Ltd in Finland. www.kone.com
This bulletin contains forward-looking statements that are based on the current expectations, known factors, decisions and plans of the management of KONE. Although the management believes that the expectations reflected in such forward-looking statements are reasonable, no assurance can be given that such expectations will prove to be correct. Accordingly, results could differ materially from those implied in the forward-looking statements as a result of, among other factors, changes in economic, market and competitive conditions, changes in the regulatory environment and other government actions as well as fluctuations in exchange rates.