Embed Size (px)
Citation preview
June’19
BALLOT BOX ANALYSIS OF THE 23 JUNE ISTANBUL ELECTIONAND VOTER PROFILES
KONDA
KONDA JUNE’19 BAROMETER BALLOT BOX ANALYSIS OF THE 23 JUNE ISTANBUL ELECTION 2 / 71
TABLE OF CONTENTS
1. EXECUTIVE SUMMARY .................................................................................................. 3
2. BALLOT BOX ANALYSIS OF 23 JUNE ISTANBUL MAYORSHIP ELECTION ...................... 6
2.1. General Result ................................................................................................................... 6
2.2. Districts Result .................................................................................................................. 6
2.3. Change in Districts ............................................................................................................ 8
2.4. Socioeconomic Situation of the Districts and Voting Distribution ................................. 9
2.5. Clusterings in the Political Geography of Districts ....................................................... 13
2.6. Vote Shifts ....................................................................................................................... 16
2.7. Vote Shifts Analysis ........................................................................................................ 18
2.8. Analysis on the Basis of Istanbul Neighborhoods ........................................................ 23
3. 23 JUNE VOTER PROFILES ......................................................................................... 39
3.1. Change in Preferences in Istanbul Based on Political Preferences ............................ 40
3.2. Change in Preferences in Istanbul According to Demographic Clusters .................... 42
3.3. Candidate Preference Based on Media and Social Media Preferences .................... 59
3.4. Basic Fİndings in Voter Profiles ..................................................................................... 62
4. EVALUATION ................................................................................................................ 63
5. RESEARCH ID .............................................................................................................. 69
5.1. The General Description of the Survey ......................................................................... 69
5.2. The Sample ..................................................................................................................... 69
6. GLOSSARY of TERMS .................................................................................................. 70
6.1. Questions and Response Options ................................................................................. 71
KONDA JUNE’19 BAROMETER BALLOT BOX ANALYSIS OF THE 23 JUNE ISTANBUL ELECTION 3 / 71
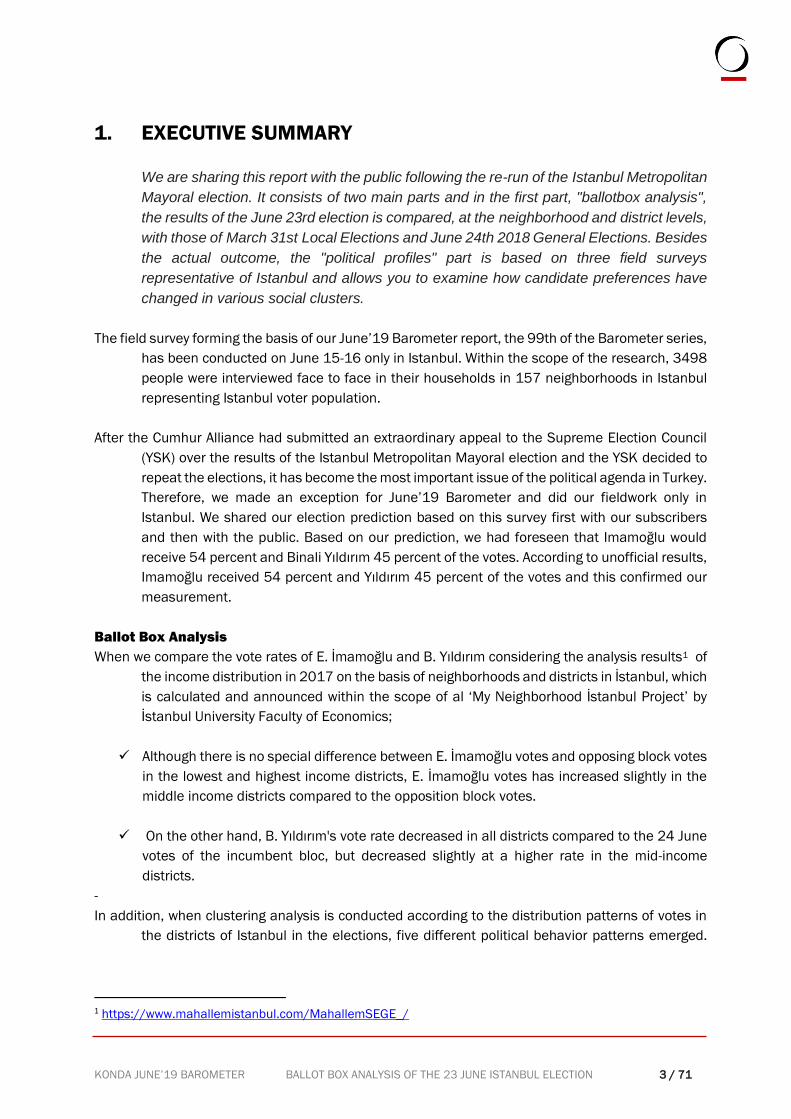
1. EXECUTIVE SUMMARY
We are sharing this report with the public following the re-run of the Istanbul Metropolitan
Mayoral election. It consists of two main parts and in the first part, "ballotbox analysis",
the results of the June 23rd election is compared, at the neighborhood and district levels,
with those of March 31st Local Elections and June 24th 2018 General Elections. Besides
the actual outcome, the "political profiles" part is based on three field surveys
representative of Istanbul and allows you to examine how candidate preferences have
changed in various social clusters.
The field survey forming the basis of our June’19 Barometer report, the 99th of the Barometer series,
has been conducted on June 15-16 only in Istanbul. Within the scope of the research, 3498
people were interviewed face to face in their households in 157 neighborhoods in Istanbul
representing Istanbul voter population.
After the Cumhur Alliance had submitted an extraordinary appeal to the Supreme Election Council
(YSK) over the results of the Istanbul Metropolitan Mayoral election and the YSK decided to
repeat the elections, it has become the most important issue of the political agenda in Turkey.
Therefore, we made an exception for June’19 Barometer and did our fieldwork only in
Istanbul. We shared our election prediction based on this survey first with our subscribers
and then with the public. Based on our prediction, we had foreseen that Imamoğlu would
receive 54 percent and Binali Yıldırım 45 percent of the votes. According to unofficial results,
Imamoğlu received 54 percent and Yıldırım 45 percent of the votes and this confirmed our
measurement.
Ballot Box Analysis
When we compare the vote rates of E. İmamoğlu and B. Yıldırım considering the analysis results1 of
the income distribution in 2017 on the basis of neighborhoods and districts in İstanbul, which
is calculated and announced within the scope of al ‘My Neighborhood İstanbul Project’ by
İstanbul University Faculty of Economics;
✓ Although there is no special difference between E. İmamoğlu votes and opposing block votes
in the lowest and highest income districts, E. İmamoğlu votes has increased slightly in the
middle income districts compared to the opposition block votes.
✓ On the other hand, B. Yıldırım's vote rate decreased in all districts compared to the 24 June
votes of the incumbent bloc, but decreased slightly at a higher rate in the mid-income
districts.
-
In addition, when clustering analysis is conducted according to the distribution patterns of votes in
the districts of Istanbul in the elections, five different political behavior patterns emerged.
1 https://www.mahallemistanbul.com/MahallemSEGE_/
KONDA JUNE’19 BAROMETER BALLOT BOX ANALYSIS OF THE 23 JUNE ISTANBUL ELECTION 4 / 71
‘The Clusters in District Political Geography’ section, where these five clusters are described
in order to realize the basic voter movements, contains important clues.
When we compare it with 31 March IBB Mayorship votes, it is seen that the vote of Imamoğlu has
increased by 5.4 points and the vote of Yıldırım decreased by only 2.1 points. It can be said
that the increase of the vote for İmamoğlu did not have a single source but he increased his
votes from all clusters.
When we compare it with the distribution of Presidential votes on June 24, 2018, it is observed that
the votes of İmamoğlu increased by 8.7 points, of which 6.3 points were caused by Demirtaş
or HDP votes. It is assumed that 3.7 points of the 6.1 point decrease observed in the vote of
Yıldırım compared to Erdoğan is composed of the incumbent block voters who did not
participate in the election, while votes at a level of 2 points have shifted towards Imamoğlu.
Based on these two comparisons, it is possible to say that incumbent bloc voters at the rate of 1-2
points have shifted towards the opposition bloc, when Istanbul election was renewed on June
23. On the other hand, even in a period of deep economic and political turmoil, the transition
between the blocks is only at the level of 1-2 points, which indicates how strong the
polarization still is.
Analysis Based on Istanbul Neighborhoods
Considering the neighborhoods, we see that the neighborhoods with low participation rates are either
in the periphery districts or in the city center, in Fatih.
According to the previous election, the neighborhoods where participation increased at most were
the coastal districts of Beşiktaş, Kadıköy and Bakırköy, while participation in the periphery
districts decreased compared to 31 March.
While Imamoglu had high vote rates in the same regions in both elections, it was the first finding that
the number of neighborhoods, where he received more than 50 percent of votes on 23 June
has increased considerably.
Yıldırım seems to have lost votes in almost every neighborhood. In general, the protects his vote rate
in the districts such as Eyüpsultan, Arnavutköy, Çekmeköy, Sultanbeyli, Ümraniye, which can
be described as the second ring after the city center, whereas he experienced a higher rate
of loss of votes in the outermost districts and central districts.
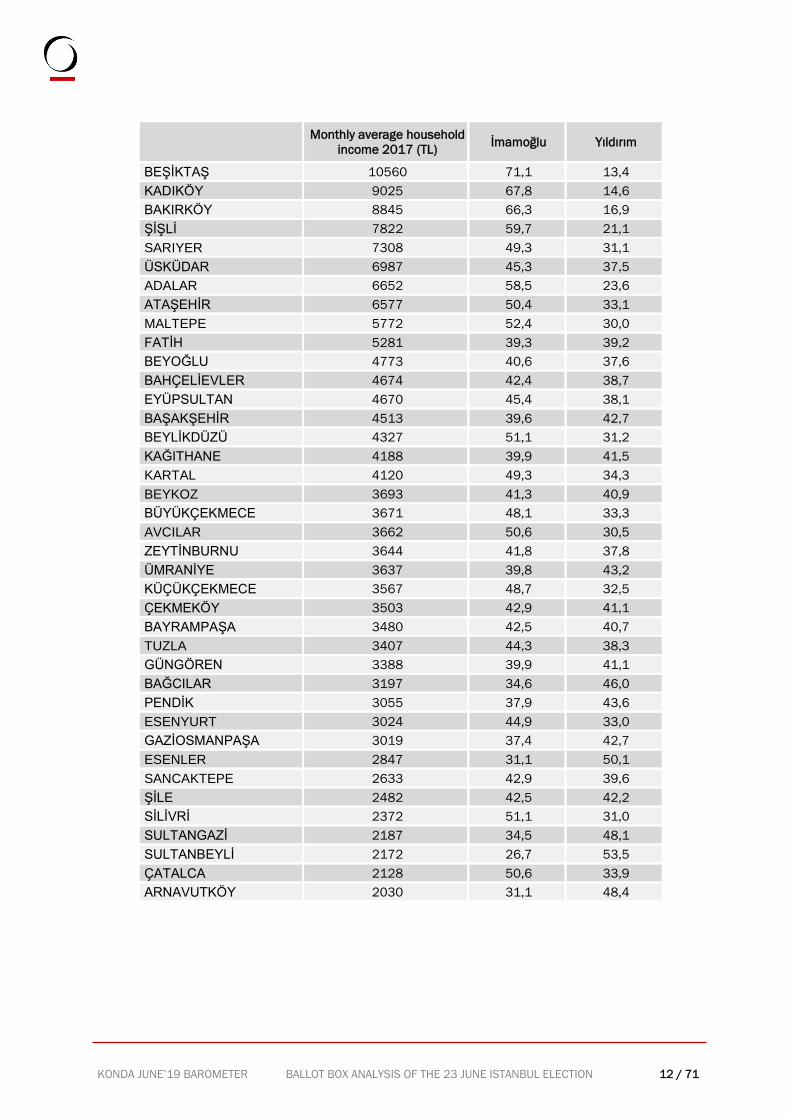
In the analysis we made considering the average income level on the basis of districts, the votes of
İmamoğlu in the top 10 districts with the highest income level are between 71.1 percent and
49.3 percent and more than Yıldırım in all of them. On the other hand, there is a contentious
situation in the last 10 districts where the average household income is the lowest. It is
understood that the vote differences in the districts, which are in the middle of household
income ranking, are in favor of E.Imamoğlu.
KONDA JUNE’19 BAROMETER BALLOT BOX ANALYSIS OF THE 23 JUNE ISTANBUL ELECTION 5 / 71
Political Profiles
Considering the analysis of the voter profiles of the candidates and the candidate preference in
different profiles together, which we reveal by comparing the data of 3 different Istanbul-
specific surveys conducted during the 31 March local elections and the subsequent Istanbul
elections, we reach the following findings:
• Binali Yıldırım's vote seems to have remained at the same fixed point before March 31 and
June 23 process. It is necessary to interpret this situation considering that the rate of swing
voters decreased at every stage. If his vote remains fixed in any way, when the rate swing
voters decreases, it means that the vote for Yıldırım has decreased. This situation occurs in
almost all social clusters. There are very rare social clusters in which Yıldırım has increased
his vote in this process.
• Imamoğlu's vote, on the other hand, has increased in all components of Istanbul residents
both before and after 31 March. Imamoğlu shows a visible increase especially among the
youth, students, and unemployed and most importantly among the Kurds.
• Binali Yıldırım's vote is in line with the Ak Parti vote in the Barometer data in demographic
clusters. As the education level and income level increases, his vote rate decreases. As age
and the level of religiousness increase, his vote increases, too.
• The rate of the Ak Parti voters, who were undecided about the candidate, is slightly and
gradually increasing in three studies. Therefore, the rate of preferring Yıldırım falls from 95
to 90 percent. Based on these data, we can argue that in addition to the increase in votes of
Imamoğlu, a group of Ak Parti partisans did not go to the polls.
• HDP voters have clearly supported İmamoğlu since March. When we look at all the findings
together, we can say that HDP partisans played a critical role in the Istanbul elections.
• A significant number of MHP voters seem to have given up to cast a vote for Yıldırım at the
last stage. However, it is difficult to say that they all preferred Imamoğlu.
KONDA JUNE’19 BAROMETER BALLOT BOX ANALYSIS OF THE 23 JUNE ISTANBUL ELECTION 6 / 71
2. BALLOT BOX ANALYSIS OF 23 JUNE ISTANBUL METROPOLITAN
MUNICIPALITY MAYORSHIP ELECTION
2.1. General Result
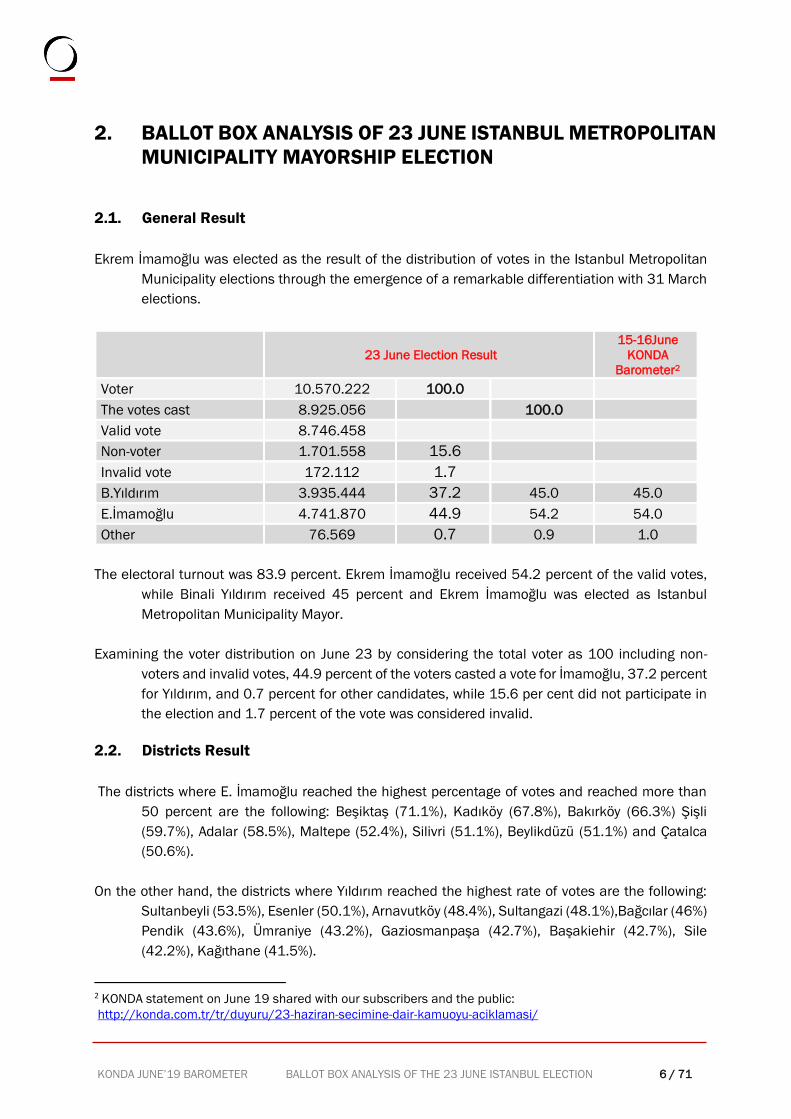
Ekrem İmamoğlu was elected as the result of the distribution of votes in the Istanbul Metropolitan
Municipality elections through the emergence of a remarkable differentiation with 31 March
elections.
23 June Election Result
15-16June
KONDA
Barometer2
Voter 10.570.222 100.0
The votes cast 8.925.056 100.0
Valid vote 8.746.458
Non-voter 1.701.558 15.6
Invalid vote 172.112 1.7
B.Yıldırım 3.935.444 37.2 45.0 45.0
E.İmamoğlu 4.741.870 44.9 54.2 54.0
Other 76.569 0.7 0.9 1.0
The electoral turnout was 83.9 percent. Ekrem İmamoğlu received 54.2 percent of the valid votes,
while Binali Yıldırım received 45 percent and Ekrem İmamoğlu was elected as Istanbul
Metropolitan Municipality Mayor.
Examining the voter distribution on June 23 by considering the total voter as 100 including non-
voters and invalid votes, 44.9 percent of the voters casted a vote for İmamoğlu, 37.2 percent
for Yıldırım, and 0.7 percent for other candidates, while 15.6 per cent did not participate in
the election and 1.7 percent of the vote was considered invalid.
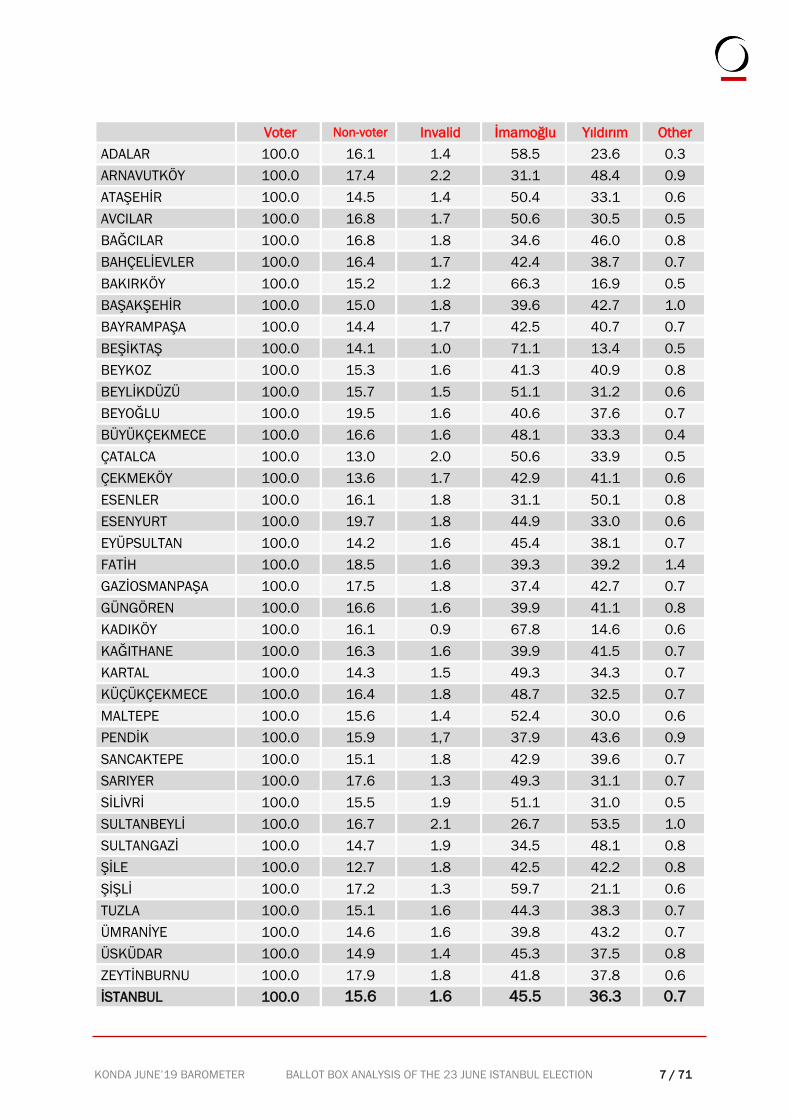
2.2. Districts Result
The districts where E. İmamoğlu reached the highest percentage of votes and reached more than
50 percent are the following: Beşiktaş (71.1%), Kadıköy (67.8%), Bakırköy (66.3%) Şişli
(59.7%), Adalar (58.5%), Maltepe (52.4%), Silivri (51.1%), Beylikdüzü (51.1%) and Çatalca
(50.6%).
On the other hand, the districts where Yıldırım reached the highest rate of votes are the following:
Sultanbeyli (53.5%), Esenler (50.1%), Arnavutköy (48.4%), Sultangazi (48.1%),Bağcılar (46%)
Pendik (43.6%), Ümraniye (43.2%), Gaziosmanpaşa (42.7%), Başakiehir (42.7%), Sile
(42.2%), Kağıthane (41.5%).
2 KONDA statement on June 19 shared with our subscribers and the public:
http://konda.com.tr/tr/duyuru/23-haziran-secimine-dair-kamuoyu-aciklamasi/
KONDA JUNE’19 BAROMETER BALLOT BOX ANALYSIS OF THE 23 JUNE ISTANBUL ELECTION 7 / 71
Voter Non-voter Invalid İmamoğlu Yıldırım Other
ADALAR 100.0 16.1 1.4 58.5 23.6 0.3
ARNAVUTKÖY 100.0 17.4 2.2 31.1 48.4 0.9
ATAŞEHİR 100.0 14.5 1.4 50.4 33.1 0.6
AVCILAR 100.0 16.8 1.7 50.6 30.5 0.5
BAĞCILAR 100.0 16.8 1.8 34.6 46.0 0.8
BAHÇELİEVLER 100.0 16.4 1.7 42.4 38.7 0.7
BAKIRKÖY 100.0 15.2 1.2 66.3 16.9 0.5
BAŞAKŞEHİR 100.0 15.0 1.8 39.6 42.7 1.0
BAYRAMPAŞA 100.0 14.4 1.7 42.5 40.7 0.7
BEŞİKTAŞ 100.0 14.1 1.0 71.1 13.4 0.5
BEYKOZ 100.0 15.3 1.6 41.3 40.9 0.8
BEYLİKDÜZÜ 100.0 15.7 1.5 51.1 31.2 0.6
BEYOĞLU 100.0 19.5 1.6 40.6 37.6 0.7
BÜYÜKÇEKMECE 100.0 16.6 1.6 48.1 33.3 0.4
ÇATALCA 100.0 13.0 2.0 50.6 33.9 0.5
ÇEKMEKÖY 100.0 13.6 1.7 42.9 41.1 0.6
ESENLER 100.0 16.1 1.8 31.1 50.1 0.8
ESENYURT 100.0 19.7 1.8 44.9 33.0 0.6
EYÜPSULTAN 100.0 14.2 1.6 45.4 38.1 0.7
FATİH 100.0 18.5 1.6 39.3 39.2 1.4
GAZİOSMANPAŞA 100.0 17.5 1.8 37.4 42.7 0.7
GÜNGÖREN 100.0 16.6 1.6 39.9 41.1 0.8
KADIKÖY 100.0 16.1 0.9 67.8 14.6 0.6
KAĞITHANE 100.0 16.3 1.6 39.9 41.5 0.7
KARTAL 100.0 14.3 1.5 49.3 34.3 0.7
KÜÇÜKÇEKMECE 100.0 16.4 1.8 48.7 32.5 0.7
MALTEPE 100.0 15.6 1.4 52.4 30.0 0.6
PENDİK 100.0 15.9 1,7 37.9 43.6 0.9
SANCAKTEPE 100.0 15.1 1.8 42.9 39.6 0.7
SARIYER 100.0 17.6 1.3 49.3 31.1 0.7
SİLİVRİ 100.0 15.5 1.9 51.1 31.0 0.5
SULTANBEYLİ 100.0 16.7 2.1 26.7 53.5 1.0
SULTANGAZİ 100.0 14.7 1.9 34.5 48.1 0.8
ŞİLE 100.0 12.7 1.8 42.5 42.2 0.8
ŞİŞLİ 100.0 17.2 1.3 59.7 21.1 0.6
TUZLA 100.0 15.1 1.6 44.3 38.3 0.7
ÜMRANİYE 100.0 14.6 1.6 39.8 43.2 0.7
ÜSKÜDAR 100.0 14.9 1.4 45.3 37.5 0.8
ZEYTİNBURNU 100.0 17.9 1.8 41.8 37.8 0.6
İSTANBUL 100.0 15.6 1.6 45.5 36.3 0.7
KONDA JUNE’19 BAROMETER BALLOT BOX ANALYSIS OF THE 23 JUNE ISTANBUL ELECTION 8 / 71
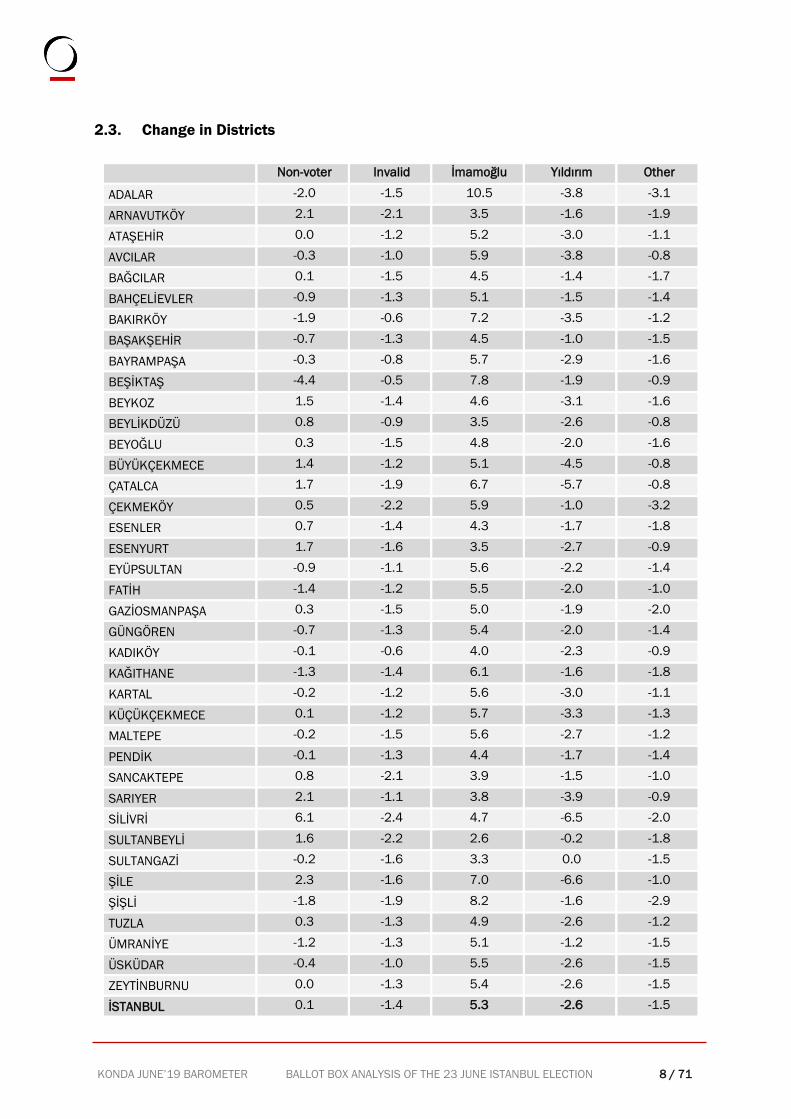
2.3. Change in Districts
Non-voter Invalid İmamoğlu Yıldırım Other
ADALAR -2.0 -1.5 10.5 -3.8 -3.1
ARNAVUTKÖY 2.1 -2.1 3.5 -1.6 -1.9
ATAŞEHİR 0.0 -1.2 5.2 -3.0 -1.1
AVCILAR -0.3 -1.0 5.9 -3.8 -0.8
BAĞCILAR 0.1 -1.5 4.5 -1.4 -1.7
BAHÇELİEVLER -0.9 -1.3 5.1 -1.5 -1.4
BAKIRKÖY -1.9 -0.6 7.2 -3.5 -1.2
BAŞAKŞEHİR -0.7 -1.3 4.5 -1.0 -1.5
BAYRAMPAŞA -0.3 -0.8 5.7 -2.9 -1.6
BEŞİKTAŞ -4.4 -0.5 7.8 -1.9 -0.9
BEYKOZ 1.5 -1.4 4.6 -3.1 -1.6
BEYLİKDÜZÜ 0.8 -0.9 3.5 -2.6 -0.8
BEYOĞLU 0.3 -1.5 4.8 -2.0 -1.6
BÜYÜKÇEKMECE 1.4 -1.2 5.1 -4.5 -0.8
ÇATALCA 1.7 -1.9 6.7 -5.7 -0.8
ÇEKMEKÖY 0.5 -2.2 5.9 -1.0 -3.2
ESENLER 0.7 -1.4 4.3 -1.7 -1.8
ESENYURT 1.7 -1.6 3.5 -2.7 -0.9
EYÜPSULTAN -0.9 -1.1 5.6 -2.2 -1.4
FATİH -1.4 -1.2 5.5 -2.0 -1.0
GAZİOSMANPAŞA 0.3 -1.5 5.0 -1.9 -2.0
GÜNGÖREN -0.7 -1.3 5.4 -2.0 -1.4
KADIKÖY -0.1 -0.6 4.0 -2.3 -0.9
KAĞITHANE -1.3 -1.4 6.1 -1.6 -1.8
KARTAL -0.2 -1.2 5.6 -3.0 -1.1
KÜÇÜKÇEKMECE 0.1 -1.2 5.7 -3.3 -1.3
MALTEPE -0.2 -1.5 5.6 -2.7 -1.2
PENDİK -0.1 -1.3 4.4 -1.7 -1.4
SANCAKTEPE 0.8 -2.1 3.9 -1.5 -1.0
SARIYER 2.1 -1.1 3.8 -3.9 -0.9
SİLİVRİ 6.1 -2.4 4.7 -6.5 -2.0
SULTANBEYLİ 1.6 -2.2 2.6 -0.2 -1.8
SULTANGAZİ -0.2 -1.6 3.3 0.0 -1.5
ŞİLE 2.3 -1.6 7.0 -6.6 -1.0
ŞİŞLİ -1.8 -1.9 8.2 -1.6 -2.9
TUZLA 0.3 -1.3 4.9 -2.6 -1.2
ÜMRANİYE -1.2 -1.3 5.1 -1.2 -1.5
ÜSKÜDAR -0.4 -1.0 5.5 -2.6 -1.5
ZEYTİNBURNU 0.0 -1.3 5.4 -2.6 -1.5
İSTANBUL 0.1 -1.4 5.3 -2.6 -1.5
KONDA JUNE’19 BAROMETER BALLOT BOX ANALYSIS OF THE 23 JUNE ISTANBUL ELECTION 9 / 71
The districts where İmamoğlu's votes increased the most were the following ones: Adalar (10.5
points), Şişli (8.2 points), Beşiktaş (7.8 points), Bakırköy (7.2 points), Şile (7 points), Çatalca
(6, 7 points), Kağıthane (6.1 points), Avcılar (5.9 points), Çekmeköy (5.9 points),
Küçükçekmece (5.7 points). The fact that the top five districts with the highest increase in
votes were the ones where the CHP is traditionally strong, could be as a result that the CHP
voters who had not gone to the polls on 31 March because they had no hope of winning or
they were resentful, went to the polls this time. On the other hand, besides the consolidation
of the opposition bloc in these districts, we can see on the table that there are shifts from 2
to 3 points from the incumbent bloc.
On the other hand, the districts where Yıldırım lost the highest percentage of votes, are the following
ones: Şile (6.6 points), Silivri (6.5 points), Çatalca (5.7 points), Büyükçekmece (4.5 points),
Sarıyer (3.9 points), Adalar (3.8 points), Avcılar (3.8 points), Bakirköy (3.5 points),
Küçükçekmece (3.3 points), Beykoz (3.1 points).
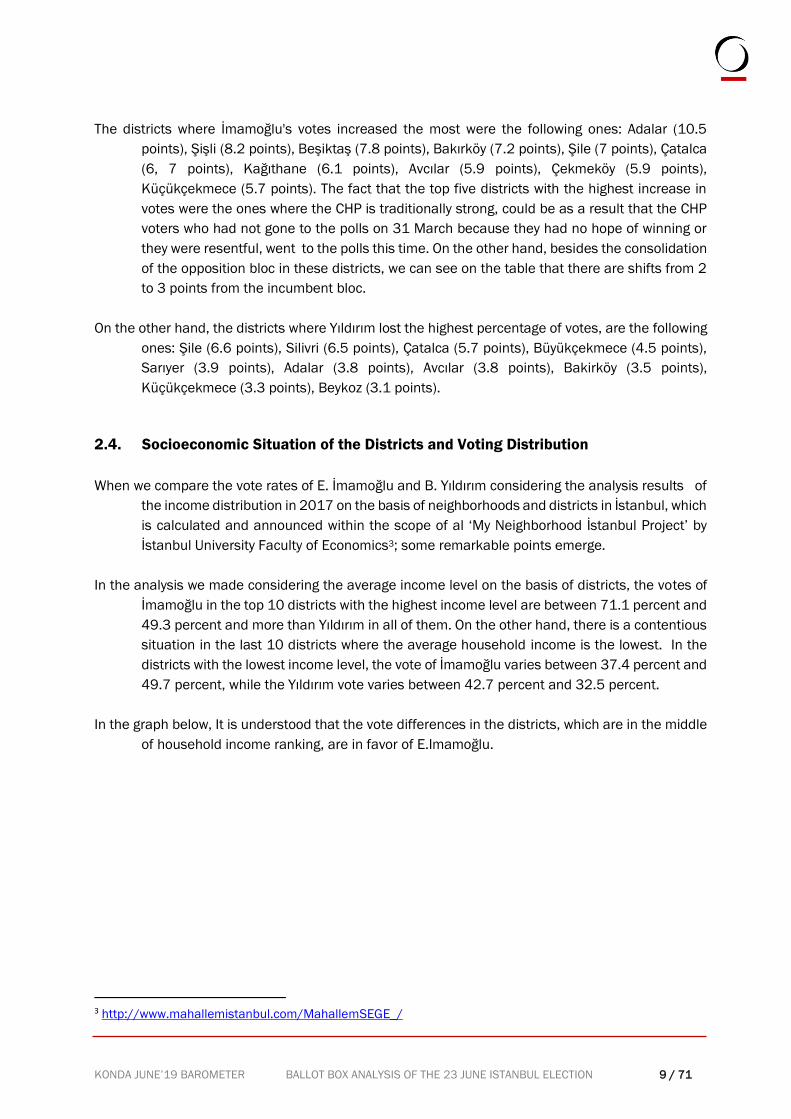
2.4. Socioeconomic Situation of the Districts and Voting Distribution
When we compare the vote rates of E. İmamoğlu and B. Yıldırım considering the analysis results of
the income distribution in 2017 on the basis of neighborhoods and districts in İstanbul, which
is calculated and announced within the scope of al ‘My Neighborhood İstanbul Project’ by
İstanbul University Faculty of Economics3; some remarkable points emerge.
In the analysis we made considering the average income level on the basis of districts, the votes of
İmamoğlu in the top 10 districts with the highest income level are between 71.1 percent and
49.3 percent and more than Yıldırım in all of them. On the other hand, there is a contentious
situation in the last 10 districts where the average household income is the lowest. In the
districts with the lowest income level, the vote of İmamoğlu varies between 37.4 percent and
49.7 percent, while the Yıldırım vote varies between 42.7 percent and 32.5 percent.
In the graph below, It is understood that the vote differences in the districts, which are in the middle
of household income ranking, are in favor of E.Imamoğlu.
3 http://www.mahallemistanbul.com/MahallemSEGE_/
KONDA JUNE’19 BAROMETER BALLOT BOX ANALYSIS OF THE 23 JUNE ISTANBUL ELECTION 10 / 71
0
2000
4000
6000
8000
10000
12000
0,0
10,0
20,0
30,0
40,0
50,0
60,0
70,0
80,0
AR
NA
VU
TK
ÖY
ÇA
TA
LC
A
SU
LTA
NB
EY
Lİ
SU
LTA
NG
AZ
İ
SİL
İVR
İ
ŞİL
E
SA
NC
AK
TE
PE
ES
EN
LE
R
GA
ZİO
SM
AN
PA
ŞA
ES
EN
YU
RT
PE
ND
İK
BA
ĞC
ILA
R
GÜ
NG
ÖR
EN
TU
ZLA
BA
YR
AM
PA
ŞA
ÇE
KM
EK
ÖY
KÜ
ÇÜ
KÇ
EK
ME
CE
ÜM
RA
NİY
E
ZE
YTİN
BU
RN
U
AV
CIL
AR
BÜ
YÜ
KÇ
EK
ME
CE
BE
YK
OZ
KA
RTA
L
KA
ĞIT
HA
NE
BE
YLİK
DÜ
ZÜ
BA
ŞA
KŞ
EH
İR
EY
ÜP
SU
LTA
N
BA
HÇ
ELİE
VLE
R
BE
YO
ĞLU
FA
TİH
MA
LTE
PE
ATA
ŞE
HİR
AD
ALA
R
ÜS
KÜ
DA
R
SA
RIY
ER
ŞİŞ
Lİ
BA
KIR
KÖ
Y
KA
DIK
ÖY
BE
ŞİK
TA
Ş
Istanbul districts' household incomes and 23 June vote preferences
Monthly Household income İmamoğlu Yıldırım
0
2000
4000
6000
8000
10000
12000
0,0
10,0
20,0
30,0
40,0
50,0
60,0
70,0
80,0
AR
NA
VU
TK
ÖY
ÇA
TA
LC
A
SU
LTA
NB
EY
Lİ
SU
LTA
NG
AZ
İ
SİL
İVR
İ
ŞİL
E
SA
NC
AK
TE
PE
ES
EN
LE
R
GA
ZİO
SM
AN
PA
ŞA
ES
EN
YU
RT
PE
ND
İK
BA
ĞC
ILA
R
GÜ
NG
ÖR
EN
TU
ZLA
BA
YR
AM
PA
ŞA
ÇE
KM
EK
ÖY
KÜ
ÇÜ
KÇ
EK
ME
CE
ÜM
RA
NİY
E
ZE
YTİN
BU
RN
U
AV
CIL
AR
BÜ
YÜ
KÇ
EK
ME
CE
BE
YK
OZ
KA
RTA
L
KA
ĞIT
HA
NE
BE
YLİK
DÜ
ZÜ
BA
ŞA
KŞ
EH
İR
EY
ÜP
SU
LTA
N
BA
HÇ
ELİE
VLE
R
BE
YO
ĞLU
FA
TİH
MA
LTE
PE
ATA
ŞE
HİR
AD
ALA
R
ÜS
KÜ
DA
R
SA
RIY
ER
ŞİŞ
Lİ
BA
KIR
KÖ
Y
KA
DIK
ÖY
BE
ŞİK
TA
Ş
Istanbul districts monthly household average income, 23 June E.
İmamoğlu, 24 June'18 opposition block vote rates
Monthly household income 23 June / İmamoğlu 24 June'18 / CHP+İyiParti+HDP
KONDA JUNE’19 BAROMETER BALLOT BOX ANALYSIS OF THE 23 JUNE ISTANBUL ELECTION 11 / 71
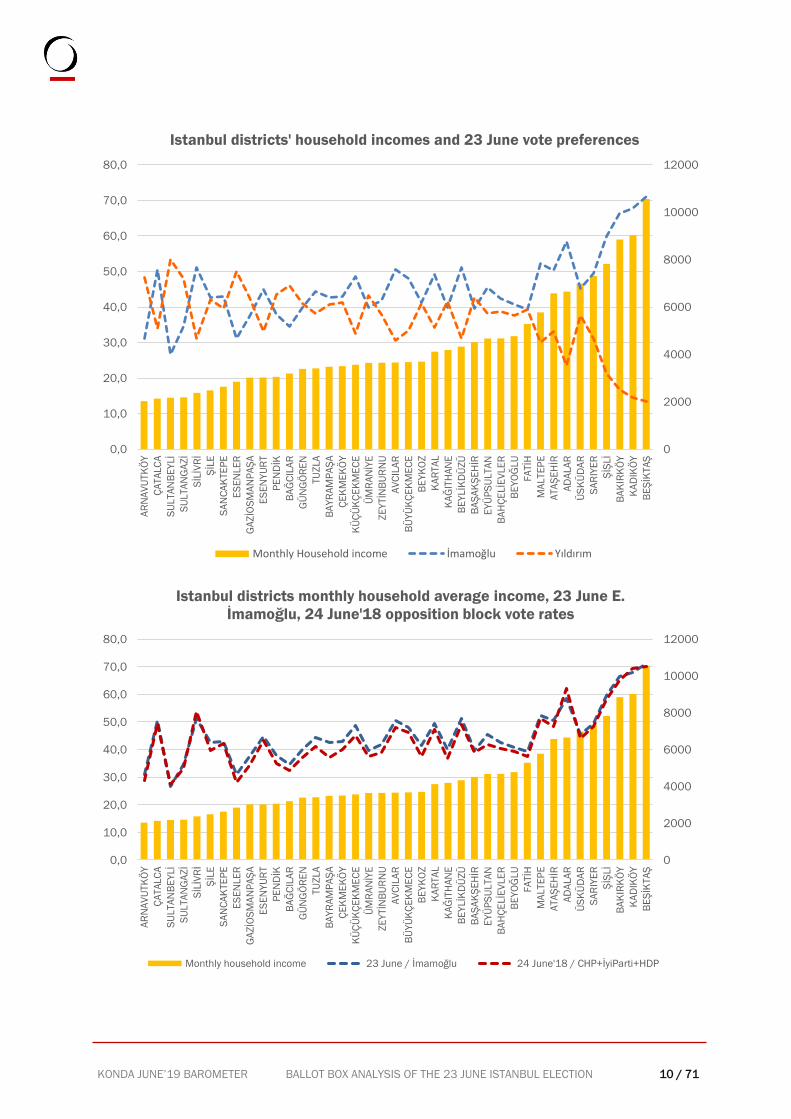
On the other hand, an interesting point draws attention when the results of the 24 June 2018 General
Elections and the power bloc (AkParti + MHP) - opposition bloc (CHP + Iyi Parti + HDP) vote
rates are analyzed together and visualized as shown in the two graphs above.
✓ Although there is no special difference between İmamoğlu votes and opposing block votes in
districts with the lowest income and highest income, İmamoğlu votes increased slightly
compared to the opposing block votes in the middle income districts.
✓ On the other hand, Yıldırım’s vote declined in all of them compared the 24 June votes of the
incumbent bloc, but decreased slightly more in the mid-income districts.
✓ It can be said that this observed relationship implies a potential for change in terms of
economic class positions in the party bases as well as in relation to the current economic
turmoil. In relatively middle-income districts, the incumbent bloc loses votes and the reason
may be due to the class position changes as well as due to the current politics. For this
reason, it may not be enough to analyze the dynamics that produce the results of June 23
through campaigns and discourses. However, we should note that this finding requires
analysis and confirmation by a special research.
0
2000
4000
6000
8000
10000
12000
0,0
10,0
20,0
30,0
40,0
50,0
60,0
70,0
AR
NA
VU
TK
ÖY
ÇA
TA
LC
A
SU
LTA
NB
EY
Lİ
SU
LTA
NG
AZ
İ
SİL
İVR
İ
ŞİL
E
SA
NC
AK
TE
PE
ES
EN
LE
R
GA
ZİO
SM
AN
PA
ŞA
ES
EN
YU
RT
PE
ND
İK
BA
ĞC
ILA
R
GÜ
NG
ÖR
EN
TU
ZLA
BA
YR
AM
PA
ŞA
ÇE
KM
EK
ÖY
KÜ
ÇÜ
KÇ
EK
ME
CE
ÜM
RA
NİY
E
ZE
YTİN
BU
RN
U
AV
CIL
AR
BÜ
YÜ
KÇ
EK
ME
CE
BE
YK
OZ
KA
RTA
L
KA
ĞIT
HA
NE
BE
YLİK
DÜ
ZÜ
BA
ŞA
KŞ
EH
İR
EY
ÜP
SU
LTA
N
BA
HÇ
ELİE
VLE
R
BE
YO
ĞLU
FA
TİH
MA
LTE
PE
ATA
ŞE
HİR
AD
ALA
R
ÜS
KÜ
DA
R
SA
RIY
ER
ŞİŞ
Lİ
BA
KIR
KÖ
Y
KA
DIK
ÖY
BE
ŞİK
TA
Ş
Istanbul districts monthly household average income, 23 June B.
Yıldırım, 24 June'18 power block vote rates
Monthly household income 23 June / Yıldırım 24 June'18 / AkParti+MHP
KONDA JUNE’19 BAROMETER BALLOT BOX ANALYSIS OF THE 23 JUNE ISTANBUL ELECTION 12 / 71
Monthly average household
income 2017 (TL) İmamoğlu Yıldırım
BEŞİKTAŞ 10560 71,1 13,4
KADIKÖY 9025 67,8 14,6
BAKIRKÖY 8845 66,3 16,9
ŞİŞLİ 7822 59,7 21,1
SARIYER 7308 49,3 31,1
ÜSKÜDAR 6987 45,3 37,5
ADALAR 6652 58,5 23,6
ATAŞEHİR 6577 50,4 33,1
MALTEPE 5772 52,4 30,0
FATİH 5281 39,3 39,2
BEYOĞLU 4773 40,6 37,6
BAHÇELİEVLER 4674 42,4 38,7
EYÜPSULTAN 4670 45,4 38,1
BAŞAKŞEHİR 4513 39,6 42,7
BEYLİKDÜZÜ 4327 51,1 31,2
KAĞITHANE 4188 39,9 41,5
KARTAL 4120 49,3 34,3
BEYKOZ 3693 41,3 40,9
BÜYÜKÇEKMECE 3671 48,1 33,3
AVCILAR 3662 50,6 30,5
ZEYTİNBURNU 3644 41,8 37,8
ÜMRANİYE 3637 39,8 43,2
KÜÇÜKÇEKMECE 3567 48,7 32,5
ÇEKMEKÖY 3503 42,9 41,1
BAYRAMPAŞA 3480 42,5 40,7
TUZLA 3407 44,3 38,3
GÜNGÖREN 3388 39,9 41,1
BAĞCILAR 3197 34,6 46,0
PENDİK 3055 37,9 43,6
ESENYURT 3024 44,9 33,0
GAZİOSMANPAŞA 3019 37,4 42,7
ESENLER 2847 31,1 50,1
SANCAKTEPE 2633 42,9 39,6
ŞİLE 2482 42,5 42,2
SİLİVRİ 2372 51,1 31,0
SULTANGAZİ 2187 34,5 48,1
SULTANBEYLİ 2172 26,7 53,5
ÇATALCA 2128 50,6 33,9
ARNAVUTKÖY 2030 31,1 48,4
KONDA JUNE’19 BAROMETER BALLOT BOX ANALYSIS OF THE 23 JUNE ISTANBUL ELECTION 13 / 71
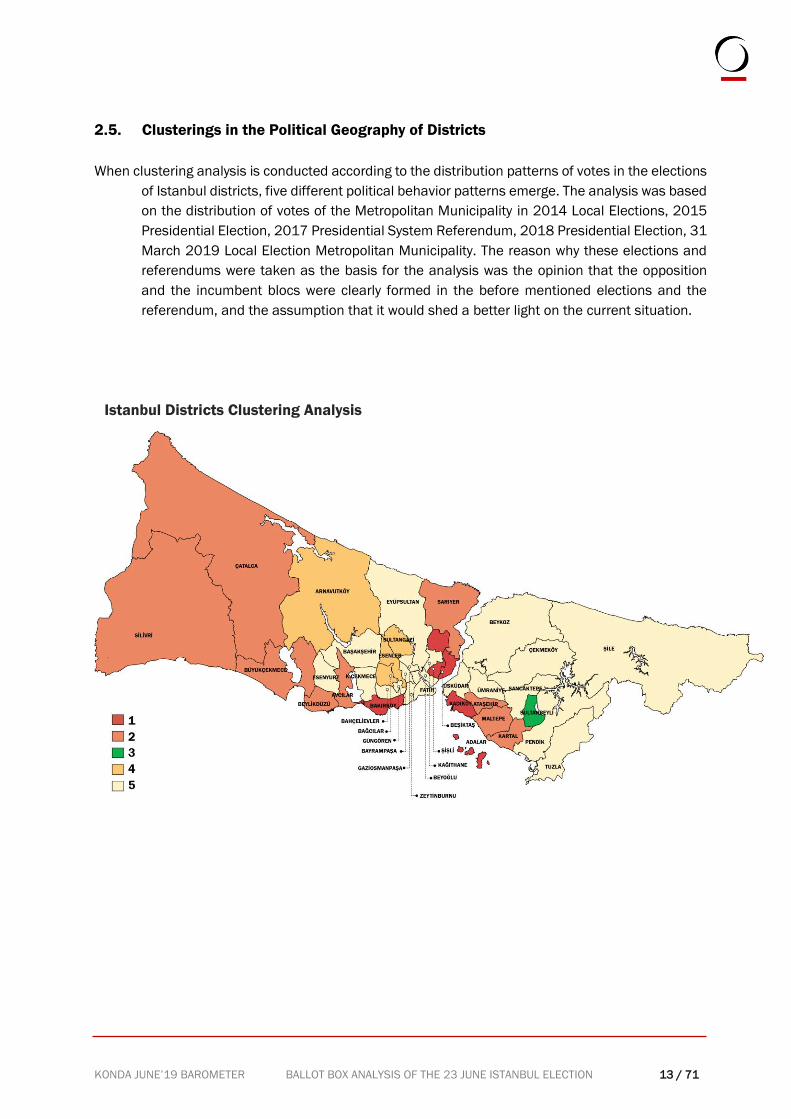
2.5. Clusterings in the Political Geography of Districts
When clustering analysis is conducted according to the distribution patterns of votes in the elections
of Istanbul districts, five different political behavior patterns emerge. The analysis was based
on the distribution of votes of the Metropolitan Municipality in 2014 Local Elections, 2015
Presidential Election, 2017 Presidential System Referendum, 2018 Presidential Election, 31
March 2019 Local Election Metropolitan Municipality. The reason why these elections and
referendums were taken as the basis for the analysis was the opinion that the opposition
and the incumbent blocs were clearly formed in the before mentioned elections and the
referendum, and the assumption that it would shed a better light on the current situation.
Istanbul Districts Clustering Analysis
KONDA JUNE’19 BAROMETER BALLOT BOX ANALYSIS OF THE 23 JUNE ISTANBUL ELECTION 14 / 71
Clusters Number of
Voters
Monthly
average
house-
hold in-
come
İmamoğlu Yıldırım Characteristics
ADALAR
Cluster
1
888.903
(%8,4)
6652 58,5 23,6
✓ CHP dominates
✓ Economically strong
✓ Setleddness strong
BAKIRKÖY 8845 66,3 16,9
BEŞİKTAŞ 10560 71,1 13,4
KADIKÖY 9025 67,8 14,6
ŞİŞLİ 7822 59,7 21,1
ATAŞEHİR
Cluster
2
2.137.572
(%20,2)
6577 50,4 33,1
✓ Opposition and incum-
bent blocs are in com-
plete competition
✓ Centers which gets
stronger economically
✓ Places where zoning
movement and new mi-
gration are intensive
AVCILAR 3662 50,6 30,5
BEYLİKDÜZÜ 4327 51,1 31,2
BÜYÜKÇEKMECE 3671 48,1 33,3
ÇATALCA 2128 50,6 33,9
KARTAL 4120 49,3 34,3
MALTEPE 5772 52,4 30,0
SARIYER 7308 49,3 31,1
SİLİVRİ 2372 51,1 31,0
SULTANBEYLİ Cluster 3
213.941
(%2) 2172 26,7 53,5
✓ The Ak Parti and The
HDP competition is de-
cisive
✓ Economically weak ARNAVUTKÖY
Cluster 4
1.336.252
(%12,7)
2030 31,1 48,4 ✓ The Ak Parti dominates
✓ Districts emerged and
got stronger in the last
ten years
BAĞCILAR 3197 34,6 46,0
ESENLER 2847 31,1 50,1
SULTANGAZİ 2187 34,5 48,1
BAHÇELİEVLER
Cluster 5
5.983.018
(%56,7)
4674 42,4 38,7
✓ Even if the incumbent
bloc is strong, opposi-
tion bloc is existent
✓ Old and traditional Is-
tanbul districts where
setleddness is relatively
strong
✓ Places where urban
transformation is inten-
sive
BAŞAKŞEHİR 4513 39,6 42,7
BAYRAMPAŞA 3480 42,5 40,7
BEYKOZ 3693 41,3 40,9
BEYOĞLU 4773 40,6 37,6
ÇEKMEKÖY 3503 42,9 41,1
ESENYURT 3024 44,9 33,0
EYÜPSULTAN 4670 45,4 38,1
FATİH 5281 39,3 39,2
GAZİOSMANPAŞA 3019 37,4 42,7
GÜNGÖREN 3388 39,9 41,1
KAĞITHANE 4188 39,9 41,5
KÜÇÜKÇEKMECE 3567 48,7 32,5
PENDİK 3055 37,9 43,6
SANCAKTEPE 2633 42,9 39,6
ŞİLE 2482 42,5 42,2
TUZLA 3407 44,3 38,3
ÜMRANİYE 3637 39,8 43,2
ÜSKÜDAR 6987 45,3 37,5
ZEYTİNBURNU 3644 41,8 37,8
KONDA JUNE’19 BAROMETER BALLOT BOX ANALYSIS OF THE 23 JUNE ISTANBUL ELECTION 15 / 71
We should state that the economic and sociological notes that we put forward in order to explain
the clusters formed are statements of subjective effort rather than the data. However, our
political analysis is based on political data based on clusters.
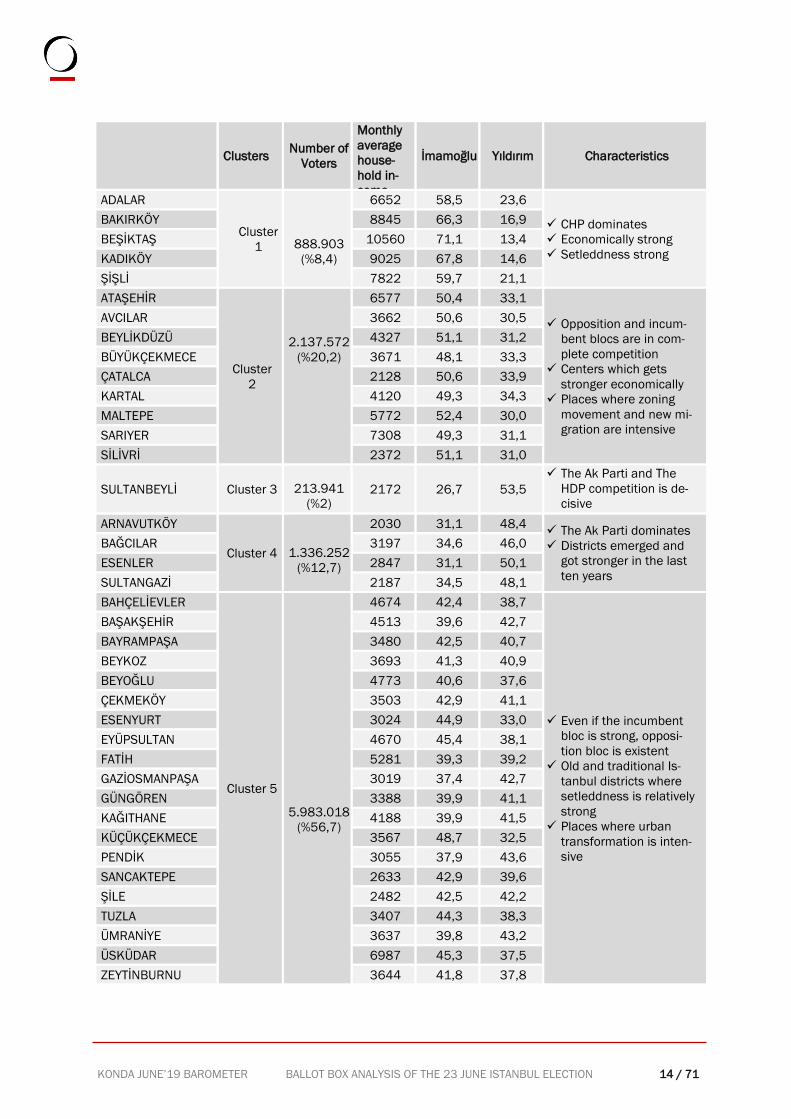
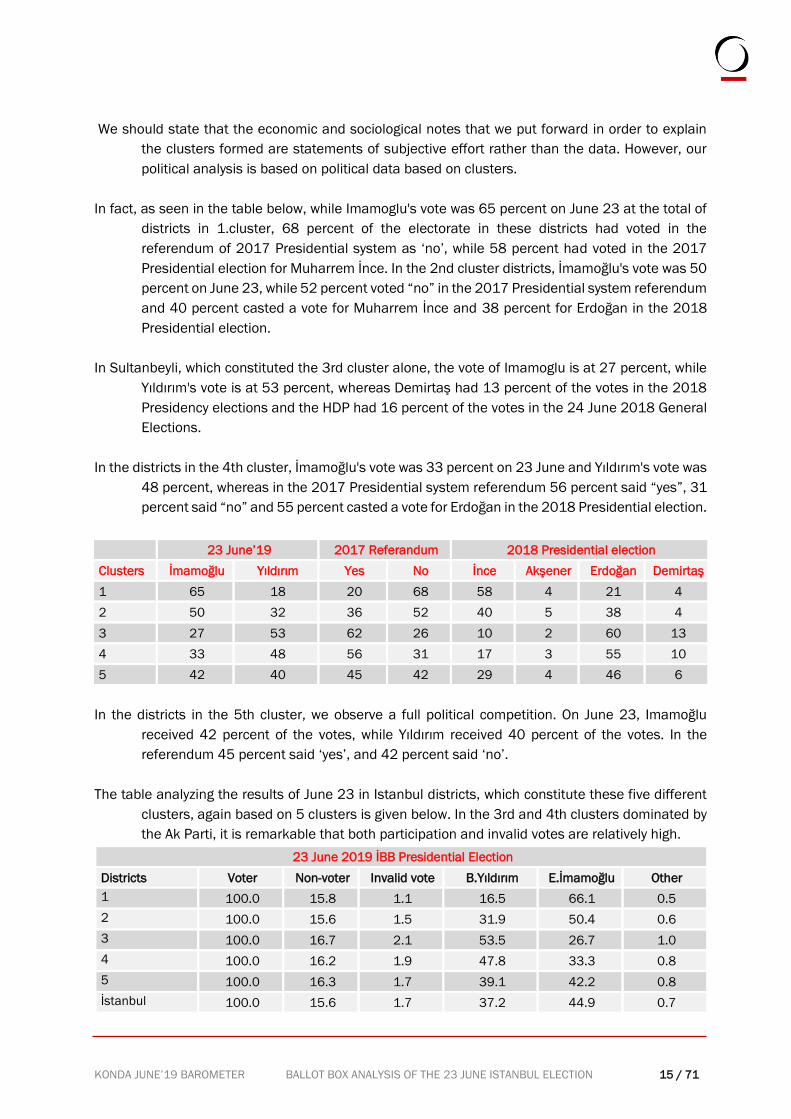
In fact, as seen in the table below, while Imamoglu's vote was 65 percent on June 23 at the total of
districts in 1.cluster, 68 percent of the electorate in these districts had voted in the
referendum of 2017 Presidential system as ‘no’, while 58 percent had voted in the 2017
Presidential election for Muharrem İnce. In the 2nd cluster districts, İmamoğlu's vote was 50
percent on June 23, while 52 percent voted “no” in the 2017 Presidential system referendum
and 40 percent casted a vote for Muharrem İnce and 38 percent for Erdoğan in the 2018
Presidential election.
In Sultanbeyli, which constituted the 3rd cluster alone, the vote of Imamoglu is at 27 percent, while
Yıldırım's vote is at 53 percent, whereas Demirtaş had 13 percent of the votes in the 2018
Presidency elections and the HDP had 16 percent of the votes in the 24 June 2018 General
Elections.
In the districts in the 4th cluster, İmamoğlu's vote was 33 percent on 23 June and Yıldırım's vote was
48 percent, whereas in the 2017 Presidential system referendum 56 percent said “yes”, 31
percent said “no” and 55 percent casted a vote for Erdoğan in the 2018 Presidential election.
23 June’19 2017 Referandum 2018 Presidential election
Clusters İmamoğlu Yıldırım Yes No İnce Akşener Erdoğan Demirtaş
1 65 18 20 68 58 4 21 4
2 50 32 36 52 40 5 38 4
3 27 53 62 26 10 2 60 13
4 33 48 56 31 17 3 55 10
5 42 40 45 42 29 4 46 6
In the districts in the 5th cluster, we observe a full political competition. On June 23, Imamoğlu
received 42 percent of the votes, while Yıldırım received 40 percent of the votes. In the
referendum 45 percent said ‘yes’, and 42 percent said ‘no’.
The table analyzing the results of June 23 in Istanbul districts, which constitute these five different
clusters, again based on 5 clusters is given below. In the 3rd and 4th clusters dominated by
the Ak Parti, it is remarkable that both participation and invalid votes are relatively high.
23 June 2019 İBB Presidential Election
Districts Voter Non-voter Invalid vote B.Yıldırım E.İmamoğlu Other
1 100.0 15.8 1.1 16.5 66.1 0.5
2 100.0 15.6 1.5 31.9 50.4 0.6
3 100.0 16.7 2.1 53.5 26.7 1.0
4 100.0 16.2 1.9 47.8 33.3 0.8
5 100.0 16.3 1.7 39.1 42.2 0.8
İstanbul 100.0 15.6 1.7 37.2 44.9 0.7
KONDA JUNE’19 BAROMETER BALLOT BOX ANALYSIS OF THE 23 JUNE ISTANBUL ELECTION 16 / 71
2.6. Vote Shifts
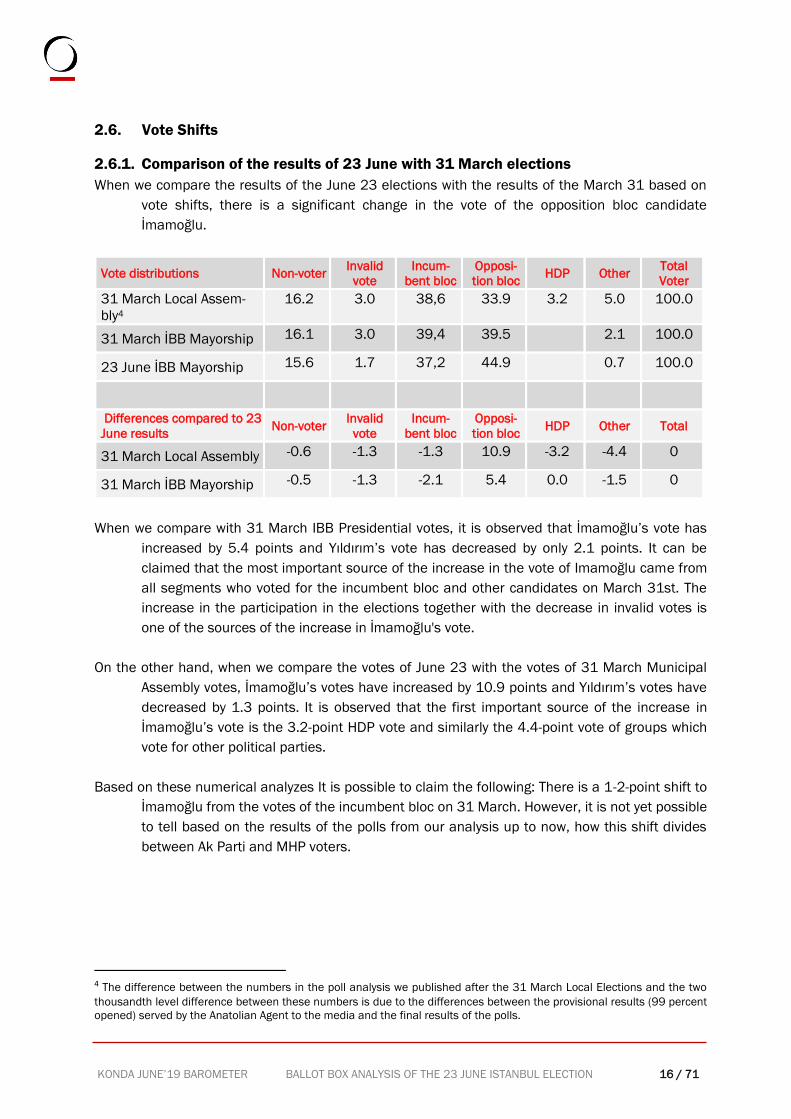
2.6.1. Comparison of the results of 23 June with 31 March elections
When we compare the results of the June 23 elections with the results of the March 31 based on
vote shifts, there is a significant change in the vote of the opposition bloc candidate
İmamoğlu.
Vote distributions Non-voter Invalid
vote
Incum-
bent bloc
Opposi-
tion bloc HDP Other
Total
Voter
31 March Local Assem-
bly4
16.2 3.0 38,6 33.9 3.2 5.0 100.0
31 March İBB Mayorship 16.1 3.0 39,4 39.5
2.1 100.0
23 June İBB Mayorship 15.6 1.7 37,2 44.9
0.7 100.0
Differences compared to 23
June results Non-voter
Invalid
vote
Incum-
bent bloc
Opposi-
tion bloc HDP Other Total
31 March Local Assembly -0.6 -1.3 -1.3 10.9 -3.2 -4.4 0
31 March İBB Mayorship -0.5 -1.3 -2.1 5.4 0.0 -1.5 0
When we compare with 31 March IBB Presidential votes, it is observed that İmamoğlu’s vote has
increased by 5.4 points and Yıldırım’s vote has decreased by only 2.1 points. It can be
claimed that the most important source of the increase in the vote of Imamoğlu came from
all segments who voted for the incumbent bloc and other candidates on March 31st. The
increase in the participation in the elections together with the decrease in invalid votes is
one of the sources of the increase in İmamoğlu's vote.
On the other hand, when we compare the votes of June 23 with the votes of 31 March Municipal
Assembly votes, İmamoğlu’s votes have increased by 10.9 points and Yıldırım’s votes have
decreased by 1.3 points. It is observed that the first important source of the increase in
İmamoğlu’s vote is the 3.2-point HDP vote and similarly the 4.4-point vote of groups which
vote for other political parties.
Based on these numerical analyzes It is possible to claim the following: There is a 1-2-point shift to
İmamoğlu from the votes of the incumbent bloc on 31 March. However, it is not yet possible
to tell based on the results of the polls from our analysis up to now, how this shift divides
between Ak Parti and MHP voters.
4 The difference between the numbers in the poll analysis we published after the 31 March Local Elections and the two
thousandth level difference between these numbers is due to the differences between the provisional results (99 percent
opened) served by the Anatolian Agent to the media and the final results of the polls.
KONDA JUNE’19 BAROMETER BALLOT BOX ANALYSIS OF THE 23 JUNE ISTANBUL ELECTION 17 / 71
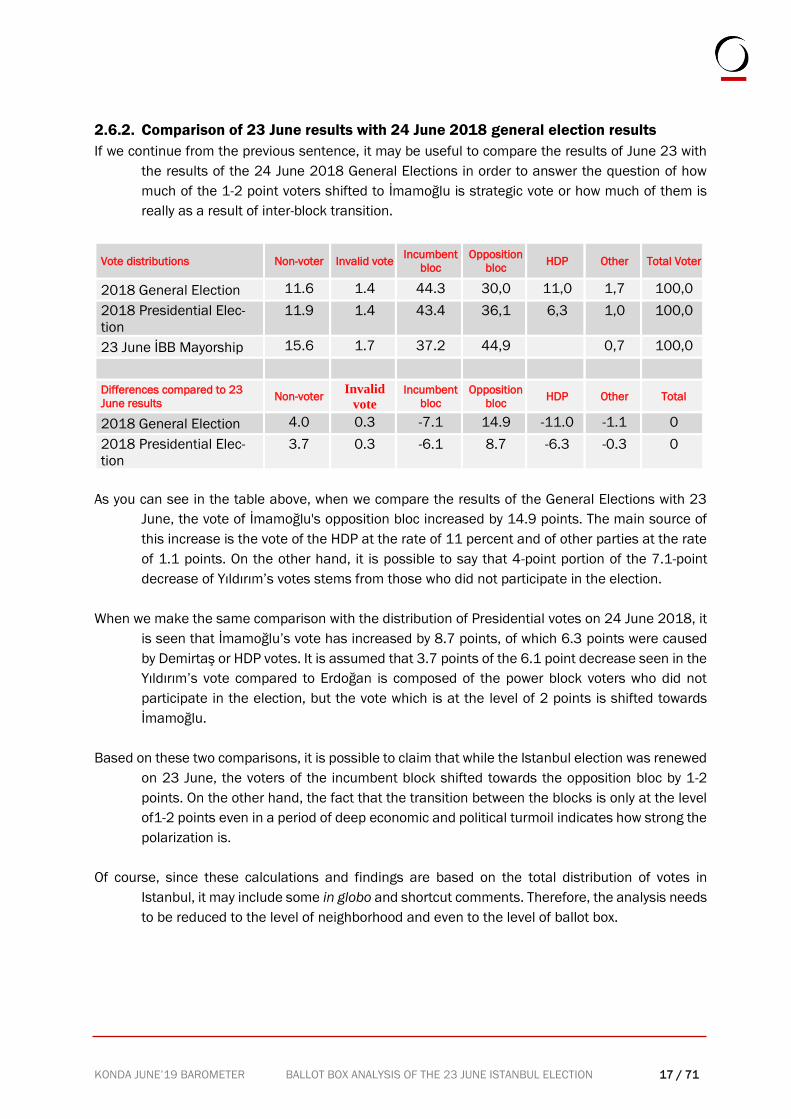
2.6.2. Comparison of 23 June results with 24 June 2018 general election results
If we continue from the previous sentence, it may be useful to compare the results of June 23 with
the results of the 24 June 2018 General Elections in order to answer the question of how
much of the 1-2 point voters shifted to İmamoğlu is strategic vote or how much of them is
really as a result of inter-block transition.
Vote distributions Non-voter Invalid vote Incumbent
bloc
Opposition
bloc HDP Other Total Voter
2018 General Election 11.6 1.4 44.3 30,0 11,0 1,7 100,0
2018 Presidential Elec-
tion
11.9 1.4 43.4 36,1 6,3 1,0 100,0
23 June İBB Mayorship 15.6 1.7 37.2 44,9
0,7 100,0
Differences compared to 23
June results Non-voter
Invalid
vote
Incumbent
bloc Opposition
bloc HDP Other Total
2018 General Election 4.0 0.3 -7.1 14.9 -11.0 -1.1 0
2018 Presidential Elec-
tion
3.7 0.3 -6.1 8.7 -6.3 -0.3 0
As you can see in the table above, when we compare the results of the General Elections with 23
June, the vote of İmamoğlu's opposition bloc increased by 14.9 points. The main source of
this increase is the vote of the HDP at the rate of 11 percent and of other parties at the rate
of 1.1 points. On the other hand, it is possible to say that 4-point portion of the 7.1-point
decrease of Yıldırım’s votes stems from those who did not participate in the election.
When we make the same comparison with the distribution of Presidential votes on 24 June 2018, it
is seen that İmamoğlu’s vote has increased by 8.7 points, of which 6.3 points were caused
by Demirtaş or HDP votes. It is assumed that 3.7 points of the 6.1 point decrease seen in the
Yıldırım’s vote compared to Erdoğan is composed of the power block voters who did not
participate in the election, but the vote which is at the level of 2 points is shifted towards
İmamoğlu.
Based on these two comparisons, it is possible to claim that while the Istanbul election was renewed
on 23 June, the voters of the incumbent block shifted towards the opposition bloc by 1-2
points. On the other hand, the fact that the transition between the blocks is only at the level
of1-2 points even in a period of deep economic and political turmoil indicates how strong the
polarization is.
Of course, since these calculations and findings are based on the total distribution of votes in
Istanbul, it may include some in globo and shortcut comments. Therefore, the analysis needs
to be reduced to the level of neighborhood and even to the level of ballot box.
KONDA JUNE’19 BAROMETER BALLOT BOX ANALYSIS OF THE 23 JUNE ISTANBUL ELECTION 18 / 71
2.7. Vote Shifts Analysis
Çilek Ağacı - http://cilekagaci.com/
2.7.1. Summary In this study, we present a numerical analysis of the results of 24 June 2018 General Elections and
31 March and 23 June 2019 Local Elections. In our study, we used the Istanbul election
results at the neighborhood level. The focus of the report is on (i) vote transitions in Istanbul
and (ii) election participation of party bases. We have strengthened the reliability of the
findings in the study with comparisons at the neighborhood.
Main findings:
• Imamoğlu received the support of the majority of the electorate who voted for the CHP, the
İyi Parti and the HDP in the March elections. This support has gained strength in the June
elections.
• A significant number of voters who voted for Binali Yıldırım in the March Elections voted for
Ekrem İmamoğlu in the repeated June elections.
• In March 2019 elections, less than half of MHP voters voted for Binali Yıldırım. In June, this
support was further weakened and only a third of MHP electorate voted for Binali Yıldırım.
The majority of MHP electorate voted in favor of Ekrem İmamoğlu in the second election.
• A significant portion of the electorate who voted for the Ak Parti (3,5% according to our vote
transition model) voted for İmamoğlu in June.
• According to the March elections, most of the valid votes increased in June were in favor of
Imamoglu and the majority of this electorate is consisted of the electorate who voted for the
HDP and İyi Parti in the 2018 General Elections.
• The Saadet Parti electorate, who supported their candidates in the March elections, voted in
favor of İmamoğlu in the June elections.
We applied the same methods that Çilek Ağacı used in the previous elections for the vote transition
analysis. You can find the data and code that we use in our study on our GitHub website.
KONDA JUNE’19 BAROMETER BALLOT BOX ANALYSIS OF THE 23 JUNE ISTANBUL ELECTION 19 / 71
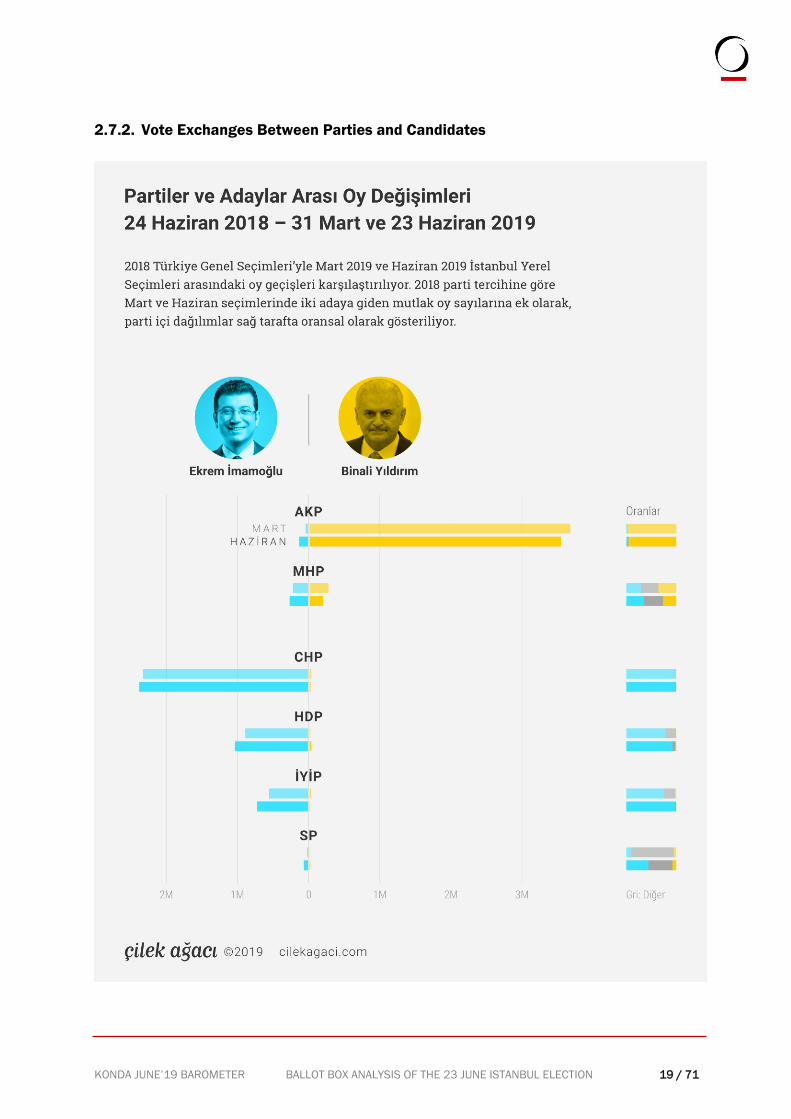
2.7.2. Vote Exchanges Between Parties and Candidates
KONDA JUNE’19 BAROMETER BALLOT BOX ANALYSIS OF THE 23 JUNE ISTANBUL ELECTION 20 / 71
In both local elections, the majority of the votes received by Binali Yıldırım came from the voters who
voted in favor of the Ak Parti in the 2018 General Elections. In the March 2019 Local
Elections, Yıldırım received the support of only less than half of the voters who voted for the
MHP in 2018. This support further weakened in the June elections in Istanbul. In 2018, the
majority of voters who voted for the CHP, HDP and İyi Parti supported Ekrem İmamoğlu in the
March 2019 Local Elections. This support strengthened in June for these three parties and
reached almost all of the electorate. While the Saadet Parti voters supported their own
candidates in the March 2019 Local Elections, almost half of the same voters voted in favor
of İmamoğlu in the June elections. Imamoğlu managed to convince 3.5 percent of Ak Parti
voters in the second election.
KONDA JUNE’19 BAROMETER BALLOT BOX ANALYSIS OF THE 23 JUNE ISTANBUL ELECTION 21 / 71
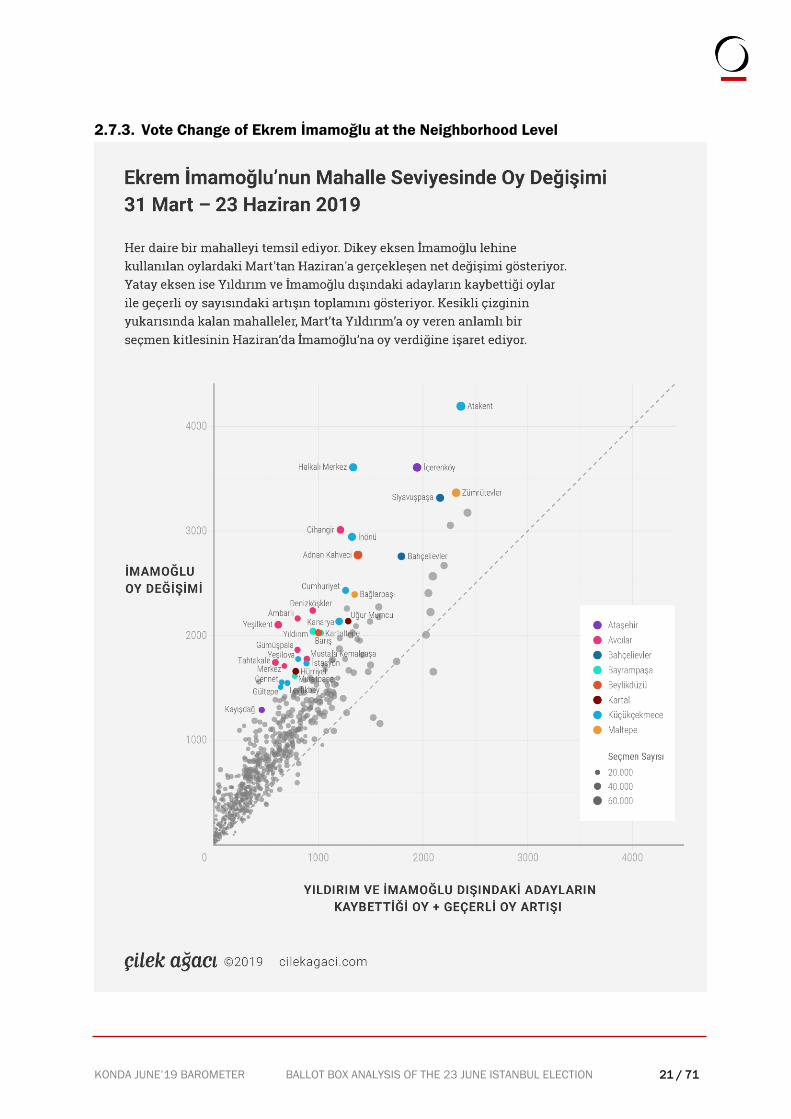
2.7.3. Vote Change of Ekrem İmamoğlu at the Neighborhood Level
KONDA JUNE’19 BAROMETER BALLOT BOX ANALYSIS OF THE 23 JUNE ISTANBUL ELECTION 22 / 71
Even if we assume that all voters who did not vote in the Istanbul March elections but went to the
polls in June voted for Ekrem İmamoğlu and that all the votes lost by candidates other than
Binali Yıldırım were also casted for Ekrem İmamoğlu, it is not possible to explain the increase
in İmamoğlu's votes without passing of the votes from Yıldırım. Because almost all the dots
representing the neighborhoods are located above the dashed x = y line. This is an
observation that supports the findings in our vote transitions analysis.
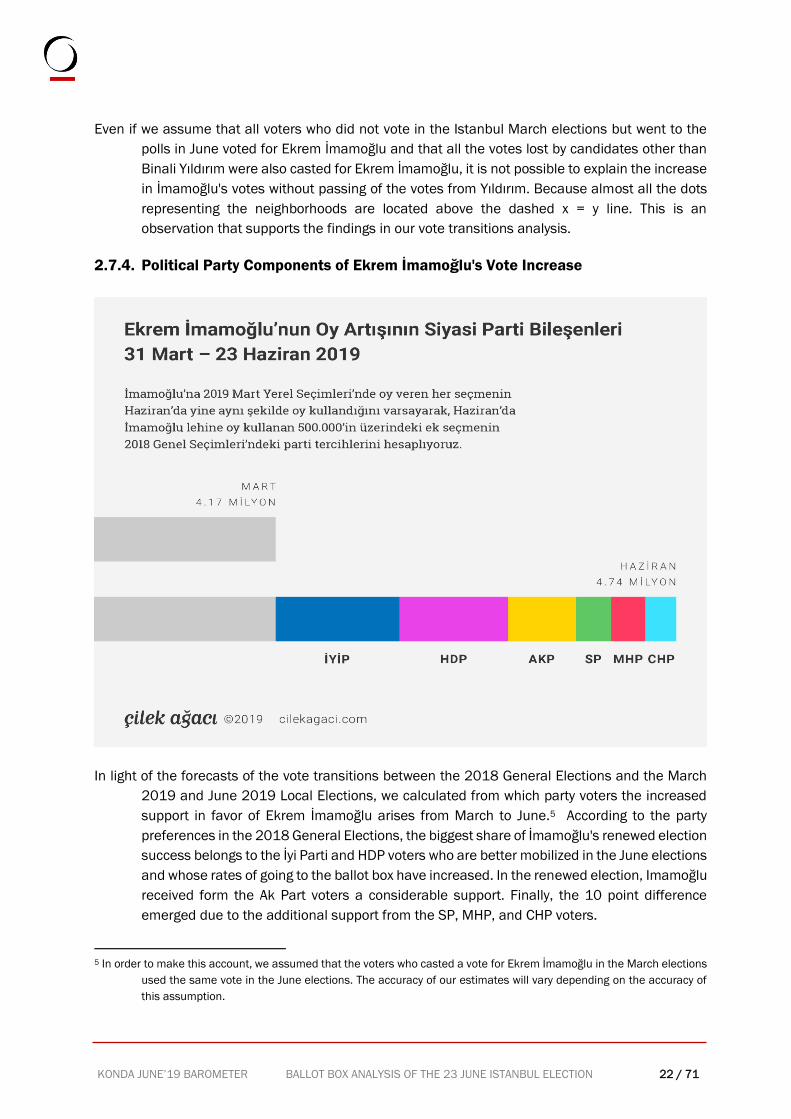
2.7.4. Political Party Components of Ekrem İmamoğlu's Vote Increase
In light of the forecasts of the vote transitions between the 2018 General Elections and the March
2019 and June 2019 Local Elections, we calculated from which party voters the increased
support in favor of Ekrem İmamoğlu arises from March to June.5 According to the party
preferences in the 2018 General Elections, the biggest share of İmamoğlu's renewed election
success belongs to the İyi Parti and HDP voters who are better mobilized in the June elections
and whose rates of going to the ballot box have increased. In the renewed election, Imamoğlu
received form the Ak Part voters a considerable support. Finally, the 10 point difference
emerged due to the additional support from the SP, MHP, and CHP voters.
5 In order to make this account, we assumed that the voters who casted a vote for Ekrem İmamoğlu in the March elections
used the same vote in the June elections. The accuracy of our estimates will vary depending on the accuracy of
this assumption.
KONDA JUNE’19 BAROMETER BALLOT BOX ANALYSIS OF THE 23 JUNE ISTANBUL ELECTION 23 / 71
In the analysis, which we perform almost in every election, we observed such a clear voter shift
between the polarized blocs. We will observe in the forthcoming days, if these voter shifts,
which emerged in a relatively short time, will reveal a positive change in Turkish politics.
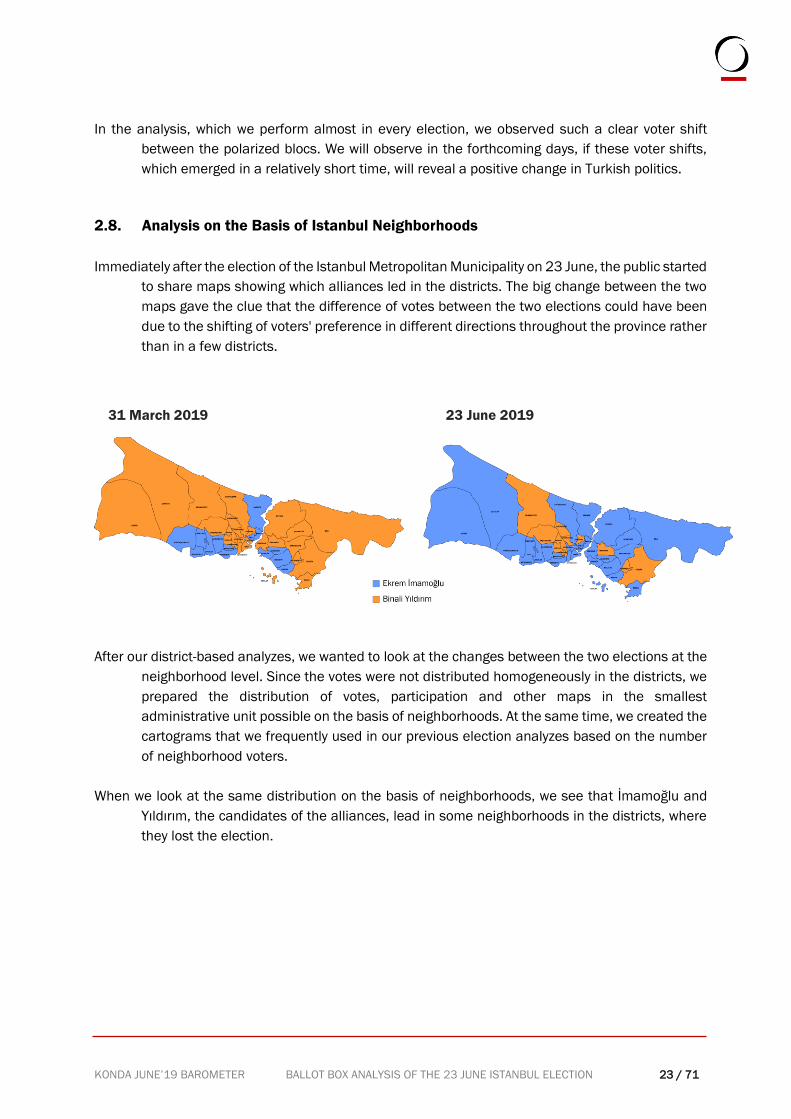
2.8. Analysis on the Basis of Istanbul Neighborhoods
Immediately after the election of the Istanbul Metropolitan Municipality on 23 June, the public started
to share maps showing which alliances led in the districts. The big change between the two
maps gave the clue that the difference of votes between the two elections could have been
due to the shifting of voters' preference in different directions throughout the province rather
than in a few districts.
After our district-based analyzes, we wanted to look at the changes between the two elections at the
neighborhood level. Since the votes were not distributed homogeneously in the districts, we
prepared the distribution of votes, participation and other maps in the smallest
administrative unit possible on the basis of neighborhoods. At the same time, we created the
cartograms that we frequently used in our previous election analyzes based on the number
of neighborhood voters.
When we look at the same distribution on the basis of neighborhoods, we see that İmamoğlu and
Yıldırım, the candidates of the alliances, lead in some neighborhoods in the districts, where
they lost the election.
31 March 2019 23 June 2019
KONDA JUNE’19 BAROMETER BALLOT BOX ANALYSIS OF THE 23 JUNE ISTANBUL ELECTION 24 / 71
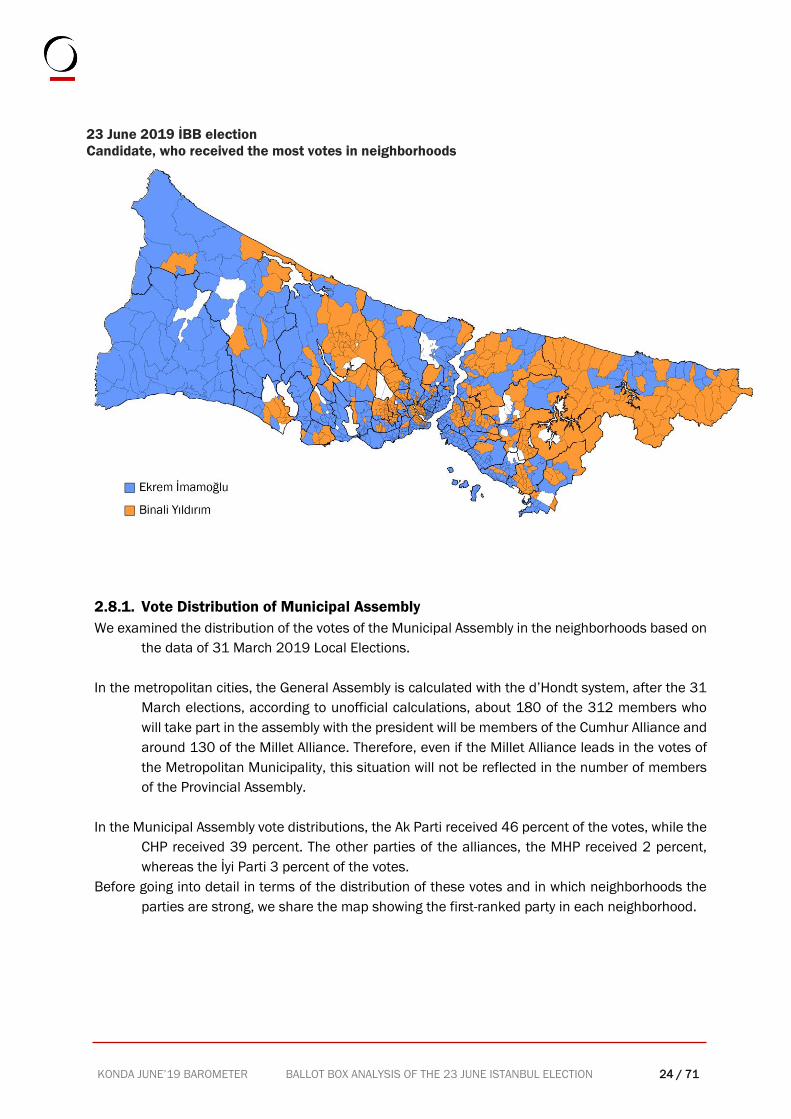
2.8.1. Vote Distribution of Municipal Assembly
We examined the distribution of the votes of the Municipal Assembly in the neighborhoods based on
the data of 31 March 2019 Local Elections.
In the metropolitan cities, the General Assembly is calculated with the d’Hondt system, after the 31
March elections, according to unofficial calculations, about 180 of the 312 members who
will take part in the assembly with the president will be members of the Cumhur Alliance and
around 130 of the Millet Alliance. Therefore, even if the Millet Alliance leads in the votes of
the Metropolitan Municipality, this situation will not be reflected in the number of members
of the Provincial Assembly.
In the Municipal Assembly vote distributions, the Ak Parti received 46 percent of the votes, while the
CHP received 39 percent. The other parties of the alliances, the MHP received 2 percent,
whereas the İyi Parti 3 percent of the votes.
Before going into detail in terms of the distribution of these votes and in which neighborhoods the
parties are strong, we share the map showing the first-ranked party in each neighborhood.
23 June 2019 İBB election
Candidate, who received the most votes in neighborhoods
KONDA JUNE’19 BAROMETER BALLOT BOX ANALYSIS OF THE 23 JUNE ISTANBUL ELECTION 25 / 71
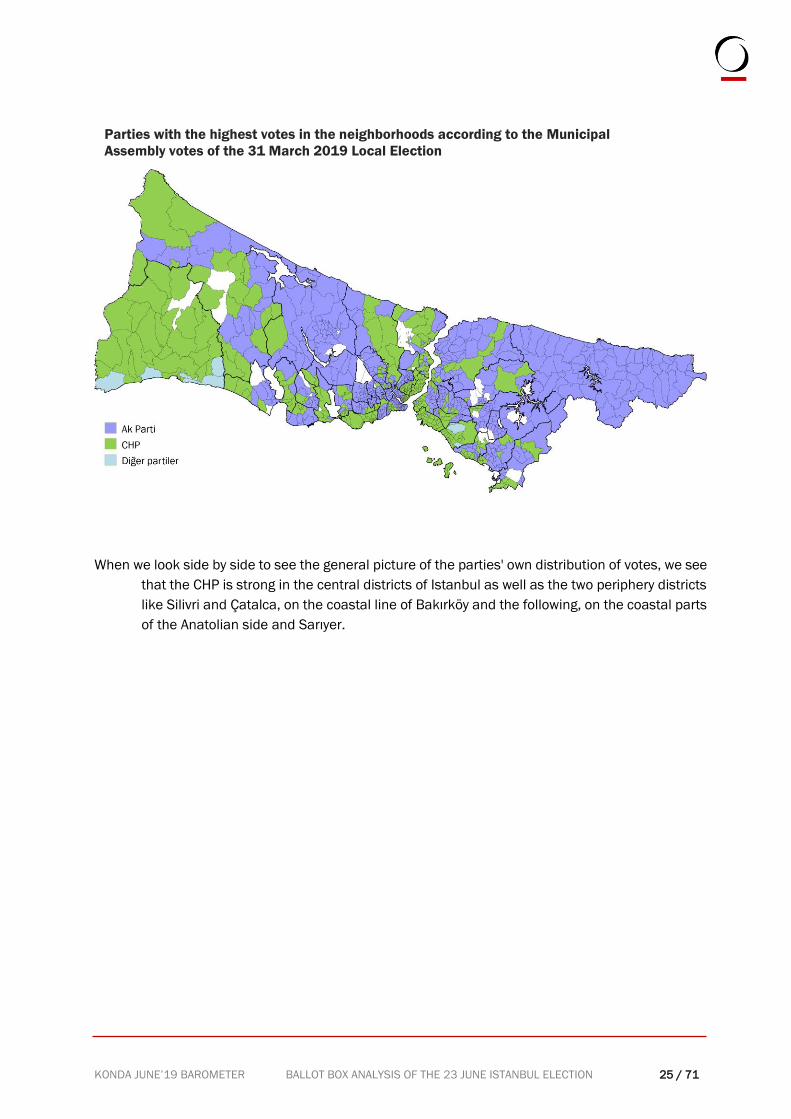
When we look side by side to see the general picture of the parties' own distribution of votes, we see
that the CHP is strong in the central districts of Istanbul as well as the two periphery districts
like Silivri and Çatalca, on the coastal line of Bakırköy and the following, on the coastal parts
of the Anatolian side and Sarıyer.
Parties with the highest votes in the neighborhoods according to the Municipal
Assembly votes of the 31 March 2019 Local Election
KONDA JUNE’19 BAROMETER BALLOT BOX ANALYSIS OF THE 23 JUNE ISTANBUL ELECTION 26 / 71
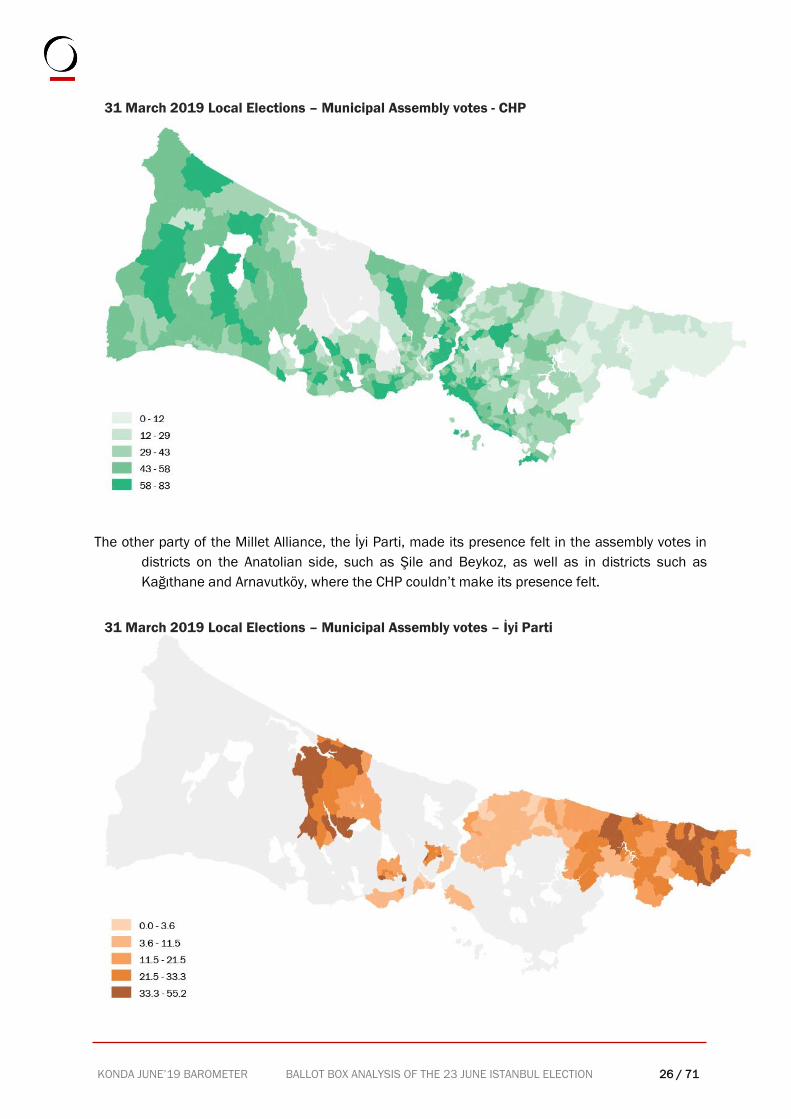
The other party of the Millet Alliance, the İyi Parti, made its presence felt in the assembly votes in
districts on the Anatolian side, such as Şile and Beykoz, as well as in districts such as
Kağıthane and Arnavutköy, where the CHP couldn’t make its presence felt.
31 March 2019 Local Elections – Municipal Assembly votes - CHP
31 March 2019 Local Elections – Municipal Assembly votes – İyi Parti
KONDA JUNE’19 BAROMETER BALLOT BOX ANALYSIS OF THE 23 JUNE ISTANBUL ELECTION 27 / 71
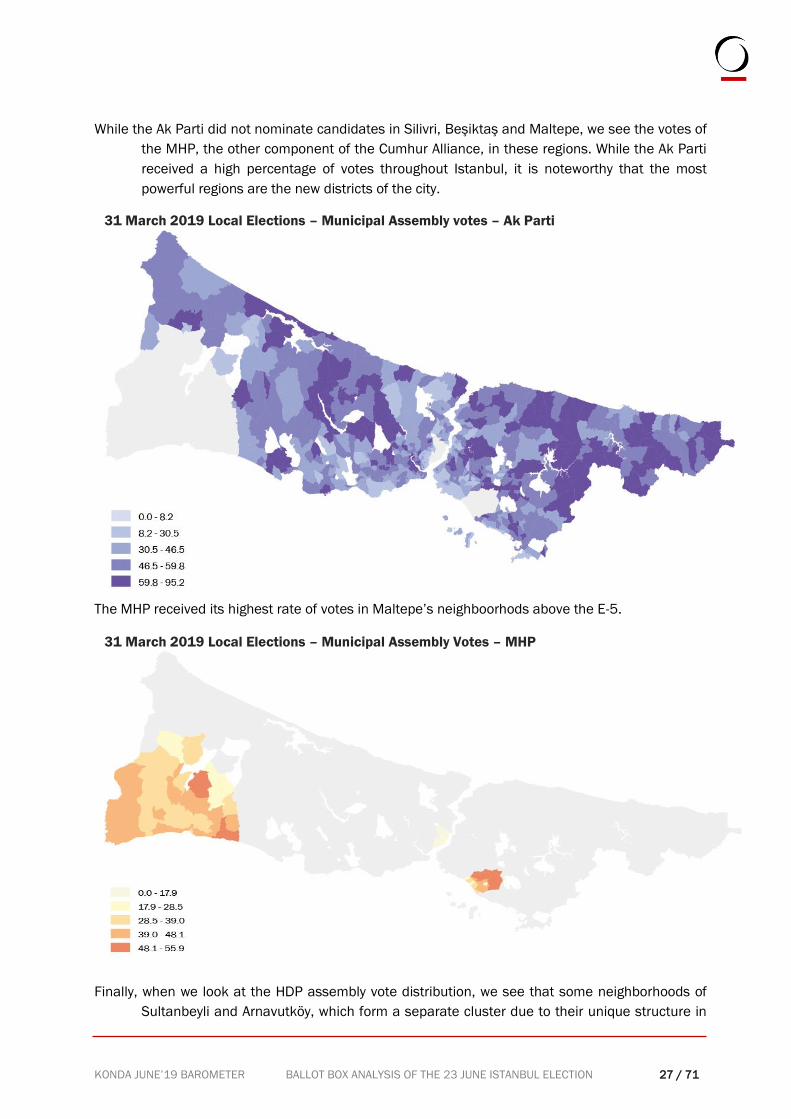
While the Ak Parti did not nominate candidates in Silivri, Beşiktaş and Maltepe, we see the votes of
the MHP, the other component of the Cumhur Alliance, in these regions. While the Ak Parti
received a high percentage of votes throughout Istanbul, it is noteworthy that the most
powerful regions are the new districts of the city.
The MHP received its highest rate of votes in Maltepe’s neighboorhods above the E-5.
Finally, when we look at the HDP assembly vote distribution, we see that some neighborhoods of
Sultanbeyli and Arnavutköy, which form a separate cluster due to their unique structure in
31 March 2019 Local Elections – Municipal Assembly votes – Ak Parti
31 March 2019 Local Elections – Municipal Assembly Votes – MHP
KONDA JUNE’19 BAROMETER BALLOT BOX ANALYSIS OF THE 23 JUNE ISTANBUL ELECTION 28 / 71
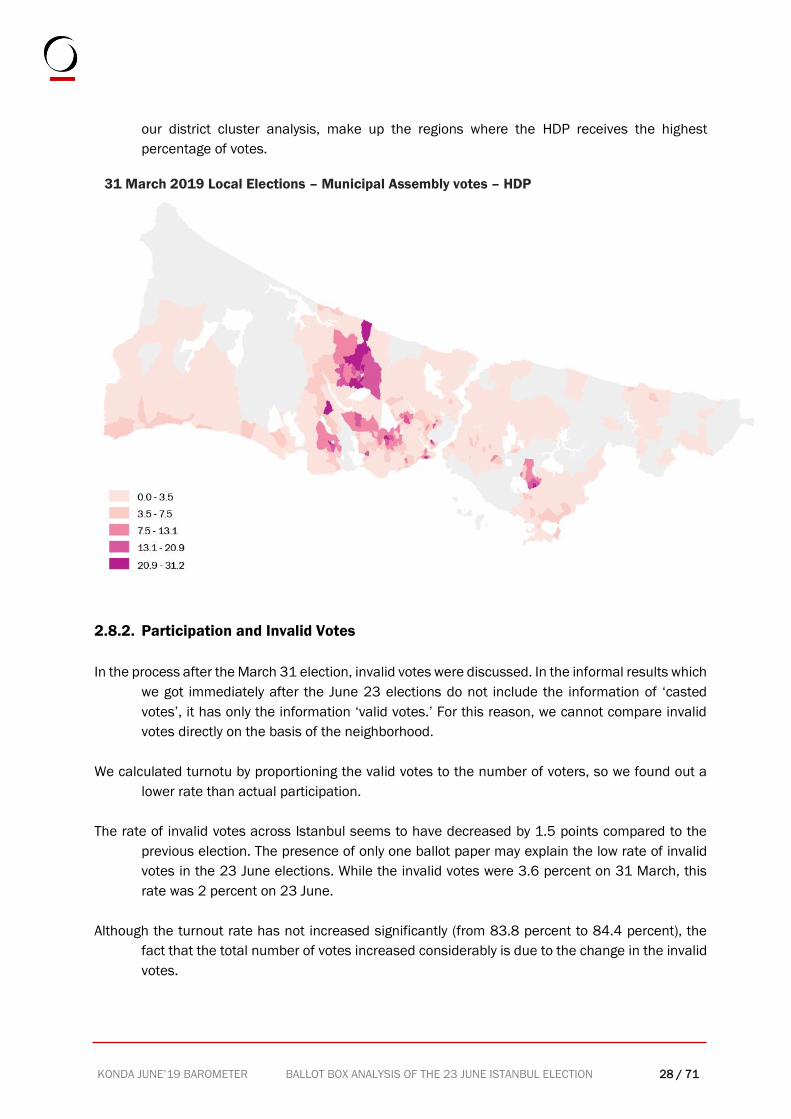
our district cluster analysis, make up the regions where the HDP receives the highest
percentage of votes.
2.8.2. Participation and Invalid Votes
In the process after the March 31 election, invalid votes were discussed. In the informal results which
we got immediately after the June 23 elections do not include the information of ‘casted
votes’, it has only the information ‘valid votes.’ For this reason, we cannot compare invalid
votes directly on the basis of the neighborhood.
We calculated turnotu by proportioning the valid votes to the number of voters, so we found out a
lower rate than actual participation.
The rate of invalid votes across Istanbul seems to have decreased by 1.5 points compared to the
previous election. The presence of only one ballot paper may explain the low rate of invalid
votes in the 23 June elections. While the invalid votes were 3.6 percent on 31 March, this
rate was 2 percent on 23 June.
Although the turnout rate has not increased significantly (from 83.8 percent to 84.4 percent), the
fact that the total number of votes increased considerably is due to the change in the invalid
votes.
31 March 2019 Local Elections – Municipal Assembly votes – HDP
KONDA JUNE’19 BAROMETER BALLOT BOX ANALYSIS OF THE 23 JUNE ISTANBUL ELECTION 29 / 71
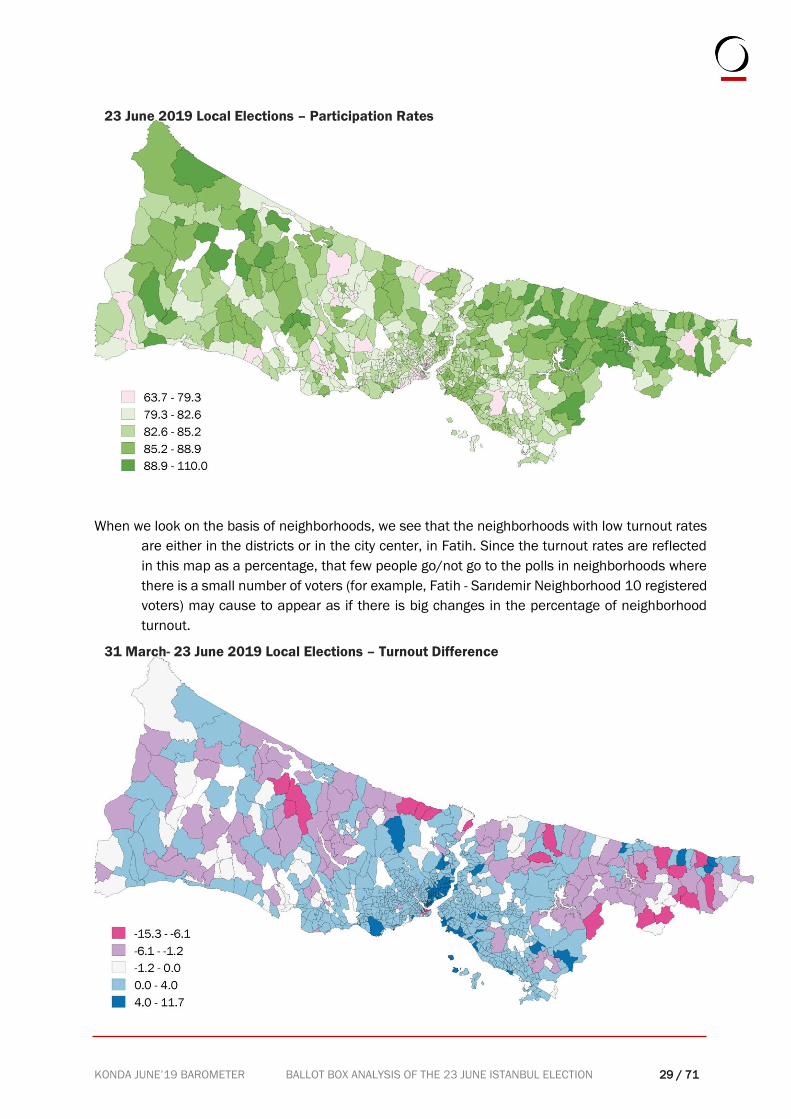
When we look on the basis of neighborhoods, we see that the neighborhoods with low turnout rates
are either in the districts or in the city center, in Fatih. Since the turnout rates are reflected
in this map as a percentage, that few people go/not go to the polls in neighborhoods where
there is a small number of voters (for example, Fatih - Sarıdemir Neighborhood 10 registered
voters) may cause to appear as if there is big changes in the percentage of neighborhood
turnout.
23 June 2019 Local Elections – Participation Rates
31 March- 23 June 2019 Local Elections – Turnout Difference
KONDA JUNE’19 BAROMETER BALLOT BOX ANALYSIS OF THE 23 JUNE ISTANBUL ELECTION 30 / 71
As we mentioned earlier, we calculated the percentage of turnout of the 23 June voter turnout from
the proportioning of the valid votes to the number of voters, we made the same account for
the 31 March elections and looked at the difference between the two.
According to the previous election, the neighborhoods where turnout increased the most were the
coastal districts of Beşiktaş, Kadıköy and Bakırköy, while turnout in the districts in the
periphery decreased compared to 31 March.
2.8.3. İBB Vote Distributions
Ekrem İmamoğlu
At the beginning of the chapter, we shared the neighborhood map showing the first ranked candidate
in each neighborhood. We will give a detailed analysis of both candidates in this section.
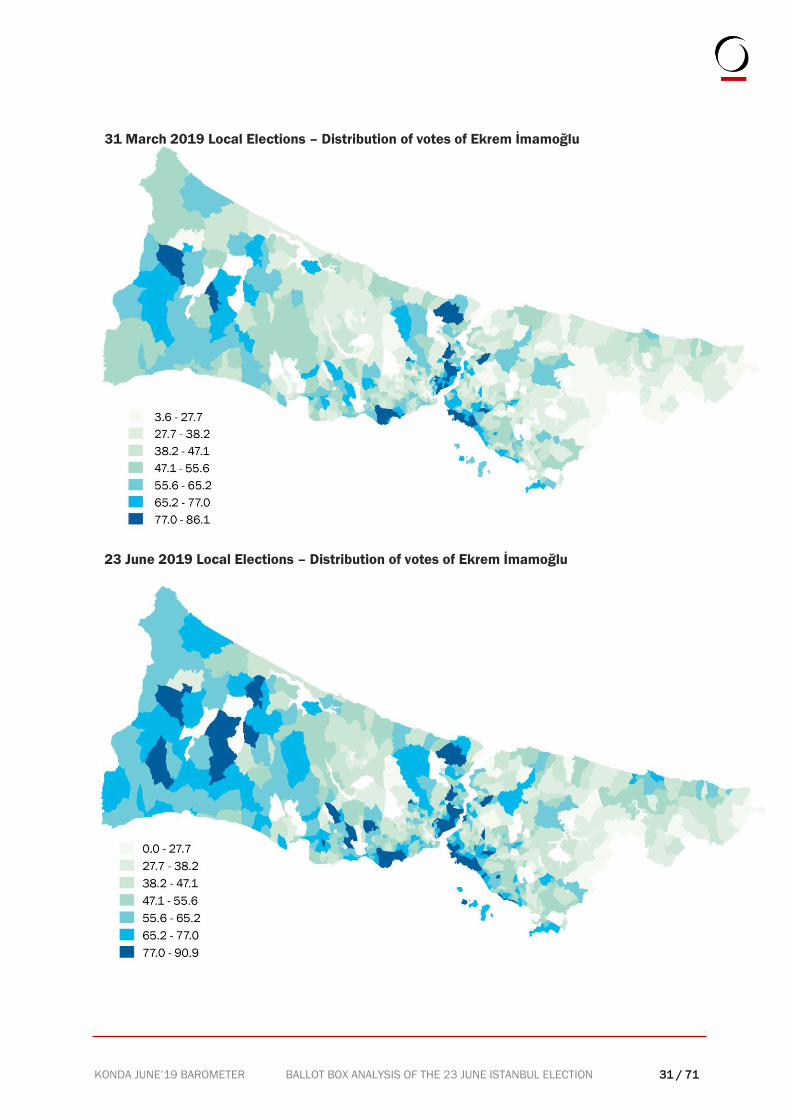
In the map prepared according to the rates of votes which Ekrem İmamoğlu received in the March
31 elections, we see that the regions where he has been the most successful are Kadıköy,
Beşiktaş and Bakırköy, which exist since the oldest macroforms, in other words since the
oldest settlement areas of Istanbul.
From the peripheries of the Anatolian side and from the historical peninsula to the north, as we g oto
the old industrial zones and the newly developing districts, his rates of vote are relatively low.
The reason why we put both maps up and down is to emphasize the difference between the two
maps, which are formed with the same refractions and the same color scale. While Imamoğlu
had high vote rates in the same regions in both elections, it was the first finding that the
number of neighborhoods, which he received more than 50 percent of votes on 23 June,
increased considerably. In other words, while the general table does not change in the
distribution of votes, the rate of votes, which he received, increases on 23 June.
KONDA JUNE’19 BAROMETER BALLOT BOX ANALYSIS OF THE 23 JUNE ISTANBUL ELECTION 31 / 71
23 June 2019 Local Elections – Distribution of votes of Ekrem İmamoğlu
31 March 2019 Local Elections – Distribution of votes of Ekrem İmamoğlu
KONDA JUNE’19 BAROMETER BALLOT BOX ANALYSIS OF THE 23 JUNE ISTANBUL ELECTION 32 / 71
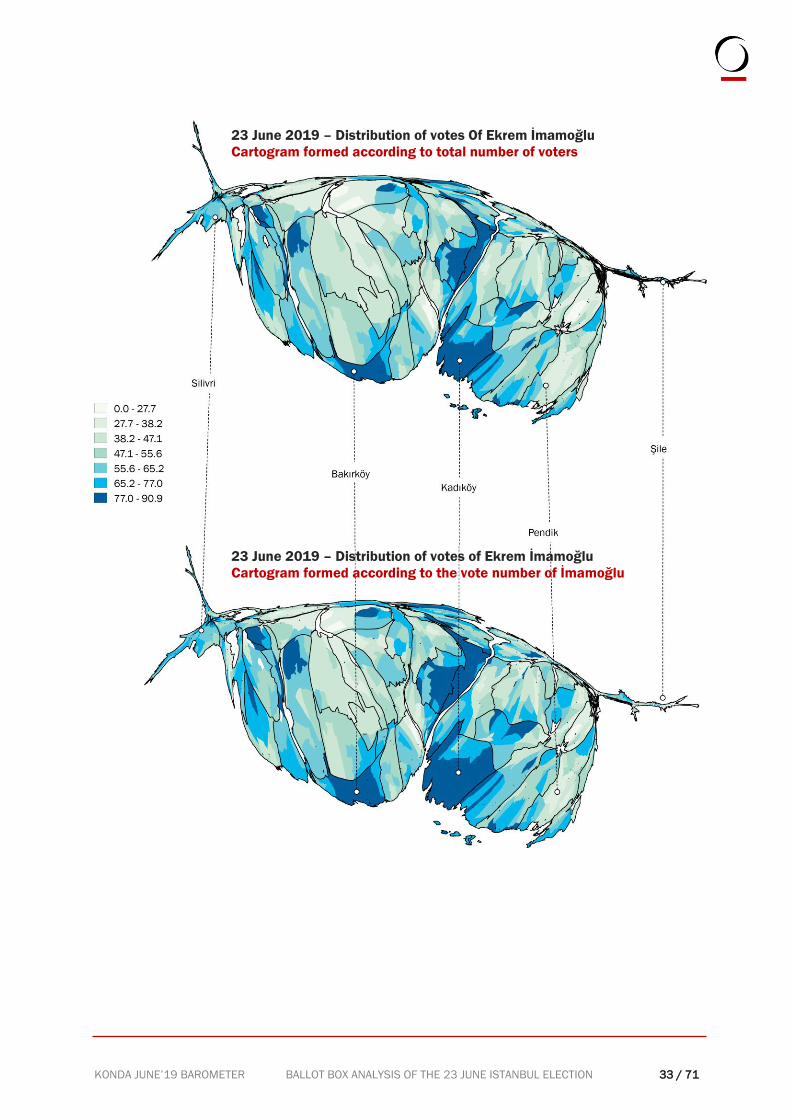
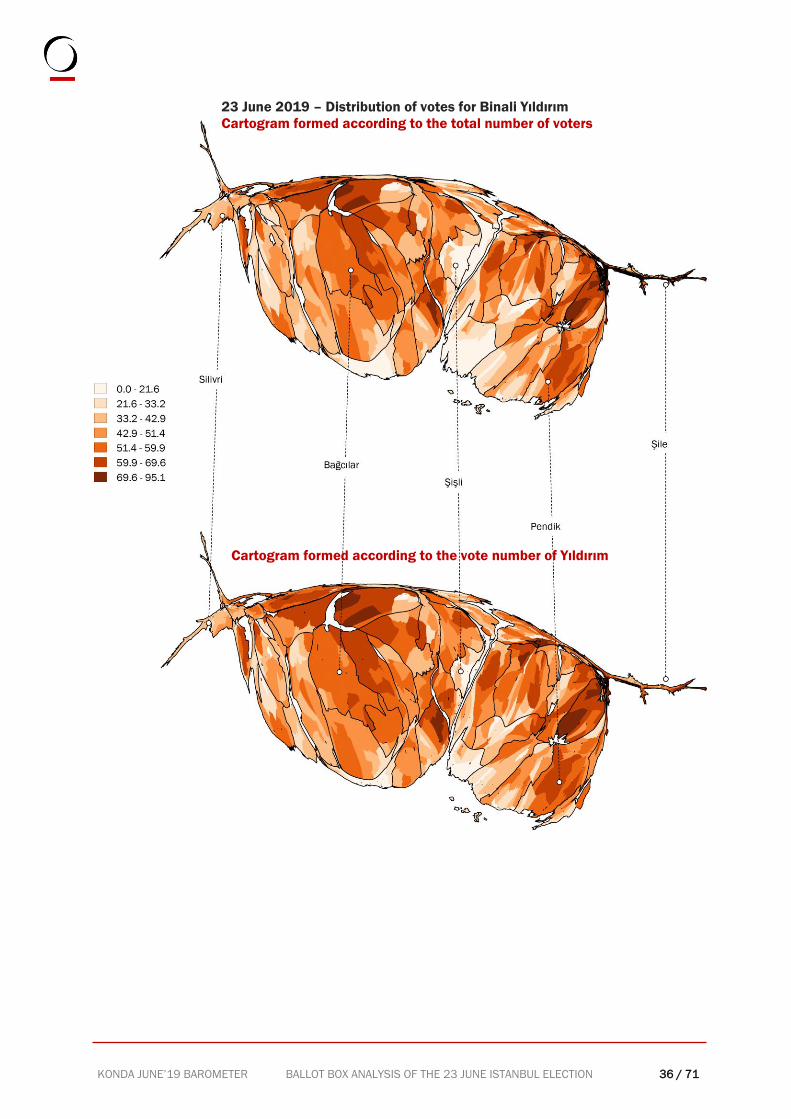
Cartogram
We prepared two separate cartograms based on all the voters of Istanbul and Imamoğlu's own voters.
In this method, which reshapes the boundaries of the neighborhood according to the number
of voters, the center becomes visible by getting rid of the administrative borders of the small
but dense neighborhoods, whereas the large-area but low-populated neighborhoods occupy
much less space.
The small differences between these two maps are due to the fact that the neighborhoods such as
Kadıköy, Beşiktaş, Bakırköy, where İmamoğlu voters are more intense, grow and the area
occupied by the neighborhoods where İmamoğlu receives less votes shrinks.
You will see a similar example of cartograms for Binali Yıldırım and the reason that the cartograms
are not very different from each other is because both candidates do not get their votes from
a certain region and they are not stuck in certain districts and neighborhoods. Therefore,
their votes are distributed in the same proportions as all Istanbul voters.
KONDA JUNE’19 BAROMETER BALLOT BOX ANALYSIS OF THE 23 JUNE ISTANBUL ELECTION 33 / 71
23 June 2019 – Distribution of votes Of Ekrem İmamoğlu
Cartogram formed according to total number of voters
23 June 2019 – Distribution of votes of Ekrem İmamoğlu
Cartogram formed according to the vote number of İmamoğlu
KONDA JUNE’19 BAROMETER BALLOT BOX ANALYSIS OF THE 23 JUNE ISTANBUL ELECTION 34 / 71
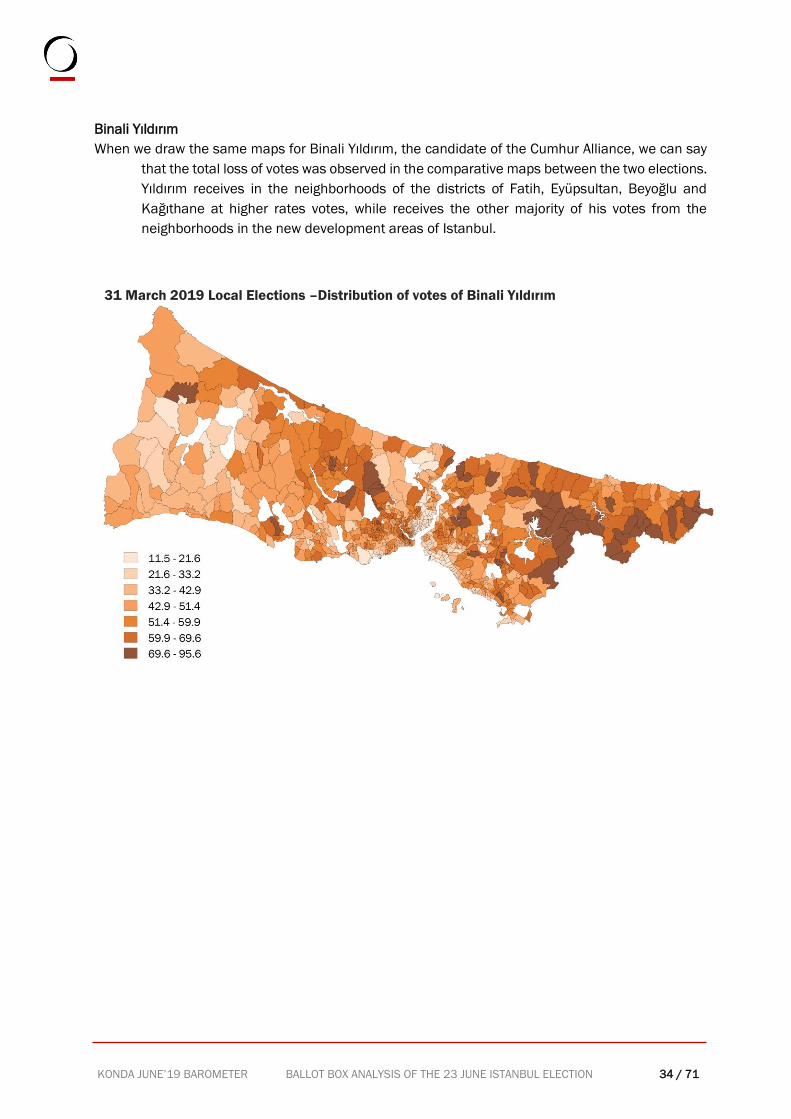
Binali Yıldırım
When we draw the same maps for Binali Yıldırım, the candidate of the Cumhur Alliance, we can say
that the total loss of votes was observed in the comparative maps between the two elections.
Yıldırım receives in the neighborhoods of the districts of Fatih, Eyüpsultan, Beyoğlu and
Kağıthane at higher rates votes, while receives the other majority of his votes from the
neighborhoods in the new development areas of Istanbul.
31 March 2019 Local Elections –Distribution of votes of Binali Yıldırım
KONDA JUNE’19 BAROMETER BALLOT BOX ANALYSIS OF THE 23 JUNE ISTANBUL ELECTION 35 / 71
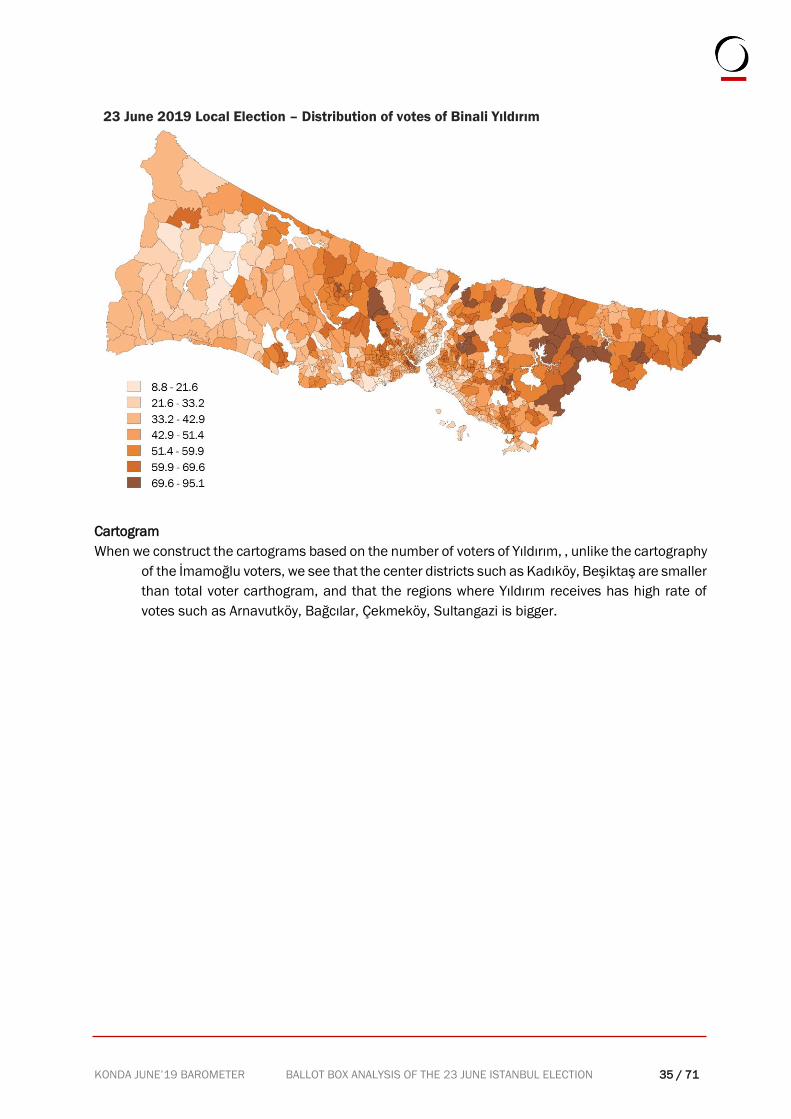
Cartogram
When we construct the cartograms based on the number of voters of Yıldırım, , unlike the cartography
of the İmamoğlu voters, we see that the center districts such as Kadıköy, Beşiktaş are smaller
than total voter carthogram, and that the regions where Yıldırım receives has high rate of
votes such as Arnavutköy, Bağcılar, Çekmeköy, Sultangazi is bigger.
23 June 2019 Local Election – Distribution of votes of Binali Yıldırım
KONDA JUNE’19 BAROMETER BALLOT BOX ANALYSIS OF THE 23 JUNE ISTANBUL ELECTION 36 / 71
23 June 2019 – Distribution of votes for Binali Yıldırım
Cartogram formed according to the total number of voters
Cartogram formed according to the vote number of Yıldırım
KONDA JUNE’19 BAROMETER BALLOT BOX ANALYSIS OF THE 23 JUNE ISTANBUL ELECTION 37 / 71
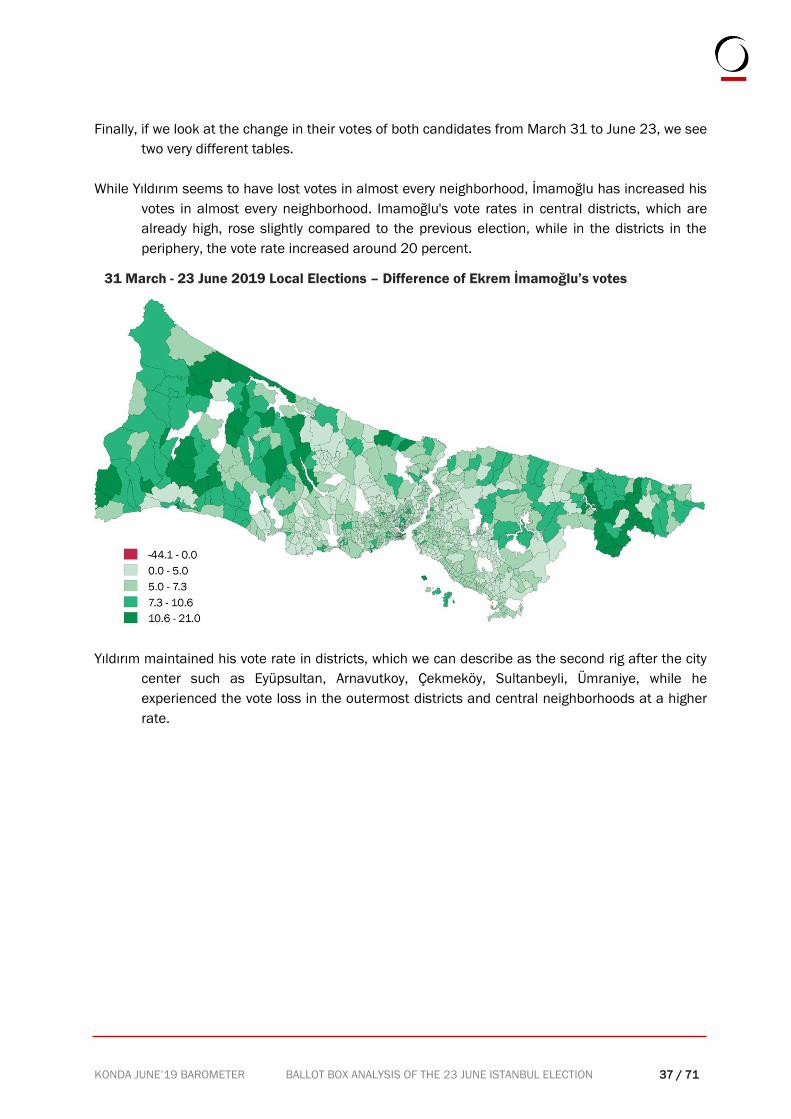
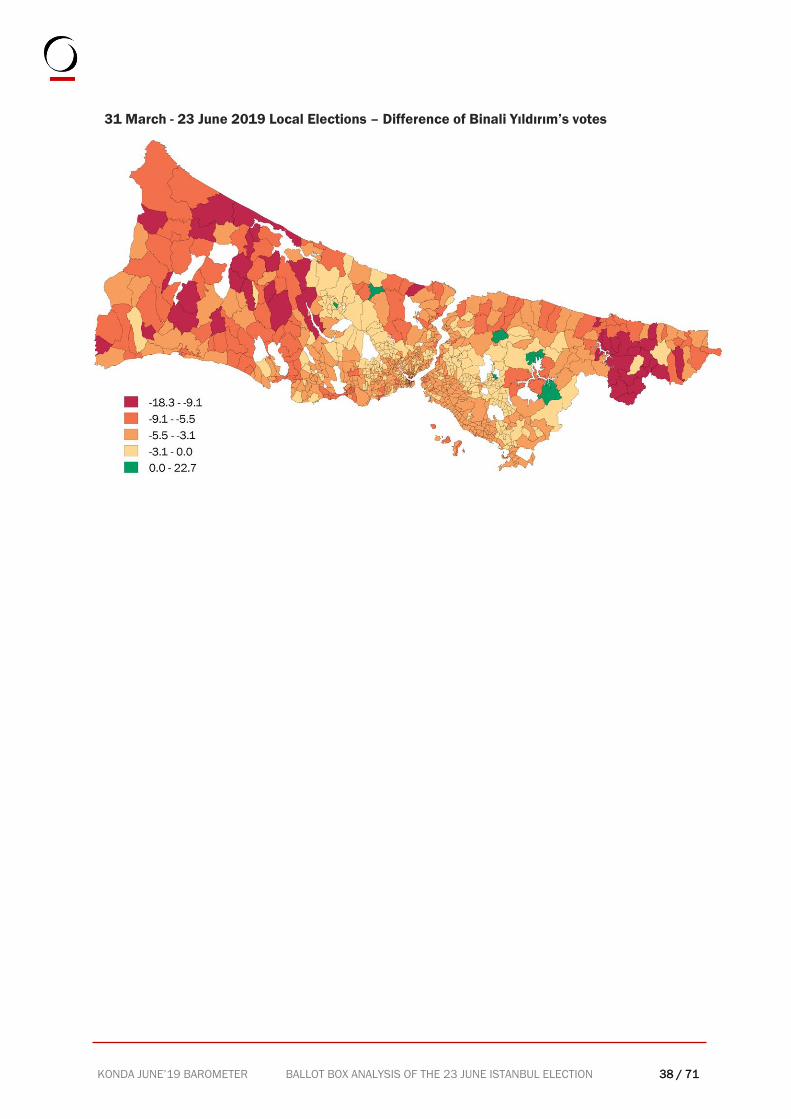
Finally, if we look at the change in their votes of both candidates from March 31 to June 23, we see
two very different tables.
While Yıldırım seems to have lost votes in almost every neighborhood, İmamoğlu has increased his
votes in almost every neighborhood. Imamoğlu's vote rates in central districts, which are
already high, rose slightly compared to the previous election, while in the districts in the
periphery, the vote rate increased around 20 percent.
Yıldırım maintained his vote rate in districts, which we can describe as the second rig after the city
center such as Eyüpsultan, Arnavutkoy, Çekmeköy, Sultanbeyli, Ümraniye, while he
experienced the vote loss in the outermost districts and central neighborhoods at a higher
rate.
31 March - 23 June 2019 Local Elections – Difference of Ekrem İmamoğlu’s votes
KONDA JUNE’19 BAROMETER BALLOT BOX ANALYSIS OF THE 23 JUNE ISTANBUL ELECTION 38 / 71
31 March - 23 June 2019 Local Elections – Difference of Binali Yıldırım’s votes
KONDA JUNE’19 BAROMETER BALLOT BOX ANALYSIS OF THE 23 JUNE ISTANBUL ELECTION 39 / 71
3. 23 JUNE VOTER PROFILES
We tried to present a voter profile based on the data that corresponds to the poll results of the
Istanbul-specific Barometer survey we conducted one week before the Istanbul Metropolitan
Municipality elections on 23 June. During and after the election process, it was evaluated on
the basis of estimation, from which clusters Imamoglu and Yıldırım received votes, or which
candidate increased its vote in which cluster. However, by looking at the data of the 3
different surveys we conducted prior to 23 June, we tried to examine how the candidates'
vote in different clusters have changed and whether the voter profiles have changed in time.
These surveys were conducted on January 19-20, when the candidates were certain yet, on
23-24 March, one week before the 31st March elections, and on 15-16 June one week before
the June 23rd election.
However, we will conduct this analysis of voter profiles based on general political preferences for the
first time. Based on the question ‘Who would you vote for if there were a GENERAL Election
today?’ we tried to reveal the relationship between the preferences for the IBB (Istanbul
Metropolitan Municipality) candidate and party preferences.
KONDA JUNE’19 BAROMETER BALLOT BOX ANALYSIS OF THE 23 JUNE ISTANBUL ELECTION 40 / 71
3.1. Change in Preferences in Istanbul Based on Political Preferences
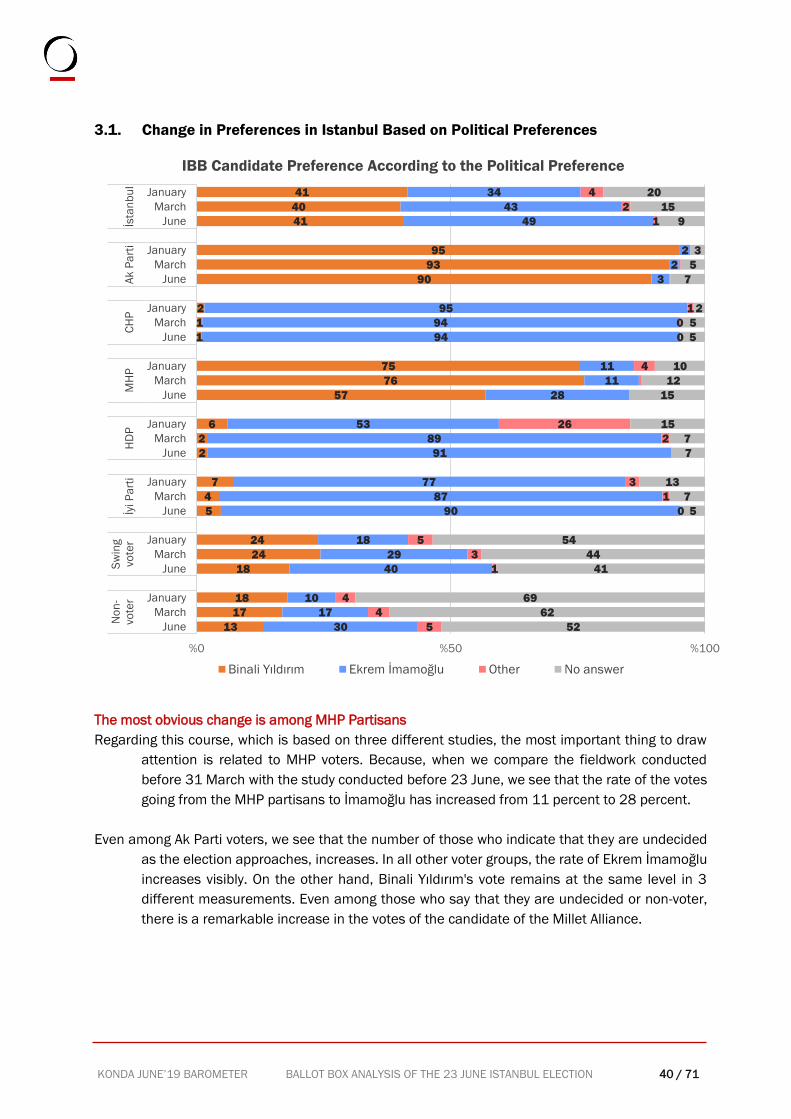
The most obvious change is among MHP Partisans
Regarding this course, which is based on three different studies, the most important thing to draw
attention is related to MHP voters. Because, when we compare the fieldwork conducted
before 31 March with the study conducted before 23 June, we see that the rate of the votes
going from the MHP partisans to İmamoğlu has increased from 11 percent to 28 percent.
Even among Ak Parti voters, we see that the number of those who indicate that they are undecided
as the election approaches, increases. In all other voter groups, the rate of Ekrem İmamoğlu
increases visibly. On the other hand, Binali Yıldırım's vote remains at the same level in 3
different measurements. Even among those who say that they are undecided or non-voter,
there is a remarkable increase in the votes of the candidate of the Millet Alliance.
13
17
18
18
24
24
5
4
7
2
2
6
57
76
75
1
1
2
90
93
95
41
40
41
30
17
10
40
29
18
90
87
77
91
89
53
28
11
11
94
94
95
3
2
2
49
43
34
5
4
4
1
3
5
0
1
3
2
26
4
0
0
1
1
2
4
52
62
69
41
44
54
5
7
13
7
7
15
15
12
10
5
5
2
7
5
3
9
15
20
%0 %50 %100
June
March
January
June
March
January
June
March
January
June
March
January
June
March
January
June
March
January
June
March
January
June
March
January
No
n-
vo
ter
Sw
ing
vo
ter
İyi P
art
iH
DP
MH
PC
HP
Ak
Pa
rti
İsta
nb
ul
IBB Candidate Preference According to the Political Preference
Binali Yıldırım Ekrem İmamoğlu Other No answer
KONDA JUNE’19 BAROMETER BALLOT BOX ANALYSIS OF THE 23 JUNE ISTANBUL ELECTION 41 / 71
The difference of HDP voters between January and March reveals a very striking picture. Before the
decision to support Imamoğlu, only 53 percent supported him, while this rate has increased
to 90 percent in the survey.
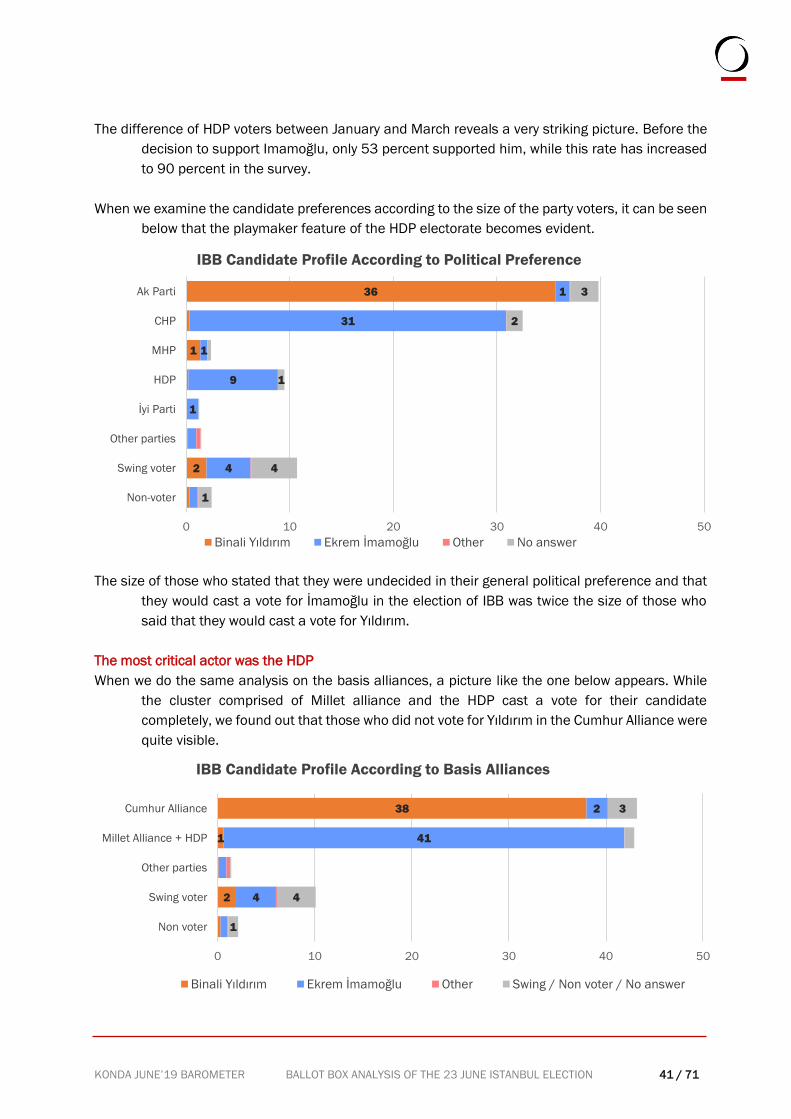
When we examine the candidate preferences according to the size of the party voters, it can be seen
below that the playmaker feature of the HDP electorate becomes evident.
The size of those who stated that they were undecided in their general political preference and that
they would cast a vote for İmamoğlu in the election of IBB was twice the size of those who
said that they would cast a vote for Yıldırım.
The most critical actor was the HDP
When we do the same analysis on the basis alliances, a picture like the one below appears. While
the cluster comprised of Millet alliance and the HDP cast a vote for their candidate
completely, we found out that those who did not vote for Yıldırım in the Cumhur Alliance were
quite visible.
2
1
36
4
1
9
1
31
1
1
4
1
2
3
0 10 20 30 40 50
Non-voter
Swing voter
Other parties
İyi Parti
HDP
MHP
CHP
Ak Parti
IBB Candidate Profile According to Political Preference
Binali Yıldırım Ekrem İmamoğlu Other No answer
2
1
38
4
41
2
1
4
3
0 10 20 30 40 50
Non voter
Swing voter
Other parties
Millet Alliance + HDP
Cumhur Alliance
IBB Candidate Profile According to Basis Alliances
Binali Yıldırım Ekrem İmamoğlu Other Swing / Non voter / No answer
KONDA JUNE’19 BAROMETER BALLOT BOX ANALYSIS OF THE 23 JUNE ISTANBUL ELECTION 42 / 71
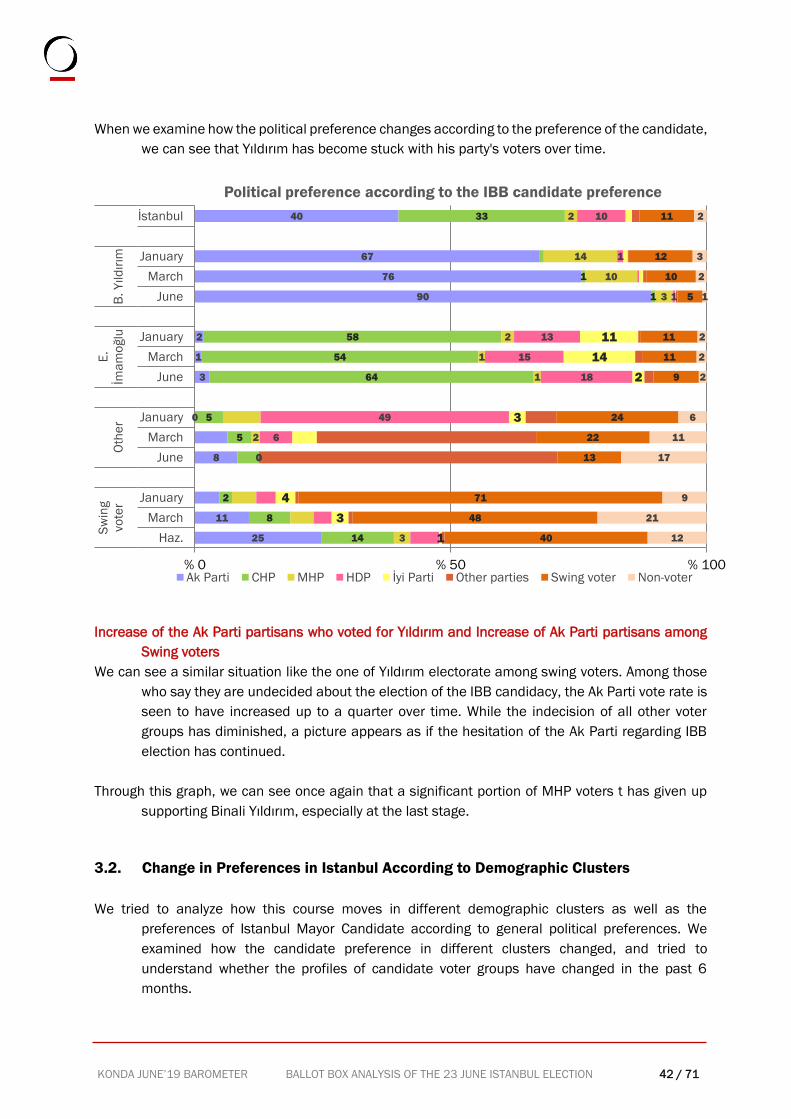
When we examine how the political preference changes according to the preference of the candidate,
we can see that Yıldırım has become stuck with his party's voters over time.
Increase of the Ak Parti partisans who voted for Yıldırım and Increase of Ak Parti partisans among
Swing voters
We can see a similar situation like the one of Yıldırım electorate among swing voters. Among those
who say they are undecided about the election of the IBB candidacy, the Ak Parti vote rate is
seen to have increased up to a quarter over time. While the indecision of all other voter
groups has diminished, a picture appears as if the hesitation of the Ak Parti regarding IBB
election has continued.
Through this graph, we can see once again that a significant portion of MHP voters t has given up
supporting Binali Yıldırım, especially at the last stage.
3.2. Change in Preferences in Istanbul According to Demographic Clusters
We tried to analyze how this course moves in different demographic clusters as well as the
preferences of Istanbul Mayor Candidate according to general political preferences. We
examined how the candidate preference in different clusters changed, and tried to
understand whether the profiles of candidate voter groups have changed in the past 6
months.
25
11
8
0
3
1
2
90
76
67
40
14
8
2
5
5
64
54
58
1
1
33
3
0
2
1
1
2
3
10
14
2
0
6
49
18
15
13
1
1
10
1
3
4
3
2
14
11
40
48
71
13
22
24
9
11
11
5
10
12
11
12
21
9
17
11
6
2
2
2
1
2
3
2
% 0 % 50 % 100
Haz.
March
January
June
March
January
June
March
January
June
March
January
İstanbul
Sw
ing
vo
ter
Oth
er
E.
İma
mo
ğlu
B.
Yıld
ırım
Political preference according to the IBB candidate preference
Ak Parti CHP MHP HDP İyi Parti Other parties Swing voter Non-voter
KONDA JUNE’19 BAROMETER BALLOT BOX ANALYSIS OF THE 23 JUNE ISTANBUL ELECTION 43 / 71
When we look at the different groups according to many different cleavages, it is necessary to point
out first the prevailing situation in general: Binali Yıldırım’s vote is not differentiated in the
three different studies in a significant part of the social clusters; however, we find that
İmamoğlu's vote has increased. In other words, Imamoglu did not only increase his votes in
certain clusters, but he put forth a widespread increase in general.
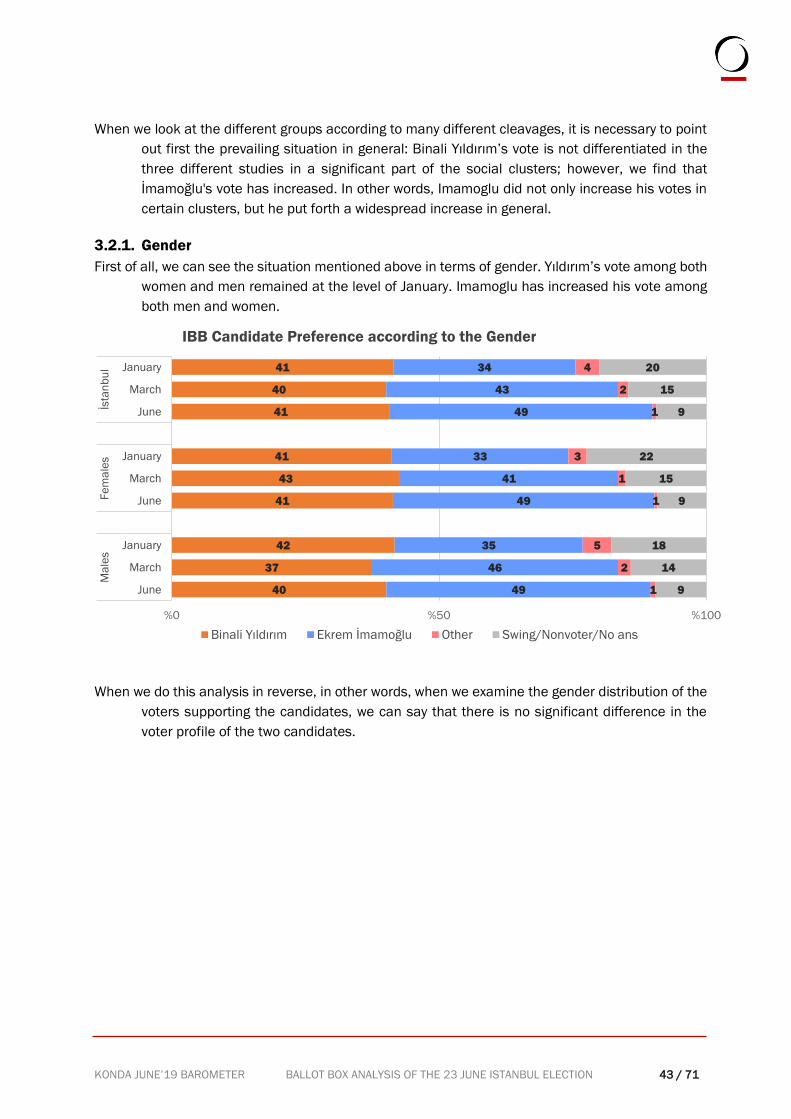
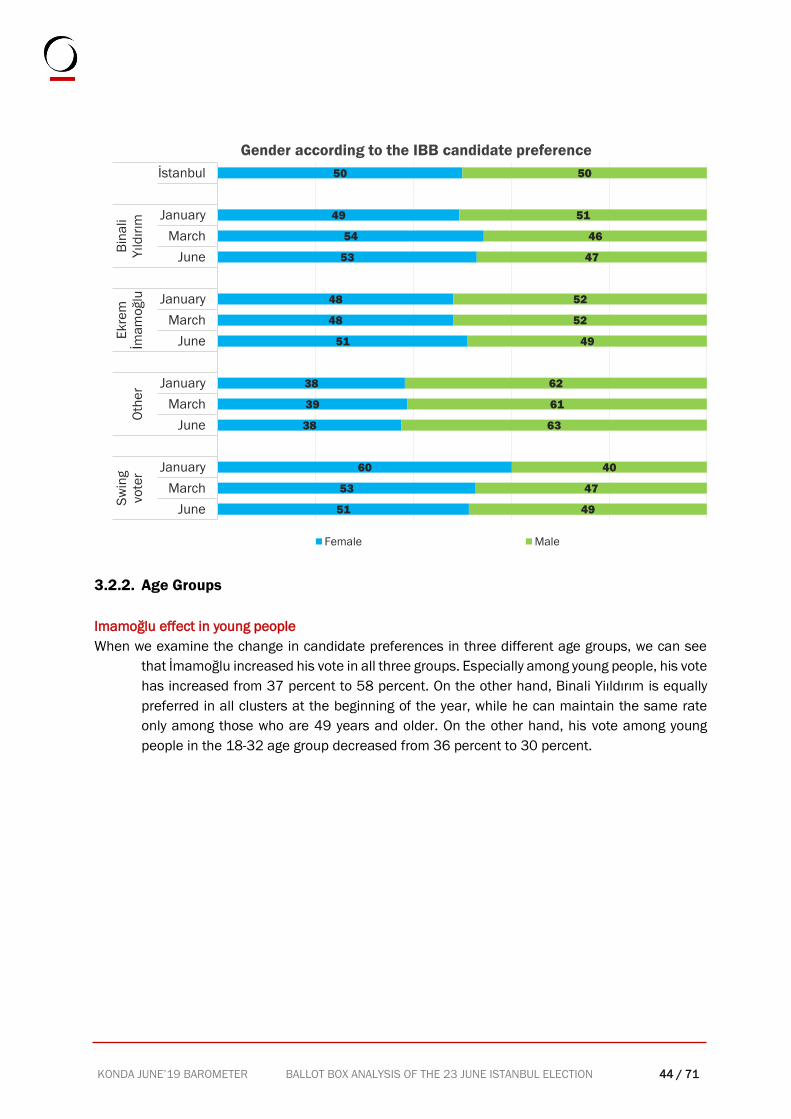
3.2.1. Gender
First of all, we can see the situation mentioned above in terms of gender. Yıldırım’s vote among both
women and men remained at the level of January. Imamoglu has increased his vote among
both men and women.
When we do this analysis in reverse, in other words, when we examine the gender distribution of the
voters supporting the candidates, we can say that there is no significant difference in the
voter profile of the two candidates.
40
37
42
41
43
41
41
40
41
49
46
35
49
41
33
49
43
34
1
2
5
1
1
3
1
2
4
9
14
18
9
15
22
9
15
20
%0 %50 %100
June
March
January
June
March
January
June
March
January
Ma
les
Fe
ma
les
İsta
nb
ul
IBB Candidate Preference according to the Gender
Binali Yıldırım Ekrem İmamoğlu Other Swing/Nonvoter/No ans
KONDA JUNE’19 BAROMETER BALLOT BOX ANALYSIS OF THE 23 JUNE ISTANBUL ELECTION 44 / 71
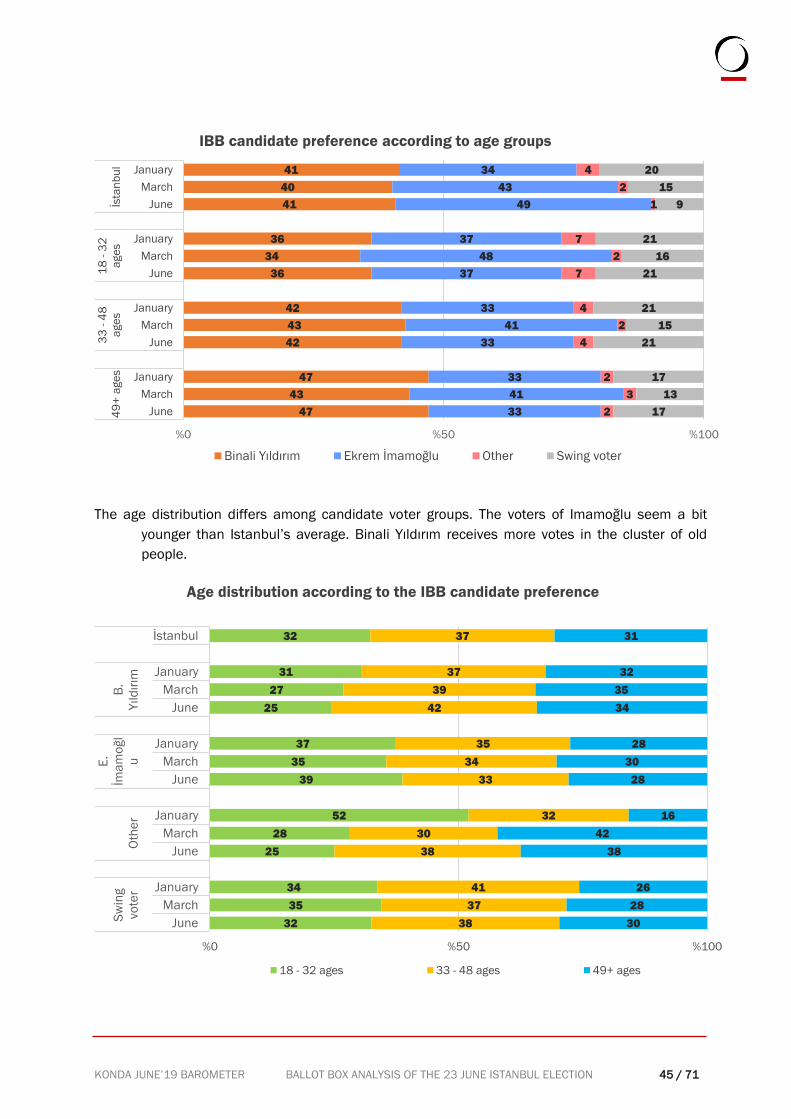
3.2.2. Age Groups
Imamoğlu effect in young people
When we examine the change in candidate preferences in three different age groups, we can see
that İmamoğlu increased his vote in all three groups. Especially among young people, his vote
has increased from 37 percent to 58 percent. On the other hand, Binali Yiıldırım is equally
preferred in all clusters at the beginning of the year, while he can maintain the same rate
only among those who are 49 years and older. On the other hand, his vote among young
people in the 18-32 age group decreased from 36 percent to 30 percent.
51
53
60
38
39
38
51
48
48
53
54
49
50
49
47
40
63
61
62
49
52
52
47
46
51
50
June
March
January
June
March
January
June
March
January
June
March
January
İstanbul
Sw
ing
vote
rO
the
r
Ekre
m
İma
mo
ğlu
Bin
ali
Yıld
ırım
Gender according to the IBB candidate preference
Female Male
KONDA JUNE’19 BAROMETER BALLOT BOX ANALYSIS OF THE 23 JUNE ISTANBUL ELECTION 45 / 71
The age distribution differs among candidate voter groups. The voters of Imamoğlu seem a bit
younger than Istanbul’s average. Binali Yıldırım receives more votes in the cluster of old
people.
47
43
47
42
43
42
36
34
36
41
40
41
33
41
33
33
41
33
37
48
37
49
43
34
2
3
2
4
2
4
7
2
7
1
2
4
17
13
17
21
15
21
21
16
21
9
15
20
%0 %50 %100
June
March
January
June
March
January
June
March
January
June
March
January
49
+ a
ge
s
33
- 4
8
age
s
18
- 3
2
age
sİs
tan
bu
l
IBB candidate preference according to age groups
Binali Yıldırım Ekrem İmamoğlu Other Swing voter
32
35
34
25
28
52
39
35
37
25
27
31
32
38
37
41
38
30
32
33
34
35
42
39
37
37
30
28
26
38
42
16
28
30
28
34
35
32
31
%0 %50 %100
June
March
January
June
March
January
June
March
January
June
March
January
İstanbul
Sw
ing
vo
ter
Oth
er
E.
İma
mo
ğl
u
B.
Yıld
ırım
Age distribution according to the IBB candidate preference
18 - 32 ages 33 - 48 ages 49+ ages
KONDA JUNE’19 BAROMETER BALLOT BOX ANALYSIS OF THE 23 JUNE ISTANBUL ELECTION 46 / 71
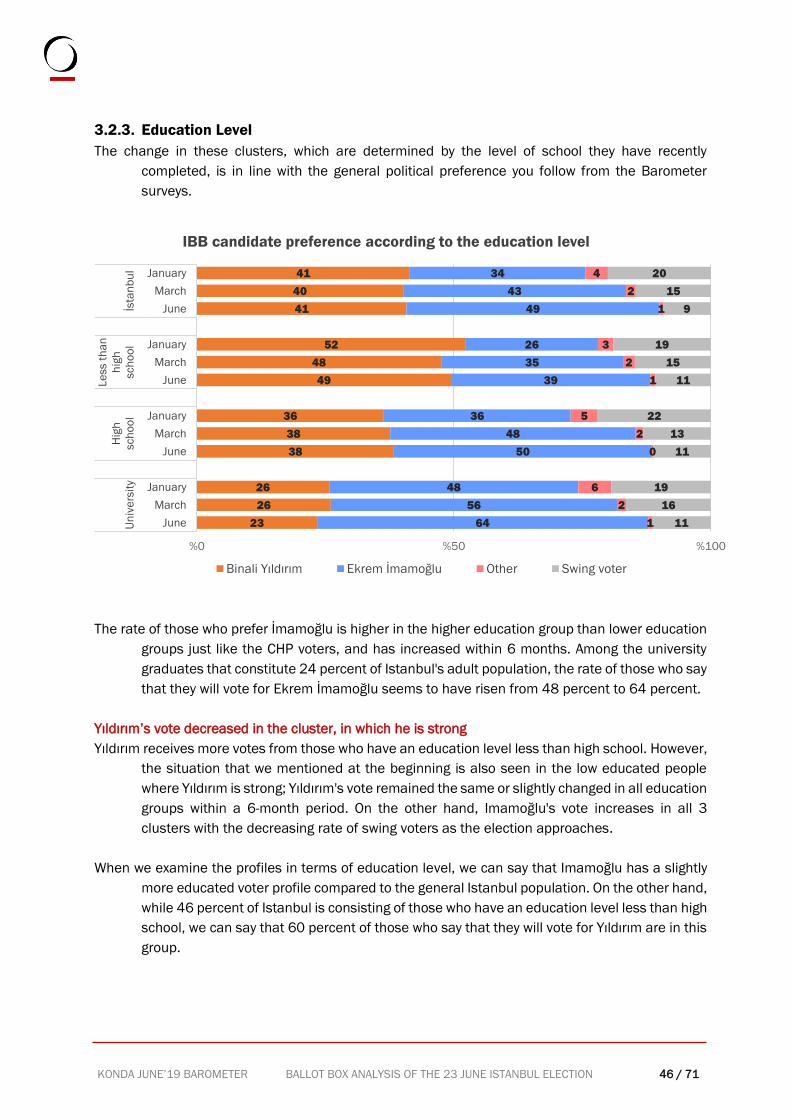
3.2.3. Education Level
The change in these clusters, which are determined by the level of school they have recently
completed, is in line with the general political preference you follow from the Barometer
surveys.
The rate of those who prefer İmamoğlu is higher in the higher education group than lower education
groups just like the CHP voters, and has increased within 6 months. Among the university
graduates that constitute 24 percent of Istanbul's adult population, the rate of those who say
that they will vote for Ekrem İmamoğlu seems to have risen from 48 percent to 64 percent.
Yıldırım’s vote decreased in the cluster, in which he is strong
Yıldırım receives more votes from those who have an education level less than high school. However,
the situation that we mentioned at the beginning is also seen in the low educated people
where Yıldırım is strong; Yıldırım's vote remained the same or slightly changed in all education
groups within a 6-month period. On the other hand, Imamoğlu's vote increases in all 3
clusters with the decreasing rate of swing voters as the election approaches.
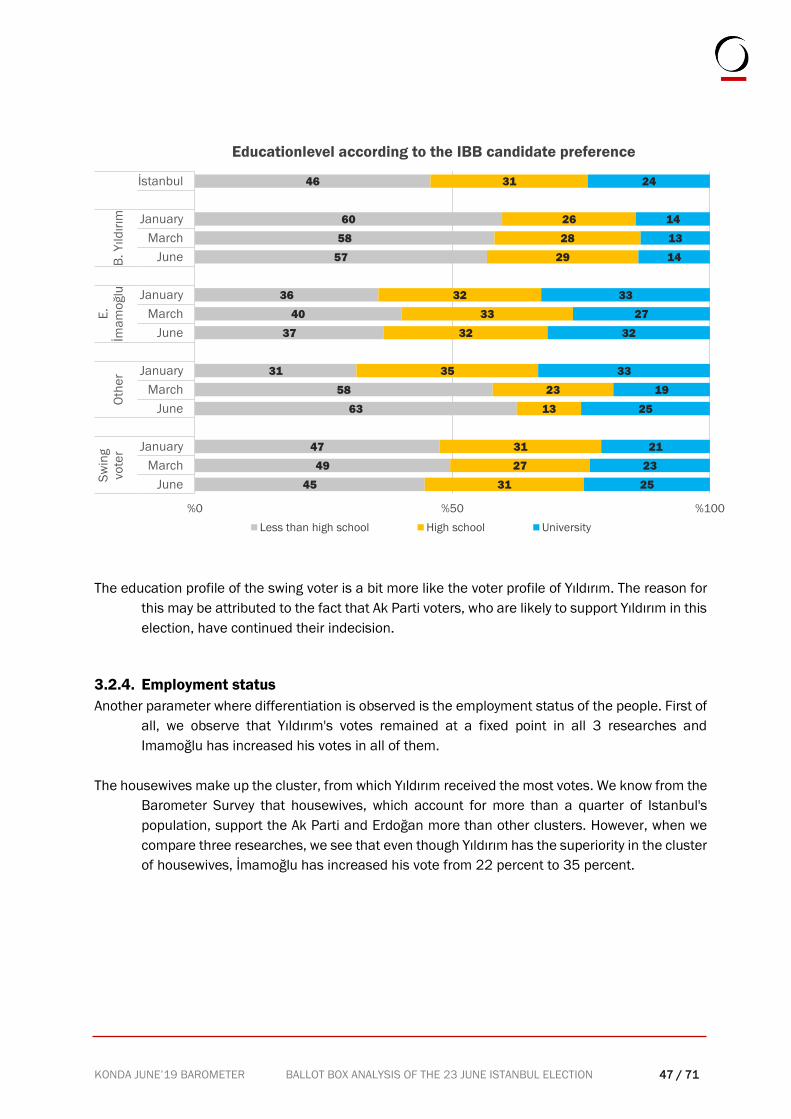
When we examine the profiles in terms of education level, we can say that Imamoğlu has a slightly
more educated voter profile compared to the general Istanbul population. On the other hand,
while 46 percent of Istanbul is consisting of those who have an education level less than high
school, we can say that 60 percent of those who say that they will vote for Yıldırım are in this
group.
23
26
26
38
38
36
49
48
52
41
40
41
64
56
48
50
48
36
39
35
26
49
43
34
1
2
6
0
2
5
1
2
3
1
2
4
11
16
19
11
13
22
11
15
19
9
15
20
%0 %50 %100
June
March
January
June
March
January
June
March
January
June
March
January
Un
ive
rsit
y
Hig
h
sch
oo
l
Le
ss t
ha
n
hig
h
sch
oo
lİs
tan
bu
l
IBB candidate preference according to the education level
Binali Yıldırım Ekrem İmamoğlu Other Swing voter
KONDA JUNE’19 BAROMETER BALLOT BOX ANALYSIS OF THE 23 JUNE ISTANBUL ELECTION 47 / 71
The education profile of the swing voter is a bit more like the voter profile of Yıldırım. The reason for
this may be attributed to the fact that Ak Parti voters, who are likely to support Yıldırım in this
election, have continued their indecision.
3.2.4. Employment status
Another parameter where differentiation is observed is the employment status of the people. First of
all, we observe that Yıldırım's votes remained at a fixed point in all 3 researches and
Imamoğlu has increased his votes in all of them.
The housewives make up the cluster, from which Yıldırım received the most votes. We know from the
Barometer Survey that housewives, which account for more than a quarter of Istanbul's
population, support the Ak Parti and Erdoğan more than other clusters. However, when we
compare three researches, we see that even though Yıldırım has the superiority in the cluster
of housewives, İmamoğlu has increased his vote from 22 percent to 35 percent.
45
49
47
63
58
31
37
40
36
57
58
60
46
31
27
31
13
23
35
32
33
32
29
28
26
31
25
23
21
25
19
33
32
27
33
14
13
14
24
%0 %50 %100
June
March
January
June
March
January
June
March
January
June
March
January
İstanbul
Sw
ing
vo
ter
Oth
er
E.
İma
mo
ğlu
B.
Yıld
ırım
Educationlevel according to the IBB candidate preference
Less than high school High school University
KONDA JUNE’19 BAROMETER BALLOT BOX ANALYSIS OF THE 23 JUNE ISTANBUL ELECTION 48 / 71
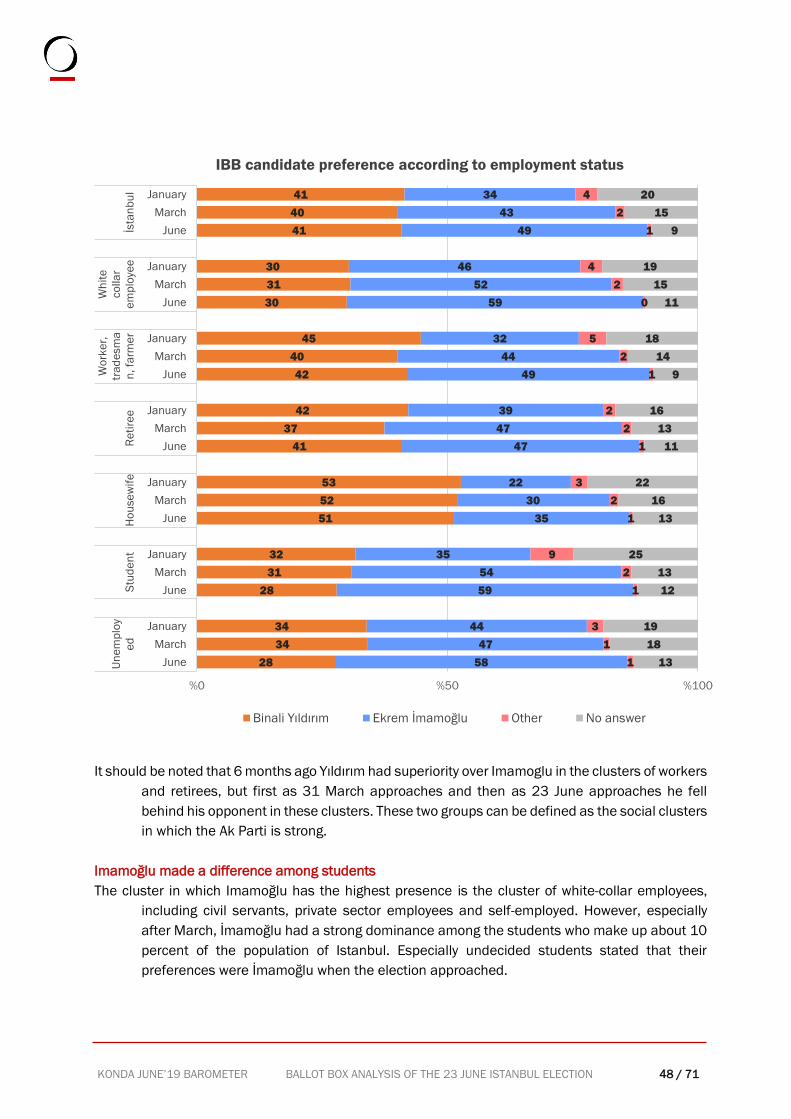
It should be noted that 6 months ago Yıldırım had superiority over Imamoglu in the clusters of workers
and retirees, but first as 31 March approaches and then as 23 June approaches he fell
behind his opponent in these clusters. These two groups can be defined as the social clusters
in which the Ak Parti is strong.
Imamoğlu made a difference among students
The cluster in which Imamoğlu has the highest presence is the cluster of white-collar employees,
including civil servants, private sector employees and self-employed. However, especially
after March, İmamoğlu had a strong dominance among the students who make up about 10
percent of the population of Istanbul. Especially undecided students stated that their
preferences were İmamoğlu when the election approached.
28
34
34
28
31
32
51
52
53
41
37
42
42
40
45
30
31
30
41
40
41
58
47
44
59
54
35
35
30
22
47
47
39
49
44
32
59
52
46
49
43
34
1
1
3
1
2
9
1
2
3
1
2
2
1
2
5
0
2
4
1
2
4
13
18
19
12
13
25
13
16
22
11
13
16
9
14
18
11
15
19
9
15
20
%0 %50 %100
June
March
January
June
March
January
June
March
January
June
March
January
June
March
January
June
March
January
June
March
January
Un
em
plo
y
ed
Stu
de
nt
Ho
use
wif
eR
eti
ree
Wo
rke
r,
tra
de
sm
a
n, fa
rme
r
Wh
ite
co
lla
r
em
plo
yee
İsta
nb
ul
IBB candidate preference according to employment status
Binali Yıldırım Ekrem İmamoğlu Other No answer
KONDA JUNE’19 BAROMETER BALLOT BOX ANALYSIS OF THE 23 JUNE ISTANBUL ELECTION 49 / 71
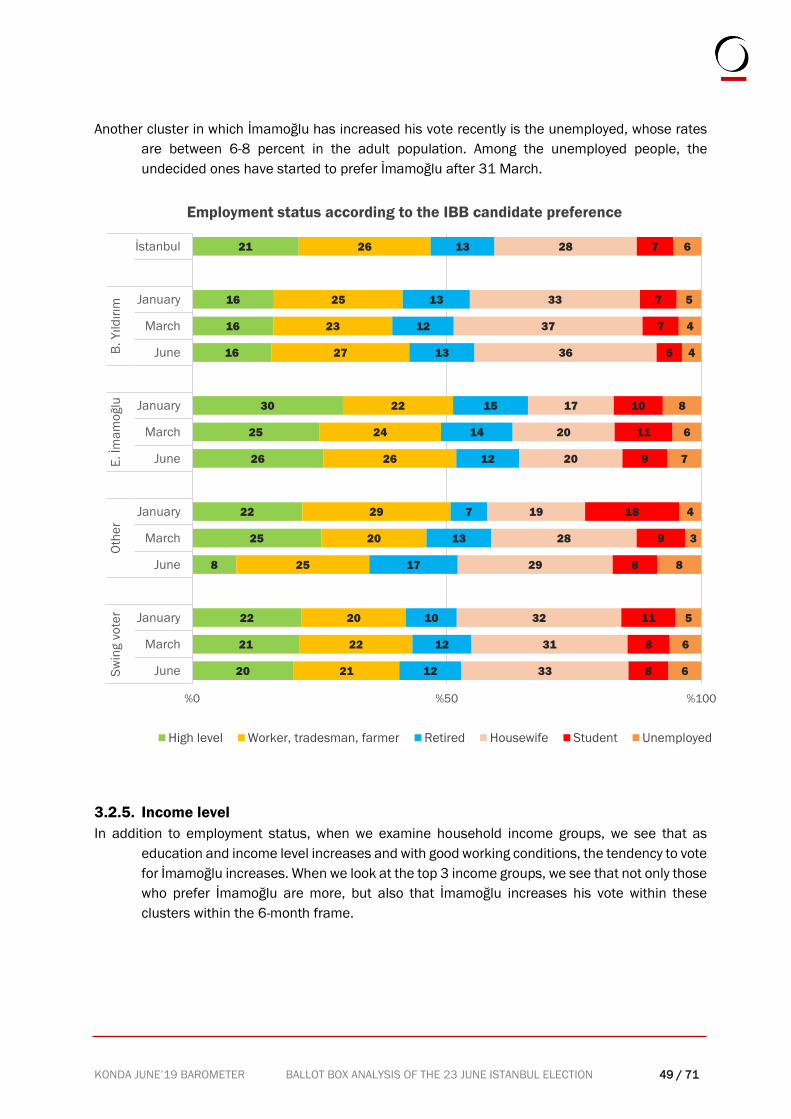
Another cluster in which İmamoğlu has increased his vote recently is the unemployed, whose rates
are between 6-8 percent in the adult population. Among the unemployed people, the
undecided ones have started to prefer İmamoğlu after 31 March.
3.2.5. Income level
In addition to employment status, when we examine household income groups, we see that as
education and income level increases and with good working conditions, the tendency to vote
for İmamoğlu increases. When we look at the top 3 income groups, we see that not only those
who prefer İmamoğlu are more, but also that İmamoğlu increases his vote within these
clusters within the 6-month frame.
20
21
22
8
25
22
26
25
30
16
16
16
21
21
22
20
25
20
29
26
24
22
27
23
25
26
12
12
10
17
13
7
12
14
15
13
12
13
13
33
31
32
29
28
19
20
20
17
36
37
33
28
8
8
11
8
9
18
9
11
10
5
7
7
7
6
6
5
8
3
4
7
6
8
4
4
5
6
%0 %50 %100
June
March
January
June
March
January
June
March
January
June
March
January
İstanbul
Sw
ing v
ote
rO
the
rE
. İm
am
oğlu
B.
Yıld
ırım
Employment status according to the IBB candidate preference
High level Worker, tradesman, farmer Retired Housewife Student Unemployed
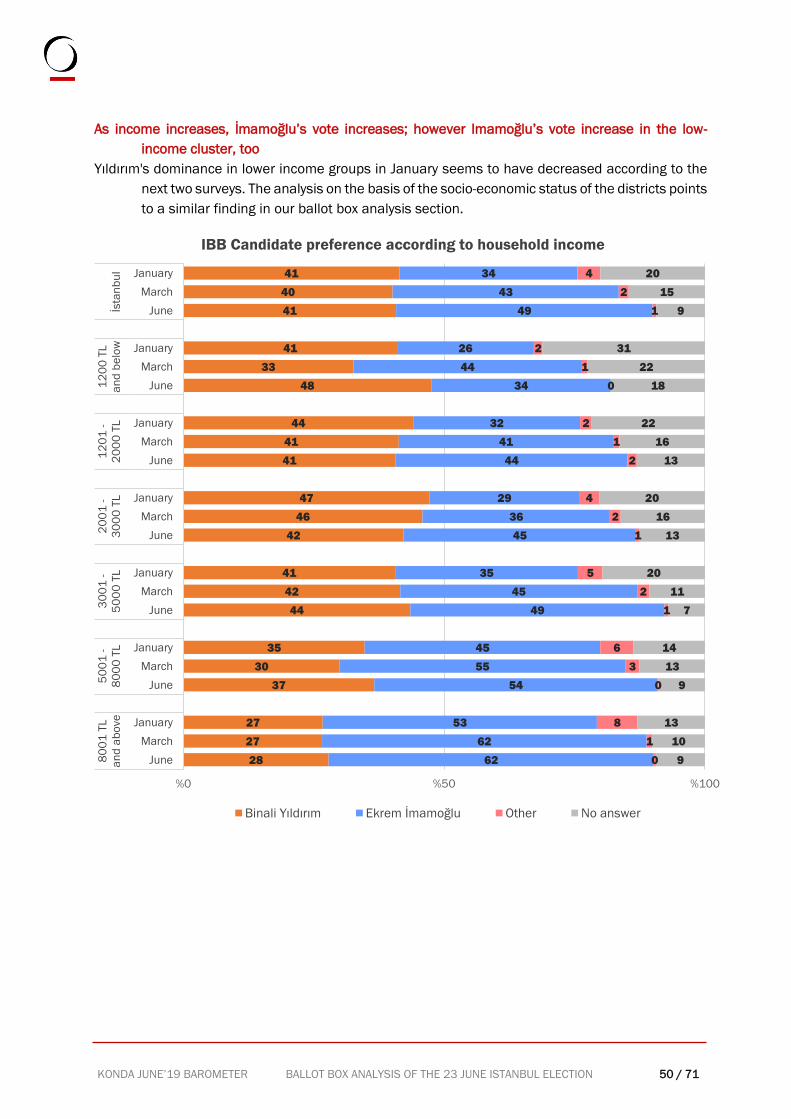
KONDA JUNE’19 BAROMETER BALLOT BOX ANALYSIS OF THE 23 JUNE ISTANBUL ELECTION 50 / 71
As income increases, İmamoğlu’s vote increases; however Imamoğlu’s vote increase in the low-
income cluster, too
Yıldırım's dominance in lower income groups in January seems to have decreased according to the
next two surveys. The analysis on the basis of the socio-economic status of the districts points
to a similar finding in our ballot box analysis section.
28
27
27
37
30
35
44
42
41
42
46
47
41
41
44
48
33
41
41
40
41
62
62
53
54
55
45
49
45
35
45
36
29
44
41
32
34
44
26
49
43
34
0
1
8
0
3
6
1
2
5
1
2
4
2
1
2
0
1
2
1
2
4
9
10
13
9
13
14
7
11
20
13
16
20
13
16
22
18
22
31
9
15
20
%0 %50 %100
June
March
January
June
March
January
June
March
January
June
March
January
June
March
January
June
March
January
June
March
January
80
01
TL
an
d a
bo
ve
50
01
-
80
00
TL
30
01
-
50
00
TL
20
01
-
30
00
TL
12
01
-
20
00
TL
12
00
TL
an
d b
elo
wİs
tan
bu
l
IBB Candidate preference according to household income
Binali Yıldırım Ekrem İmamoğlu Other No answer
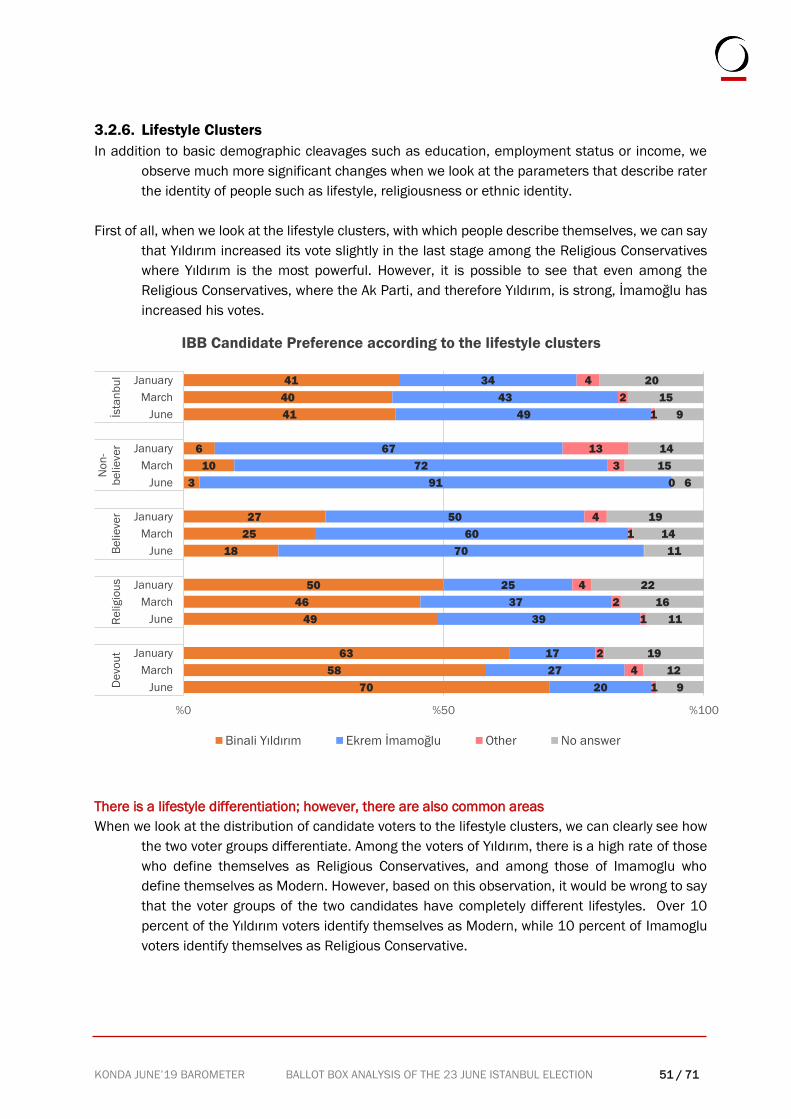
KONDA JUNE’19 BAROMETER BALLOT BOX ANALYSIS OF THE 23 JUNE ISTANBUL ELECTION 51 / 71
3.2.6. Lifestyle Clusters
In addition to basic demographic cleavages such as education, employment status or income, we
observe much more significant changes when we look at the parameters that describe rater
the identity of people such as lifestyle, religiousness or ethnic identity.
First of all, when we look at the lifestyle clusters, with which people describe themselves, we can say
that Yıldırım increased its vote slightly in the last stage among the Religious Conservatives
where Yıldırım is the most powerful. However, it is possible to see that even among the
Religious Conservatives, where the Ak Parti, and therefore Yıldırım, is strong, İmamoğlu has
increased his votes.
There is a lifestyle differentiation; however, there are also common areas
When we look at the distribution of candidate voters to the lifestyle clusters, we can clearly see how
the two voter groups differentiate. Among the voters of Yıldırım, there is a high rate of those
who define themselves as Religious Conservatives, and among those of Imamoglu who
define themselves as Modern. However, based on this observation, it would be wrong to say
that the voter groups of the two candidates have completely different lifestyles. Over 10
percent of the Yıldırım voters identify themselves as Modern, while 10 percent of Imamoglu
voters identify themselves as Religious Conservative.
70
58
63
49
46
50
18
25
27
3
10
6
41
40
41
20
27
17
39
37
25
70
60
50
91
72
67
49
43
34
1
4
2
1
2
4
1
4
0
3
13
1
2
4
9
12
19
11
16
22
11
14
19
6
15
14
9
15
20
%0 %50 %100
June
March
January
June
March
January
June
March
January
June
March
January
June
March
January
De
vou
tR
eligio
us
Be
lie
ve
r
No
n-
be
lie
ve
rİs
tan
bu
l
IBB Candidate Preference according to the lifestyle clusters
Binali Yıldırım Ekrem İmamoğlu Other No answer
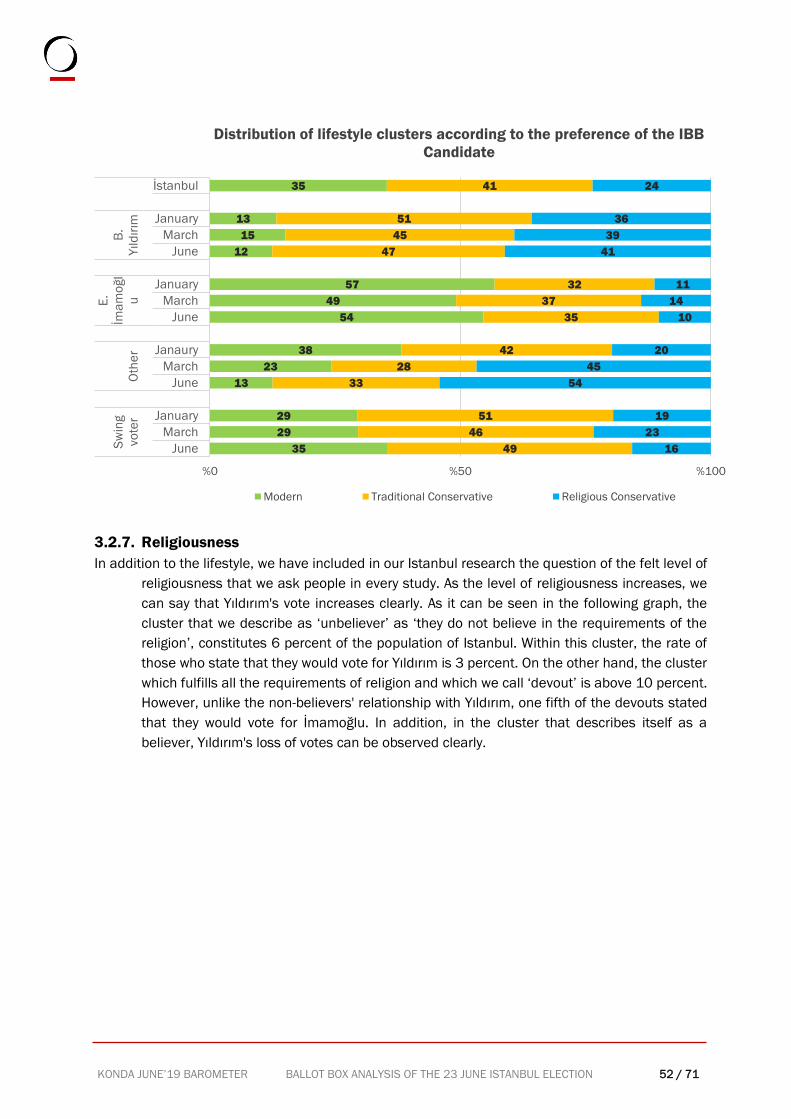
KONDA JUNE’19 BAROMETER BALLOT BOX ANALYSIS OF THE 23 JUNE ISTANBUL ELECTION 52 / 71
3.2.7. Religiousness
In addition to the lifestyle, we have included in our Istanbul research the question of the felt level of
religiousness that we ask people in every study. As the level of religiousness increases, we
can say that Yıldırım's vote increases clearly. As it can be seen in the following graph, the
cluster that we describe as ‘unbeliever’ as ‘they do not believe in the requirements of the
religion’, constitutes 6 percent of the population of Istanbul. Within this cluster, the rate of
those who state that they would vote for Yıldırım is 3 percent. On the other hand, the cluster
which fulfills all the requirements of religion and which we call ‘devout’ is above 10 percent.
However, unlike the non-believers' relationship with Yıldırım, one fifth of the devouts stated
that they would vote for İmamoğlu. In addition, in the cluster that describes itself as a
believer, Yıldırım's loss of votes can be observed clearly.
35
29
29
13
23
38
54
49
57
12
15
13
35
49
46
51
33
28
42
35
37
32
47
45
51
41
16
23
19
54
45
20
10
14
11
41
39
36
24
%0 %50 %100
June
March
January
June
March
Janaury
June
March
January
June
March
January
İstanbul
Sw
ing
vo
ter
Oth
er
E.
İma
mo
ğl
u
B.
Yıld
ırım
Distribution of lifestyle clusters according to the preference of the IBB
Candidate
Modern Traditional Conservative Religious Conservative
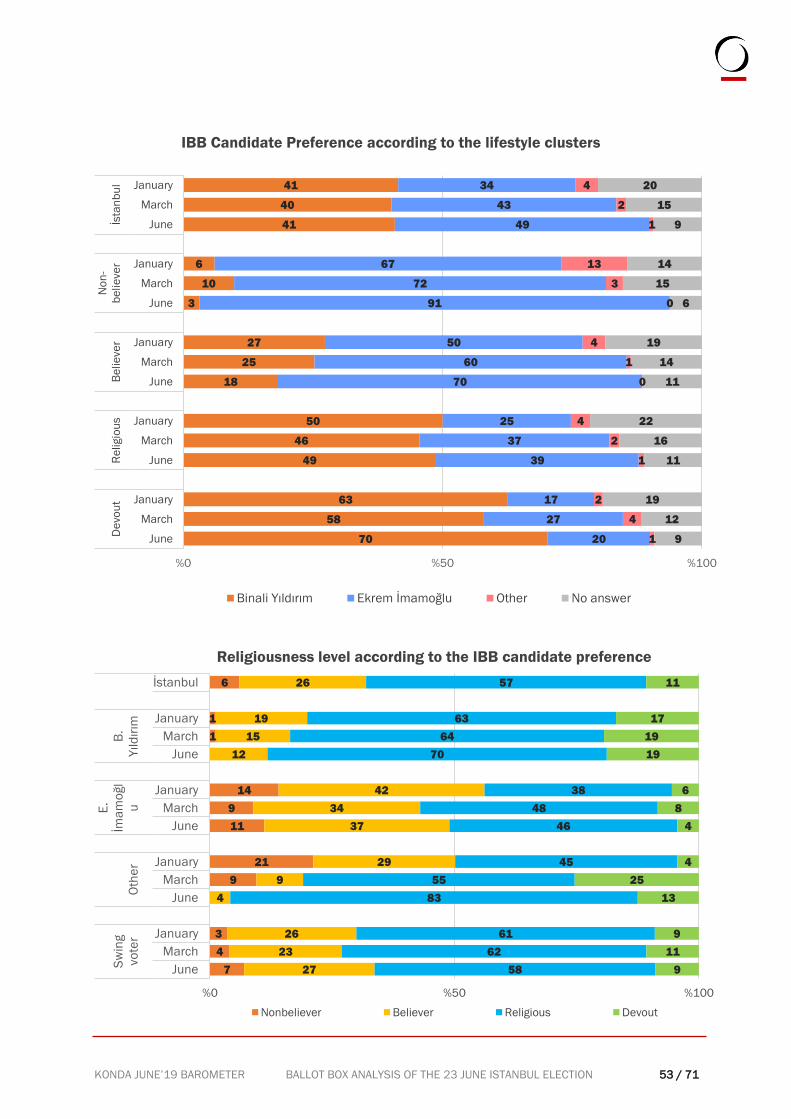
KONDA JUNE’19 BAROMETER BALLOT BOX ANALYSIS OF THE 23 JUNE ISTANBUL ELECTION 53 / 71
70
58
63
49
46
50
18
25
27
3
10
6
41
40
41
20
27
17
39
37
25
70
60
50
91
72
67
49
43
34
1
4
2
1
2
4
0
1
4
0
3
13
1
2
4
9
12
19
11
16
22
11
14
19
6
15
14
9
15
20
%0 %50 %100
June
March
January
June
March
January
June
March
January
June
March
January
June
March
January
De
vou
tR
eligio
us
Be
lie
ve
r
No
n-
be
lie
ve
rİs
tan
bu
l
IBB Candidate Preference according to the lifestyle clusters
Binali Yıldırım Ekrem İmamoğlu Other No answer
7
4
3
9
21
11
9
14
1
1
6
27
23
26
4
9
29
37
34
42
12
15
19
26
58
62
61
83
55
45
46
48
38
70
64
63
57
9
11
9
13
25
4
4
8
6
19
19
17
11
%0 %50 %100
June
March
January
June
March
January
June
March
January
June
March
January
İstanbul
Sw
ing
vo
ter
Oth
er
E.
İma
mo
ğl
u
B.
Yıld
ırım
Religiousness level according to the IBB candidate preference
Nonbeliever Believer Religious Devout
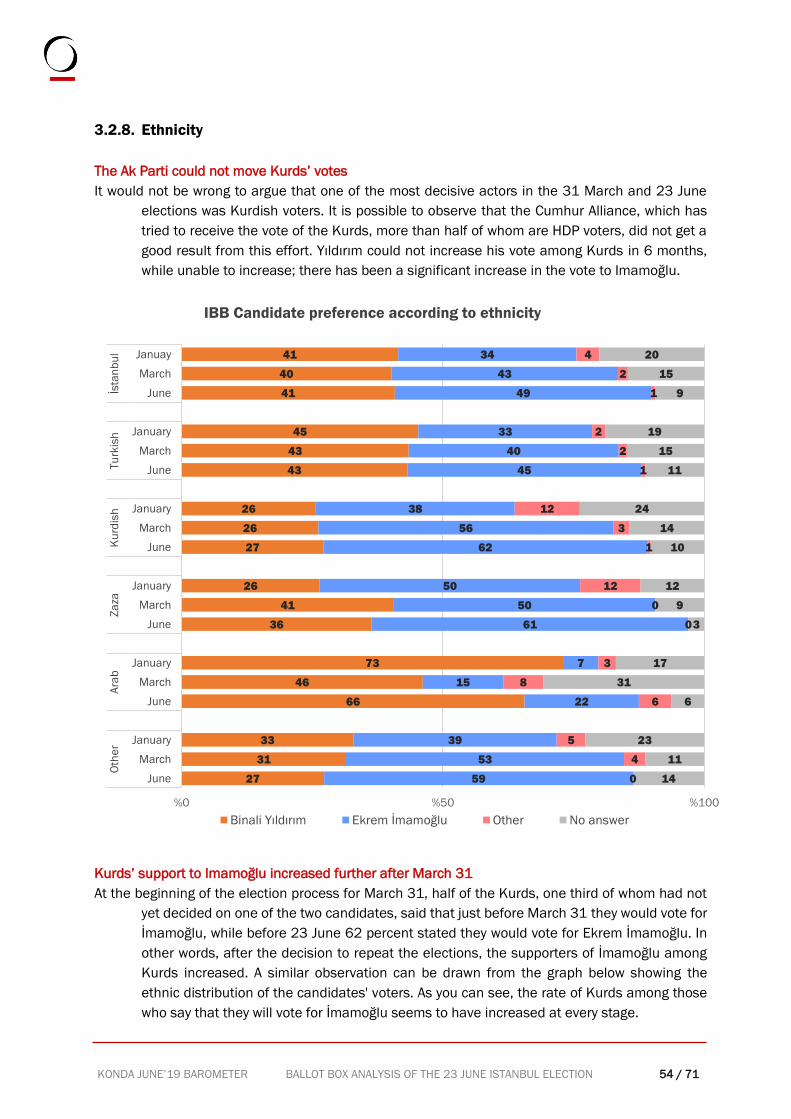
KONDA JUNE’19 BAROMETER BALLOT BOX ANALYSIS OF THE 23 JUNE ISTANBUL ELECTION 54 / 71
3.2.8. Ethnicity
The Ak Parti could not move Kurds’ votes
It would not be wrong to argue that one of the most decisive actors in the 31 March and 23 June
elections was Kurdish voters. It is possible to observe that the Cumhur Alliance, which has
tried to receive the vote of the Kurds, more than half of whom are HDP voters, did not get a
good result from this effort. Yıldırım could not increase his vote among Kurds in 6 months,
while unable to increase; there has been a significant increase in the vote to Imamoğlu.
Kurds’ support to Imamoğlu increased further after March 31
At the beginning of the election process for March 31, half of the Kurds, one third of whom had not
yet decided on one of the two candidates, said that just before March 31 they would vote for
İmamoğlu, while before 23 June 62 percent stated they would vote for Ekrem İmamoğlu. In
other words, after the decision to repeat the elections, the supporters of İmamoğlu among
Kurds increased. A similar observation can be drawn from the graph below showing the
ethnic distribution of the candidates' voters. As you can see, the rate of Kurds among those
who say that they will vote for İmamoğlu seems to have increased at every stage.
27
31
33
66
46
73
36
41
26
27
26
26
43
43
45
41
40
41
59
53
39
22
15
7
61
50
50
62
56
38
45
40
33
49
43
34
0
4
5
6
8
3
0
0
12
1
3
12
1
2
2
1
2
4
14
11
23
6
31
17
3
9
12
10
14
24
11
15
19
9
15
20
%0 %50 %100
June
March
January
June
March
January
June
March
January
June
March
January
June
March
January
June
March
Januay
Oth
er
Ara
bZ
aza
Ku
rdis
hTu
rkis
hİs
tan
bu
l
IBB Candidate preference according to ethnicity
Binali Yıldırım Ekrem İmamoğlu Other No answer
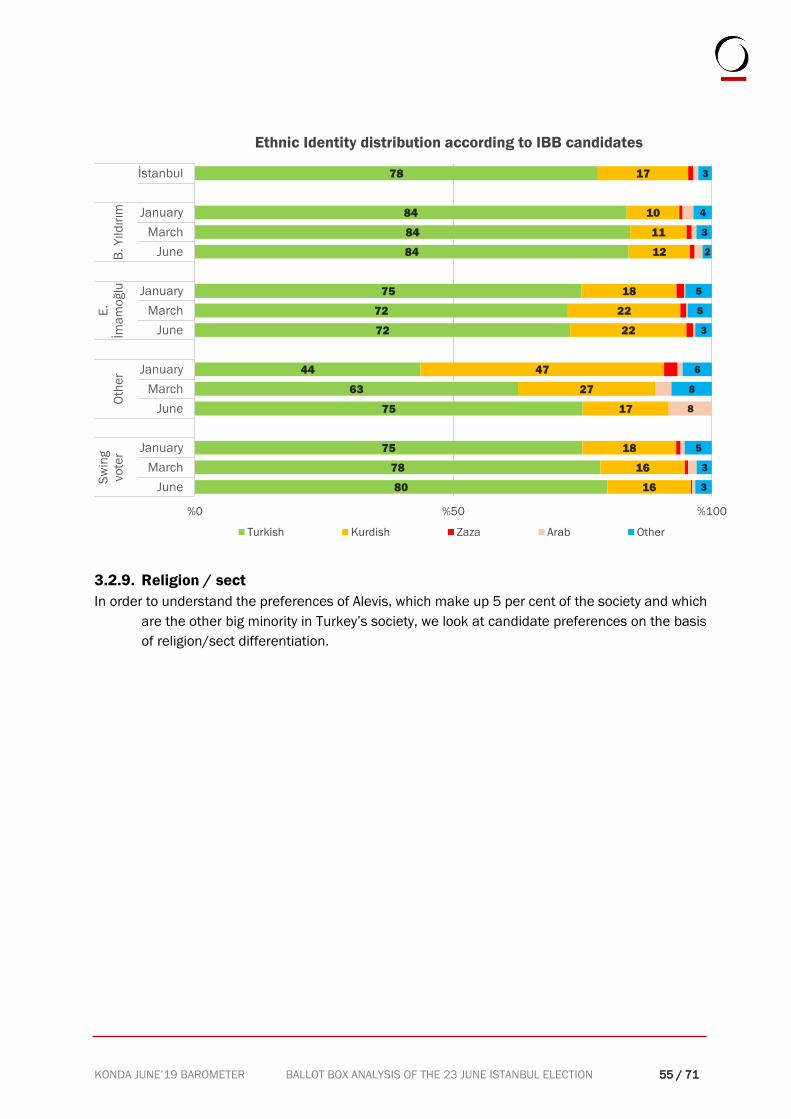
KONDA JUNE’19 BAROMETER BALLOT BOX ANALYSIS OF THE 23 JUNE ISTANBUL ELECTION 55 / 71
3.2.9. Religion / sect
In order to understand the preferences of Alevis, which make up 5 per cent of the society and which
are the other big minority in Turkey’s society, we look at candidate preferences on the basis
of religion/sect differentiation.
80
78
75
75
63
44
72
72
75
84
84
84
78
16
16
18
17
27
47
22
22
18
12
11
10
17
8
3
3
5
8
6
3
5
5
2
3
4
3
%0 %50 %100
June
March
January
June
March
January
June
March
January
June
March
January
İstanbul
Sw
ing
vo
ter
Oth
er
E.
İma
mo
ğlu
B.
Yıld
ırım
Ethnic Identity distribution according to IBB candidates
Turkish Kurdish Zaza Arab Other
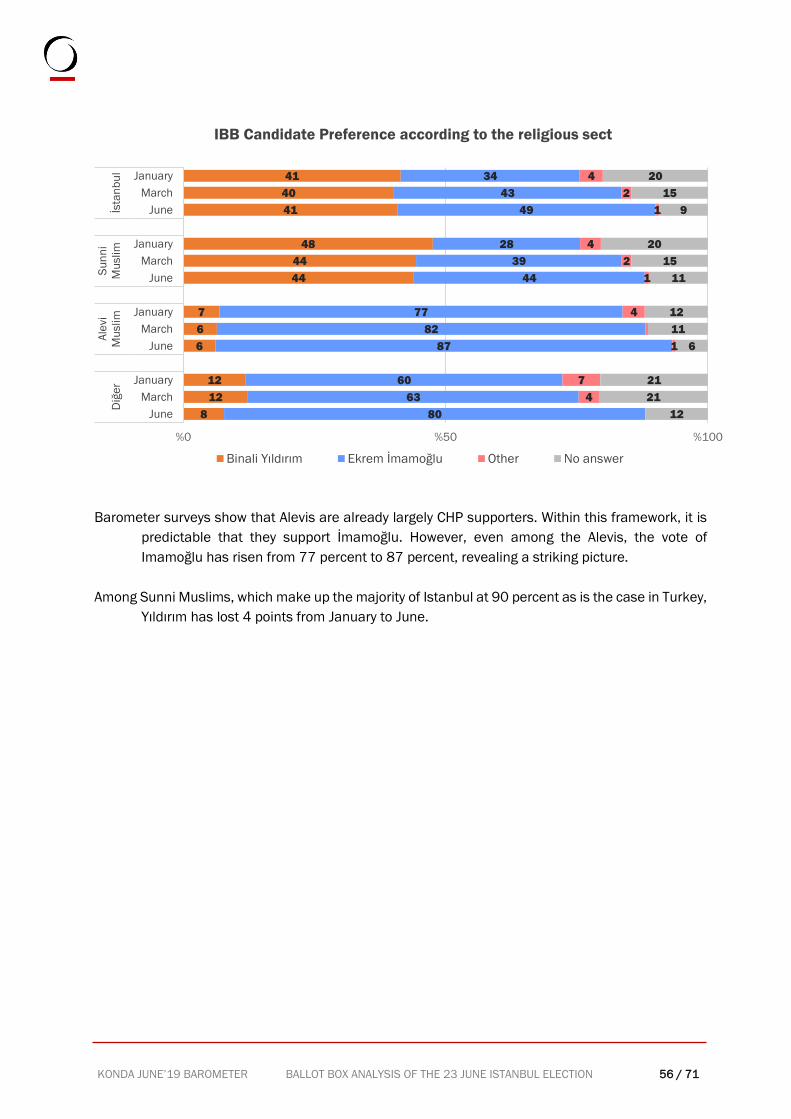
KONDA JUNE’19 BAROMETER BALLOT BOX ANALYSIS OF THE 23 JUNE ISTANBUL ELECTION 56 / 71
Barometer surveys show that Alevis are already largely CHP supporters. Within this framework, it is
predictable that they support İmamoğlu. However, even among the Alevis, the vote of
Imamoğlu has risen from 77 percent to 87 percent, revealing a striking picture.
Among Sunni Muslims, which make up the majority of Istanbul at 90 percent as is the case in Turkey,
Yıldırım has lost 4 points from January to June.
8
12
12
6
6
7
44
44
48
41
40
41
80
63
60
87
82
77
44
39
28
49
43
34
4
7
1
4
1
2
4
1
2
4
12
21
21
6
11
12
11
15
20
9
15
20
%0 %50 %100
June
March
January
June
March
January
June
March
January
June
March
January
Diğ
er
Ale
vi
Mu
slim
Su
nn
i
Mu
slim
İsta
nb
ul
IBB Candidate Preference according to the religious sect
Binali Yıldırım Ekrem İmamoğlu Other No answer
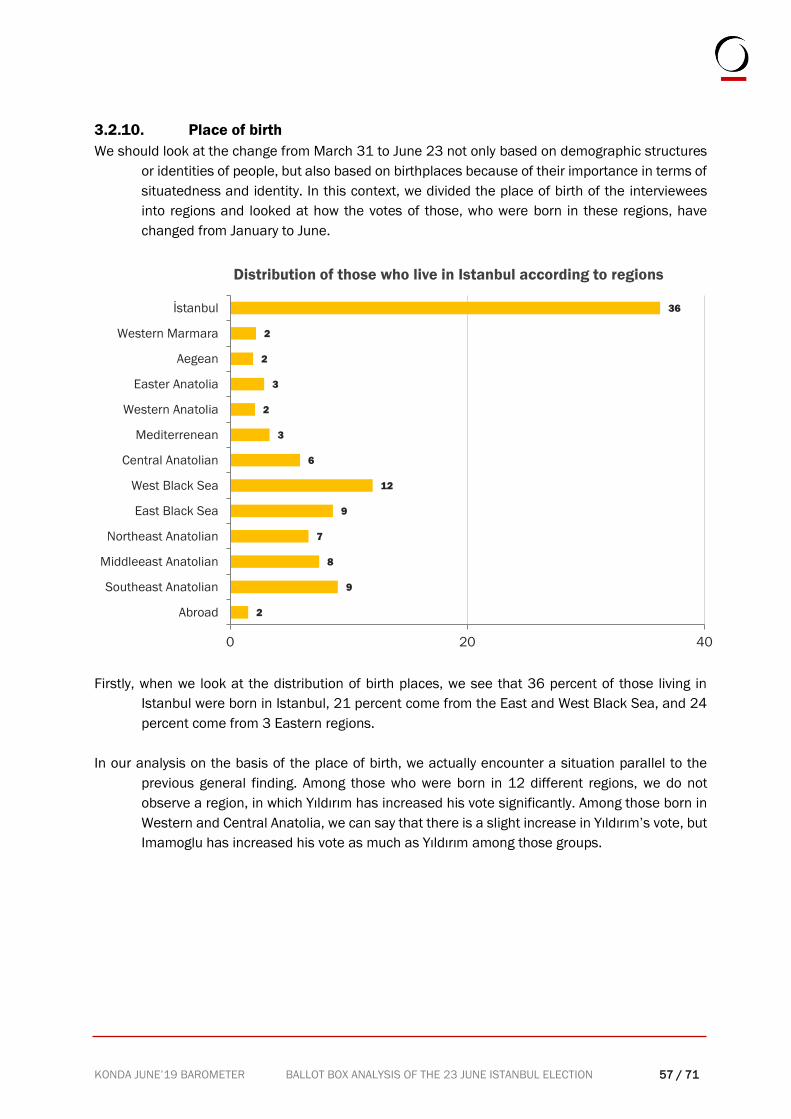
KONDA JUNE’19 BAROMETER BALLOT BOX ANALYSIS OF THE 23 JUNE ISTANBUL ELECTION 57 / 71
3.2.10. Place of birth
We should look at the change from March 31 to June 23 not only based on demographic structures
or identities of people, but also based on birthplaces because of their importance in terms of
situatedness and identity. In this context, we divided the place of birth of the interviewees
into regions and looked at how the votes of those, who were born in these regions, have
changed from January to June.
Firstly, when we look at the distribution of birth places, we see that 36 percent of those living in
Istanbul were born in Istanbul, 21 percent come from the East and West Black Sea, and 24
percent come from 3 Eastern regions.
In our analysis on the basis of the place of birth, we actually encounter a situation parallel to the
previous general finding. Among those who were born in 12 different regions, we do not
observe a region, in which Yıldırım has increased his vote significantly. Among those born in
Western and Central Anatolia, we can say that there is a slight increase in Yıldırım’s vote, but
Imamoglu has increased his vote as much as Yıldırım among those groups.
2
9
8
7
9
12
6
3
2
3
2
2
36
0 20 40
Abroad
Southeast Anatolian
Middleeast Anatolian
Northeast Anatolian
East Black Sea
West Black Sea
Central Anatolian
Mediterrenean
Western Anatolia
Easter Anatolia
Aegean
Western Marmara
İstanbul
Distribution of those who live in Istanbul according to regions
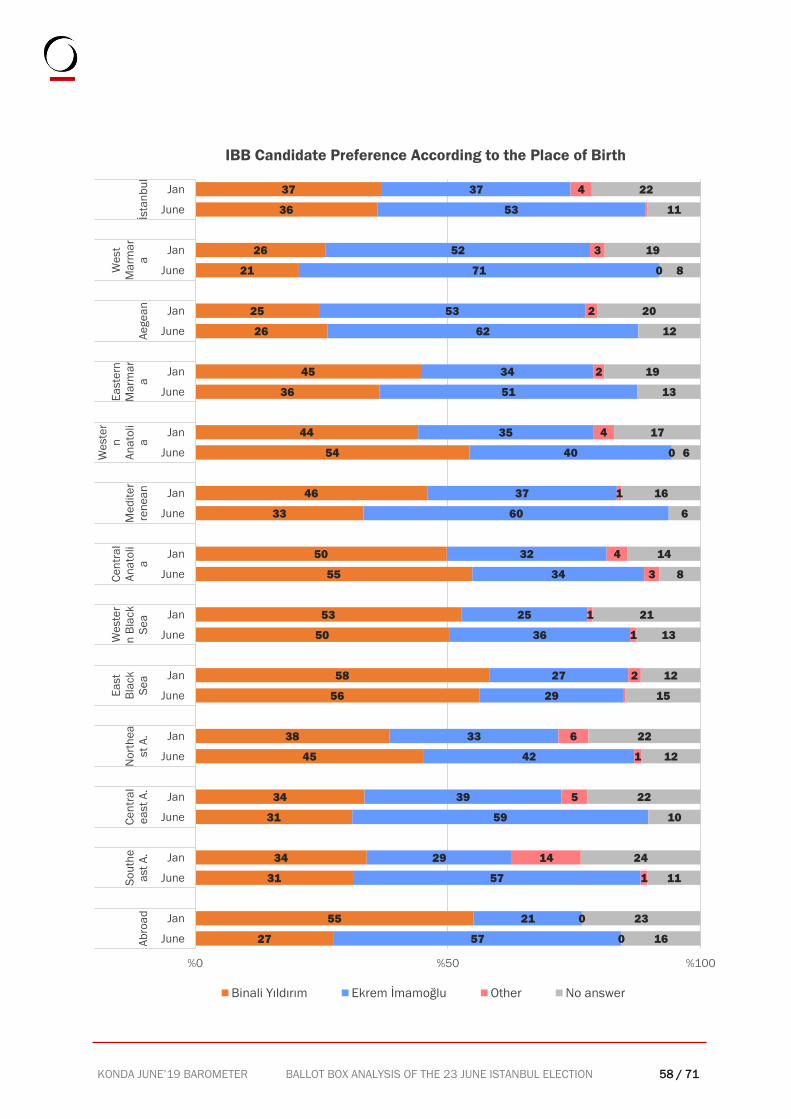
KONDA JUNE’19 BAROMETER BALLOT BOX ANALYSIS OF THE 23 JUNE ISTANBUL ELECTION 58 / 71
27
55
31
34
31
34
45
38
56
58
50
53
55
50
33
46
54
44
36
45
26
25
21
26
36
37
57
21
57
29
59
39
42
33
29
27
36
25
34
32
60
37
40
35
51
34
62
53
71
52
53
37
0
0
1
14
5
1
6
2
1
1
3
4
1
0
4
2
2
0
3
4
16
23
11
24
10
22
12
22
15
12
13
21
8
14
6
16
6
17
13
19
12
20
8
19
11
22
%0 %50 %100
June
Jan
June
Jan
June
Jan
June
Jan
June
Jan
June
Jan
June
Jan
June
Jan
June
Jan
June
Jan
June
Jan
June
Jan
June
Jan
Ab
roa
d
So
uth
e
ast
A.
Ce
ntr
al
ea
st
A.
No
rth
ea
st
A.
Ea
st
Bla
ck
Se
a
We
ste
r
n B
lack
Se
a
Ce
ntr
al
An
ato
li
a
Me
dit
er
ren
ea
n
We
ste
r
n
An
ato
li
a
Ea
ste
rn
Ma
rma
r
aA
ege
an
We
st
Ma
rma
r
aİs
tan
bu
l
IBB Candidate Preference According to the Place of Birth
Binali Yıldırım Ekrem İmamoğlu Other No answer
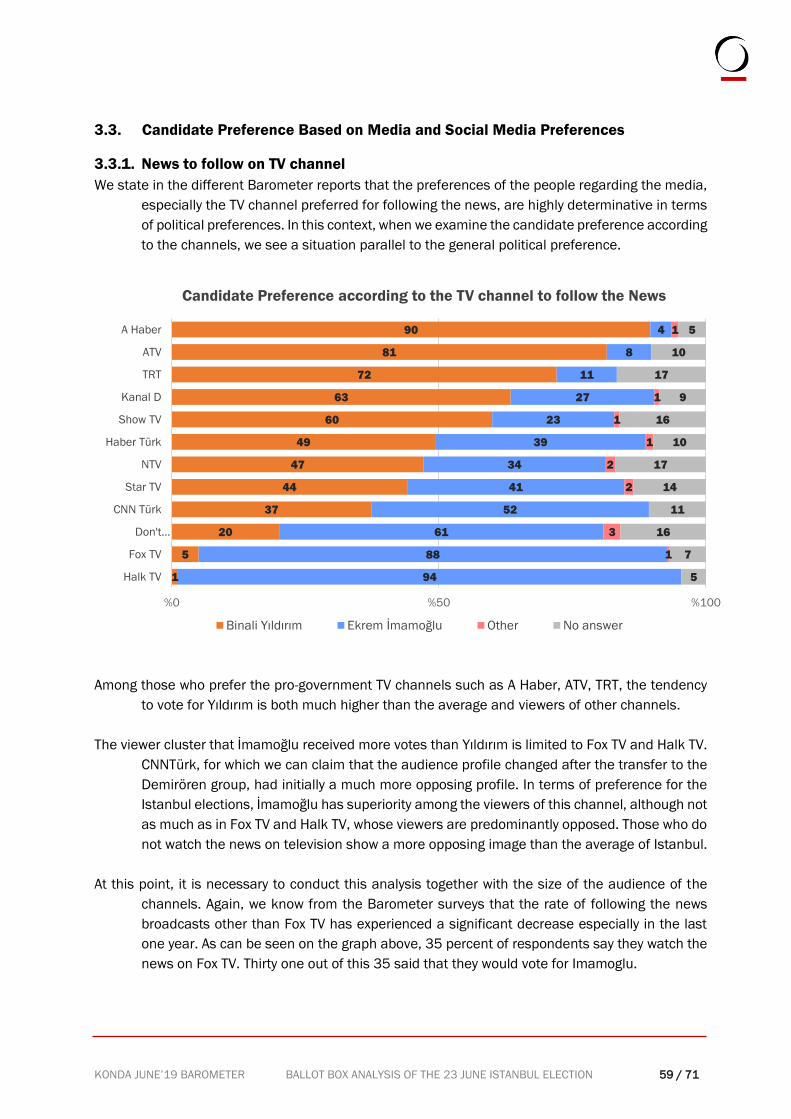
KONDA JUNE’19 BAROMETER BALLOT BOX ANALYSIS OF THE 23 JUNE ISTANBUL ELECTION 59 / 71
3.3. Candidate Preference Based on Media and Social Media Preferences
3.3.1. News to follow on TV channel
We state in the different Barometer reports that the preferences of the people regarding the media,
especially the TV channel preferred for following the news, are highly determinative in terms
of political preferences. In this context, when we examine the candidate preference according
to the channels, we see a situation parallel to the general political preference.
Among those who prefer the pro-government TV channels such as A Haber, ATV, TRT, the tendency
to vote for Yıldırım is both much higher than the average and viewers of other channels.
The viewer cluster that İmamoğlu received more votes than Yıldırım is limited to Fox TV and Halk TV.
CNNTürk, for which we can claim that the audience profile changed after the transfer to the
Demirören group, had initially a much more opposing profile. In terms of preference for the
Istanbul elections, İmamoğlu has superiority among the viewers of this channel, although not
as much as in Fox TV and Halk TV, whose viewers are predominantly opposed. Those who do
not watch the news on television show a more opposing image than the average of Istanbul.
At this point, it is necessary to conduct this analysis together with the size of the audience of the
channels. Again, we know from the Barometer surveys that the rate of following the news
broadcasts other than Fox TV has experienced a significant decrease especially in the last
one year. As can be seen on the graph above, 35 percent of respondents say they watch the
news on Fox TV. Thirty one out of this 35 said that they would vote for Imamoglu.
1
5
20
37
44
47
49
60
63
72
81
90
94
88
61
52
41
34
39
23
27
11
8
4
1
3
2
2
1
1
1
1
5
7
16
11
14
17
10
16
9
17
10
5
%0 %50 %100
Halk TV
Fox TV
Don't…
CNN Türk
Star TV
NTV
Haber Türk
Show TV
Kanal D
TRT
ATV
A Haber
Candidate Preference according to the TV channel to follow the News
Binali Yıldırım Ekrem İmamoğlu Other No answer
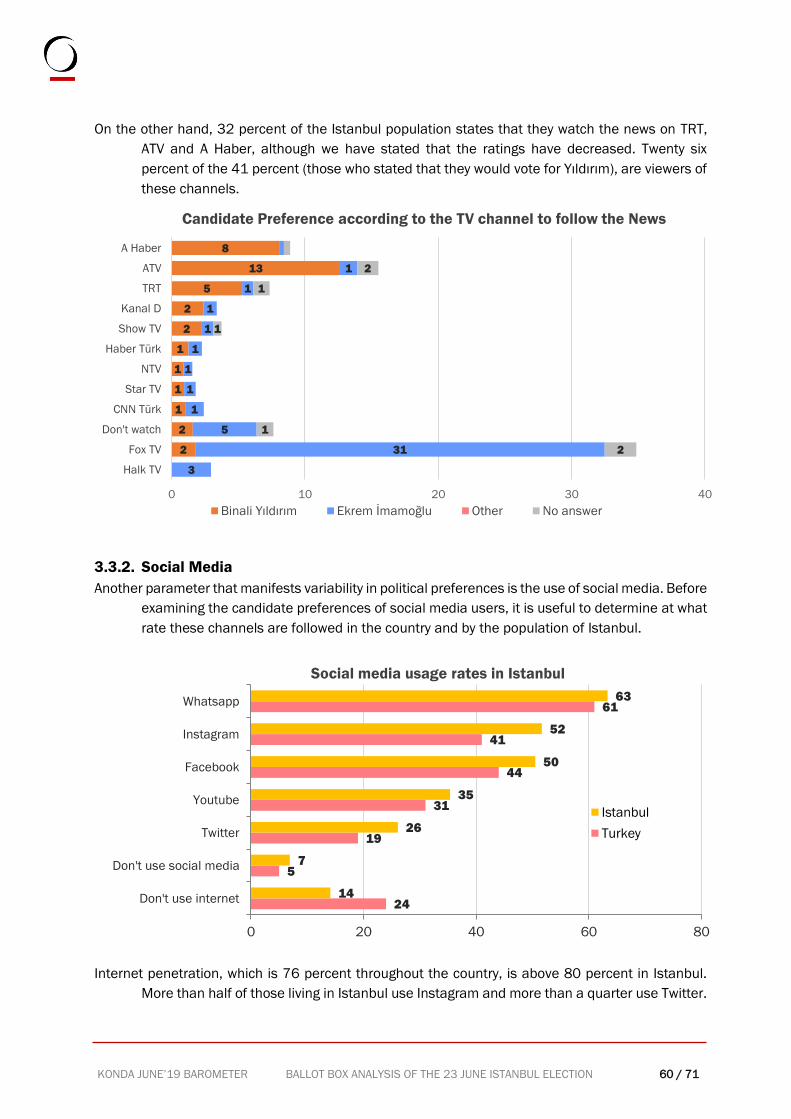
KONDA JUNE’19 BAROMETER BALLOT BOX ANALYSIS OF THE 23 JUNE ISTANBUL ELECTION 60 / 71
On the other hand, 32 percent of the Istanbul population states that they watch the news on TRT,
ATV and A Haber, although we have stated that the ratings have decreased. Twenty six
percent of the 41 percent (those who stated that they would vote for Yıldırım), are viewers of
these channels.
3.3.2. Social Media
Another parameter that manifests variability in political preferences is the use of social media. Before
examining the candidate preferences of social media users, it is useful to determine at what
rate these channels are followed in the country and by the population of Istanbul.
Internet penetration, which is 76 percent throughout the country, is above 80 percent in Istanbul.
More than half of those living in Istanbul use Instagram and more than a quarter use Twitter.
2
2
1
1
1
1
2
2
5
13
8
3
31
5
1
1
1
1
1
1
1
1
2
1
1
1
2
0 10 20 30 40
Halk TV
Fox TV
Don't watch
CNN Türk
Star TV
NTV
Haber Türk
Show TV
Kanal D
TRT
ATV
A Haber
Candidate Preference according to the TV channel to follow the News
Binali Yıldırım Ekrem İmamoğlu Other No answer
24
5
19
31
44
41
61
14
7
26
35
50
52
63
0 20 40 60 80
Don't use internet
Don't use social media
Youtube
Social media usage rates in Istanbul
Istanbul
Turkey
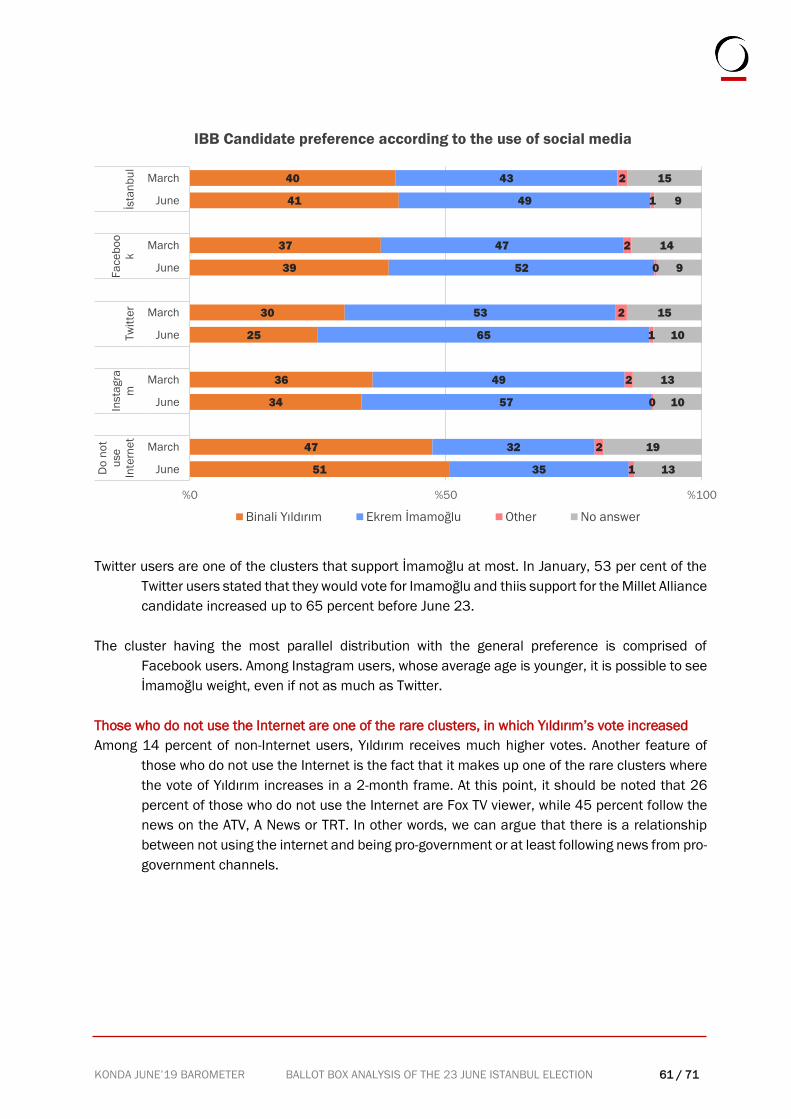
KONDA JUNE’19 BAROMETER BALLOT BOX ANALYSIS OF THE 23 JUNE ISTANBUL ELECTION 61 / 71
Twitter users are one of the clusters that support İmamoğlu at most. In January, 53 per cent of the
Twitter users stated that they would vote for Imamoğlu and thiis support for the Millet Alliance
candidate increased up to 65 percent before June 23.
The cluster having the most parallel distribution with the general preference is comprised of
Facebook users. Among Instagram users, whose average age is younger, it is possible to see
İmamoğlu weight, even if not as much as Twitter.
Those who do not use the Internet are one of the rare clusters, in which Yıldırım’s vote increased
Among 14 percent of non-Internet users, Yıldırım receives much higher votes. Another feature of
those who do not use the Internet is the fact that it makes up one of the rare clusters where
the vote of Yıldırım increases in a 2-month frame. At this point, it should be noted that 26
percent of those who do not use the Internet are Fox TV viewer, while 45 percent follow the
news on the ATV, A News or TRT. In other words, we can argue that there is a relationship
between not using the internet and being pro-government or at least following news from pro-
government channels.
51
47
34
36
25
30
39
37
41
40
35
32
57
49
65
53
52
47
49
43
1
2
0
2
1
2
0
2
1
2
13
19
10
13
10
15
9
14
9
15
%0 %50 %100
June
March
June
March
June
March
June
March
June
March
Do
no
t
use
Inte
rne
t
Insta
gra
mTw
itte
r
Fa
ce
bo
o
kİs
tan
bu
lIBB Candidate preference according to the use of social media
Binali Yıldırım Ekrem İmamoğlu Other No answer
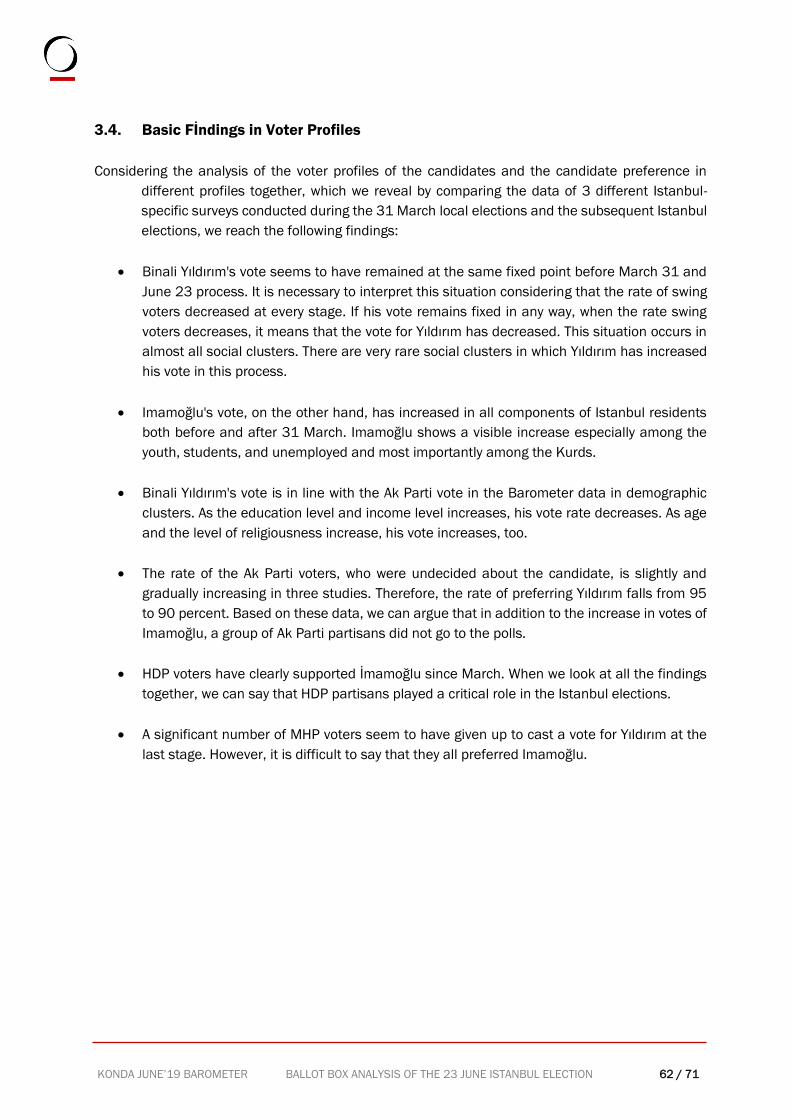
KONDA JUNE’19 BAROMETER BALLOT BOX ANALYSIS OF THE 23 JUNE ISTANBUL ELECTION 62 / 71
3.4. Basic Fİndings in Voter Profiles
Considering the analysis of the voter profiles of the candidates and the candidate preference in
different profiles together, which we reveal by comparing the data of 3 different Istanbul-
specific surveys conducted during the 31 March local elections and the subsequent Istanbul
elections, we reach the following findings:
• Binali Yıldırım's vote seems to have remained at the same fixed point before March 31 and
June 23 process. It is necessary to interpret this situation considering that the rate of swing
voters decreased at every stage. If his vote remains fixed in any way, when the rate swing
voters decreases, it means that the vote for Yıldırım has decreased. This situation occurs in
almost all social clusters. There are very rare social clusters in which Yıldırım has increased
his vote in this process.
• Imamoğlu's vote, on the other hand, has increased in all components of Istanbul residents
both before and after 31 March. Imamoğlu shows a visible increase especially among the
youth, students, and unemployed and most importantly among the Kurds.
• Binali Yıldırım's vote is in line with the Ak Parti vote in the Barometer data in demographic
clusters. As the education level and income level increases, his vote rate decreases. As age
and the level of religiousness increase, his vote increases, too.
• The rate of the Ak Parti voters, who were undecided about the candidate, is slightly and
gradually increasing in three studies. Therefore, the rate of preferring Yıldırım falls from 95
to 90 percent. Based on these data, we can argue that in addition to the increase in votes of
Imamoğlu, a group of Ak Parti partisans did not go to the polls.
• HDP voters have clearly supported İmamoğlu since March. When we look at all the findings
together, we can say that HDP partisans played a critical role in the Istanbul elections.
• A significant number of MHP voters seem to have given up to cast a vote for Yıldırım at the
last stage. However, it is difficult to say that they all preferred Imamoğlu.
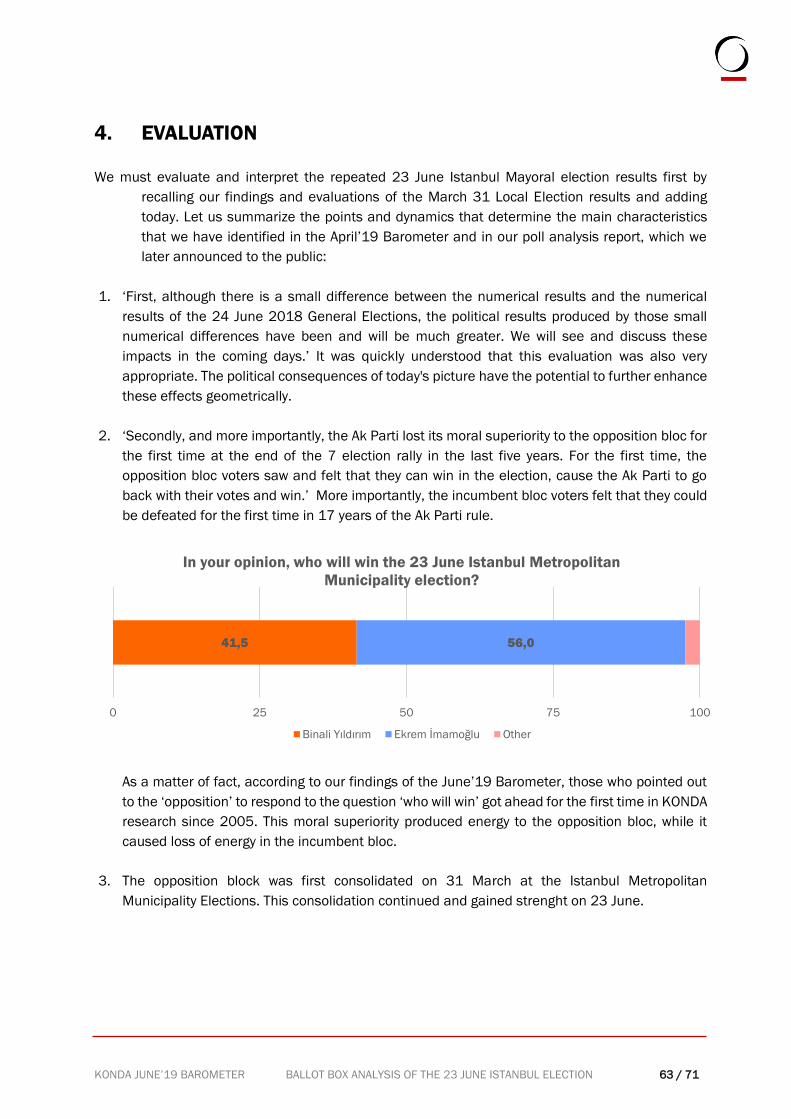
KONDA JUNE’19 BAROMETER BALLOT BOX ANALYSIS OF THE 23 JUNE ISTANBUL ELECTION 63 / 71
4. EVALUATION
We must evaluate and interpret the repeated 23 June Istanbul Mayoral election results first by
recalling our findings and evaluations of the March 31 Local Election results and adding
today. Let us summarize the points and dynamics that determine the main characteristics
that we have identified in the April’19 Barometer and in our poll analysis report, which we
later announced to the public:
1. ‘First, although there is a small difference between the numerical results and the numerical
results of the 24 June 2018 General Elections, the political results produced by those small
numerical differences have been and will be much greater. We will see and discuss these
impacts in the coming days.’ It was quickly understood that this evaluation was also very
appropriate. The political consequences of today's picture have the potential to further enhance
these effects geometrically.
2. ‘Secondly, and more importantly, the Ak Parti lost its moral superiority to the opposition bloc for
the first time at the end of the 7 election rally in the last five years. For the first time, the
opposition bloc voters saw and felt that they can win in the election, cause the Ak Parti to go
back with their votes and win.’ More importantly, the incumbent bloc voters felt that they could
be defeated for the first time in 17 years of the Ak Parti rule.
As a matter of fact, according to our findings of the June’19 Barometer, those who pointed out
to the ‘opposition’ to respond to the question ‘who will win’ got ahead for the first time in KONDA
research since 2005. This moral superiority produced energy to the opposition bloc, while it
caused loss of energy in the incumbent bloc.
3. The opposition block was first consolidated on 31 March at the Istanbul Metropolitan
Municipality Elections. This consolidation continued and gained strenght on 23 June.
41,5 56,0
0 25 50 75 100
In your opinion, who will win the 23 June Istanbul Metropolitan
Municipality election?
Binali Yıldırım Ekrem İmamoğlu Other
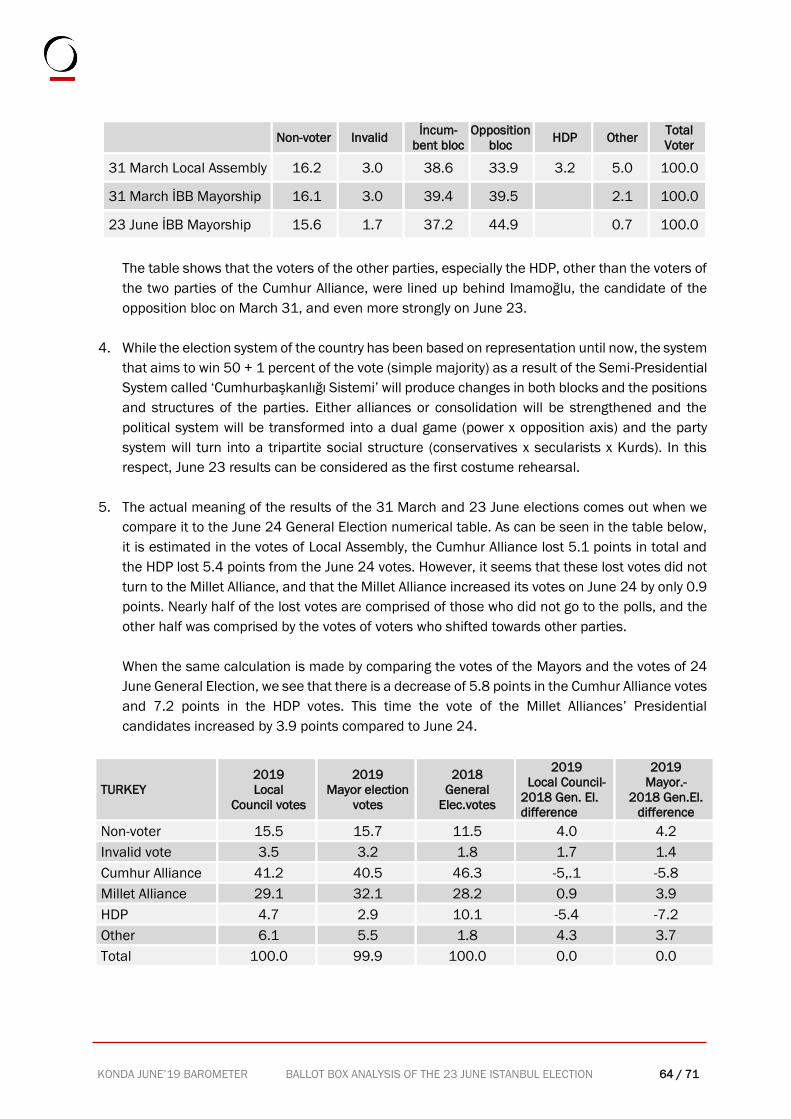
KONDA JUNE’19 BAROMETER BALLOT BOX ANALYSIS OF THE 23 JUNE ISTANBUL ELECTION 64 / 71
Non-voter Invalid İncum-
bent bloc
Opposition
bloc HDP Other
Total
Voter
31 March Local Assembly 16.2 3.0 38.6 33.9 3.2 5.0 100.0
31 March İBB Mayorship 16.1 3.0 39.4 39.5 2.1 100.0
23 June İBB Mayorship 15.6 1.7 37.2 44.9 0.7 100.0
The table shows that the voters of the other parties, especially the HDP, other than the voters of
the two parties of the Cumhur Alliance, were lined up behind Imamoğlu, the candidate of the
opposition bloc on March 31, and even more strongly on June 23.
4. While the election system of the country has been based on representation until now, the system
that aims to win 50 + 1 percent of the vote (simple majority) as a result of the Semi-Presidential
System called ‘Cumhurbaşkanlığı Sistemi’ will produce changes in both blocks and the positions
and structures of the parties. Either alliances or consolidation will be strengthened and the
political system will be transformed into a dual game (power x opposition axis) and the party
system will turn into a tripartite social structure (conservatives x secularists x Kurds). In this
respect, June 23 results can be considered as the first costume rehearsal.
5. The actual meaning of the results of the 31 March and 23 June elections comes out when we
compare it to the June 24 General Election numerical table. As can be seen in the table below,
it is estimated in the votes of Local Assembly, the Cumhur Alliance lost 5.1 points in total and
the HDP lost 5.4 points from the June 24 votes. However, it seems that these lost votes did not
turn to the Millet Alliance, and that the Millet Alliance increased its votes on June 24 by only 0.9
points. Nearly half of the lost votes are comprised of those who did not go to the polls, and the
other half was comprised by the votes of voters who shifted towards other parties.
When the same calculation is made by comparing the votes of the Mayors and the votes of 24
June General Election, we see that there is a decrease of 5.8 points in the Cumhur Alliance votes
and 7.2 points in the HDP votes. This time the vote of the Millet Alliances’ Presidential
candidates increased by 3.9 points compared to June 24.
TURKEY
2019
Local
Council votes
2019
Mayor election
votes
2018
General
Elec.votes
2019
Local Council-
2018 Gen. El.
difference
2019
Mayor.-
2018 Gen.El.
difference
Non-voter 15.5 15.7 11.5 4.0 4.2
Invalid vote 3.5 3.2 1.8 1.7 1.4
Cumhur Alliance 41.2 40.5 46.3 -5,.1 -5.8
Millet Alliance 29.1 32.1 28.2 0.9 3.9
HDP 4.7 2.9 10.1 -5.4 -7.2
Other 6.1 5.5 1.8 4.3 3.7
Total 100.0 99.9 100.0 0.0 0.0
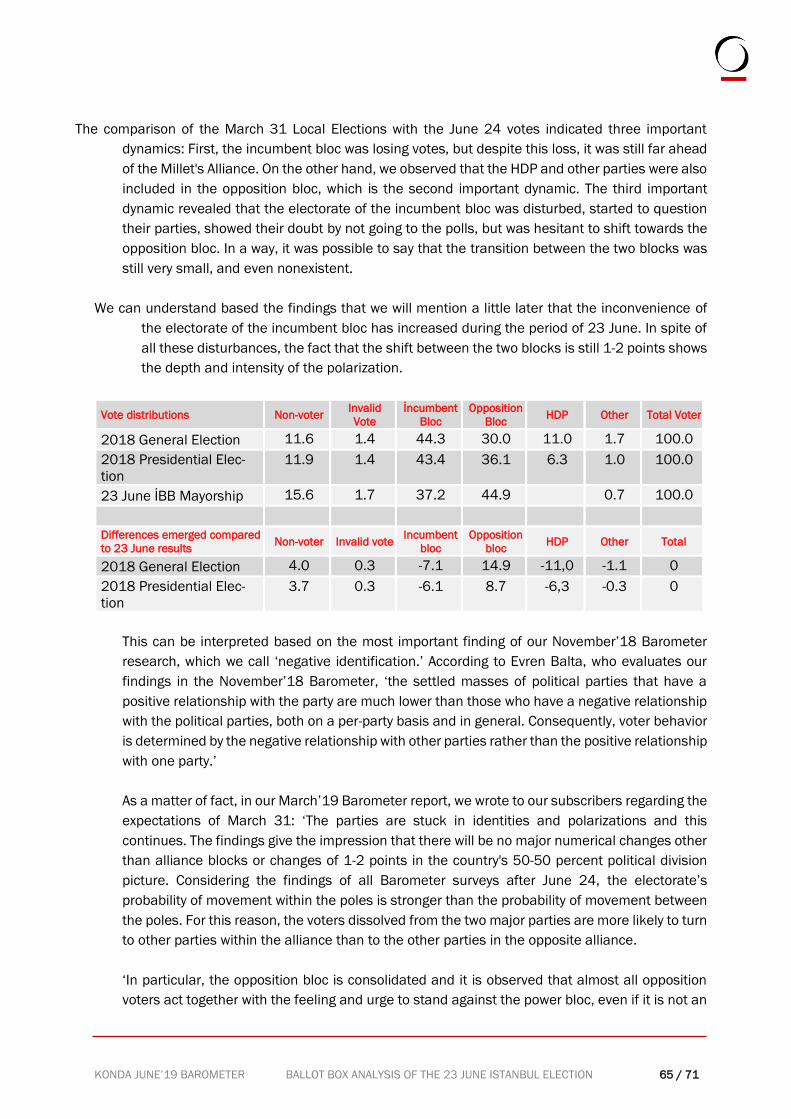
KONDA JUNE’19 BAROMETER BALLOT BOX ANALYSIS OF THE 23 JUNE ISTANBUL ELECTION 65 / 71
The comparison of the March 31 Local Elections with the June 24 votes indicated three important
dynamics: First, the incumbent bloc was losing votes, but despite this loss, it was still far ahead
of the Millet's Alliance. On the other hand, we observed that the HDP and other parties were also
included in the opposition bloc, which is the second important dynamic. The third important
dynamic revealed that the electorate of the incumbent bloc was disturbed, started to question
their parties, showed their doubt by not going to the polls, but was hesitant to shift towards the
opposition bloc. In a way, it was possible to say that the transition between the two blocks was
still very small, and even nonexistent.
We can understand based the findings that we will mention a little later that the inconvenience of
the electorate of the incumbent bloc has increased during the period of 23 June. In spite of
all these disturbances, the fact that the shift between the two blocks is still 1-2 points shows
the depth and intensity of the polarization.
Vote distributions Non-voter Invalid
Vote
İncumbent
Bloc
Opposition
Bloc HDP Other Total Voter
2018 General Election 11.6 1.4 44.3 30.0 11.0 1.7 100.0
2018 Presidential Elec-
tion
11.9 1.4 43.4 36.1 6.3 1.0 100.0
23 June İBB Mayorship 15.6 1.7 37.2 44.9
0.7 100.0
Differences emerged compared
to 23 June results Non-voter Invalid vote
Incumbent
bloc Opposition
bloc HDP Other Total
2018 General Election 4.0 0.3 -7.1 14.9 -11,0 -1.1 0
2018 Presidential Elec-
tion
3.7 0.3 -6.1 8.7 -6,3 -0.3 0
This can be interpreted based on the most important finding of our November’18 Barometer
research, which we call ‘negative identification.’ According to Evren Balta, who evaluates our
findings in the November’18 Barometer, ‘the settled masses of political parties that have a
positive relationship with the party are much lower than those who have a negative relationship
with the political parties, both on a per-party basis and in general. Consequently, voter behavior
is determined by the negative relationship with other parties rather than the positive relationship
with one party.’
As a matter of fact, in our March’19 Barometer report, we wrote to our subscribers regarding the
expectations of March 31: ‘The parties are stuck in identities and polarizations and this
continues. The findings give the impression that there will be no major numerical changes other
than alliance blocks or changes of 1-2 points in the country's 50-50 percent political division
picture. Considering the findings of all Barometer surveys after June 24, the electorate’s
probability of movement within the poles is stronger than the probability of movement between
the poles. For this reason, the voters dissolved from the two major parties are more likely to turn
to other parties within the alliance than to the other parties in the opposite alliance.
‘In particular, the opposition bloc is consolidated and it is observed that almost all opposition
voters act together with the feeling and urge to stand against the power bloc, even if it is not an
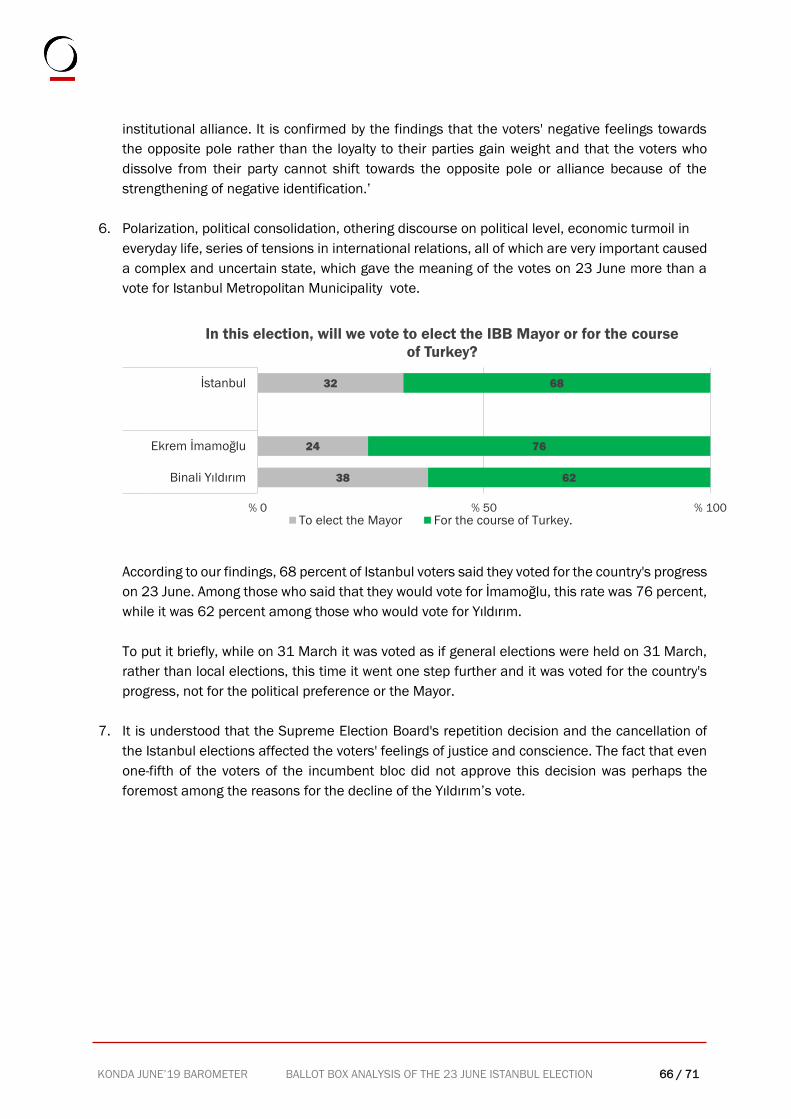
KONDA JUNE’19 BAROMETER BALLOT BOX ANALYSIS OF THE 23 JUNE ISTANBUL ELECTION 66 / 71
institutional alliance. It is confirmed by the findings that the voters' negative feelings towards
the opposite pole rather than the loyalty to their parties gain weight and that the voters who
dissolve from their party cannot shift towards the opposite pole or alliance because of the
strengthening of negative identification.’
6. Polarization, political consolidation, othering discourse on political level, economic turmoil in
everyday life, series of tensions in international relations, all of which are very important caused
a complex and uncertain state, which gave the meaning of the votes on 23 June more than a
vote for Istanbul Metropolitan Municipality vote.
According to our findings, 68 percent of Istanbul voters said they voted for the country's progress
on 23 June. Among those who said that they would vote for İmamoğlu, this rate was 76 percent,
while it was 62 percent among those who would vote for Yıldırım.
To put it briefly, while on 31 March it was voted as if general elections were held on 31 March,
rather than local elections, this time it went one step further and it was voted for the country's
progress, not for the political preference or the Mayor.
7. It is understood that the Supreme Election Board's repetition decision and the cancellation of
the Istanbul elections affected the voters' feelings of justice and conscience. The fact that even
one-fifth of the voters of the incumbent bloc did not approve this decision was perhaps the
foremost among the reasons for the decline of the Yıldırım’s vote.
38
24
32
62
76
68
% 0 % 50 % 100
Binali Yıldırım
Ekrem İmamoğlu
İstanbul
In this election, will we vote to elect the IBB Mayor or for the course
of Turkey?
To elect the Mayor For the course of Turkey.
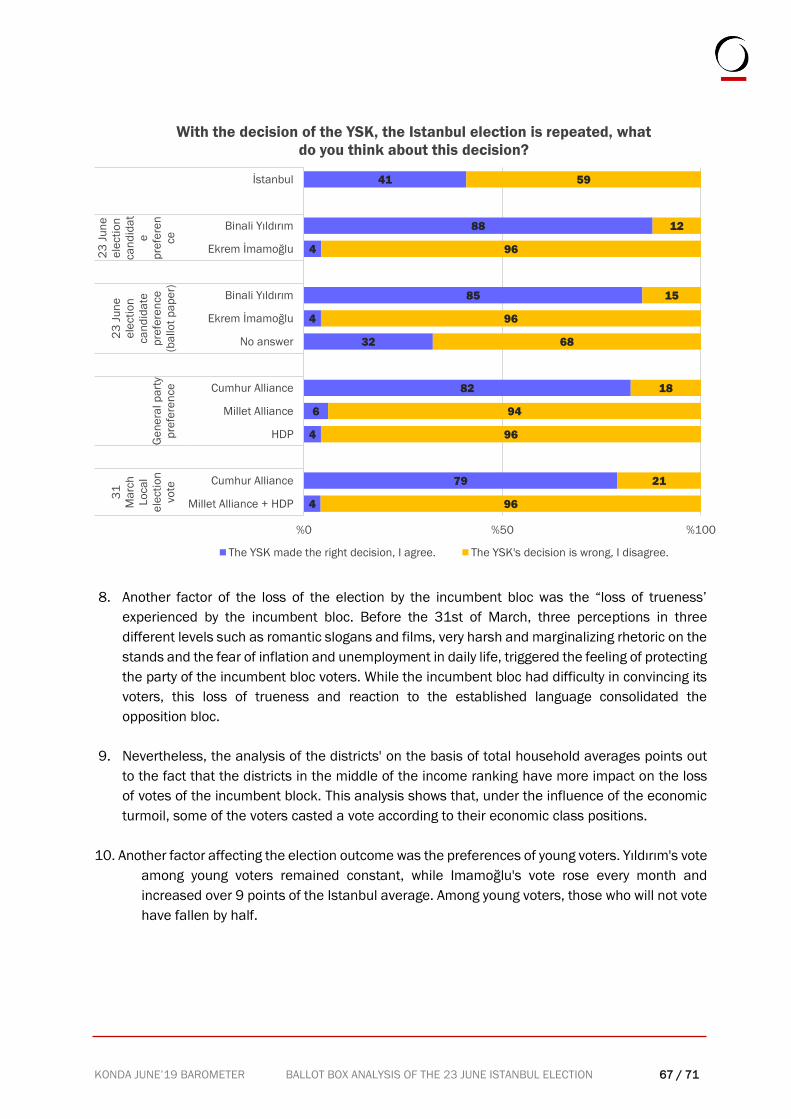
KONDA JUNE’19 BAROMETER BALLOT BOX ANALYSIS OF THE 23 JUNE ISTANBUL ELECTION 67 / 71
8. Another factor of the loss of the election by the incumbent bloc was the “loss of trueness’
experienced by the incumbent bloc. Before the 31st of March, three perceptions in three
different levels such as romantic slogans and films, very harsh and marginalizing rhetoric on the
stands and the fear of inflation and unemployment in daily life, triggered the feeling of protecting
the party of the incumbent bloc voters. While the incumbent bloc had difficulty in convincing its
voters, this loss of trueness and reaction to the established language consolidated the
opposition bloc.
9. Nevertheless, the analysis of the districts' on the basis of total household averages points out
to the fact that the districts in the middle of the income ranking have more impact on the loss
of votes of the incumbent block. This analysis shows that, under the influence of the economic
turmoil, some of the voters casted a vote according to their economic class positions.
10. Another factor affecting the election outcome was the preferences of young voters. Yıldırım's vote
among young voters remained constant, while Imamoğlu's vote rose every month and
increased over 9 points of the Istanbul average. Among young voters, those who will not vote
have fallen by half.
4
79
4
6
82
32
4
85
4
88
41
96
21
96
94
18
68
96
15
96
12
59
%0 %50 %100
Millet Alliance + HDP
Cumhur Alliance
HDP
Millet Alliance
Cumhur Alliance
No answer
Ekrem İmamoğlu
Binali Yıldırım
Ekrem İmamoğlu
Binali Yıldırım
İstanbul
31
Ma
rch
Lo
ca
l
ele
cti
on
vo
te
Ge
ne
ral p
art
y
pre
fere
nce
23
Ju
ne
ele
cti
on
ca
nd
ida
te
pre
fere
nce
(ba
llo
t p
ap
er)
23
Ju
ne
ele
cti
on
ca
nd
ida
t
e
pre
fere
n
ce
With the decision of the YSK, the Istanbul election is repeated, what
do you think about this decision?
The YSK made the right decision, I agree. The YSK's decision is wrong, I disagree.
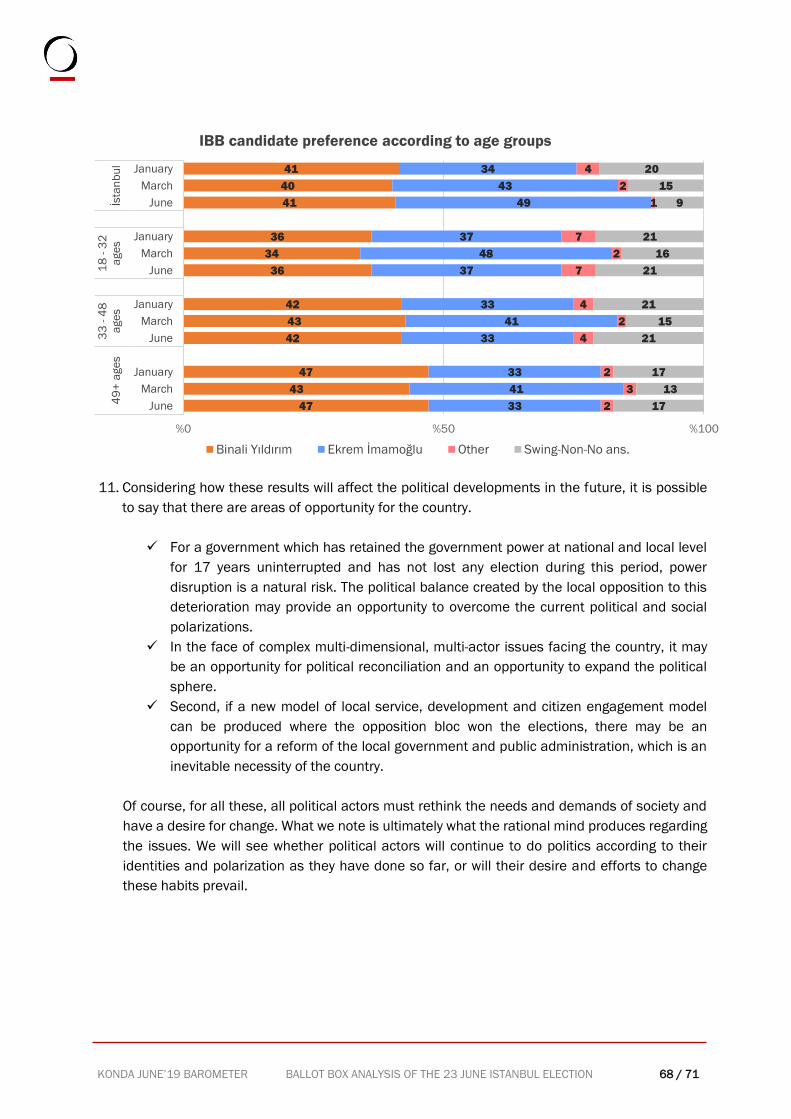
KONDA JUNE’19 BAROMETER BALLOT BOX ANALYSIS OF THE 23 JUNE ISTANBUL ELECTION 68 / 71
11. Considering how these results will affect the political developments in the future, it is possible
to say that there are areas of opportunity for the country.
✓ For a government which has retained the government power at national and local level
for 17 years uninterrupted and has not lost any election during this period, power
disruption is a natural risk. The political balance created by the local opposition to this
deterioration may provide an opportunity to overcome the current political and social
polarizations.
✓ In the face of complex multi-dimensional, multi-actor issues facing the country, it may
be an opportunity for political reconciliation and an opportunity to expand the political
sphere.
✓ Second, if a new model of local service, development and citizen engagement model
can be produced where the opposition bloc won the elections, there may be an
opportunity for a reform of the local government and public administration, which is an
inevitable necessity of the country.
Of course, for all these, all political actors must rethink the needs and demands of society and
have a desire for change. What we note is ultimately what the rational mind produces regarding
the issues. We will see whether political actors will continue to do politics according to their
identities and polarization as they have done so far, or will their desire and efforts to change
these habits prevail.
47
43
47
42
43
42
36
34
36
41
40
41
33
41
33
33
41
33
37
48
37
49
43
34
2
3
2
4
2
4
7
2
7
1
2
4
17
13
17
21
15
21
21
16
21
9
15
20
%0 %50 %100
June
March
January
June
March
January
June
March
January
June
March
January
49
+ a
ge
s
33
- 4
8
age
s
18
- 3
2
age
sİs
tan
bu
l
IBB candidate preference according to age groups
Binali Yıldırım Ekrem İmamoğlu Other Swing-Non-No ans.
KONDA JUNE’19 BAROMETER BALLOT BOX ANALYSIS OF THE 23 JUNE ISTANBUL ELECTION 69 / 71
5. RESEARCH ID
5.1. The General Description of the Survey
The survey that this report is based on was conducted by KONDA Research and Consultancy Limited
(KONDA Araştırma ve Danışmanlık Ltd. Şti.).
The field survey was conducted on 15 – 16 June 2019. This report presents the political trends,
preferences and profiles of the adult population above the age of 18 in Turkey, as observed
on the dates of the field survey.
The survey is designed and conducted with the purpose to determine and to monitor trends and
changes in the preferences of respondents who represent the adult population above the
age of 18 in Turkey. The margin of error of the survey is +/- 1.7 at 95 percent confidence
level and +/- 2.3 at 99 percent confidence level.
5.2. The Sample
The sample was prepared by stratification of the data on population and educational level of
neighborhoods and villages based on Address-Based Population Registration System with
the neighborhood and village results of the general elections dated November 1, 2015.
Within the scope of the survey, face-to-face interviews were carried out with 3498 individuals in 157
neighborhoods in the border of the Istanbul Metropolitan Municipality. Age and gender
quotas were applied for 24 questionnaires conducted in each neighborhood.
KONDA JUNE’19 BAROMETER BALLOT BOX ANALYSIS OF THE 23 JUNE ISTANBUL ELECTION 70 / 71
6. GLOSSARY of TERMS
All findings in Barometer reports are based on answers to the questions directed to respondents who
were interviewed face-to-face in field surveys. Some questions and response options are then
used in the rest of the report in short or simplified form. For example, the respondents who
respond to the question on how religious they see themselves as “a person who is a believer,
but does not fulfill religious requirements” are shortly identified as “believers” in the report.
This glossary is prepared for both the readers who receive the report for the first time and
the readers who need further clarification on the terms. The first table provides a list of the
terms and their explanations, and the following tables list the questions and response
options which establish the basis for these terms..
DEFINITION
ALEVI MUSLIM: A person who identifies his/her religion/sect as Alevi Muslim
ARAB: A person who identifies his/her ethnic origin as Arab
ATHEIST: A person with no religious belief
BELIEVER: A person who believes in the requirements of the religion, but
does not fulfill them completely
CHADOR: A woman who wears chador or a man whose spouse wears a cha-
dor
HEADSCARF: A woman who does not cover her head or a man with a headscarf
or whose spouse does not cover her head with a headscarf
KURDISH: A person who identifies his/her ethnic origin as Kurdish
LOWER CLASS: Households whose income per capita is in the lowest 20 percent
segment
LOWER MIDDLE CLASS: Households with an income per capita in the 60 percent segment
but which do not own a car
METROPOLITAN: Settlements which are located within the integrated boundaries of
the most crowded 15 cities (differs from the official definition)
MODERN: A person who identifies his/her lifestyle as modern
MULTIPLE CORRESPOND-
ENCE ANALYSIS
It is a data analysis technique for nominal categorical data, used
to detect and represent underlying structures in a data set. It is
used for applying Correspondence Analysis (CA) to large data sets
with more than two variables.
NEW MIDDLE CLASS: Households whose income per capita is in the 60 percent seg-
ment and which own a car
NO COVER: A woman who does not cover her head or a man whose spouse
does not cover her head
NON-BELIEVER: A person who does not believe in the requirements of the religion
PIOUS: A person who fulfills the requirements of the religion completely
RELIGIOUS: A person who tries to fulfill the requirements of the religion
RELIGIOUS CONSERVATIVE: A person who identifies his/her lifestyle as religious conservative
RURAL AREA: Settlements with a population of less than 4000 (differs from the
official definition)
SUNNI MUSLIM: A person who identifies his/her religion/sect as Sunni Muslim
TURBAN: A woman who wears a turban or a man whose spouse wears a tur-
ban
KONDA JUNE’19 BAROMETER BALLOT BOX ANALYSIS OF THE 23 JUNE ISTANBUL ELECTION 71 / 71
TURKISH: A person who identifies his/her ethnic origin as Turkish
TRADITIONAL CONSERVA-
TIVE:
A person who identifies his/her lifestyle as traditional conservative
URBAN AREA: Settlements with a population of more than 4000 (differs from the
official definition)
UPPER CLASS: Households whose income per capita is in the highest 20 percent
segment
ZAZA: A person who identifies his/her ethnic origin as Zaza
6.1. Questions and Response Options
Which of the three lifestyle clusters below
do you feel yourself belonging to?
Modern
Traditional Conservative
Religious Conservative
We are all citizens of the Turkish Republic,
but we may have different ethnic origins;
which identity do you know/feel that you
belong to?
Turkish
Kurdish
Zaza
Arab
Other
Which religion or sect do you feel you belong
to?
Sunni Muslim
Alevi Muslim
Other
Settlement Code (Data obtained from the
sample)
Rural
Urban
Metropolitan
Do you cover your head or does your spouse
cover her head when going out of your
home? How do you cover your head?
No head cover
Headscarf
Turban
Chador
Bachelor male Which of the below describes you in terms
of piety?
A person who does not believe in the re-
quirements of the religion
A person who believes in the requirements
of the religion, but does not fulfill them com-
pletely
A person who tries to fulfill the requirements
of the religion
A person who fulfills the requirements of the
religion completely
Economic classes (determined by using
household size, household income and car
ownership)
Lower class
Lower middle class
New middle class
Upper class

Yıldız Posta Caddesi Çiğdem Apt. No:11 / 6 Gayrettepe, 34349 Şişli İstanbul
[email protected]+90 212 275 17 66 (pbx)+90 212 275 17 68 (fax)