Embed Size (px)
Citation preview
KOMUNIKASI & MULTIMEDIAFAKTA & ANGKA TERPILIH
COMMUNICATIONS & MULTIMEDIASELECTED FACTS & FIGURES
Q42 0 1 0
1
2
3
4
5
6
7
8
9
10
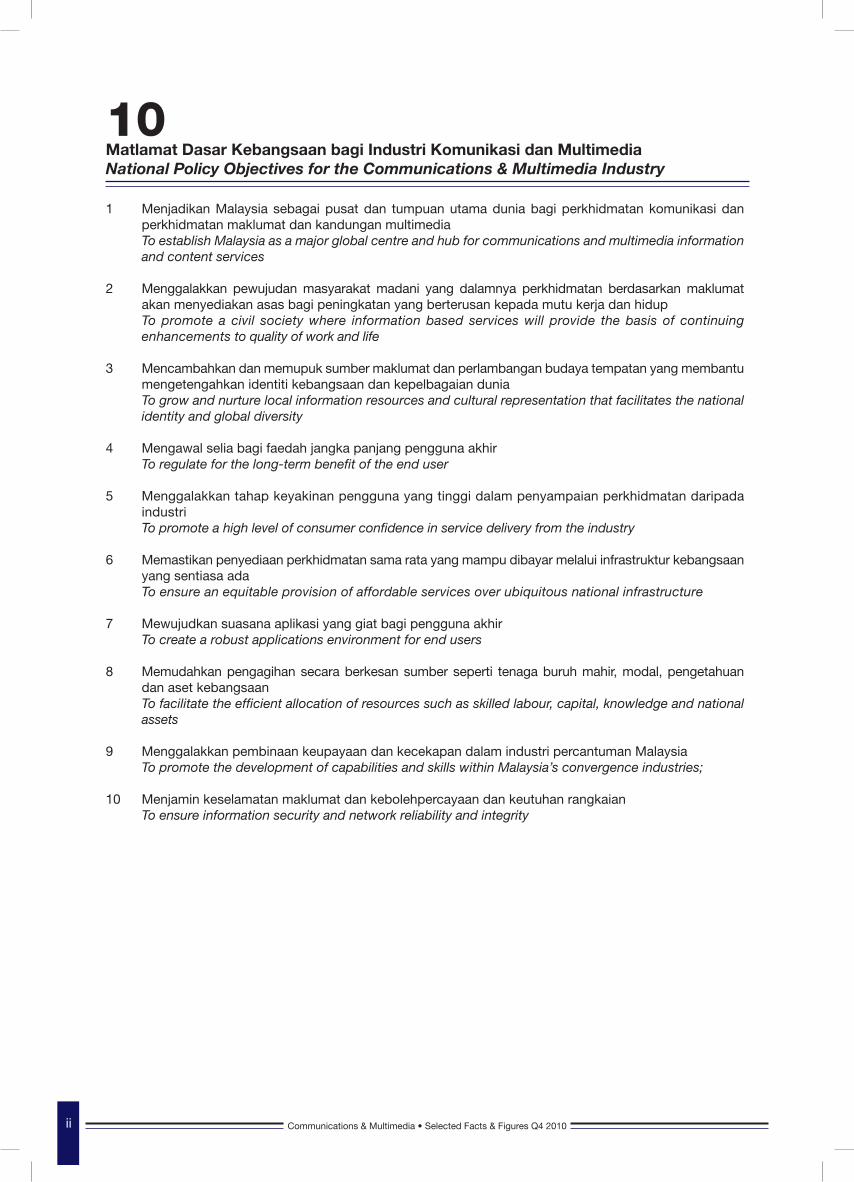
Menjadikan Malaysia sebagai pusat dan tumpuan utama dunia bagi perkhidmatan komunikasi dan perkhidmatan maklumat dan kandungan multimediaTo establish Malaysia as a major global centre and hub for communications and multimedia information and content services
Menggalakkan pewujudan masyarakat madani yang dalamnya perkhidmatan berdasarkan maklumat akan menyediakan asas bagi peningkatan yang berterusan kepada mutu kerja dan hidupTo promote a civil society where information based services will provide the basis of continuing enhancements to quality of work and life
Mencambahkan dan memupuk sumber maklumat dan perlambangan budaya tempatan yang membantu mengetengahkan identiti kebangsaan dan kepelbagaian duniaTo grow and nurture local information resources and cultural representation that facilitates the national identity and global diversity
Mengawal selia bagi faedah jangka panjang pengguna akhirTo regulate for the long-term benefit of the end user
Menggalakkan tahap keyakinan pengguna yang tinggi dalam penyampaian perkhidmatan daripada industri To promote a high level of consumer confidence in service delivery from the industry
Memastikan penyediaan perkhidmatan sama rata yang mampu dibayar melalui infrastruktur kebangsaan yang sentiasa adaTo ensure an equitable provision of affordable services over ubiquitous national infrastructure
Mewujudkan suasana aplikasi yang giat bagi pengguna akhirTo create a robust applications environment for end users
Memudahkan pengagihan secara berkesan sumber seperti tenaga buruh mahir, modal, pengetahuan dan aset kebangsaanTo facilitate the efficient allocation of resources such as skilled labour, capital, knowledge and national assets
Menggalakkan pembinaan keupayaan dan kecekapan dalam industri percantuman MalaysiaTo promote the development of capabilities and skills within Malaysia’s convergence industries;
Menjamin keselamatan maklumat dan kebolehpercayaan dan keutuhan rangkaianTo ensure information security and network reliability and integrity
10 Matlamat Dasar Kebangsaan bagi Industri Komunikasi dan MultimediaNational Policy Objectives for the Communications & Multimedia Industry
ii Communications & Multimedia • Selected Facts & Figures Q4 2010 Communications & Multimedia • Selected Facts & Figures Q4 2010
10 Matlamat Dasar Kebangsaan bagi Industri Komunikasi dan Multimedia10 National Policy Objectives for the Communications and Multimedia Industry
NotaNotes
Simbol dan singkatanSymbols and abbreviations
PETUNJUK-PETUNJUK ASAS BASIC INDICATORS
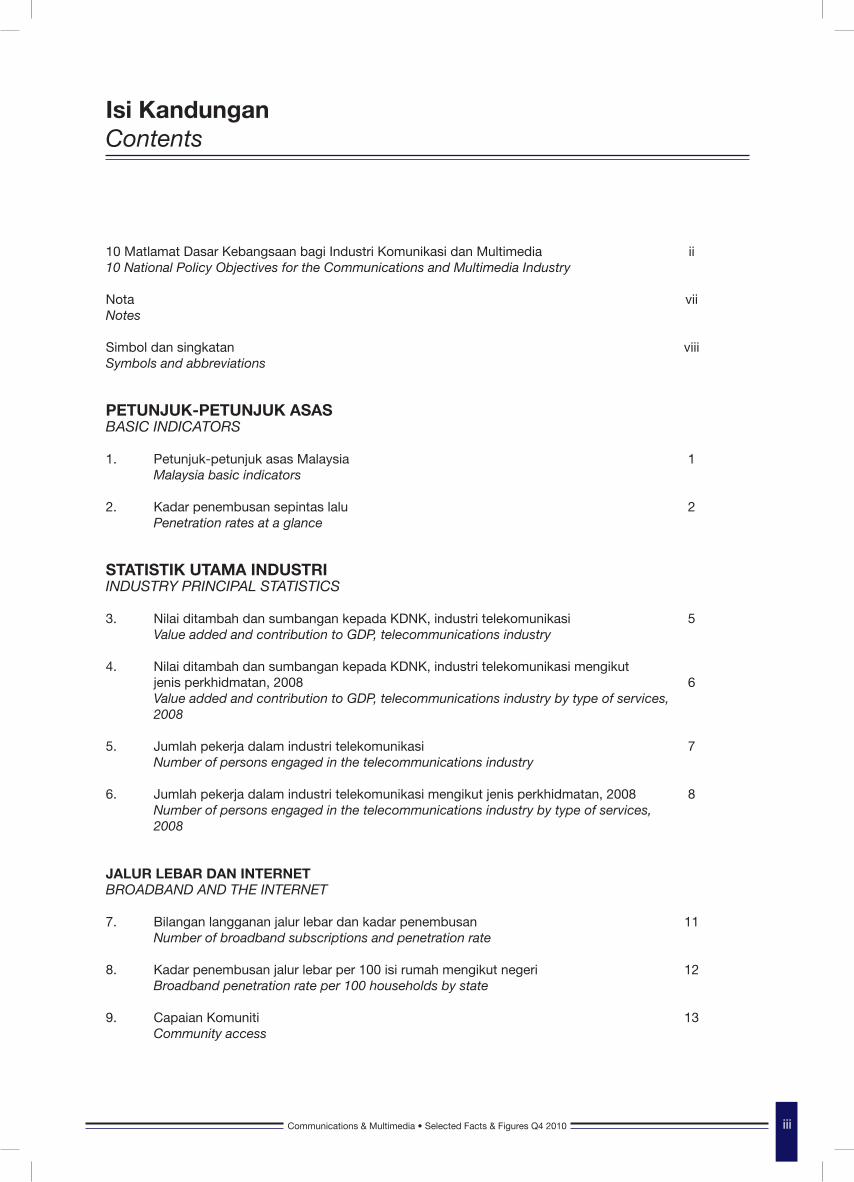
1. Petunjuk-petunjuk asas Malaysia Malaysia basic indicators
2. Kadar penembusan sepintas lalu Penetration rates at a glance
STATISTIK UTAMA INDUSTRIINDUSTRY PRINCIPAL STATISTICS
3. Nilai ditambah dan sumbangan kepada KDNK, industri telekomunikasi Value added and contribution to GDP, telecommunications industry
4. Nilai ditambah dan sumbangan kepada KDNK, industri telekomunikasi mengikut jenis perkhidmatan, 2008 Value added and contribution to GDP, telecommunications industry by type of services, 2008
5. Jumlah pekerja dalam industri telekomunikasi Number of persons engaged in the telecommunications industry
6. Jumlah pekerja dalam industri telekomunikasi mengikut jenis perkhidmatan, 2008 Number of persons engaged in the telecommunications industry by type of services, 2008
JALUR LEBAR DAN INTERNETBROADBAND AND THE INTERNET
7. Bilangan langganan jalur lebar dan kadar penembusan Number of broadband subscriptions and penetration rate 8. Kadar penembusan jalur lebar per 100 isi rumah mengikut negeri Broadband penetration rate per 100 households by state
9. Capaian Komuniti Community access
ii
vii
viii
1
2
5
6
7
8
11
12
13
Isi KandunganContents
iiiCommunications & Multimedia • Selected Facts & Figures Q4 2010 Communications & Multimedia • Selected Facts & Figures Q4 2010
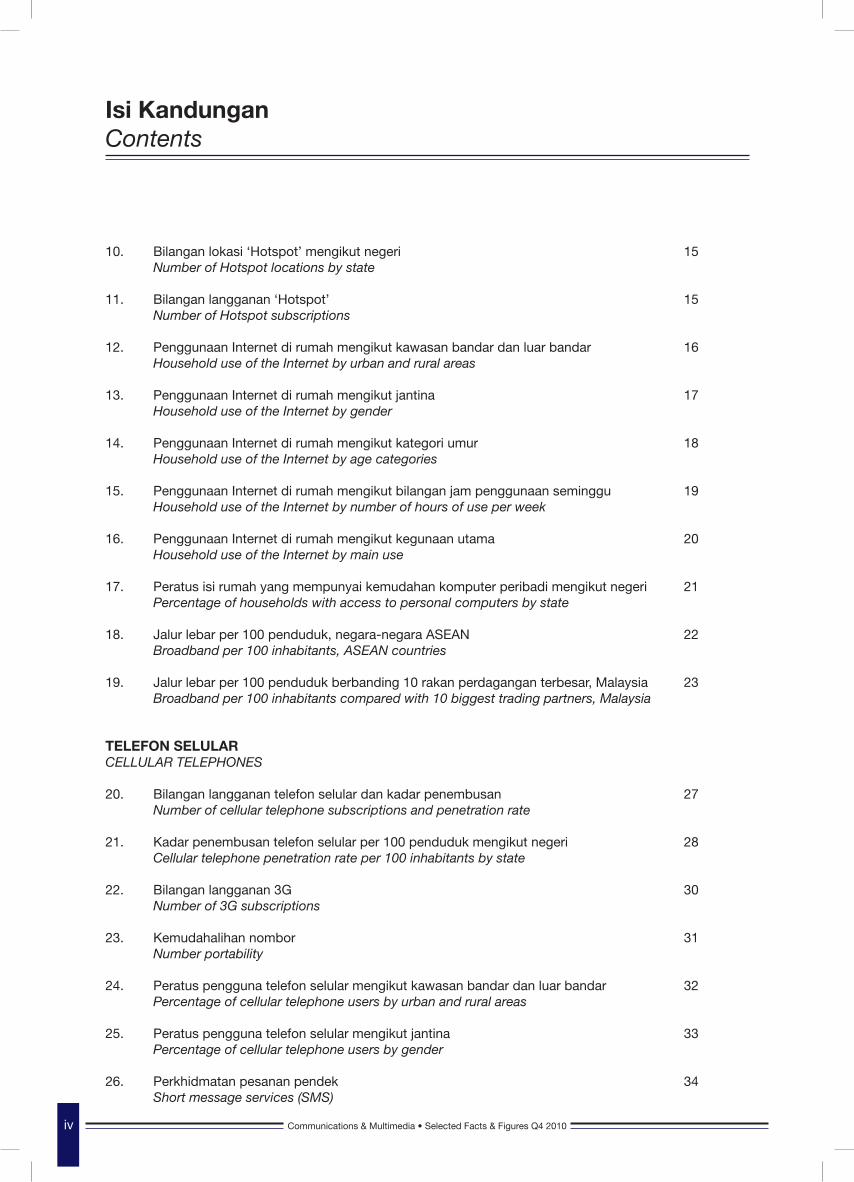
Isi KandunganContents
10. Bilangan lokasi ‘Hotspot’ mengikut negeri Number of Hotspot locations by state 11. Bilangan langganan ‘Hotspot’ Number of Hotspot subscriptions
12. Penggunaan Internet di rumah mengikut kawasan bandar dan luar bandar Household use of the Internet by urban and rural areas
13. Penggunaan Internet di rumah mengikut jantina Household use of the Internet by gender
14. Penggunaan Internet di rumah mengikut kategori umur Household use of the Internet by age categories
15. Penggunaan Internet di rumah mengikut bilangan jam penggunaan seminggu Household use of the Internet by number of hours of use per week
16. Penggunaan Internet di rumah mengikut kegunaan utama Household use of the Internet by main use
17. Peratus isi rumah yang mempunyai kemudahan komputer peribadi mengikut negeri Percentage of households with access to personal computers by state
18. Jalur lebar per 100 penduduk, negara-negara ASEAN Broadband per 100 inhabitants, ASEAN countries
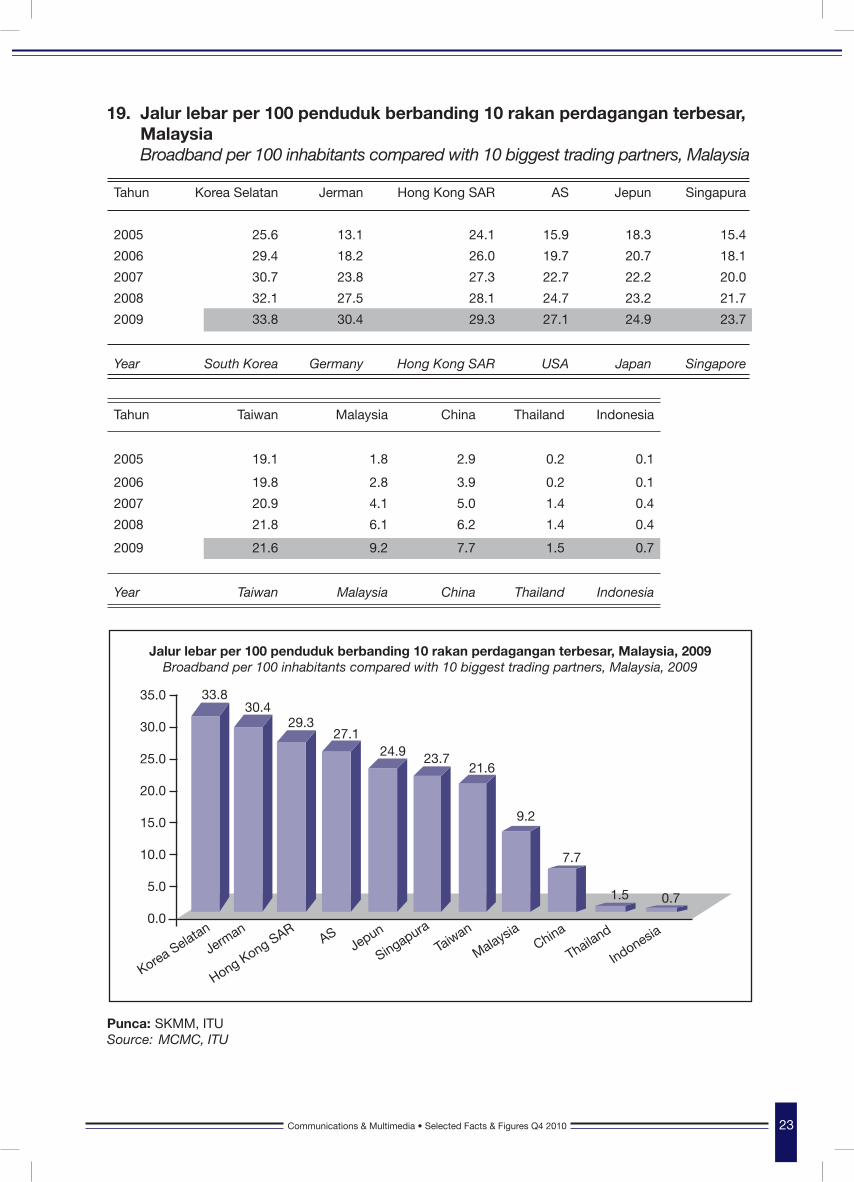
19. Jalur lebar per 100 penduduk berbanding 10 rakan perdagangan terbesar, Malaysia Broadband per 100 inhabitants compared with 10 biggest trading partners, Malaysia
TELEFON SELULARCELLULAR TELEPHONES
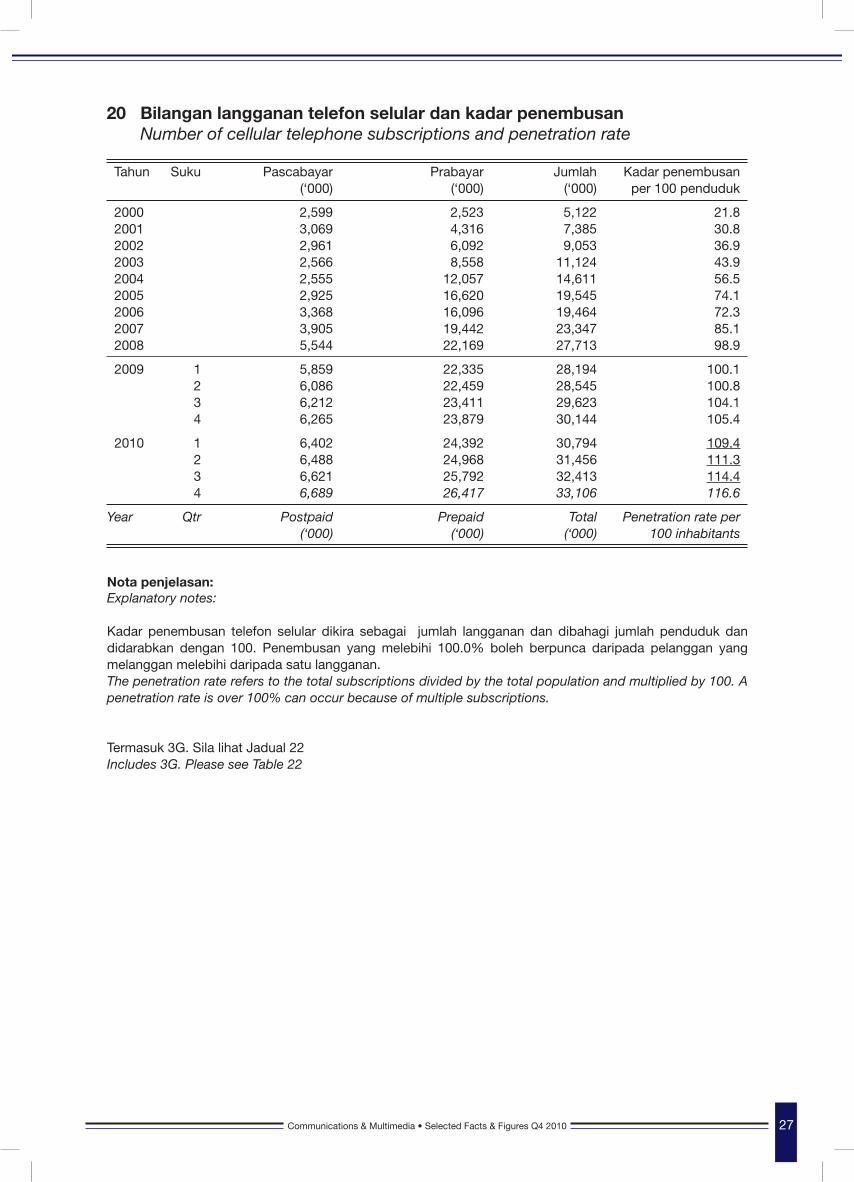
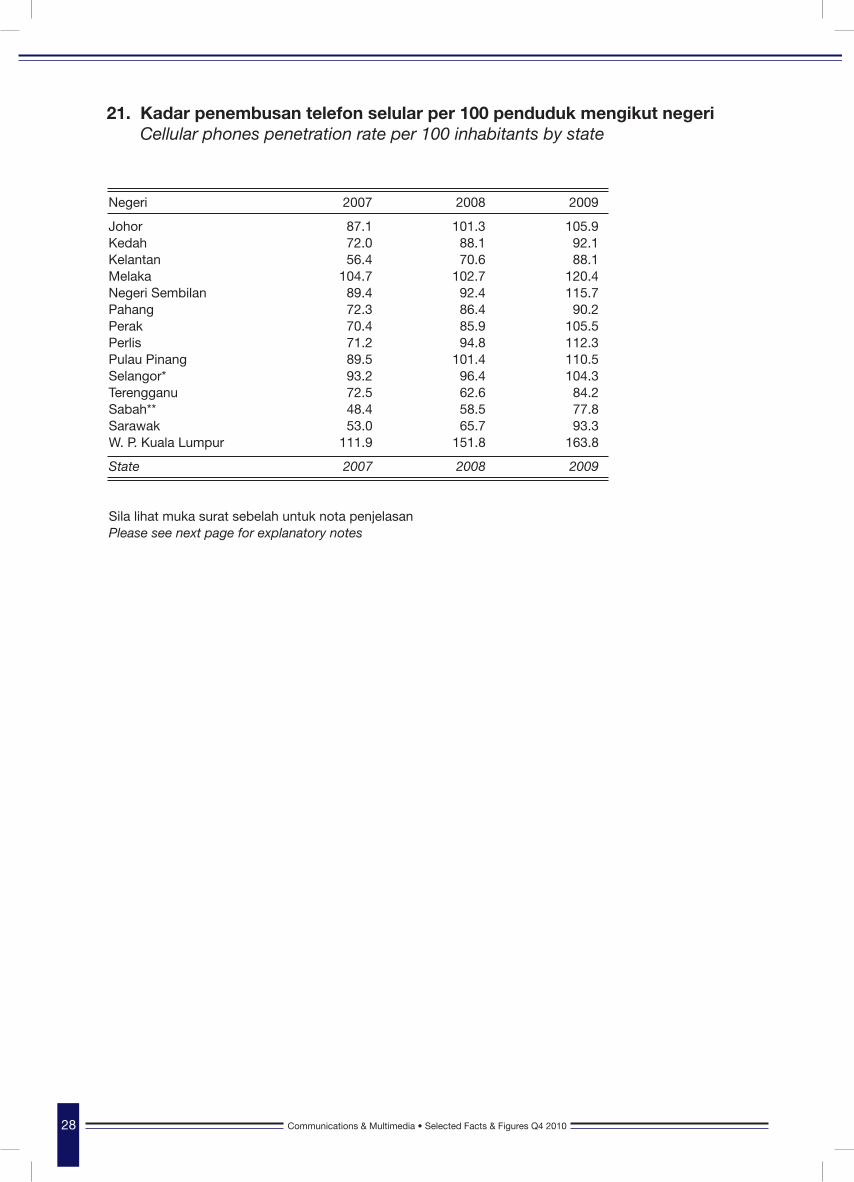
20. Bilangan langganan telefon selular dan kadar penembusan Number of cellular telephone subscriptions and penetration rate 21. Kadar penembusan telefon selular per 100 penduduk mengikut negeri Cellular telephone penetration rate per 100 inhabitants by state
22. Bilangan langganan 3G Number of 3G subscriptions
23. Kemudahalihan nombor Number portability 24. Peratus pengguna telefon selular mengikut kawasan bandar dan luar bandar Percentage of cellular telephone users by urban and rural areas
25. Peratus pengguna telefon selular mengikut jantina Percentage of cellular telephone users by gender
26. Perkhidmatan pesanan pendek Short message services (SMS)
15
15
16
17
18
19
20
21
22
23
27
28
30
31
32
33
34
iv Communications & Multimedia • Selected Facts & Figures Q4 2010 Communications & Multimedia • Selected Facts & Figures Q4 2010

27. Telefon selular per 100 penduduk, negara-negara ASEAN Cellular telephone per 100 inhabitants, ASEAN countries
28. Telefon selular per 100 penduduk berbanding 10 rakan perdagangan terbesar, Malaysia Cellular telephone per 100 inhabitants compared with 10 biggest trading partners, Malaysia
TALIAN IBUSAWAT TERUS DAN TELEFON AWAMDEL AND PUBLIC PAYPHONES
29. Bilangan Talian Ibusawat Terus dan kadar penembusan Number of DEL Connections and penetration rate
30. Kadar penembusan Talian Ibusawat Terus per 100 isi rumah mengikut negeri DEL penetration rate per 100 households by state 31. Peratus langganan isi rumah Talian Ibusawat Terus mengikut kawasan bandar dan luar bandar Percentage of DEL household subscriptions by urban and rural areas
32. Rangkaian Talian Ibusawat Terus, kapasiti digunakan DEL network, capacity used
33. Bilangan telefon awam Number of public payphones
34. Bilangan telefon awam per 1000 penduduk mengikut negeri Number of public payphones per 1000 inhabitants by state
35. Peratus telefon awam mengikut kawasan bandar dan luar bandar Percentage of public payphones by urban and rural areas
36. Talian telefon utama per 100 penduduk, negara-negara ASEAN Main telephone lines per 100 inhabitants, ASEAN countries
37. Talian telefon utama per 100 penduduk berbanding 10 rakan perdagangan terbesar, Malaysia Main telephone lines per 100 inhabitants compared with 10 biggest trading partners, Malaysia
RADIO DAN TVRADIO AND TV
38. Peratus isi rumah yang mempunyai kemudahan peralatan Radio/Hi-fi mengikut negeri Percentage of households with access to Radio/Hi-fi by state
39. Peratus isi rumah yang mempunyai kemudahan peralatan televisyen mengikut negeri Percentage of households with access to television by state
35
36
39
40
41
42
43
44
45
46
47
51
52
Isi KandunganContents
vCommunications & Multimedia • Selected Facts & Figures Q4 2010 Communications & Multimedia • Selected Facts & Figures Q4 2010
Isi KandunganContents
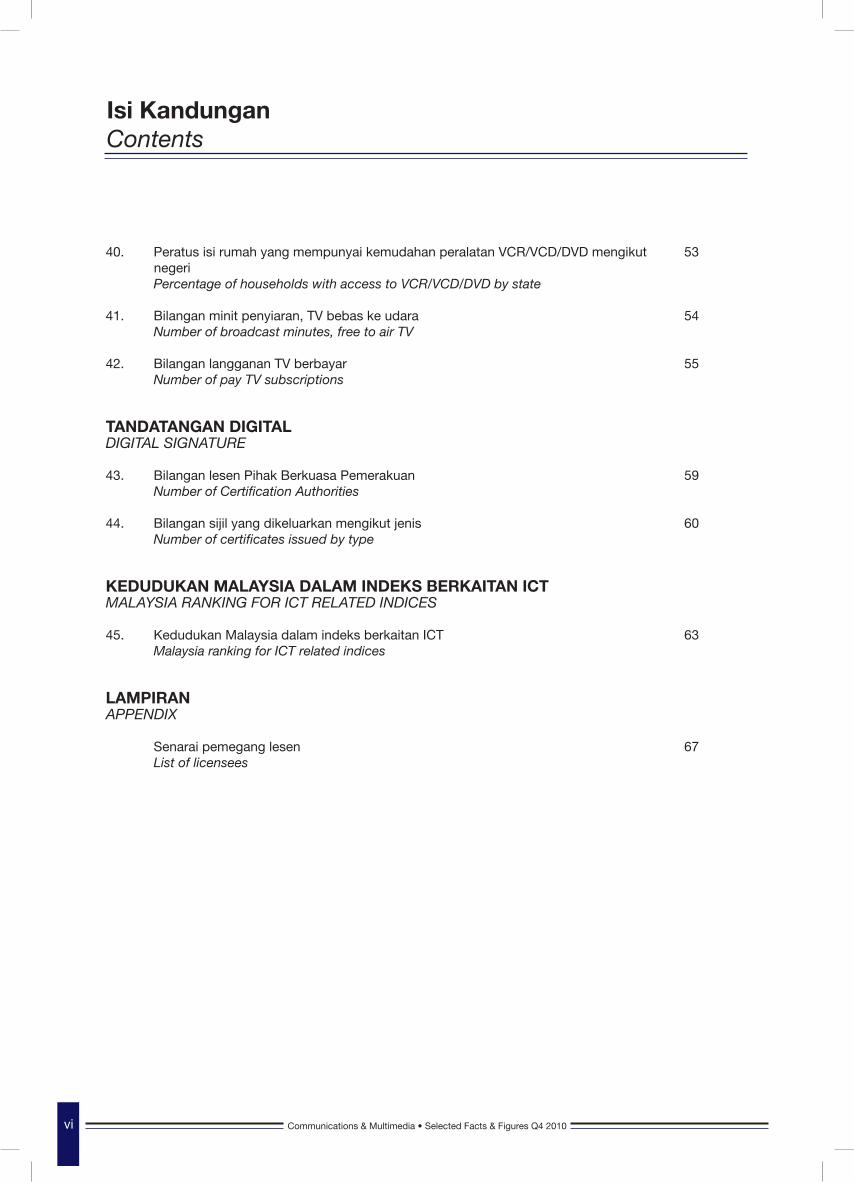
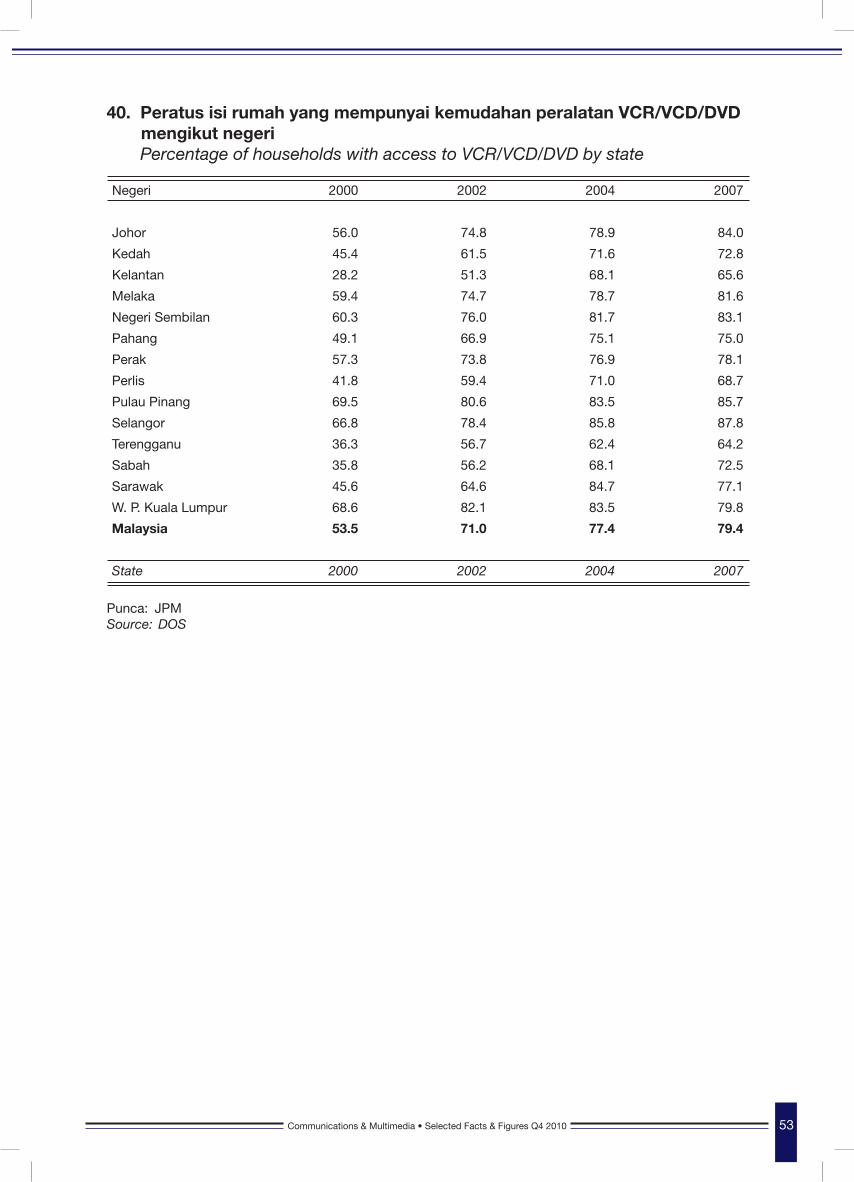
40. Peratus isi rumah yang mempunyai kemudahan peralatan VCR/VCD/DVD mengikut negeri Percentage of households with access to VCR/VCD/DVD by state
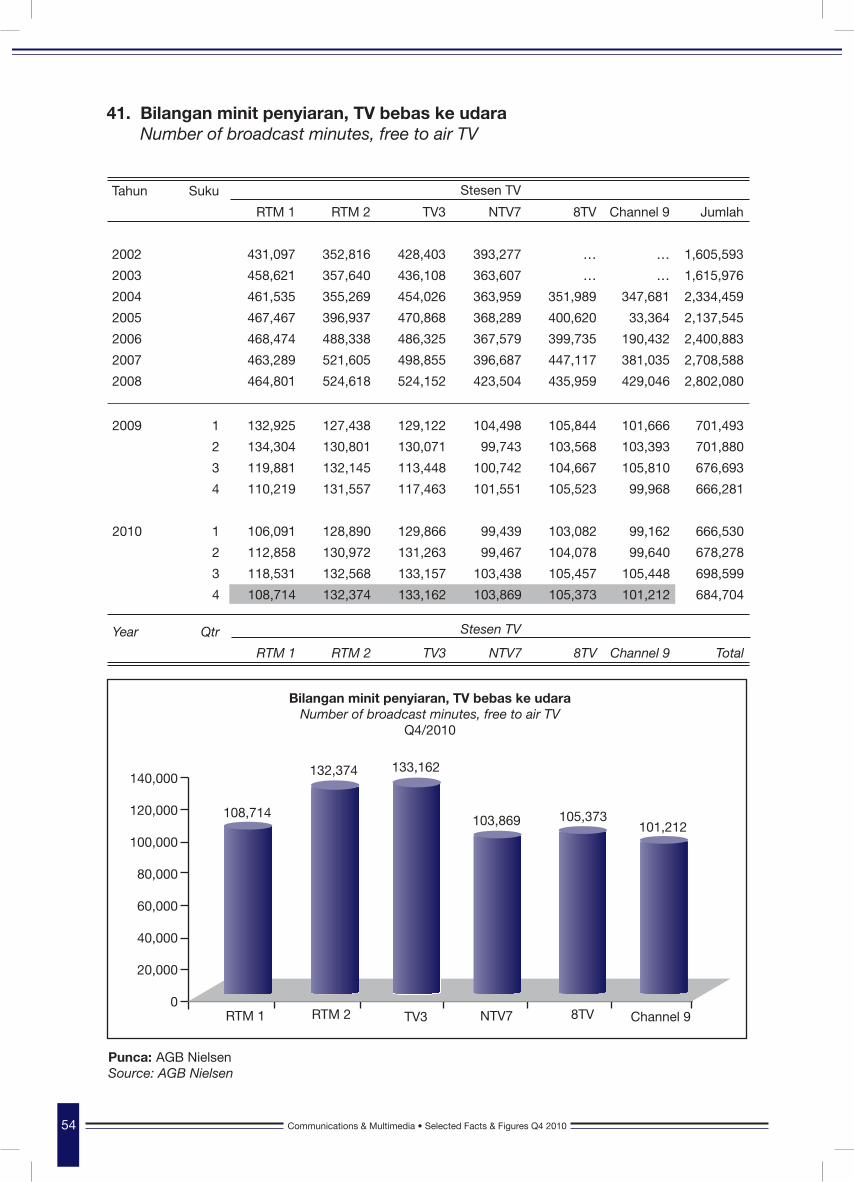
41. Bilangan minit penyiaran, TV bebas ke udara Number of broadcast minutes, free to air TV
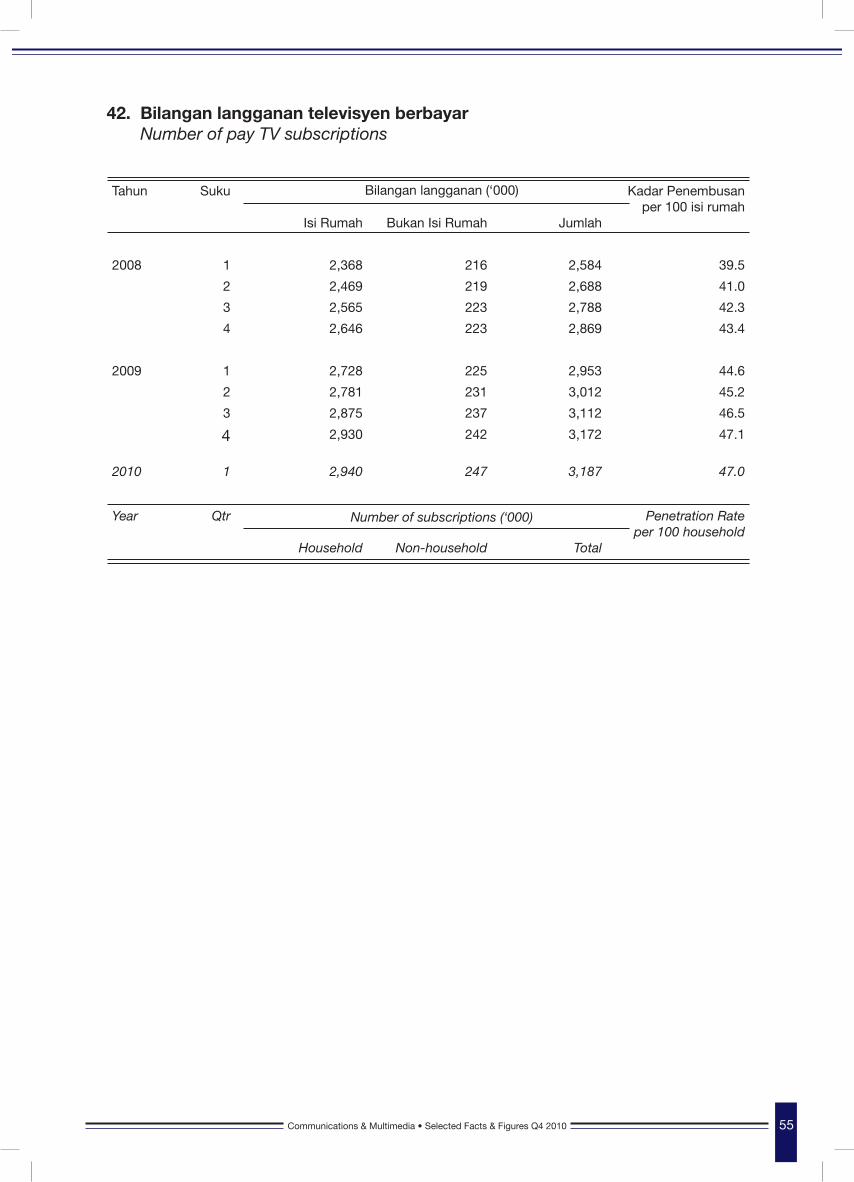
42. Bilangan langganan TV berbayar Number of pay TV subscriptions
TANDATANGAN DIGITALDIGITAL SIGNATURE
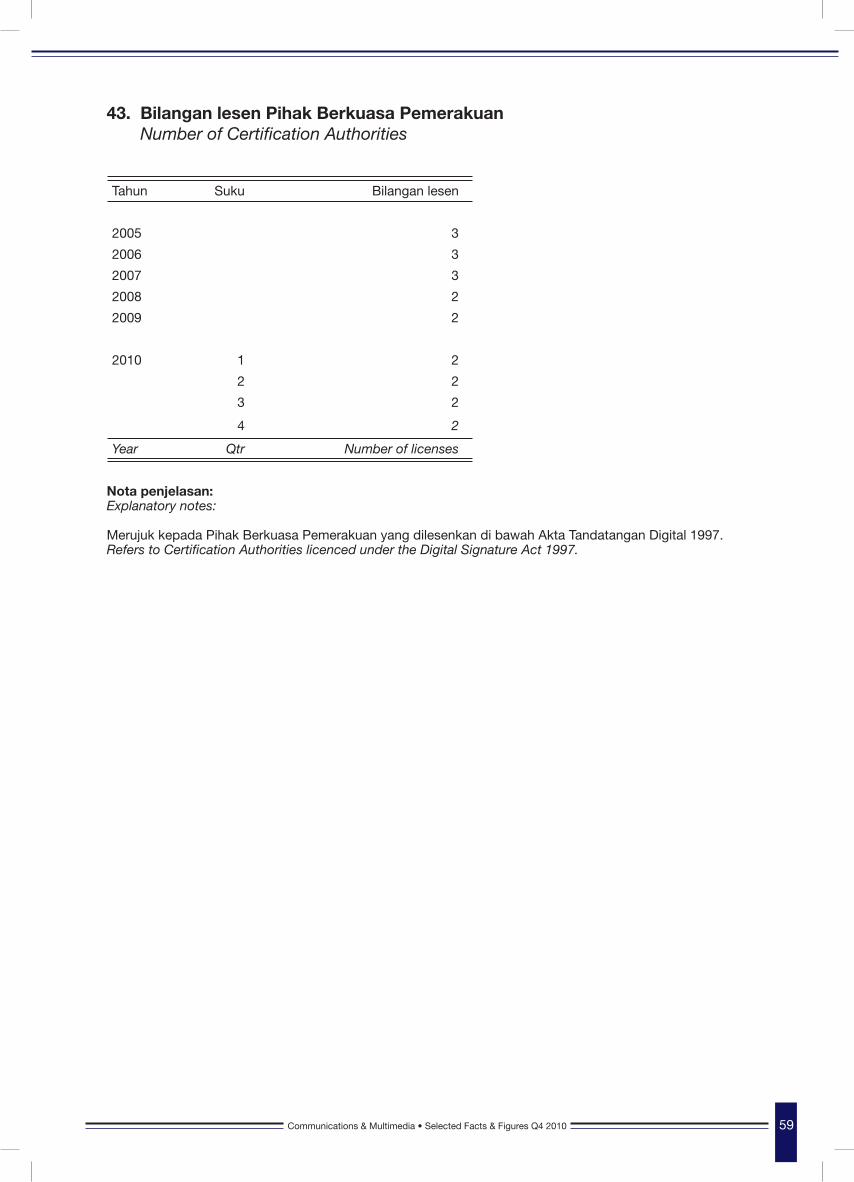
43. Bilangan lesen Pihak Berkuasa Pemerakuan Number of Certification Authorities
44. Bilangan sijil yang dikeluarkan mengikut jenis Number of certificates issued by type
KEDUDUKAN MALAYSIA DALAM INDEKS BERKAITAN ICTMALAYSIA RANKING FOR ICT RELATED INDICES
45. Kedudukan Malaysia dalam indeks berkaitan ICT Malaysia ranking for ICT related indices
LAMPIRANAPPENDIX
Senarai pemegang lesen List of licensees
53
54
55
59
60
63
67
vi Communications & Multimedia • Selected Facts & Figures Q4 2010 Communications & Multimedia • Selected Facts & Figures Q4 2010
Nota Notes
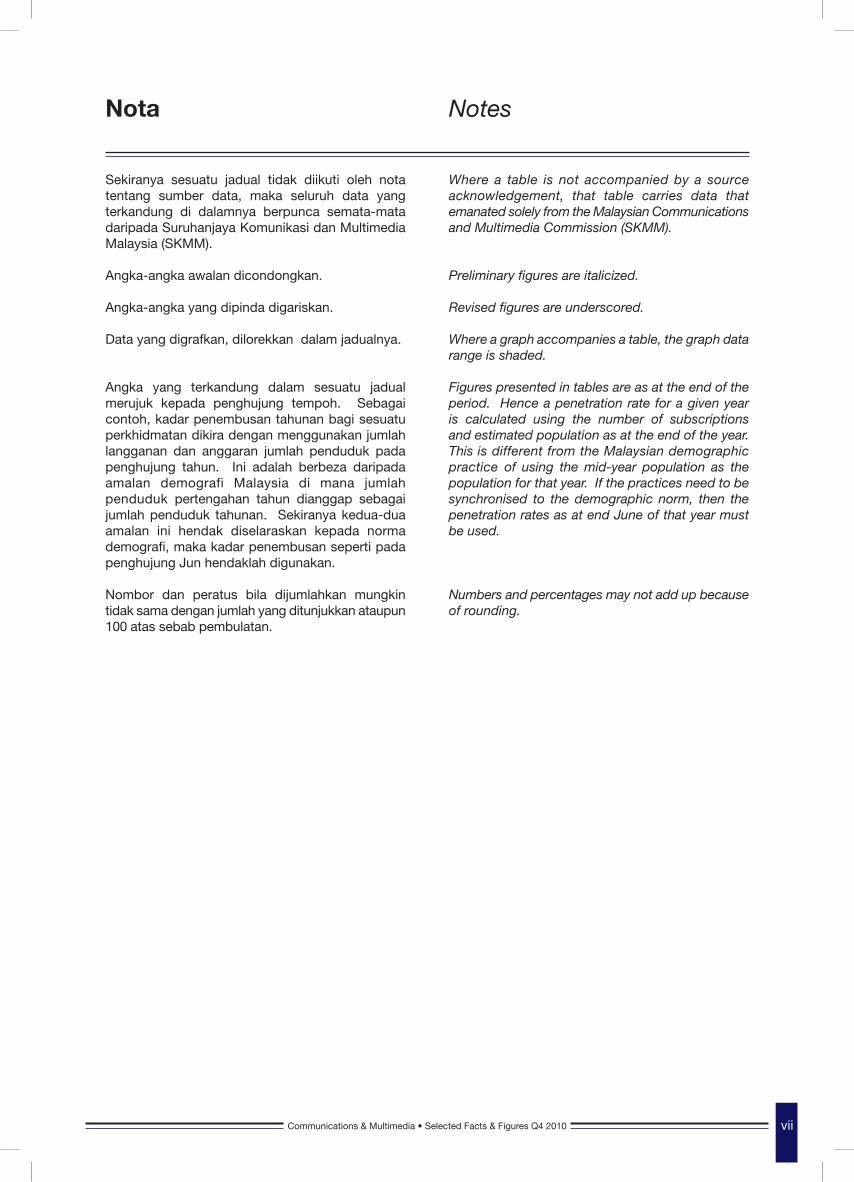
Sekiranya sesuatu jadual tidak diikuti oleh nota tentang sumber data, maka seluruh data yang terkandung di dalamnya berpunca semata-mata daripada Suruhanjaya Komunikasi dan Multimedia Malaysia (SKMM).
Angka-angka awalan dicondongkan.
Angka-angka yang dipinda digariskan. Data yang digrafkan, dilorekkan dalam jadualnya.
Angka yang terkandung dalam sesuatu jadual merujuk kepada penghujung tempoh. Sebagai contoh, kadar penembusan tahunan bagi sesuatu perkhidmatan dikira dengan menggunakan jumlah langganan dan anggaran jumlah penduduk pada penghujung tahun. Ini adalah berbeza daripada amalan demografi Malaysia di mana jumlah penduduk pertengahan tahun dianggap sebagai jumlah penduduk tahunan. Sekiranya kedua-dua amalan ini hendak diselaraskan kepada norma demografi, maka kadar penembusan seperti pada penghujung Jun hendaklah digunakan.
Nombor dan peratus bila dijumlahkan mungkin tidak sama dengan jumlah yang ditunjukkan ataupun 100 atas sebab pembulatan.
Where a table is not accompanied by a source acknowledgement, that table carries data that emanated solely from the Malaysian Communications and Multimedia Commission (SKMM).
Preliminary figures are italicized.
Revised figures are underscored.
Where a graph accompanies a table, the graph data range is shaded.
Figures presented in tables are as at the end of the period. Hence a penetration rate for a given year is calculated using the number of subscriptions and estimated population as at the end of the year. This is different from the Malaysian demographic practice of using the mid-year population as the population for that year. If the practices need to be synchronised to the demographic norm, then the penetration rates as at end June of that year must be used.
Numbers and percentages may not add up because of rounding.
viiCommunications & Multimedia • Selected Facts & Figures Q4 2010 Communications & Multimedia • Selected Facts & Figures Q4 2010
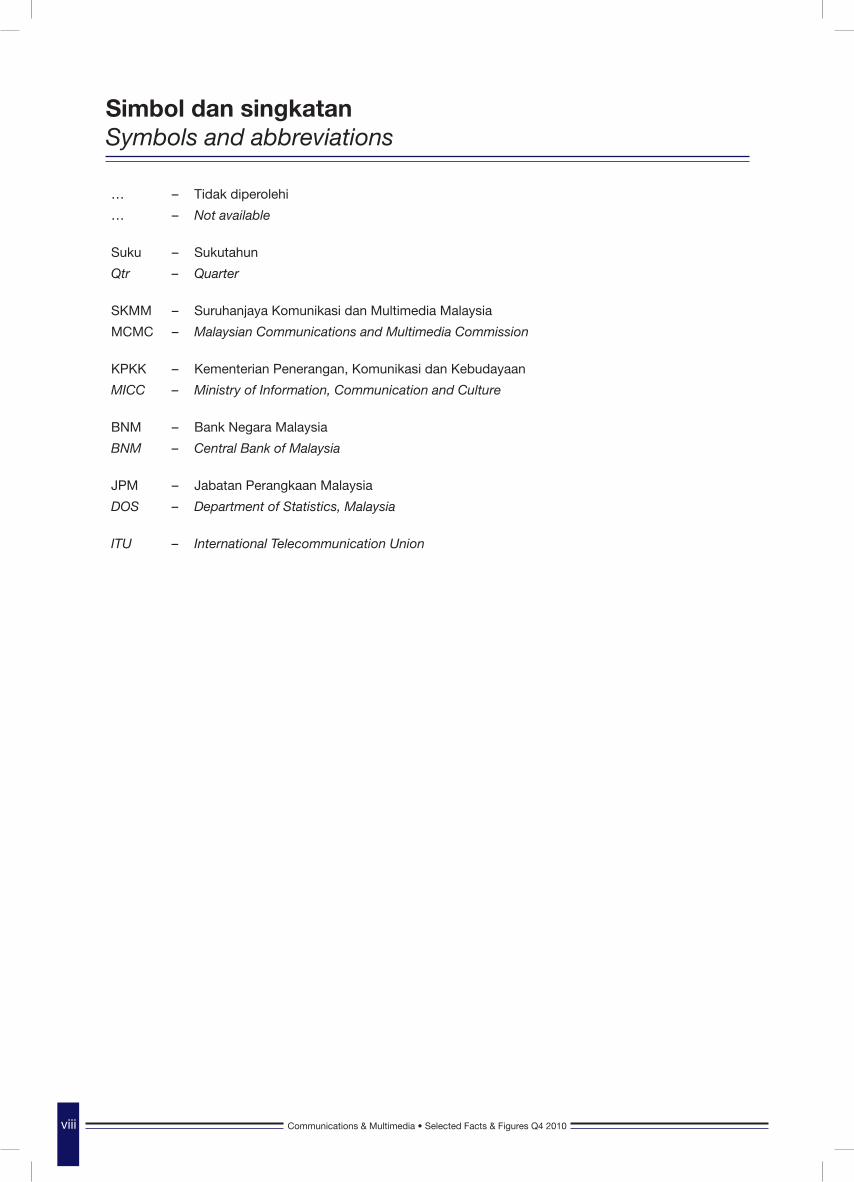
… – Tidak diperolehi
… – Not available
Suku – Sukutahun
Qtr – Quarter
SKMM – Suruhanjaya Komunikasi dan Multimedia Malaysia
MCMC – Malaysian Communications and Multimedia Commission
KPKK – Kementerian Penerangan, Komunikasi dan Kebudayaan
MICC – Ministry of Information, Communication and Culture
BNM – Bank Negara Malaysia
BNM – Central Bank of Malaysia
JPM – Jabatan Perangkaan Malaysia
DOS – Department of Statistics, Malaysia
ITU – International Telecommunication Union
Simbol dan singkatanSymbols and abbreviations
viii Communications & Multimedia • Selected Facts & Figures Q4 2010

KOMUNIKASI & MULTIMEDIAFAKTA & ANGKA TERPILIH
COMMUNICATIONS & MULTIMEDIASELECTED FACTS & FIGURES
Q42 0 1 0

1Communications & Multimedia • Selected Facts & Figures Q4 2010
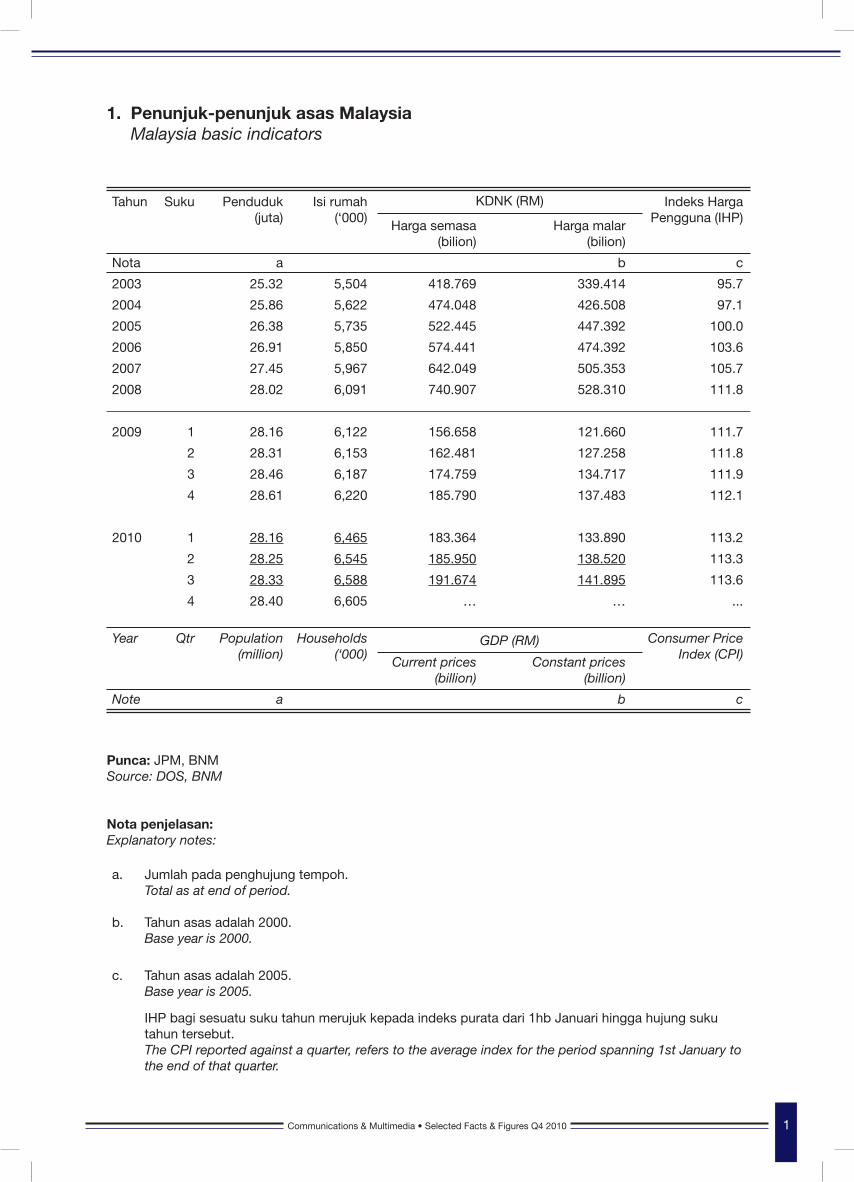
1. Penunjuk-penunjuk asas Malaysia Malaysia basic indicators
Tahun Suku Penduduk (juta)
Isi rumah (‘000)
Harga semasa (bilion)
Harga malar(bilion)
Indeks Harga Pengguna (IHP)
Nota a b c
2003 25.32 5,504 418.769 339.414 95.7
2004 25.86 5,622 474.048 426.508 97.1
2005 26.38 5,735 522.445 447.392 100.0
2006 26.91 5,850 574.441 474.392 103.6
2007 27.45 5,967 642.049 505.353 105.7
2008 28.02 6,091 740.907 528.310 111.8
2009 1 28.16 6,122 156.658 121.660 111.7
2 28.31 6,153 162.481 127.258 111.8
3 28.46 6,187 174.759 134.717 111.9
4 28.61 6,220 185.790 137.483 112.1
2010 1 28.16 6,465 183.364 133.890 113.2
2 28.25 6,545 185.950 138.520 113.3
3 28.33 6,588 191.674 141.895 113.6
4 28.40 6,605 … … ...
Year Qtr Population (million)
Households (‘000)
Current prices (billion)
Constant prices(billion)
Consumer Price Index (CPI)
Note a b c
KDNK (RM)
GDP (RM)
Punca: JPM, BNMSource: DOS, BNM
Nota penjelasan: Explanatory notes:
a.
b.
Jumlah pada penghujung tempoh.Total as at end of period.
Tahun asas adalah 2000. Base year is 2000.
c. Tahun asas adalah 2005. Base year is 2005.
IHP bagi sesuatu suku tahun merujuk kepada indeks purata dari 1hb Januari hingga hujung suku tahun tersebut. The CPI reported against a quarter, refers to the average index for the period spanning 1st January to the end of that quarter.
2 Communications & Multimedia • Selected Facts & Figures Q4 2010 Communications & Multimedia • Selected Facts & Figures Q4 2010
Tahun Suku Talian Ibusawat Terus Jalur lebar Telefon selular
Per 100 Per 100 Per 100 Per 100 isi rumah penduduk Isi rumah penduduk
Nota a b c d
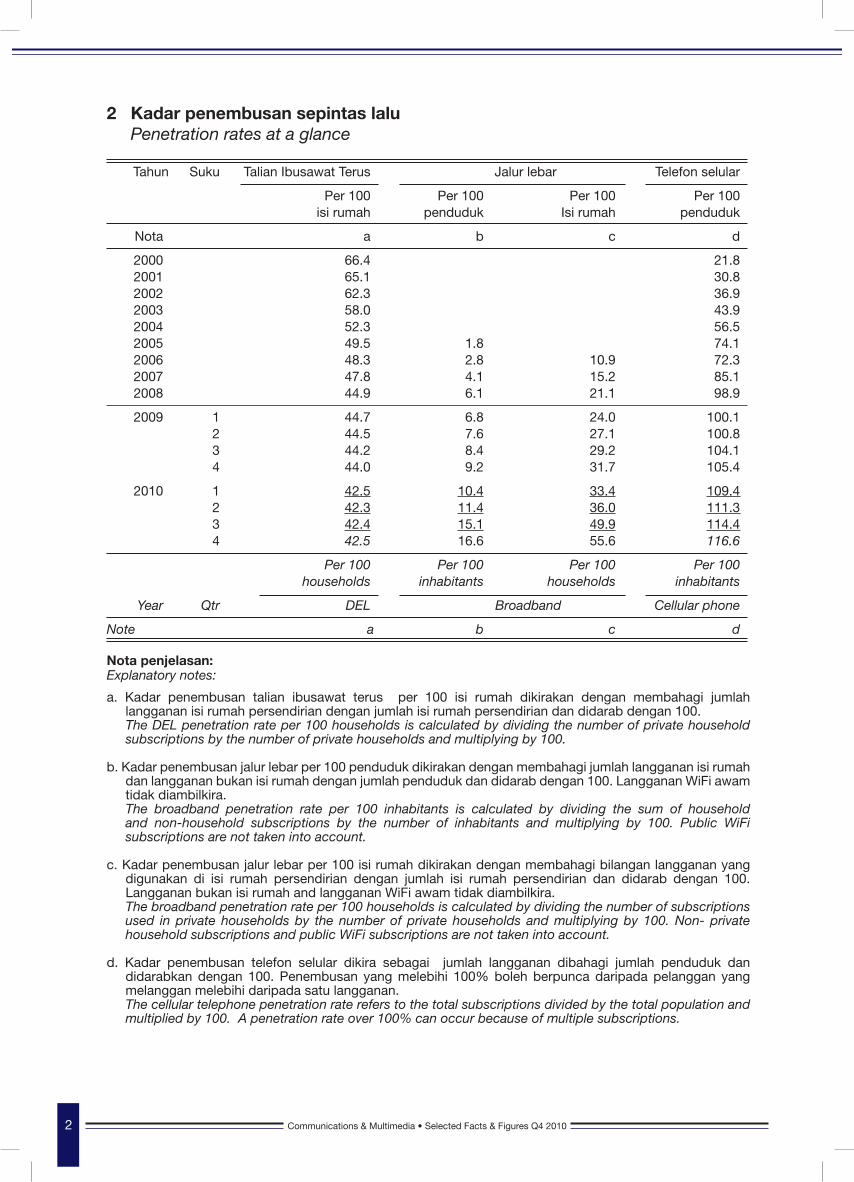
2000 66.4 21.8 2001 65.1 30.8 2002 62.3 36.9 2003 58.0 43.9 2004 52.3 56.5 2005 49.5 1.8 74.1 2006 48.3 2.8 10.9 72.3 2007 47.8 4.1 15.2 85.1 2008 44.9 6.1 21.1 98.9
2009 1 44.7 6.8 24.0 100.1 2 44.5 7.6 27.1 100.8 3 44.2 8.4 29.2 104.1 4 44.0 9.2 31.7 105.4
2010 1 42.5 10.4 33.4 109.4 2 42.3 11.4 36.0 111.3 3 42.4 15.1 49.9 114.4 4 42.5 16.6 55.6 116.6
Per 100 Per 100 Per 100 Per 100 households inhabitants households inhabitants
Year Qtr DEL Broadband Cellular phone
Note a b c d
Nota penjelasan: Explanatory notes:
a. Kadar penembusan talian ibusawat terus per 100 isi rumah dikirakan dengan membahagi jumlah langganan isi rumah persendirian dengan jumlah isi rumah persendirian dan didarab dengan 100. The DEL penetration rate per 100 households is calculated by dividing the number of private household subscriptions by the number of private households and multiplying by 100.
b. Kadar penembusan jalur lebar per 100 penduduk dikirakan dengan membahagi jumlah langganan isi rumah dan langganan bukan isi rumah dengan jumlah penduduk dan didarab dengan 100. Langganan WiFi awam tidak diambilkira.
The broadband penetration rate per 100 inhabitants is calculated by dividing the sum of household and non-household subscriptions by the number of inhabitants and multiplying by 100. Public WiFi subscriptions are not taken into account.
c. Kadar penembusan jalur lebar per 100 isi rumah dikirakan dengan membahagi bilangan langganan yang
digunakan di isi rumah persendirian dengan jumlah isi rumah persendirian dan didarab dengan 100. Langganan bukan isi rumah and langganan WiFi awam tidak diambilkira. The broadband penetration rate per 100 households is calculated by dividing the number of subscriptions used in private households by the number of private households and multiplying by 100. Non- private household subscriptions and public WiFi subscriptions are not taken into account.
d. Kadar penembusan telefon selular dikira sebagai jumlah langganan dibahagi jumlah penduduk dan didarabkan dengan 100. Penembusan yang melebihi 100% boleh berpunca daripada pelanggan yang melanggan melebihi daripada satu langganan.
The cellular telephone penetration rate refers to the total subscriptions divided by the total population and multiplied by 100. A penetration rate over 100% can occur because of multiple subscriptions.
2 Kadar penembusan sepintas lalu Penetration rates at a glance

KOMUNIKASI & MULTIMEDIAFAKTA & ANGKA TERPILIH
COMMUNICATIONS & MULTIMEDIASELECTED FACTS & FIGURES
Q42 0 1 0

Communications & Multimedia • Selected Facts & Figures Q4 2010 5Communications & Multimedia • Selected Facts & Figures Q4 2010
(‘000)
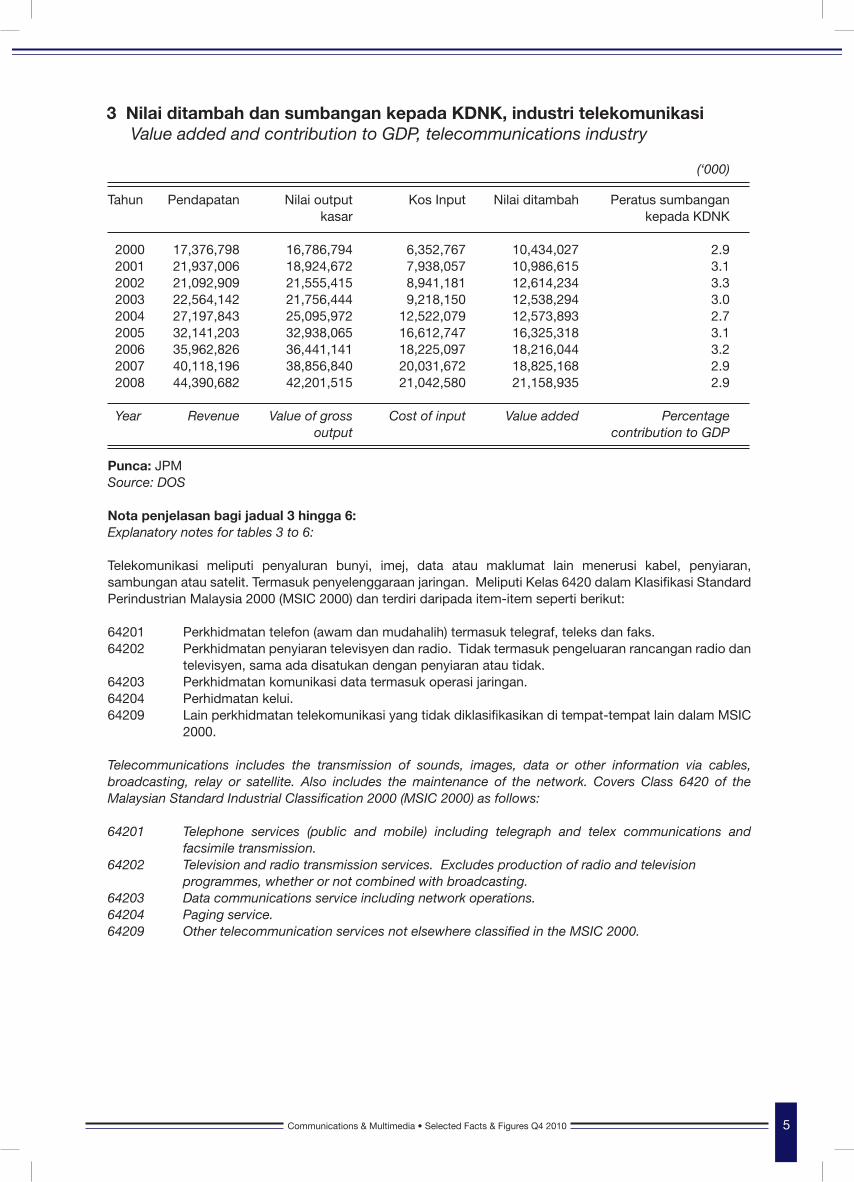
Tahun Pendapatan Nilai output Kos Input Nilai ditambah Peratus sumbangan kasar kepada KDNK 2000 17,376,798 16,786,794 6,352,767 10,434,027 2.9 2001 21,937,006 18,924,672 7,938,057 10,986,615 3.1 2002 21,092,909 21,555,415 8,941,181 12,614,234 3.3 2003 22,564,142 21,756,444 9,218,150 12,538,294 3.0 2004 27,197,843 25,095,972 12,522,079 12,573,893 2.7 2005 32,141,203 32,938,065 16,612,747 16,325,318 3.1 2006 35,962,826 36,441,141 18,225,097 18,216,044 3.2 2007 40,118,196 38,856,840 20,031,672 18,825,168 2.9 2008 44,390,682 42,201,515 21,042,580 21,158,935 2.9
Year Revenue Value of gross Cost of input Value added Percentage output contribution to GDP Punca: JPM Source: DOS Nota penjelasan bagi jadual 3 hingga 6:Explanatory notes for tables 3 to 6:
Telekomunikasi meliputi penyaluran bunyi, imej, data atau maklumat lain menerusi kabel, penyiaran, sambungan atau satelit. Termasuk penyelenggaraan jaringan. Meliputi Kelas 6420 dalam Klasifikasi Standard Perindustrian Malaysia 2000 (MSIC 2000) dan terdiri daripada item-item seperti berikut:
64201 Perkhidmatan telefon (awam dan mudahalih) termasuk telegraf, teleks dan faks.64202 Perkhidmatan penyiaran televisyen dan radio. Tidak termasuk pengeluaran rancangan radio dan
televisyen, sama ada disatukan dengan penyiaran atau tidak. 64203 Perkhidmatan komunikasi data termasuk operasi jaringan. 64204 Perhidmatan kelui. 64209 Lain perkhidmatan telekomunikasi yang tidak diklasifikasikan di tempat-tempat lain dalam MSIC
2000.
Telecommunications includes the transmission of sounds, images, data or other information via cables, broadcasting, relay or satellite. Also includes the maintenance of the network. Covers Class 6420 of the Malaysian Standard Industrial Classification 2000 (MSIC 2000) as follows:
64201 Telephone services (public and mobile) including telegraph and telex communications and facsimile transmission.
64202 Television and radio transmission services. Excludes production of radio and television programmes, whether or not combined with broadcasting. 64203 Data communications service including network operations. 64204 Paging service. 64209 Other telecommunication services not elsewhere classified in the MSIC 2000.
3 Nilai ditambah dan sumbangan kepada KDNK, industri telekomunikasi Value added and contribution to GDP, telecommunications industry
6 Communications & Multimedia • Selected Facts & Figures Q4 2010 Communications & Multimedia • Selected Facts & Figures Q4 2010
(‘000)
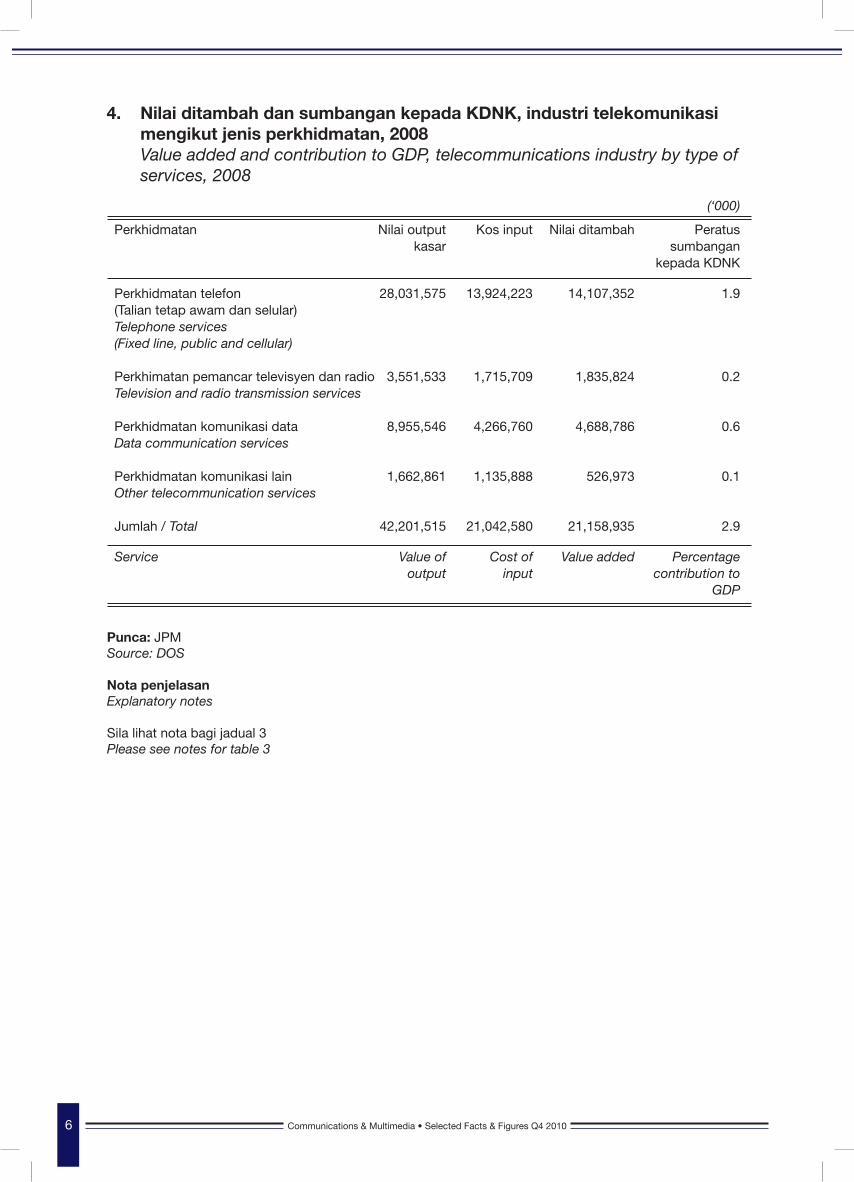
Perkhidmatan Nilai output Kos input Nilai ditambah Peratus kasar sumbangan kepada KDNK
Perkhidmatan telefon 28,031,575 13,924,223 14,107,352 1.9 (Talian tetap awam dan selular) Telephone services (Fixed line, public and cellular)
Perkhimatan pemancar televisyen dan radio 3,551,533 1,715,709 1,835,824 0.2 Television and radio transmission services Perkhidmatan komunikasi data 8,955,546 4,266,760 4,688,786 0.6 Data communication services
Perkhidmatan komunikasi lain 1,662,861 1,135,888 526,973 0.1 Other telecommunication services
Jumlah / Total 42,201,515 21,042,580 21,158,935 2.9
Service Value of Cost of Value added Percentage output input contribution to GDP
Punca: JPMSource: DOS
Nota penjelasanExplanatory notes
Sila lihat nota bagi jadual 3Please see notes for table 3
4. Nilai ditambah dan sumbangan kepada KDNK, industri telekomunikasi mengikut jenis perkhidmatan, 2008 Value added and contribution to GDP, telecommunications industry by type of services, 2008
Communications & Multimedia • Selected Facts & Figures Q4 2010 7Communications & Multimedia • Selected Facts & Figures Q4 2010
Tahun Jumlah pekerja pada bulan Disember atau pada tempoh Gaji dan upah gaji terakhir yang dibayar
Jumlah Pekerja bergaji (‘000)
Sepenuh masa Sambilan
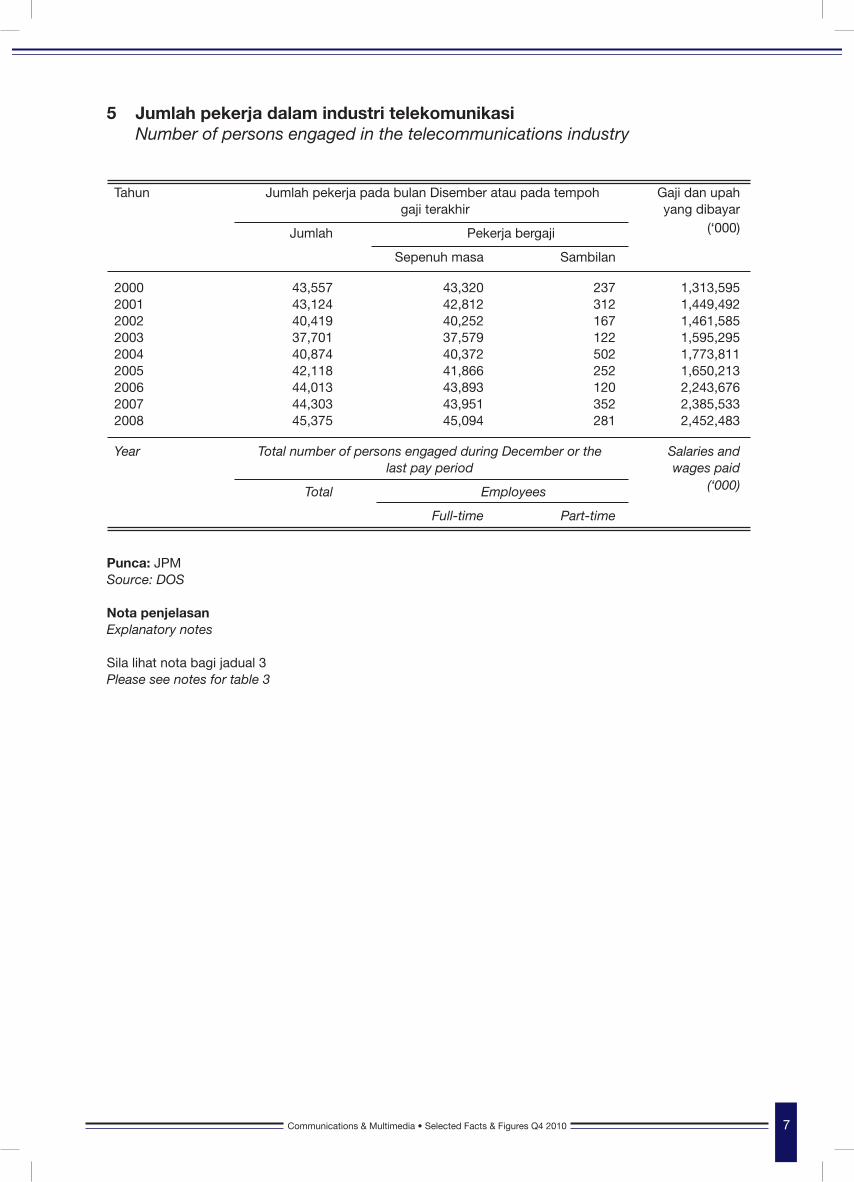
2000 43,557 43,320 237 1,313,595 2001 43,124 42,812 312 1,449,492 2002 40,419 40,252 167 1,461,585 2003 37,701 37,579 122 1,595,295 2004 40,874 40,372 502 1,773,811 2005 42,118 41,866 252 1,650,213 2006 44,013 43,893 120 2,243,676 2007 44,303 43,951 352 2,385,533 2008 45,375 45,094 281 2,452,483
Year Total number of persons engaged during December or the Salaries and last pay period wages paid
Total Employees (‘000)
Full-time Part-time
Punca: JPMSource: DOS Nota penjelasan Explanatory notes Sila lihat nota bagi jadual 3 Please see notes for table 3
5 Jumlah pekerja dalam industri telekomunikasi Number of persons engaged in the telecommunications industry
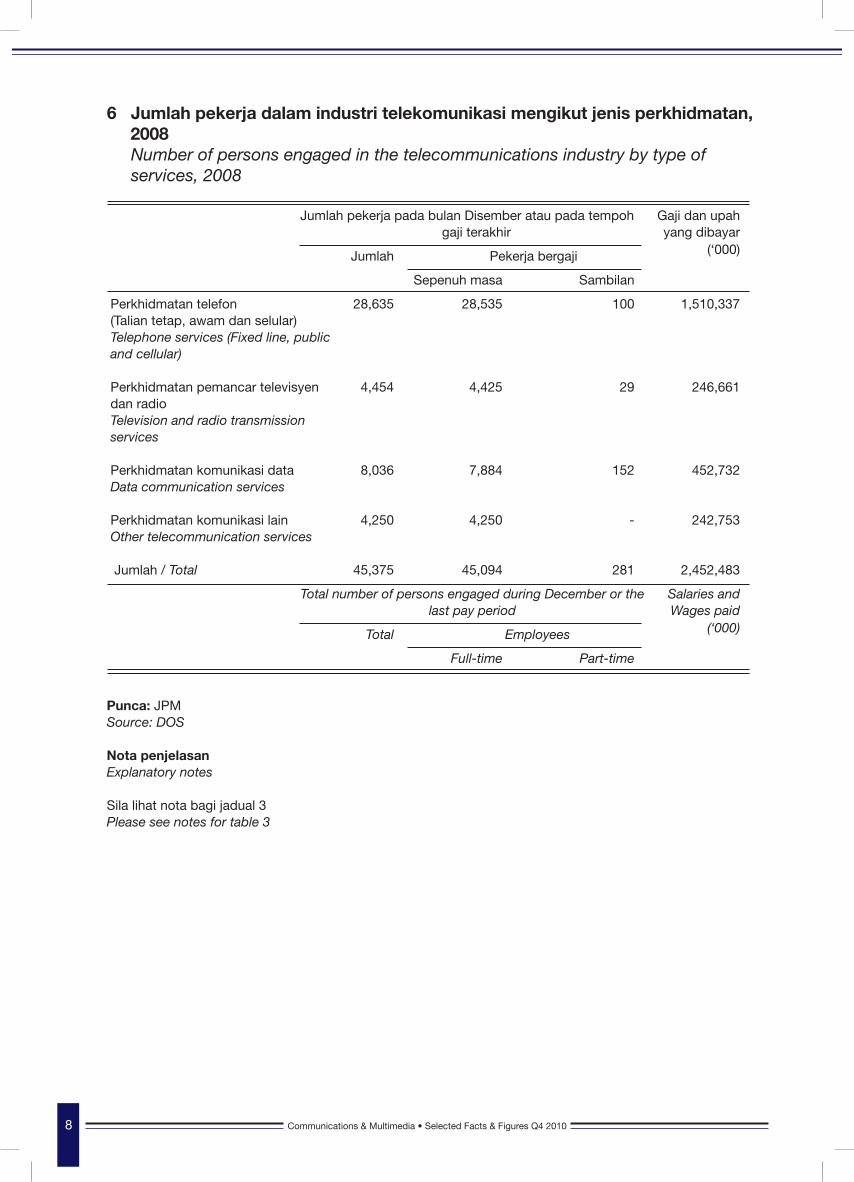
8 Communications & Multimedia • Selected Facts & Figures Q4 2010 Communications & Multimedia • Selected Facts & Figures Q4 2010
Jumlah pekerja pada bulan Disember atau pada tempoh Gaji dan upah gaji terakhir yang dibayar
Jumlah Pekerja bergaji (‘000)
Sepenuh masa Sambilan
Perkhidmatan telefon 28,635 28,535 100 1,510,337 (Talian tetap, awam dan selular) Telephone services (Fixed line, public and cellular)
Perkhidmatan pemancar televisyen 4,454 4,425 29 246,661 dan radio Television and radio transmission services
Perkhidmatan komunikasi data 8,036 7,884 152 452,732 Data communication services
Perkhidmatan komunikasi lain 4,250 4,250 - 242,753 Other telecommunication services
Jumlah / Total 45,375 45,094 281 2,452,483
Total number of persons engaged during December or the Salaries and last pay period Wages paid
Total Employees (‘000)
Full-time Part-time
Punca: JPMSource: DOS
Nota penjelasanExplanatory notes
Sila lihat nota bagi jadual 3Please see notes for table 3
6 Jumlah pekerja dalam industri telekomunikasi mengikut jenis perkhidmatan, 2008 Number of persons engaged in the telecommunications industry by type of services, 2008
KOMUNIKASI & MULTIMEDIAFAKTA & ANGKA TERPILIH
COMMUNICATIONS & MULTIMEDIASELECTED FACTS & FIGURES
Q42 0 1 0

Communications & Multimedia • Selected Facts & Figures Q4 2010 11Communications & Multimedia • Selected Facts & Figures Q4 2010
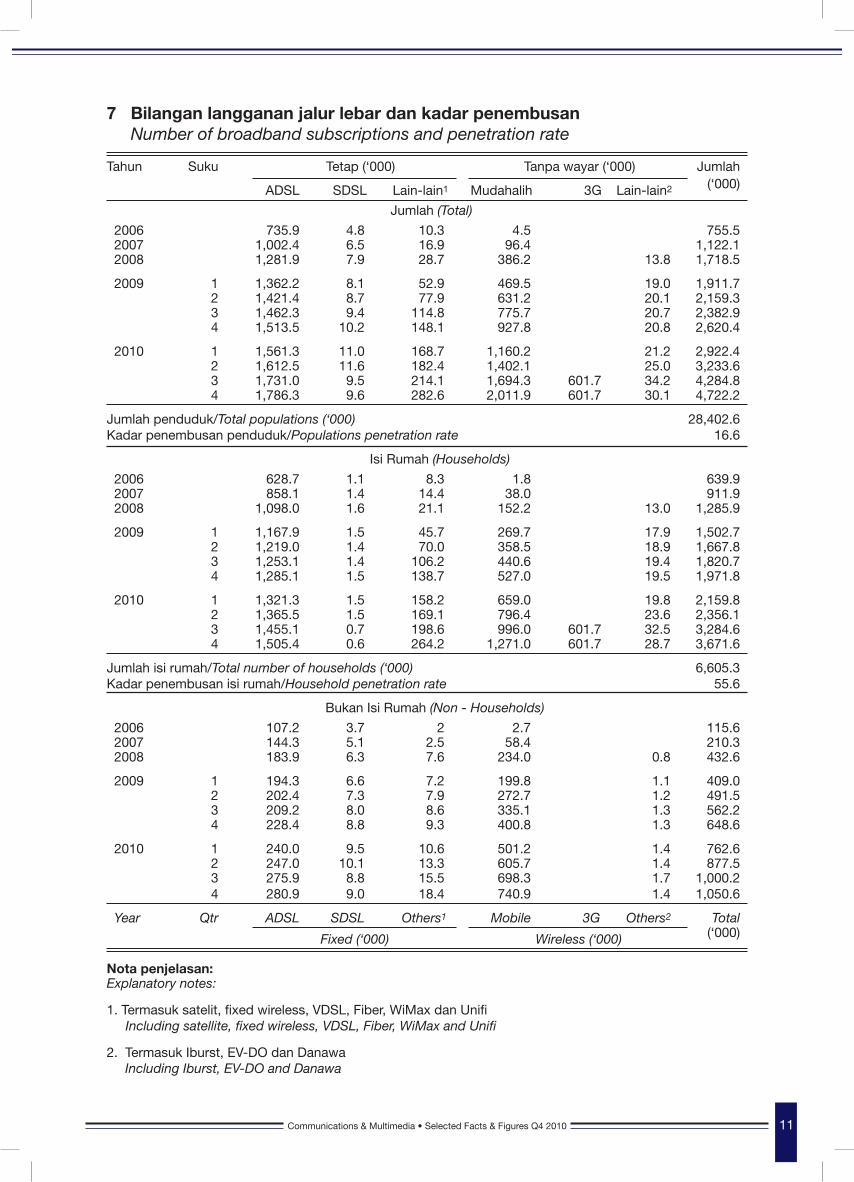
7 Bilangan langganan jalur lebar dan kadar penembusan Number of broadband subscriptions and penetration rate
Tahun Suku Tetap (‘000) Tanpa wayar (‘000) Jumlah
ADSL SDSL Lain-lain1 Mudahalih 3G Lain-lain2 (‘000)
Jumlah (Total)
2006 735.9 4.8 10.3 4.5 755.5 2007 1,002.4 6.5 16.9 96.4 1,122.1 2008 1,281.9 7.9 28.7 386.2 13.8 1,718.5
2009 1 1,362.2 8.1 52.9 469.5 19.0 1,911.7 2 1,421.4 8.7 77.9 631.2 20.1 2,159.3 3 1,462.3 9.4 114.8 775.7 20.7 2,382.9 4 1,513.5 10.2 148.1 927.8 20.8 2,620.4
2010 1 1,561.3 11.0 168.7 1,160.2 21.2 2,922.4 2 1,612.5 11.6 182.4 1,402.1 25.0 3,233.6 3 1,731.0 9.5 214.1 1,694.3 601.7 34.2 4,284.8 4 1,786.3 9.6 282.6 2,011.9 601.7 30.1 4,722.2
Jumlah penduduk/Total populations (‘000) 28,402.6Kadar penembusan penduduk/Populations penetration rate 16.6
Isi Rumah (Households)
2006 628.7 1.1 8.3 1.8 639.9 2007 858.1 1.4 14.4 38.0 911.9 2008 1,098.0 1.6 21.1 152.2 13.0 1,285.9
2009 1 1,167.9 1.5 45.7 269.7 17.9 1,502.7 2 1,219.0 1.4 70.0 358.5 18.9 1,667.8 3 1,253.1 1.4 106.2 440.6 19.4 1,820.7 4 1,285.1 1.5 138.7 527.0 19.5 1,971.8
2010 1 1,321.3 1.5 158.2 659.0 19.8 2,159.8 2 1,365.5 1.5 169.1 796.4 23.6 2,356.1 3 1,455.1 0.7 198.6 996.0 601.7 32.5 3,284.6 4 1,505.4 0.6 264.2 1,271.0 601.7 28.7 3,671.6
Jumlah isi rumah/Total number of households (‘000) 6,605.3Kadar penembusan isi rumah/Household penetration rate 55.6
Bukan Isi Rumah (Non - Households)
2006 107.2 3.7 2 2.7 115.6 2007 144.3 5.1 2.5 58.4 210.3 2008 183.9 6.3 7.6 234.0 0.8 432.6
2009 1 194.3 6.6 7.2 199.8 1.1 409.0 2 202.4 7.3 7.9 272.7 1.2 491.5 3 209.2 8.0 8.6 335.1 1.3 562.2 4 228.4 8.8 9.3 400.8 1.3 648.6
2010 1 240.0 9.5 10.6 501.2 1.4 762.6 2 247.0 10.1 13.3 605.7 1.4 877.5 3 275.9 8.8 15.5 698.3 1.7 1,000.2 4 280.9 9.0 18.4 740.9 1.4 1,050.6
Year Qtr ADSL SDSL Others1 Mobile 3G Others2 Total
Fixed (‘000) Wireless (‘000) (‘000)
Nota penjelasan: Explanatory notes:
1. Termasuk satelit, fixed wireless, VDSL, Fiber, WiMax dan Unifi Including satellite, fixed wireless, VDSL, Fiber, WiMax and Unifi
2. Termasuk Iburst, EV-DO dan Danawa Including Iburst, EV-DO and Danawa
12 Communications & Multimedia • Selected Facts & Figures Q4 2010 Communications & Multimedia • Selected Facts & Figures Q4 2010
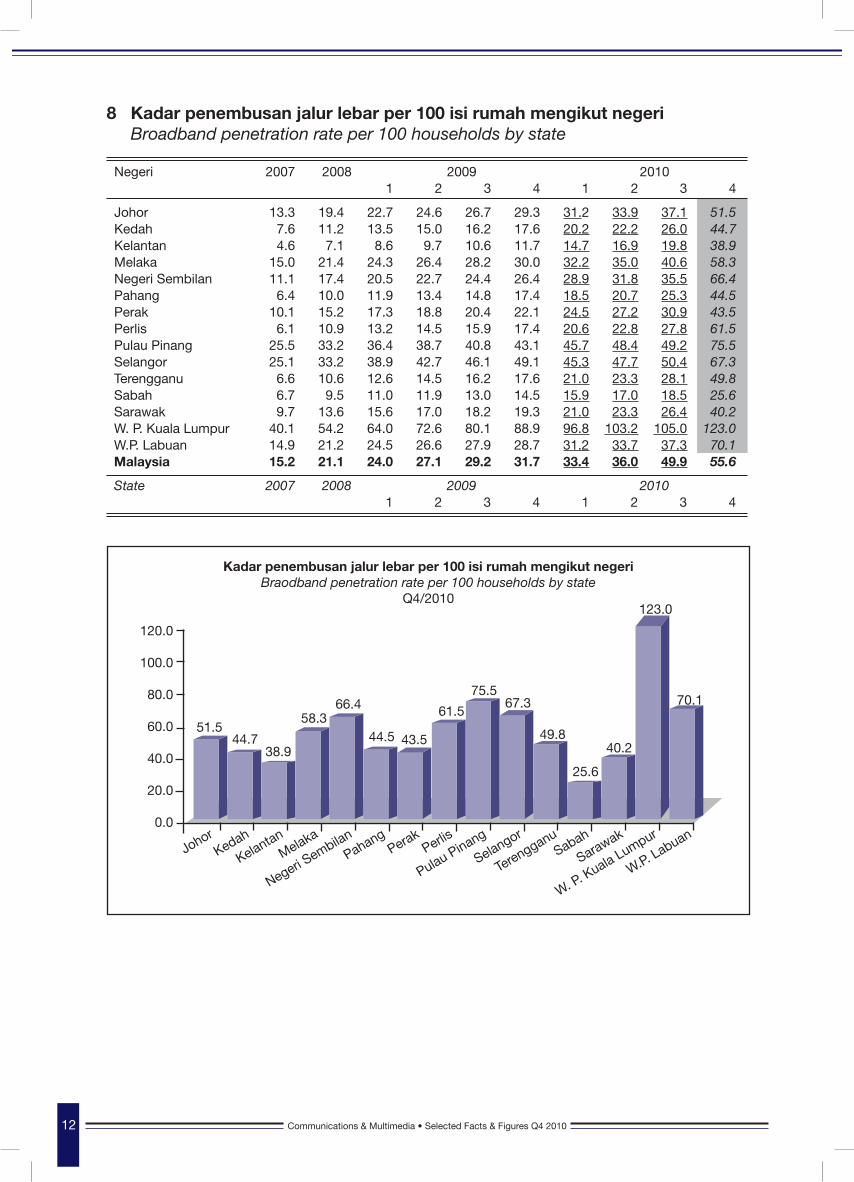
Negeri 2007 2008 2009 2010 1 2 3 4 1 2 3 4
Johor 13.3 19.4 22.7 24.6 26.7 29.3 31.2 33.9 37.1 51.5 Kedah 7.6 11.2 13.5 15.0 16.2 17.6 20.2 22.2 26.0 44.7 Kelantan 4.6 7.1 8.6 9.7 10.6 11.7 14.7 16.9 19.8 38.9 Melaka 15.0 21.4 24.3 26.4 28.2 30.0 32.2 35.0 40.6 58.3 Negeri Sembilan 11.1 17.4 20.5 22.7 24.4 26.4 28.9 31.8 35.5 66.4 Pahang 6.4 10.0 11.9 13.4 14.8 17.4 18.5 20.7 25.3 44.5 Perak 10.1 15.2 17.3 18.8 20.4 22.1 24.5 27.2 30.9 43.5 Perlis 6.1 10.9 13.2 14.5 15.9 17.4 20.6 22.8 27.8 61.5 Pulau Pinang 25.5 33.2 36.4 38.7 40.8 43.1 45.7 48.4 49.2 75.5 Selangor 25.1 33.2 38.9 42.7 46.1 49.1 45.3 47.7 50.4 67.3 Terengganu 6.6 10.6 12.6 14.5 16.2 17.6 21.0 23.3 28.1 49.8 Sabah 6.7 9.5 11.0 11.9 13.0 14.5 15.9 17.0 18.5 25.6 Sarawak 9.7 13.6 15.6 17.0 18.2 19.3 21.0 23.3 26.4 40.2 W. P. Kuala Lumpur 40.1 54.2 64.0 72.6 80.1 88.9 96.8 103.2 105.0 123.0 W.P. Labuan 14.9 21.2 24.5 26.6 27.9 28.7 31.2 33.7 37.3 70.1 Malaysia 15.2 21.1 24.0 27.1 29.2 31.7 33.4 36.0 49.9 55.6
State 2007 2008 2009 2010 1 2 3 4 1 2 3 4
8 Kadar penembusan jalur lebar per 100 isi rumah mengikut negeri Broadband penetration rate per 100 households by state
Kadar penembusan jalur lebar per 100 isi rumah mengikut negeriBraodband penetration rate per 100 households by state
Q4/2010123.0
120.0
100.0
80.0
60.0
40.0
20.0
0.0
51.544.7
38.9
58.366.4
44.5 43.5
61.5
75.567.3
25.6
49.840.2
70.1
JohorKedah
KelantanMelaka
PahangPerak
Perlis
SelangorSabah
Sarawak
Terengganu
W. P. Kuala Lumpur
W.P. Labuan
Negeri Sembilan
Pulau Pinang
Communications & Multimedia • Selected Facts & Figures Q4 2010 13Communications & Multimedia • Selected Facts & Figures Q4 2010
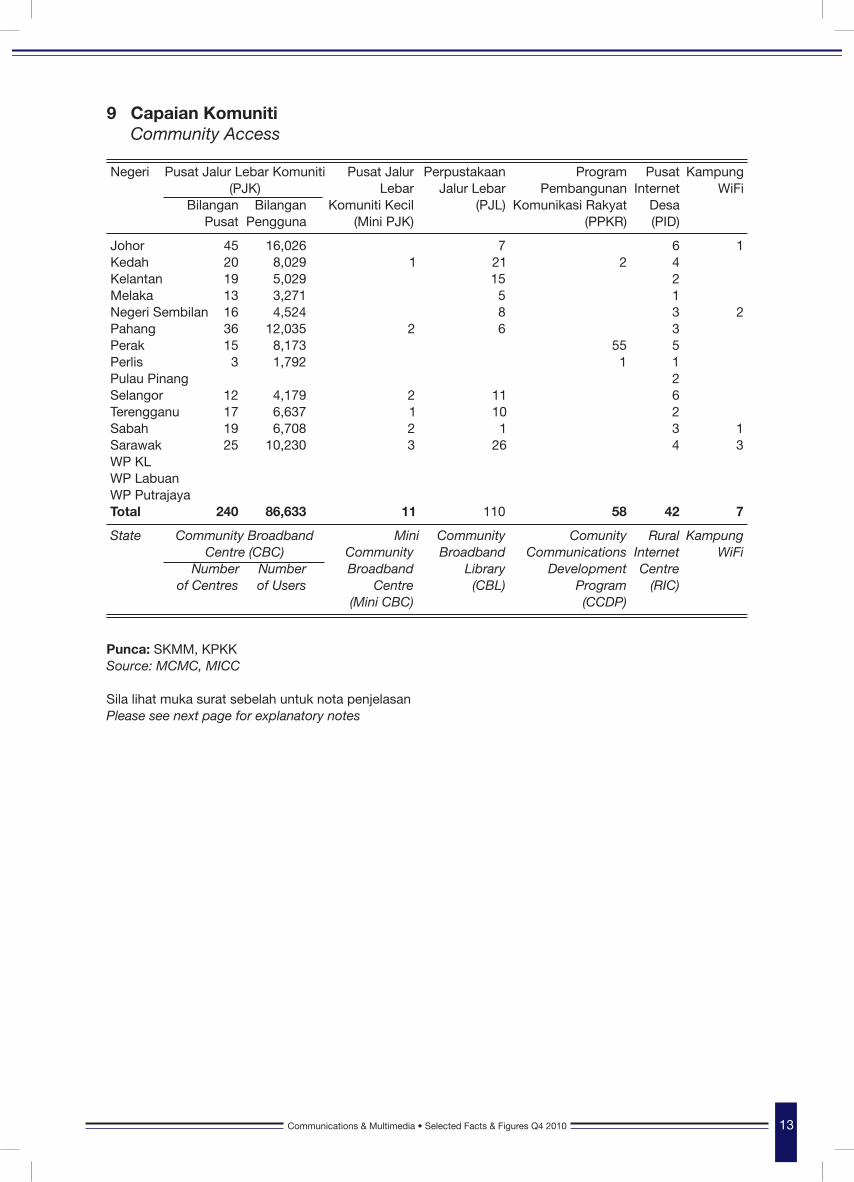
Negeri Pusat Jalur Lebar Komuniti Pusat Jalur Perpustakaan Program Pusat Kampung (PJK) Lebar Jalur Lebar Pembangunan Internet WiFi Bilangan Bilangan Komuniti Kecil (PJL) Komunikasi Rakyat Desa Pusat Pengguna (Mini PJK) (PPKR) (PID)
Johor 45 16,026 7 6 1 Kedah 20 8,029 1 21 2 4 Kelantan 19 5,029 15 2 Melaka 13 3,271 5 1 Negeri Sembilan 16 4,524 8 3 2 Pahang 36 12,035 2 6 3 Perak 15 8,173 55 5 Perlis 3 1,792 1 1 Pulau Pinang 2 Selangor 12 4,179 2 11 6 Terengganu 17 6,637 1 10 2 Sabah 19 6,708 2 1 3 1 Sarawak 25 10,230 3 26 4 3 WP KL WP Labuan WP Putrajaya Total 240 86,633 11 110 58 42 7
State Community Broadband Mini Community Comunity Rural Kampung Centre (CBC) Community Broadband Communications Internet WiFi Number Number Broadband Library Development Centre of Centres of Users Centre (CBL) Program (RIC) (Mini CBC) (CCDP)
Punca: SKMM, KPKKSource: MCMC, MICC
Sila lihat muka surat sebelah untuk nota penjelasanPlease see next page for explanatory notes
9 Capaian Komuniti Community Access

14 Communications & Multimedia • Selected Facts & Figures Q4 2010 Communications & Multimedia • Selected Facts & Figures Q4 2010
Nota penjelasan: Explanatory notes:
Pusat Jalur Lebar Komuniti/Community Broadband Centres
Pusat Jalur Lebar Komuniti (PJK) memberikan akses Internet secara kolektif kepada kawasan yang kurang liputan perkhidmatan yang telah dikenalpasti di bawah Program Pemberian Perkhidmatan Sejagat (PPS). Setiap PJK dilengkapkan dengan peralatan IT termasuk komputer peribadi yang disambungkan ke Internet melalui jalur lebar yang membolehkan masyarakat luar bandar menikmati Internet sebagaimana dinikmati oleh masyarakat bandar. Adalah diharapkan PJK akan memberi sumbangan kepada kejayaan untuk mencapai inisiatif negara untuk merapatkan jurang digital di antara masyarakat bandar dan luar bandar.
Community Broadband Centres (CBC) provide collective community Internet access to underserved areas identified under the Universal Service Provision (USP) programme. Each CBC is equipped with IT equipment including personal computers connected to the Internet via broadband to allow rural communities to enjoy the benefits of the Internet as enjoyed by those living in urban areas. It is hoped that the CBC will contribute towards achieving success in national initiatives to bridge the digital divide between urban and rural communities.
Perpustakaan Jalur Lebar/ Communiti Broadband Libraries
Akses Internet Jalur Lebar ke perpustakaan adalah projek yang dijalankan di bawah PPS. Tujuan pelaksanaan ialah untuk menyediakan akses Internet di kawasan yang kurang liputan perkhidmatan di seluruh negara. Pada awalnya, fokus projek ini ialah untuk membantu perpustakaan dengan memberikan kemudahan kepada masyarakat untuk pembangunan digital di kawasan luar bandar melalui akses komunikasi dan latihan. Projek ini juga mensasarkan perkembangan fungsi kakitangan perpustakaan dari sumber fisikal ke sumber elektronik dan Internet dan pada masa yang sama membolehkan mereka memainkan peranan dalam meningkatkan keadaan sosial dan ekonomi masyarakat.
The provision of broadband Internet access to libraries is a project implemented under the USP. The purpose of the implementation is to provide Internet access in underserved areas throughout the country. Initially, the focus of the project is to assist libraries in providing facilities to the marginalized community of digital development in rural areas through access to communication and training. This project also aims to expand the functions of library staff from only focusing on the physical books and resources in a library’s possession to encompass electronic and Internet-based resources and thus empowering them to be an agent of change in improving the socio economic condition of society through new ways of learning facilitated by the Internet.
Pusat Jalur Lebar Komuniti Kecil/ Mini Community Broadband Centres
Mini PJK ialah projek di bawah PPS dalam usaha untuk merapatkan jurang digital. Mini PJK ditempatkan di premis Jabatan Penerangan di seluruh negara dan memberi liputan kepada masyarakat yang tinggal di persekitaran mini PJK. Setiap mini PJK dilengkapi dengan 5 buah komputer dan akses Internet jalur lebar.
Mini CBC is a project under USP programme to close the digital divide. Mini CBC are co-located with Information Department offices all over the country and cover communities living near the Mini CBC. Each mini CBC is equipped with 5 personal computers and a broadband access.
Program Pembangunan Komunikasi Rakyat/Community Communications Development Program
Objektifnya adalah untuk meningkatkan kawasan liputan dan perkhidmatan rangkaian dan perkhidmatan aplikasi.
Its objective is to increase community access to network services and facilities.
Pusat Internet Desa/Rural Internet Centre
Pusat Internet Desa merupakan aspek fizikal untuk Program Internet Desa. Program ini adalah sebahagian daripada program yang melibatkan secara terus masyarakat tempatan daripada semua aspek seperti penyelenggaraan dan pengurusan harian. Program ini dikendalikan oleh Kementerian Penerangan Komunikasi dan Kebudayaan.
The Rural Internet Centre is the physical aspect of the Rural Internet Program. This program is part of a larger program that involves the local community directly from all aspects such as maintenance and daily management. This program is under the auspices of the Ministry of Information, Communications and Culture.
Kampung WiFi
Kampung WiFi adalah projek yang dikendalikan oleh Pernec di kawasan luar bandar. Objektifnya bertujuan untuk menyediakan jalur lebar tanpa wayar dengan memasang antena WiFi pada tempat yang strategik.
Kampung WiFi is a project by Pernec in rural areas. Its objective is to provide wireless broadband access by installing WiFi antennas in strategic places.
Communications & Multimedia • Selected Facts & Figures Q4 2010 15Communications & Multimedia • Selected Facts & Figures Q4 2010
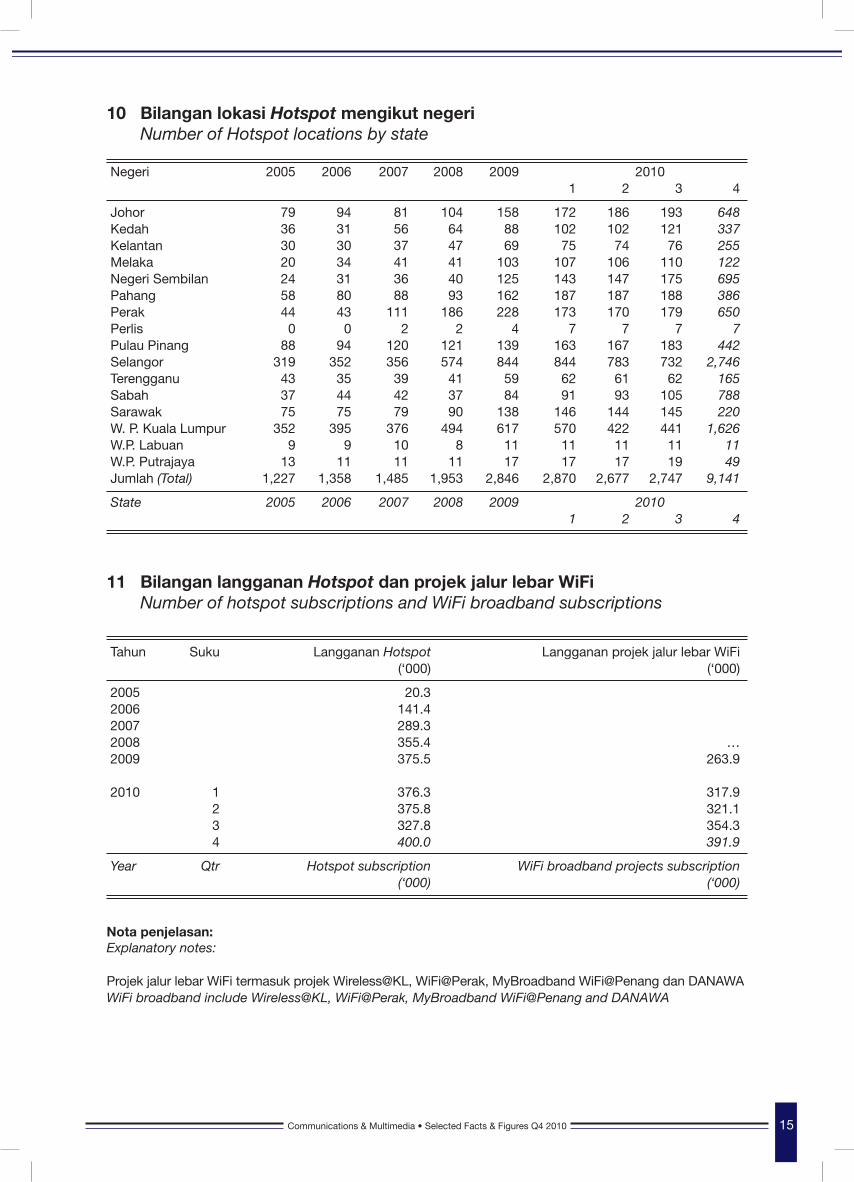
Negeri 2005 2006 2007 2008 2009 2010 1 2 3 4
Johor 79 94 81 104 158 172 186 193 648 Kedah 36 31 56 64 88 102 102 121 337 Kelantan 30 30 37 47 69 75 74 76 255 Melaka 20 34 41 41 103 107 106 110 122 Negeri Sembilan 24 31 36 40 125 143 147 175 695 Pahang 58 80 88 93 162 187 187 188 386 Perak 44 43 111 186 228 173 170 179 650 Perlis 0 0 2 2 4 7 7 7 7 Pulau Pinang 88 94 120 121 139 163 167 183 442 Selangor 319 352 356 574 844 844 783 732 2,746 Terengganu 43 35 39 41 59 62 61 62 165 Sabah 37 44 42 37 84 91 93 105 788 Sarawak 75 75 79 90 138 146 144 145 220 W. P. Kuala Lumpur 352 395 376 494 617 570 422 441 1,626 W.P. Labuan 9 9 10 8 11 11 11 11 11 W.P. Putrajaya 13 11 11 11 17 17 17 19 49 Jumlah (Total) 1,227 1,358 1,485 1,953 2,846 2,870 2,677 2,747 9,141
State 2005 2006 2007 2008 2009 2010 1 2 3 4
Tahun Suku Langganan Hotspot Langganan projek jalur lebar WiFi (‘000) (‘000)
2005 20.3 2006 141.4 2007 289.3 2008 355.4 … 2009 375.5 263.9 2010 1 376.3 317.9 2 375.8 321.1 3 327.8 354.3 4 400.0 391.9
Year Qtr Hotspot subscription WiFi broadband projects subscription (‘000) (‘000)
Nota penjelasan: Explanatory notes:
Projek jalur lebar WiFi termasuk projek Wireless@KL, WiFi@Perak, MyBroadband WiFi@Penang dan DANAWA WiFi broadband include Wireless@KL, WiFi@Perak, MyBroadband WiFi@Penang and DANAWA
10 Bilangan lokasi Hotspot mengikut negeri Number of Hotspot locations by state
11 Bilangan langganan Hotspot dan projek jalur lebar WiFi Number of hotspot subscriptions and WiFi broadband subscriptions
16 Communications & Multimedia • Selected Facts & Figures Q4 2010 Communications & Multimedia • Selected Facts & Figures Q4 2010
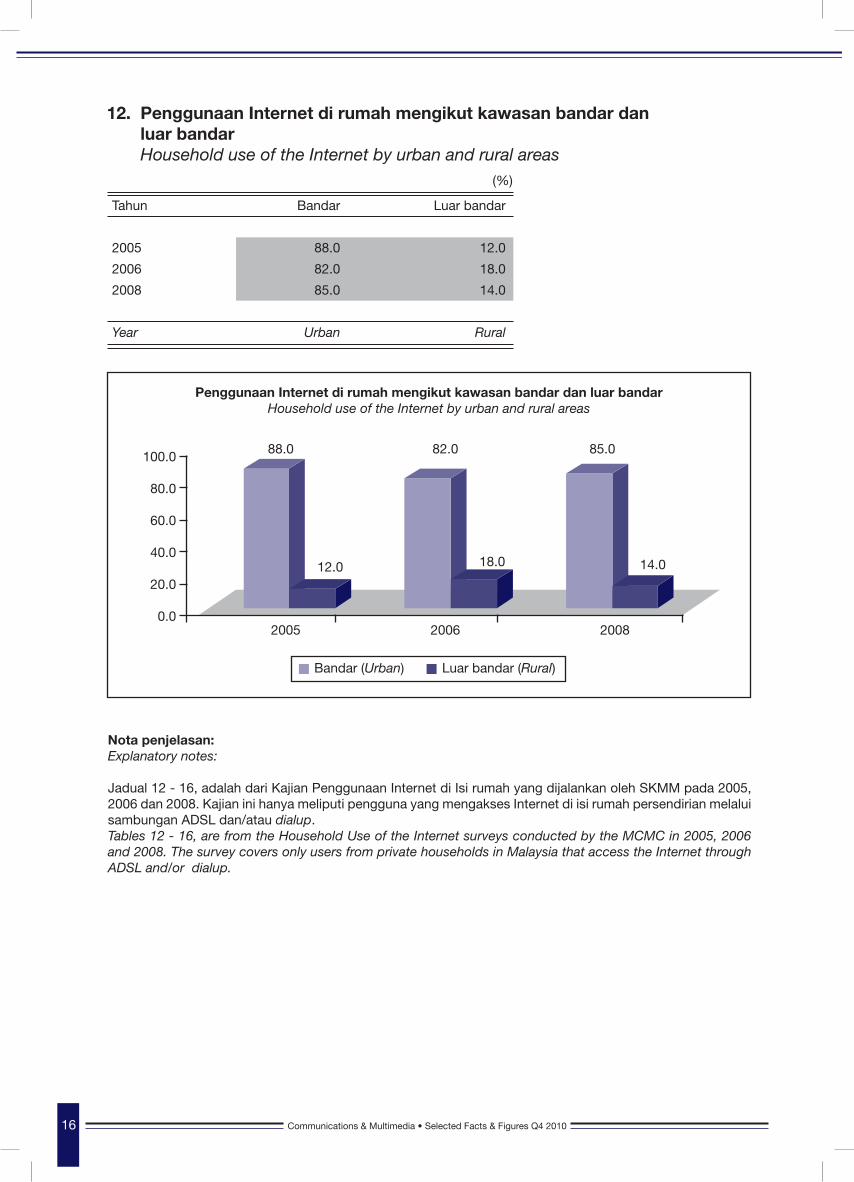
Tahun Bandar Luar bandar
2005 88.0 12.0
2006 82.0 18.0
2008 85.0 14.0
Year Urban Rural
12. Penggunaan Internet di rumah mengikut kawasan bandar dan luar bandar Household use of the Internet by urban and rural areas
Penggunaan Internet di rumah mengikut kawasan bandar dan luar bandarHousehold use of the Internet by urban and rural areas
100.0
80.0
60.0
40.0
20.0
0.0
88.0 82.0 85.0
2005 2006 2008
12.0 18.0 14.0
Bandar (Urban) Luar bandar (Rural)
(%)
Nota penjelasan: Explanatory notes: Jadual 12 - 16, adalah dari Kajian Penggunaan Internet di Isi rumah yang dijalankan oleh SKMM pada 2005, 2006 dan 2008. Kajian ini hanya meliputi pengguna yang mengakses Internet di isi rumah persendirian melalui sambungan ADSL dan/atau dialup. Tables 12 - 16, are from the Household Use of the Internet surveys conducted by the MCMC in 2005, 2006 and 2008. The survey covers only users from private households in Malaysia that access the Internet through ADSL and/or dialup.
Communications & Multimedia • Selected Facts & Figures Q4 2010 17Communications & Multimedia • Selected Facts & Figures Q4 2010
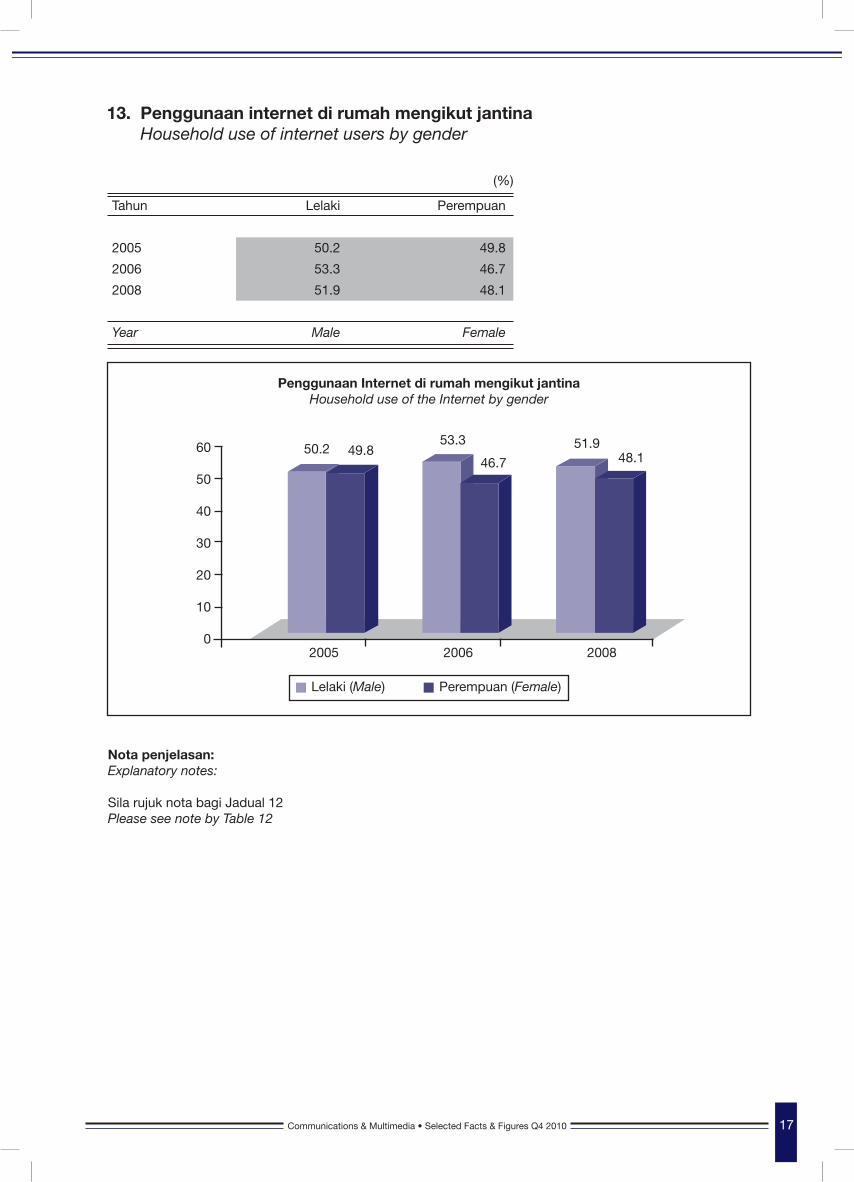
Tahun Lelaki Perempuan
2005 50.2 49.8
2006 53.3 46.7
2008 51.9 48.1
Year Male Female
13. Penggunaan internet di rumah mengikut jantina Household use of internet users by gender
Penggunaan Internet di rumah mengikut jantinaHousehold use of the Internet by gender
60
50
40
30
20
10
02005 2006 2008
49.846.7 48.1
50.253.3 51.9
Lelaki (Male) Perempuan (Female)
(%)
Nota penjelasan: Explanatory notes: Sila rujuk nota bagi Jadual 12Please see note by Table 12

18 Communications & Multimedia • Selected Facts & Figures Q4 2010 Communications & Multimedia • Selected Facts & Figures Q4 2010
Kategori umur 2005 2006 2008
Bawah 15 (Below 15) 6.5 7.3 6.8
15-19 18.6 18.7 17.9
20-24 17.2 16.3 15.7
25-29 12.5 11.3 11.9
30-34 12.2 12.3 11.7
35-39 9.9 10.4 11.2
40-44 9.6 10.6 9.3
45-49 5.1 6.1 6.1
50 dan keatas (50 and above) 8.4 7.1 9.4
Age category 2005 2006 2008
Nota penjelasan: Explanatory notes: Sila rujuk nota bagi Jadual 12 Please see note by Table 12
14. Penggunaan Internet di rumah mengikut kategori umur Household use of the Internet by age categories
Communications & Multimedia • Selected Facts & Figures Q4 2010 19Communications & Multimedia • Selected Facts & Figures Q4 2010
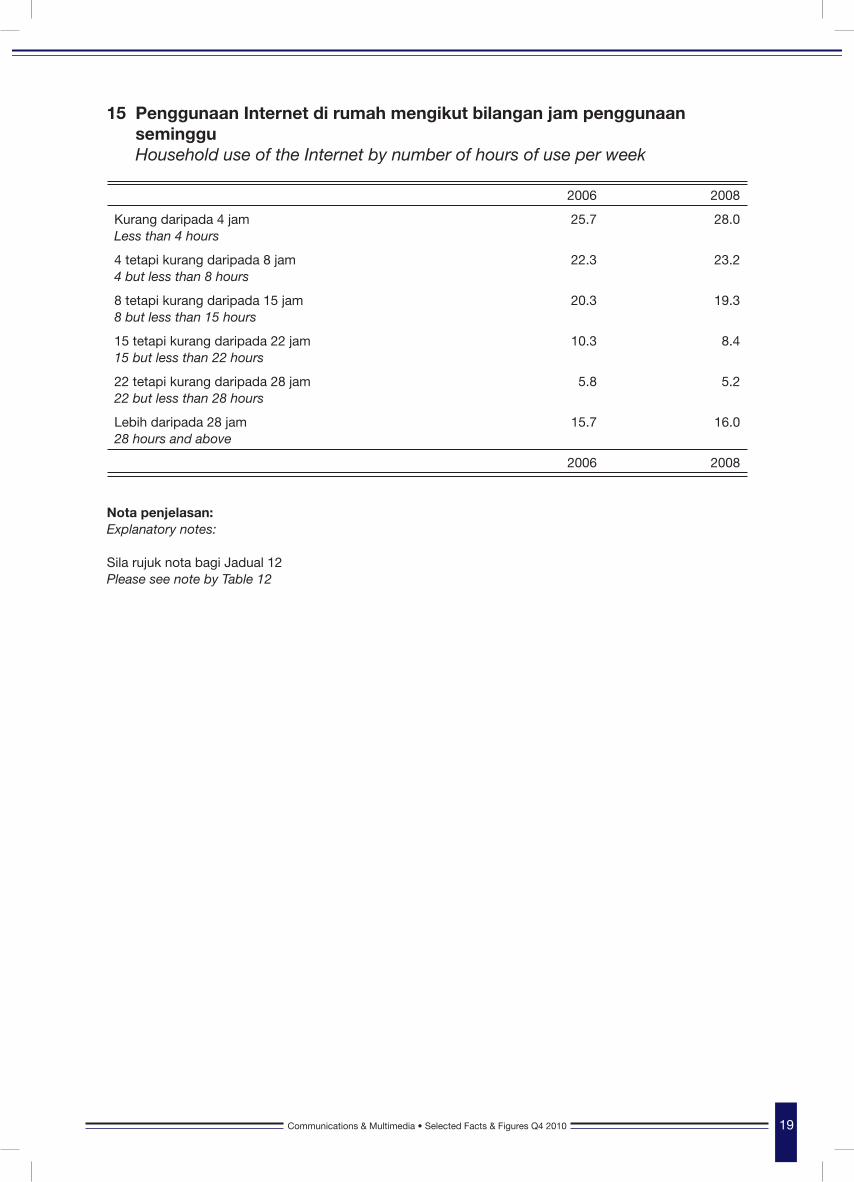
15 Penggunaan Internet di rumah mengikut bilangan jam penggunaan seminggu Household use of the Internet by number of hours of use per week
2006 2008
Kurang daripada 4 jam 25.7 28.0 Less than 4 hours
4 tetapi kurang daripada 8 jam 22.3 23.2 4 but less than 8 hours
8 tetapi kurang daripada 15 jam 20.3 19.3 8 but less than 15 hours
15 tetapi kurang daripada 22 jam 10.3 8.4 15 but less than 22 hours
22 tetapi kurang daripada 28 jam 5.8 5.2 22 but less than 28 hours
Lebih daripada 28 jam 15.7 16.0 28 hours and above
2006 2008
Nota penjelasan: Explanatory notes: Sila rujuk nota bagi Jadual 12 Please see note by Table 12
20 Communications & Multimedia • Selected Facts & Figures Q4 2010 Communications & Multimedia • Selected Facts & Figures Q4 2010
2005 2006 2008
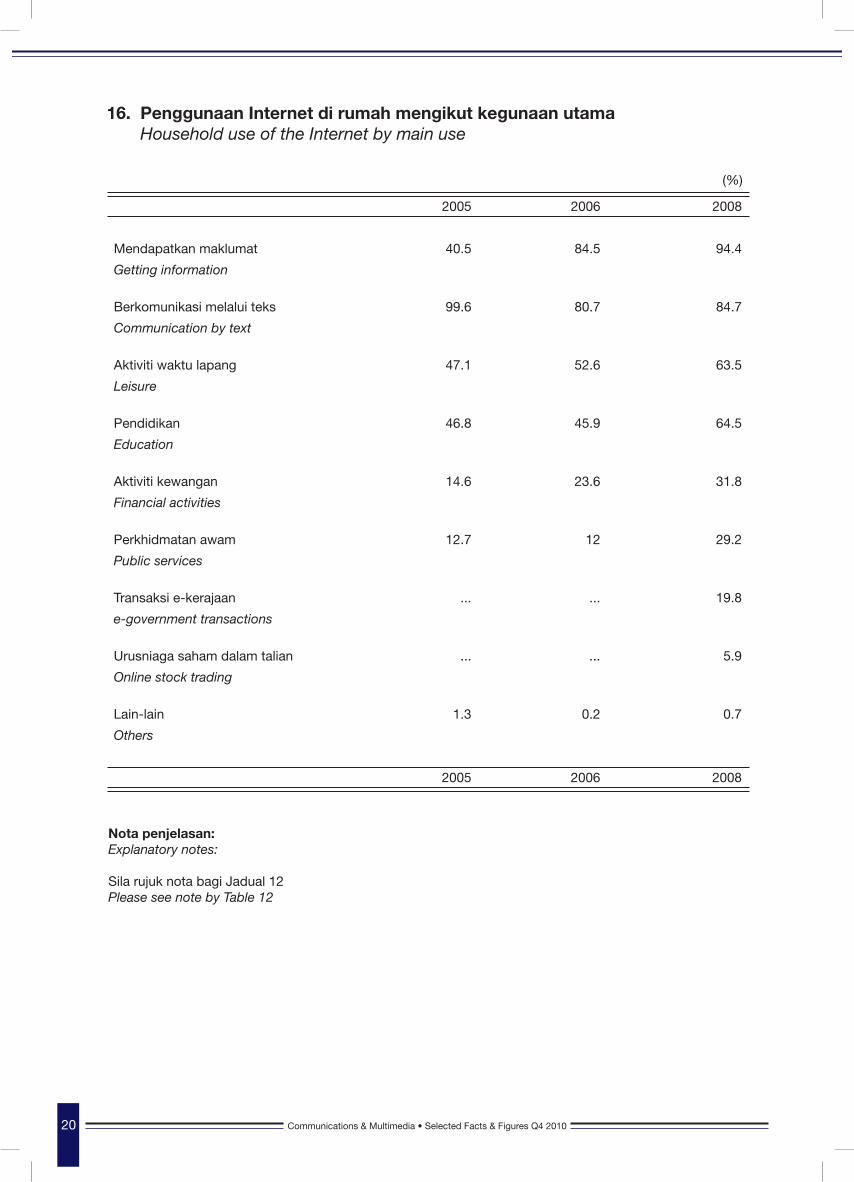
Mendapatkan maklumat 40.5 84.5 94.4
Getting information
Berkomunikasi melalui teks 99.6 80.7 84.7
Communication by text
Aktiviti waktu lapang 47.1 52.6 63.5
Leisure
Pendidikan 46.8 45.9 64.5
Education
Aktiviti kewangan 14.6 23.6 31.8
Financial activities
Perkhidmatan awam 12.7 12 29.2
Public services
Transaksi e-kerajaan ... ... 19.8
e-government transactions
Urusniaga saham dalam talian ... ... 5.9
Online stock trading
Lain-lain 1.3 0.2 0.7
Others
2005 2006 2008
16. Penggunaan Internet di rumah mengikut kegunaan utama Household use of the Internet by main use
(%)
Nota penjelasan: Explanatory notes: Sila rujuk nota bagi Jadual 12Please see note by Table 12
Communications & Multimedia • Selected Facts & Figures Q4 2010 21Communications & Multimedia • Selected Facts & Figures Q4 2010
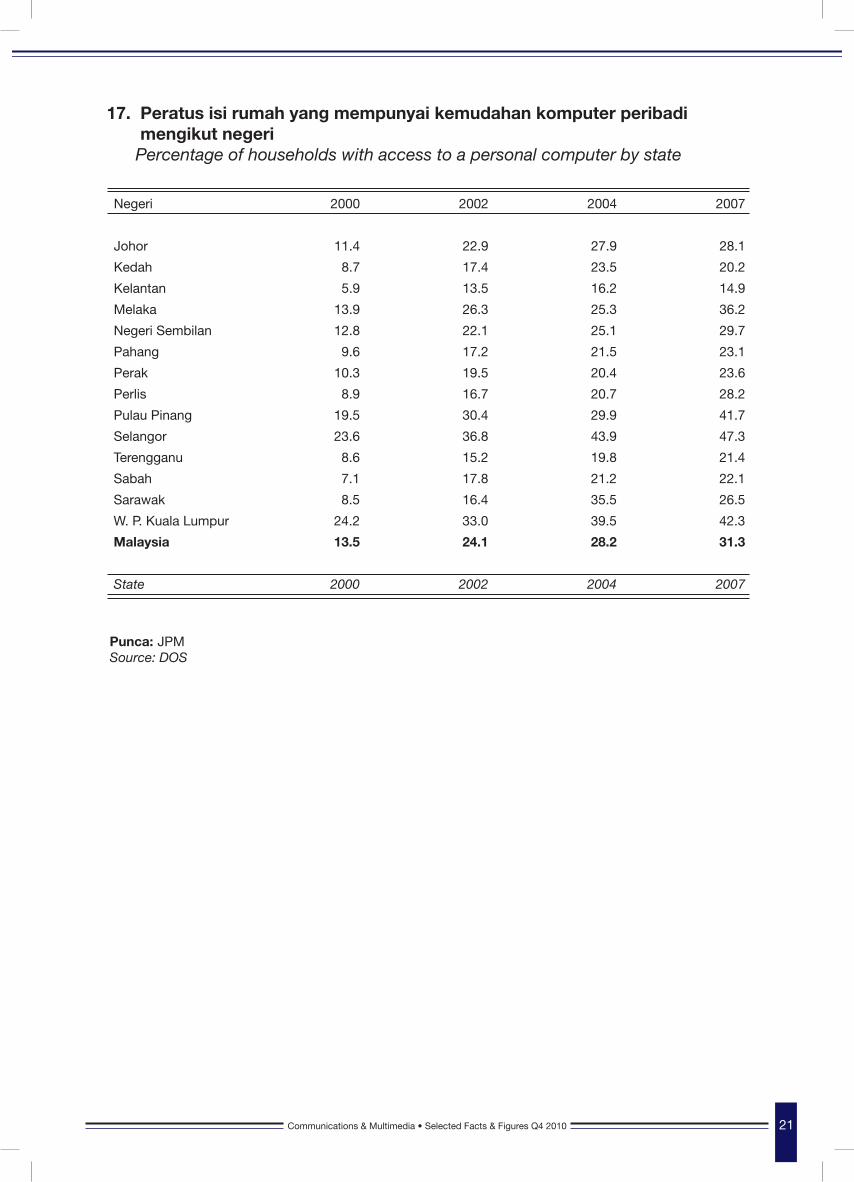
Negeri 2000 2002 2004 2007
Johor 11.4 22.9 27.9 28.1
Kedah 8.7 17.4 23.5 20.2
Kelantan 5.9 13.5 16.2 14.9
Melaka 13.9 26.3 25.3 36.2
Negeri Sembilan 12.8 22.1 25.1 29.7
Pahang 9.6 17.2 21.5 23.1
Perak 10.3 19.5 20.4 23.6
Perlis 8.9 16.7 20.7 28.2
Pulau Pinang 19.5 30.4 29.9 41.7
Selangor 23.6 36.8 43.9 47.3
Terengganu 8.6 15.2 19.8 21.4
Sabah 7.1 17.8 21.2 22.1
Sarawak 8.5 16.4 35.5 26.5
W. P. Kuala Lumpur 24.2 33.0 39.5 42.3
Malaysia 13.5 24.1 28.2 31.3
State 2000 2002 2004 2007
17. Peratus isi rumah yang mempunyai kemudahan komputer peribadi mengikut negeri Percentage of households with access to a personal computer by state
Punca: JPMSource: DOS
22 Communications & Multimedia • Selected Facts & Figures Q4 2010 Communications & Multimedia • Selected Facts & Figures Q4 2010
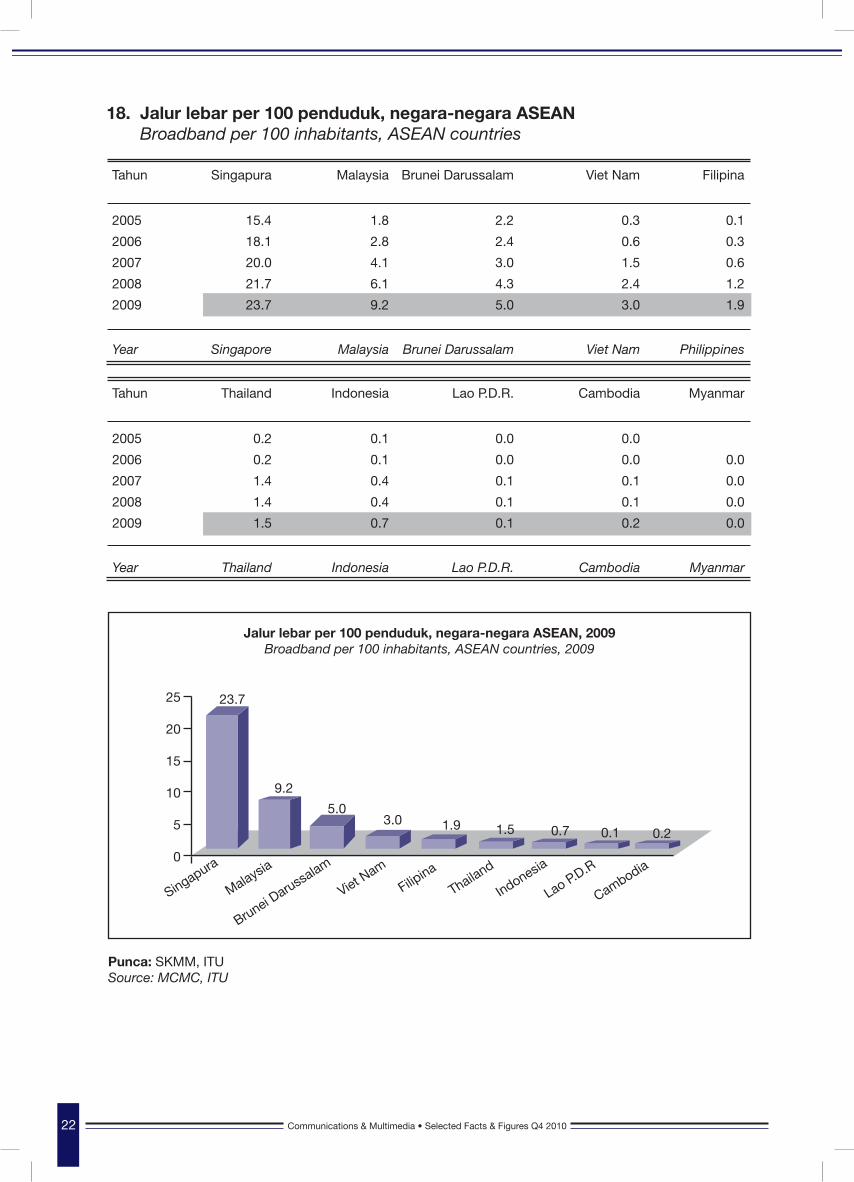
Tahun Singapura Malaysia Brunei Darussalam Viet Nam Filipina
2005 15.4 1.8 2.2 0.3 0.1
2006 18.1 2.8 2.4 0.6 0.3
2007 20.0 4.1 3.0 1.5 0.6
2008 21.7 6.1 4.3 2.4 1.2
2009 23.7 9.2 5.0 3.0 1.9
Year Singapore Malaysia Brunei Darussalam Viet Nam Philippines
Tahun Thailand Indonesia Lao P.D.R. Cambodia Myanmar
2005 0.2 0.1 0.0 0.0
2006 0.2 0.1 0.0 0.0 0.0
2007 1.4 0.4 0.1 0.1 0.0
2008 1.4 0.4 0.1 0.1 0.0
2009 1.5 0.7 0.1 0.2 0.0
Year Thailand Indonesia Lao P.D.R. Cambodia Myanmar
18. Jalur lebar per 100 penduduk, negara-negara ASEAN Broadband per 100 inhabitants, ASEAN countries
Punca: SKMM, ITUSource: MCMC, ITU
Jalur lebar per 100 penduduk, negara-negara ASEAN, 2009Broadband per 100 inhabitants, ASEAN countries, 2009
25
20
15
10
5
0
23.7
9.2
5.03.0 1.9
Singapura
Malaysia
Viet Nam
Thailand
Filipina
Lao P.D.R
Indonesia
Cambodia
Brunei Darussalam
1.5 0.20.7 0.1
Communications & Multimedia • Selected Facts & Figures Q4 2010 23Communications & Multimedia • Selected Facts & Figures Q4 2010
Tahun Korea Selatan Jerman Hong Kong SAR AS Jepun Singapura
2005 25.6 13.1 24.1 15.9 18.3 15.4
2006 29.4 18.2 26.0 19.7 20.7 18.1
2007 30.7 23.8 27.3 22.7 22.2 20.0
2008 32.1 27.5 28.1 24.7 23.2 21.7
2009 33.8 30.4 29.3 27.1 24.9 23.7
Year South Korea Germany Hong Kong SAR USA Japan Singapore
Tahun Taiwan Malaysia China Thailand Indonesia
2005 19.1 1.8 2.9 0.2 0.1
2006 19.8 2.8 3.9 0.2 0.1
2007 20.9 4.1 5.0 1.4 0.4
2008 21.8 6.1 6.2 1.4 0.4
2009 21.6 9.2 7.7 1.5 0.7
Year Taiwan Malaysia China Thailand Indonesia
19. Jalur lebar per 100 penduduk berbanding 10 rakan perdagangan terbesar, Malaysia Broadband per 100 inhabitants compared with 10 biggest trading partners, Malaysia
Punca: SKMM, ITU Source: MCMC, ITU
Jalur lebar per 100 penduduk berbanding 10 rakan perdagangan terbesar, Malaysia, 2009Broadband per 100 inhabitants compared with 10 biggest trading partners, Malaysia, 2009
35.0
30.0
25.0
20.0
15.0
10.0
5.0
0.0
Korea Selatan
Hong Kong SARAS
JepunTaiwan
Malaysia
SingapuraChina
Indonesia
ThailandJerm
an
33.830.4
29.327.1
24.9 23.721.6
9.2
7.7
1.5 0.7

KOMUNIKASI & MULTIMEDIAFAKTA & ANGKA TERPILIH
COMMUNICATIONS & MULTIMEDIASELECTED FACTS & FIGURES
Q42 0 1 0

Communications & Multimedia • Selected Facts & Figures Q4 2010 27Communications & Multimedia • Selected Facts & Figures Q4 2010
Tahun Suku Pascabayar Prabayar Jumlah Kadar penembusan (‘000) (‘000) (‘000) per 100 penduduk
2000 2,599 2,523 5,122 21.8 2001 3,069 4,316 7,385 30.8 2002 2,961 6,092 9,053 36.9 2003 2,566 8,558 11,124 43.9 2004 2,555 12,057 14,611 56.5 2005 2,925 16,620 19,545 74.1 2006 3,368 16,096 19,464 72.3 2007 3,905 19,442 23,347 85.1 2008 5,544 22,169 27,713 98.9
2009 1 5,859 22,335 28,194 100.1 2 6,086 22,459 28,545 100.8 3 6,212 23,411 29,623 104.1 4 6,265 23,879 30,144 105.4
2010 1 6,402 24,392 30,794 109.4 2 6,488 24,968 31,456 111.3 3 6,621 25,792 32,413 114.4 4 6,689 26,417 33,106 116.6
Year Qtr Postpaid Prepaid Total Penetration rate per (‘000) (‘000) (‘000) 100 inhabitants
Nota penjelasan: Explanatory notes: Kadar penembusan telefon selular dikira sebagai jumlah langganan dan dibahagi jumlah penduduk dan didarabkan dengan 100. Penembusan yang melebihi 100.0% boleh berpunca daripada pelanggan yang melanggan melebihi daripada satu langganan. The penetration rate refers to the total subscriptions divided by the total population and multiplied by 100. A penetration rate is over 100% can occur because of multiple subscriptions. Termasuk 3G. Sila lihat Jadual 22 Includes 3G. Please see Table 22
20 Bilangan langganan telefon selular dan kadar penembusan Number of cellular telephone subscriptions and penetration rate
28 Communications & Multimedia • Selected Facts & Figures Q4 2010 Communications & Multimedia • Selected Facts & Figures Q4 2010
Negeri 2007 2008 2009
Johor 87.1 101.3 105.9Kedah 72.0 88.1 92.1Kelantan 56.4 70.6 88.1Melaka 104.7 102.7 120.4Negeri Sembilan 89.4 92.4 115.7Pahang 72.3 86.4 90.2Perak 70.4 85.9 105.5Perlis 71.2 94.8 112.3Pulau Pinang 89.5 101.4 110.5Selangor* 93.2 96.4 104.3Terengganu 72.5 62.6 84.2Sabah** 48.4 58.5 77.8Sarawak 53.0 65.7 93.3W. P. Kuala Lumpur 111.9 151.8 163.8
State 2007 2008 2009
Sila lihat muka surat sebelah untuk nota penjelasanPlease see next page for explanatory notes
21. Kadar penembusan telefon selular per 100 penduduk mengikut negeri Cellular phones penetration rate per 100 inhabitants by state
Communications & Multimedia • Selected Facts & Figures Q4 2010 29Communications & Multimedia • Selected Facts & Figures Q4 2010
Pengiraan bagi kadar penembusan mengikut negeri adalah berdasarkan kepada: · anggaran langganan mengikut negeri · anggaran penduduk mengikut negeri
Anggaran langganan diolah daripada Kajian Pengguna Telefon Bimbit yang dijalankan oleh SKMM setiap tahun.Anggaran penduduk diperoleh dari Jabatan Perangkaan Malaysia.
Pengiraan bagi kadar penembusan adalah:
Bilangan langganan dalam sesebuah negeri Bilangan penduduk dalam negeri tersebut
Adalah diingatkan bahawa Kajian Pengguna Telefon Bimbit adalah satu kaedah kajiselidik dan tertakluk kepada: · ralat pensampelan · ralat bukan-pensampelan
Ralat pensampelan boleh dikira dan dinyatakan dalam laporan kajian. Walau bagaimanapun ralat bukan-pensampelan tidak boleh dianggarkan.
Oleh yang demikian angka-angka yang diperolehi perlu digunakan dengan berhati-hati.
The calculation of the penetration rate by state was based on: · estimated number of subscriptions by state · estimated population by state
The former was derived from the annual Hand Phone Users Survey (HPUS) conducted by MCMC, while the latter was provided by the Department of Statistics, Malaysia.
A penetration rate is calculated as: Number of subscriptions in a state Population in the state Users are reminded that the annual HPUS is a survey and, like all surveys, is subject to: · sampling errors · non-sampling errors Sampling errors can be quantified and are reported in the survey report. Non-sampling errors however cannot be quantified. These figures are therefore to be used with caution.
Nota penjelasan:Explanatory notes:
x 100
x 100
* - Termasuk W. P. Putrajaya Including W. P. Putrajaya
** - Termasuk W. P. Labuan Including W.P. Labuan

30 Communications & Multimedia • Selected Facts & Figures Q4 2010 Communications & Multimedia • Selected Facts & Figures Q4 2010
Tahun Suku Pascabayar Prabayar Jumlah (‘000) (‘000) (‘000)
2006 265 162 427 2007 825 730 1,555 2008 2,014 2,352 4,366 2009 1 2,319 3,122 5,441 2 2,614 3,429 6,043 3 2,817 4,062 6,879 4 2,993 4,354 7,347 2010 1 3,210 4,249 7,459 2 3,351 4,509 7,860 3 3,487 4,894 8,381 4 3,529 5,073 8,602
Year Qtr Postpaid Prepaid Total (‘000) (‘000) (‘000)
Nota penjelasan: Explanatory notes:
Langganan 3G yang ditunjukkan di atas adalah dikirakan juga dalam Jadual 20 3G subscriptions shown above are also counted in Table 20
22 Bilangan Langganan 3G Number of 3G subscriptions
Communications & Multimedia • Selected Facts & Figures Q4 2010 31Communications & Multimedia • Selected Facts & Figures Q4 2010
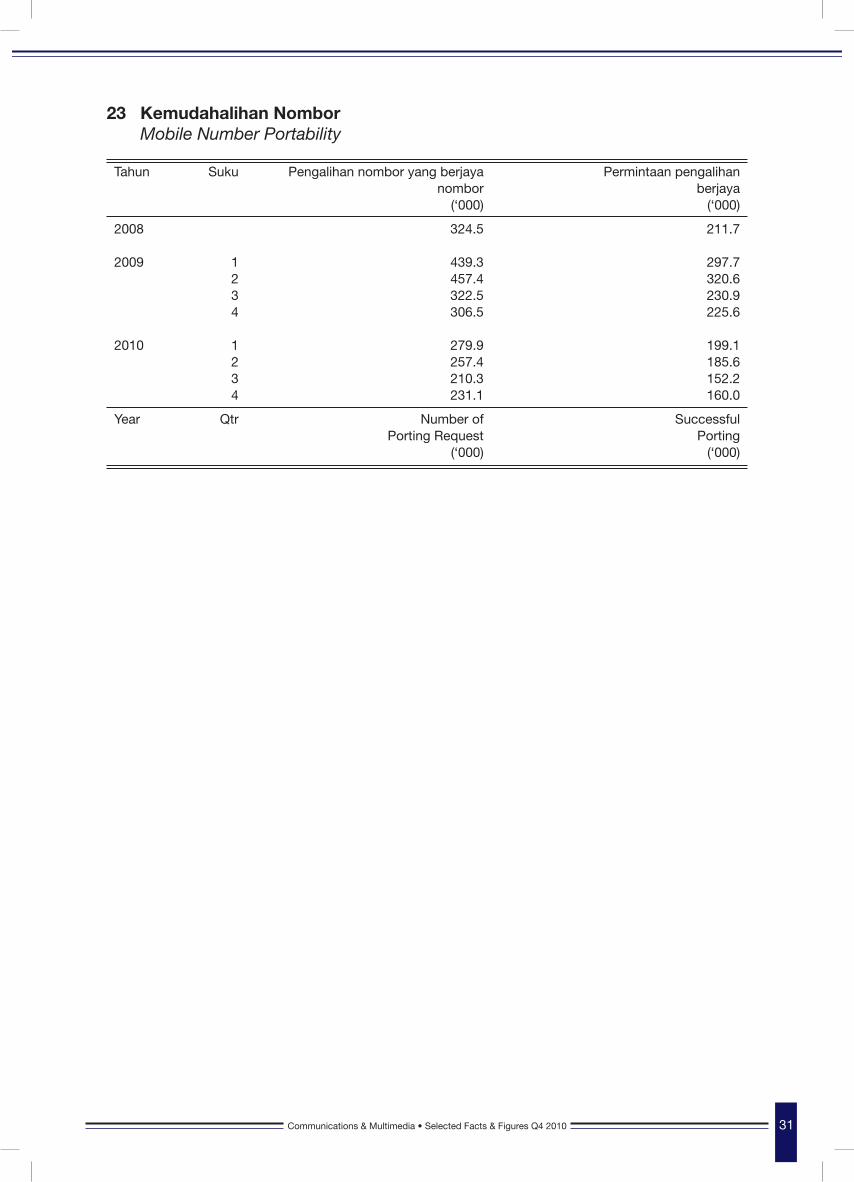
Tahun Suku Pengalihan nombor yang berjaya Permintaan pengalihan nombor berjaya (‘000) (‘000)
2008 324.5 211.7 2009 1 439.3 297.7 2 457.4 320.6 3 322.5 230.9 4 306.5 225.6 2010 1 279.9 199.1 2 257.4 185.6 3 210.3 152.2 4 231.1 160.0
Year Qtr Number of Successful Porting Request Porting (‘000) (‘000)
23 Kemudahalihan Nombor Mobile Number Portability
32 Communications & Multimedia • Selected Facts & Figures Q4 2010 Communications & Multimedia • Selected Facts & Figures Q4 2010
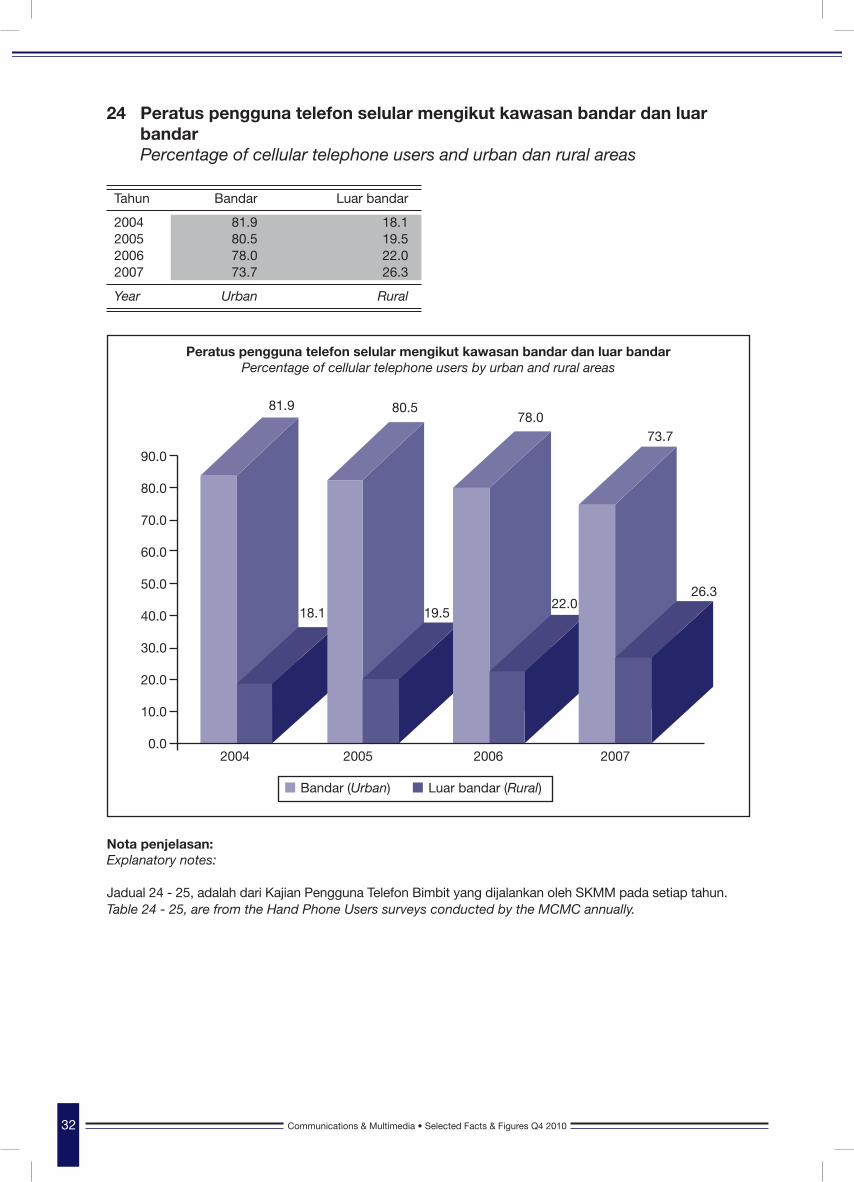
Tahun Bandar Luar bandar
2004 81.9 18.1 2005 80.5 19.5 2006 78.0 22.0 2007 73.7 26.3
Year Urban Rural
Nota penjelasan: Explanatory notes:
Jadual 24 - 25, adalah dari Kajian Pengguna Telefon Bimbit yang dijalankan oleh SKMM pada setiap tahun. Table 24 - 25, are from the Hand Phone Users surveys conducted by the MCMC annually.
24 Peratus pengguna telefon selular mengikut kawasan bandar dan luar bandar Percentage of cellular telephone users and urban dan rural areas
Peratus pengguna telefon selular mengikut kawasan bandar dan luar bandarPercentage of cellular telephone users by urban and rural areas
90.0
80.0
70.0
60.0
50.0
40.0
30.0
20.0
10.0
0.0
81.9
18.1
80.5
19.5
78.073.7
22.026.3
2004 2005 2006 2007
Bandar (Urban) Luar bandar (Rural)
Communications & Multimedia • Selected Facts & Figures Q4 2010 33Communications & Multimedia • Selected Facts & Figures Q4 2010
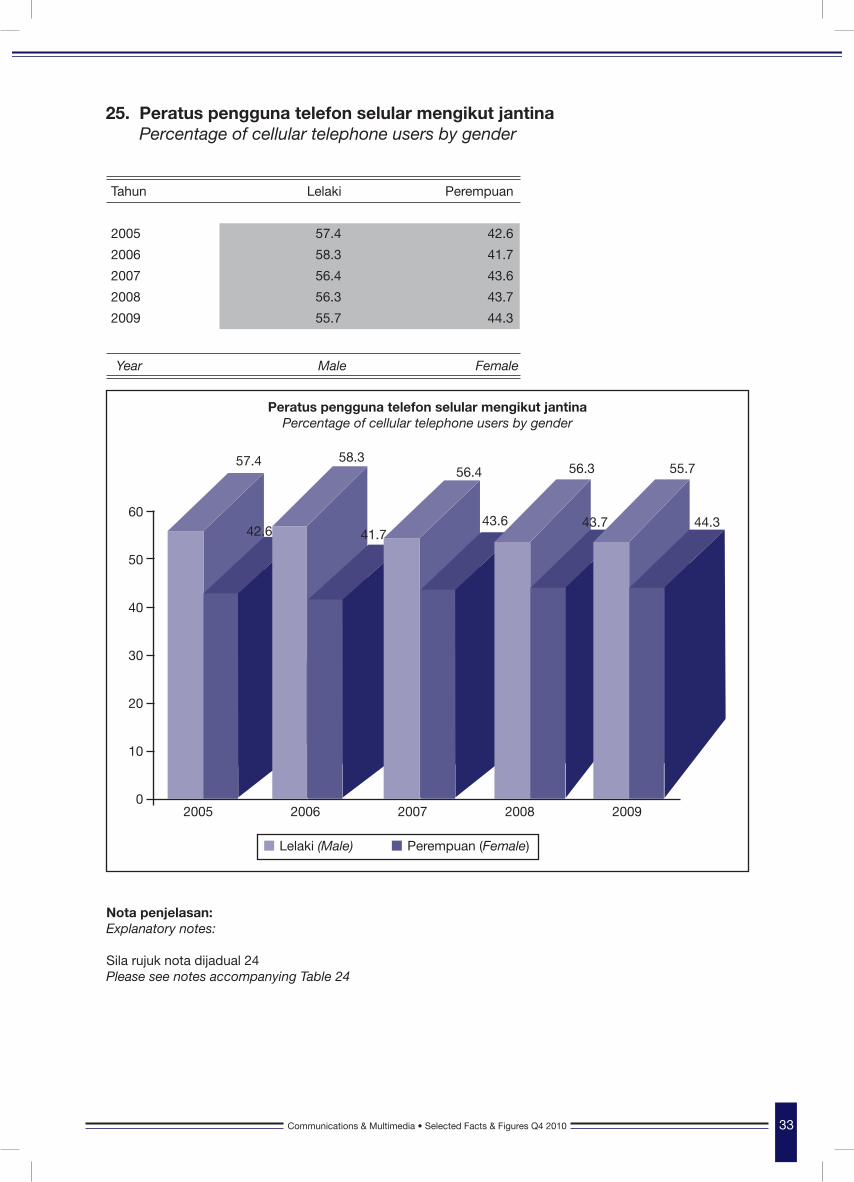
Tahun Lelaki Perempuan
2005 57.4 42.6
2006 58.3 41.7
2007 56.4 43.6
2008 56.3 43.7
2009 55.7 44.3
Year Male Female
25. Peratus pengguna telefon selular mengikut jantina Percentage of cellular telephone users by gender
Peratus pengguna telefon selular mengikut jantinaPercentage of cellular telephone users by gender
Lelaki (Male) Perempuan (Female)
60
50
40
30
20
10
0
57.4
42.6
2005 2006 2007 2008
Nota penjelasan: Explanatory notes:
Sila rujuk nota dijadual 24Please see notes accompanying Table 24
58.3
41.7
56.4
43.6
56.3
2009
55.7
44.343.7
34 Communications & Multimedia • Selected Facts & Figures Q4 2010 Communications & Multimedia • Selected Facts & Figures Q4 2010
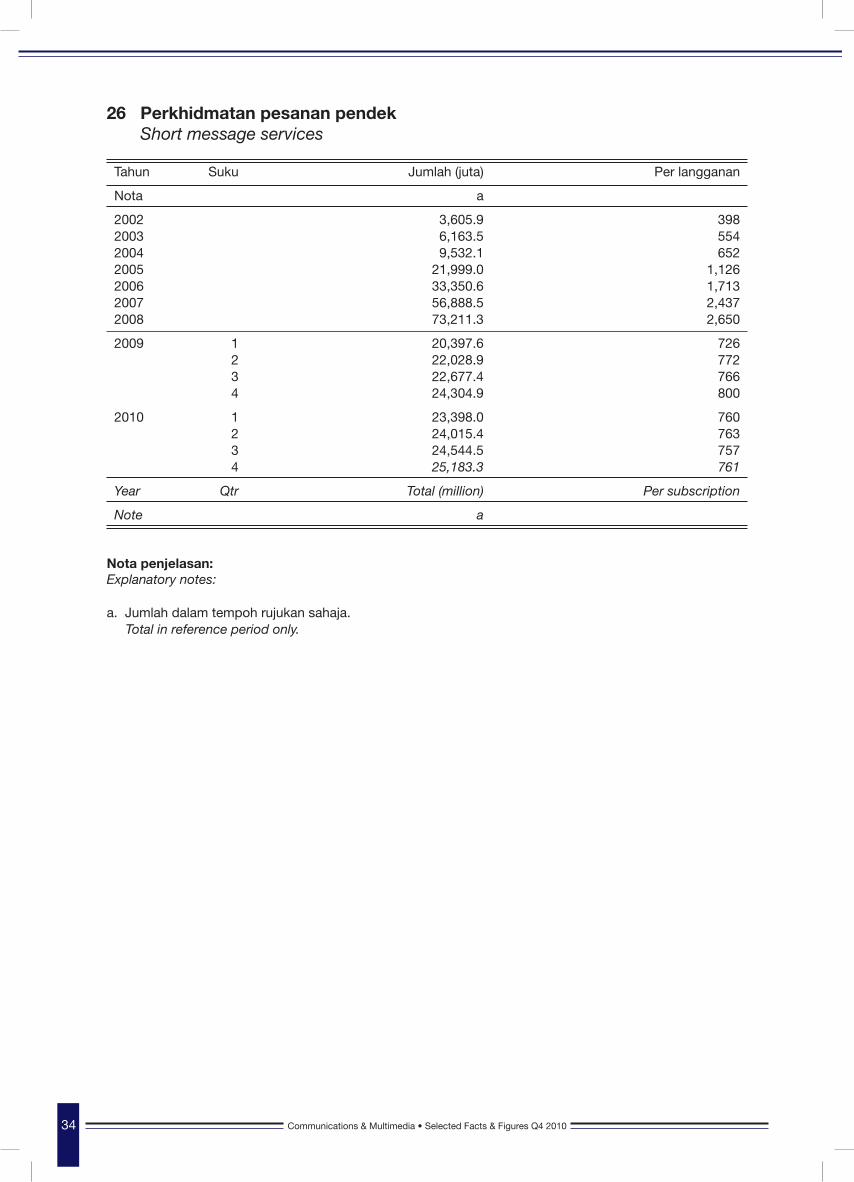
Tahun Suku Jumlah (juta) Per langganan
Nota a
2002 3,605.9 398 2003 6,163.5 554 2004 9,532.1 652 2005 21,999.0 1,126 2006 33,350.6 1,713 2007 56,888.5 2,437 2008 73,211.3 2,650
2009 1 20,397.6 726 2 22,028.9 772 3 22,677.4 766 4 24,304.9 800
2010 1 23,398.0 760 2 24,015.4 763 3 24,544.5 757 4 25,183.3 761
Year Qtr Total (million) Per subscription
Note a Nota penjelasan: Explanatory notes:
a. Jumlah dalam tempoh rujukan sahaja. Total in reference period only.
26 Perkhidmatan pesanan pendek Short message services
Communications & Multimedia • Selected Facts & Figures Q4 2010 35Communications & Multimedia • Selected Facts & Figures Q4 2010
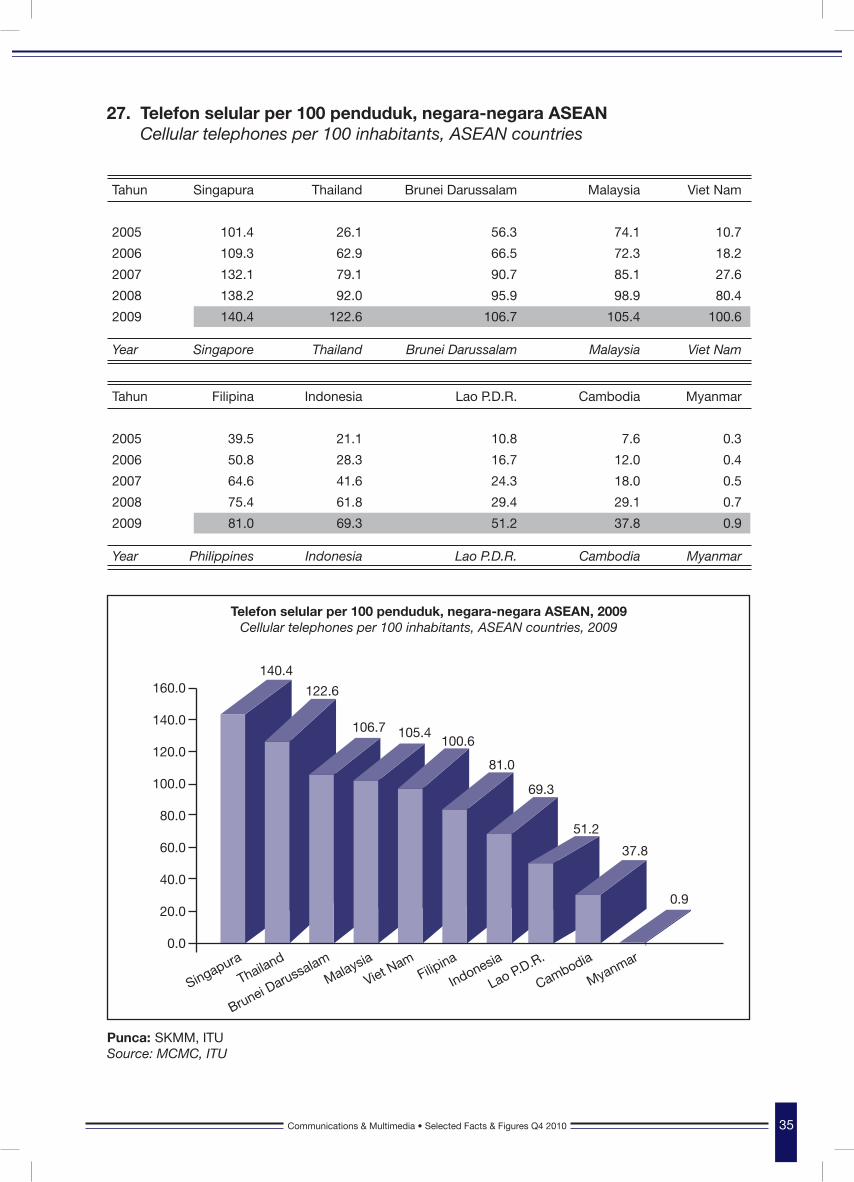
27. Telefon selular per 100 penduduk, negara-negara ASEAN Cellular telephones per 100 inhabitants, ASEAN countries
Tahun Singapura Thailand Brunei Darussalam Malaysia Viet Nam
2005 101.4 26.1 56.3 74.1 10.7
2006 109.3 62.9 66.5 72.3 18.2
2007 132.1 79.1 90.7 85.1 27.6
2008 138.2 92.0 95.9 98.9 80.4
2009 140.4 122.6 106.7 105.4 100.6
Year Singapore Thailand Brunei Darussalam Malaysia Viet Nam
Tahun Filipina Indonesia Lao P.D.R. Cambodia Myanmar
2005 39.5 21.1 10.8 7.6 0.3
2006 50.8 28.3 16.7 12.0 0.4
2007 64.6 41.6 24.3 18.0 0.5
2008 75.4 61.8 29.4 29.1 0.7
2009 81.0 69.3 51.2 37.8 0.9
Year Philippines Indonesia Lao P.D.R. Cambodia Myanmar
Telefon selular per 100 penduduk, negara-negara ASEAN, 2009Cellular telephones per 100 inhabitants, ASEAN countries, 2009
160.0
140.0
120.0
100.0
80.0
60.0
40.0
20.0
0.0
140.4
122.6
106.7 105.4100.6
81.0
51.2
69.3
37.8
0.9
Singapura
Viet Nam
Brunei Darussalam
Indonesia
ThailandFilip
ina
Malaysia
Lao P.D.R.
Myanmar
Cambodia
Punca: SKMM, ITU Source: MCMC, ITU
36 Communications & Multimedia • Selected Facts & Figures Q4 2010 Communications & Multimedia • Selected Facts & Figures Q4 2010
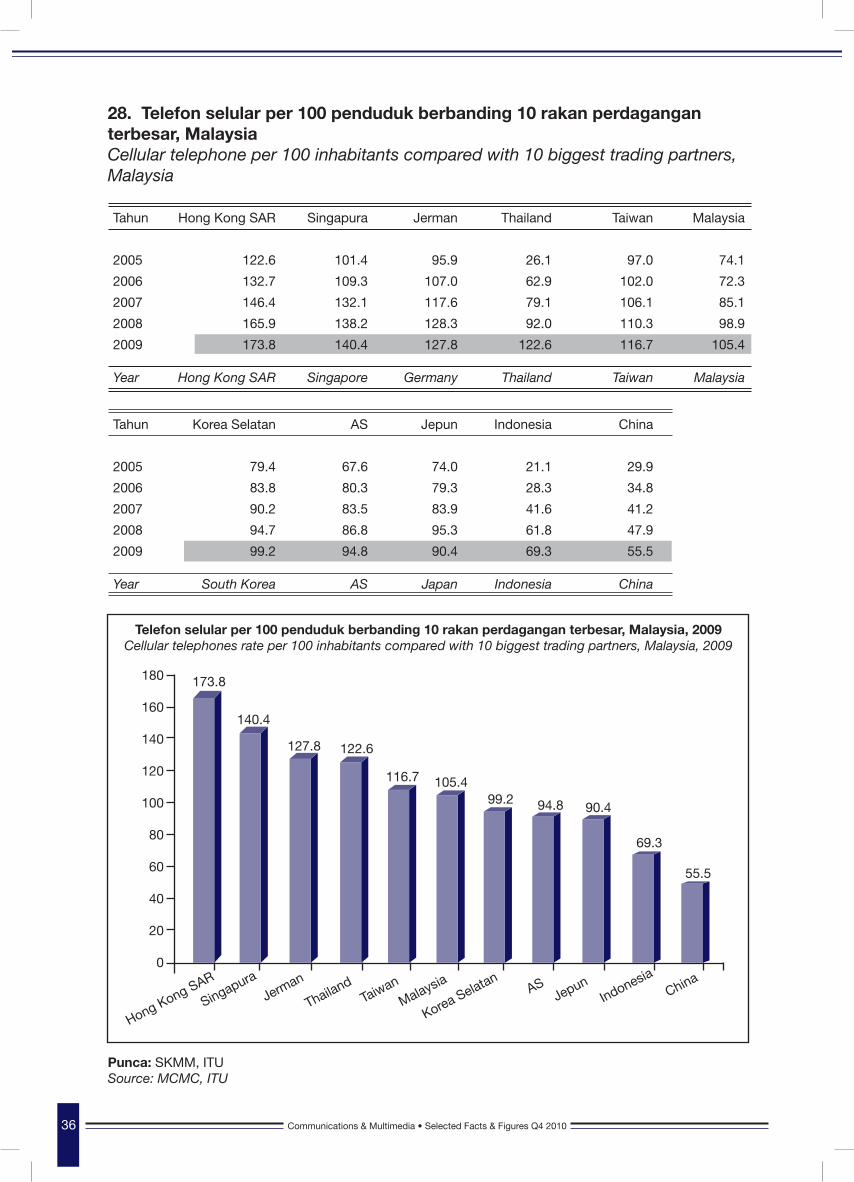
28. Telefon selular per 100 penduduk berbanding 10 rakan perdagangan terbesar, Malaysia Cellular telephone per 100 inhabitants compared with 10 biggest trading partners, Malaysia
Tahun Hong Kong SAR Singapura Jerman Thailand Taiwan Malaysia
2005 122.6 101.4 95.9 26.1 97.0 74.1
2006 132.7 109.3 107.0 62.9 102.0 72.3
2007 146.4 132.1 117.6 79.1 106.1 85.1
2008 165.9 138.2 128.3 92.0 110.3 98.9
2009 173.8 140.4 127.8 122.6 116.7 105.4
Year Hong Kong SAR Singapore Germany Thailand Taiwan Malaysia
Tahun Korea Selatan AS Jepun Indonesia China
2005 79.4 67.6 74.0 21.1 29.9
2006 83.8 80.3 79.3 28.3 34.8
2007 90.2 83.5 83.9 41.6 41.2
2008 94.7 86.8 95.3 61.8 47.9
2009 99.2 94.8 90.4 69.3 55.5
Year South Korea AS Japan Indonesia China
Punca: SKMM, ITUSource: MCMC, ITU
Telefon selular per 100 penduduk berbanding 10 rakan perdagangan terbesar, Malaysia, 2009Cellular telephones rate per 100 inhabitants compared with 10 biggest trading partners, Malaysia, 2009
180
160
140
120
100
80
60
40
20
0
Hong Kong SARTaiwan
Indonesia
Jerman
Korea Selatan
Singapura
MalaysiaChina
ThailandJepunAS
173.8
140.4
127.8 122.6
116.7 105.4
69.3
99.2
55.5
94.8 90.4

KOMUNIKASI & MULTIMEDIAFAKTA & ANGKA TERPILIH
COMMUNICATIONS & MULTIMEDIASELECTED FACTS & FIGURES
Q42 0 1 0


Communications & Multimedia • Selected Facts & Figures Q4 2010 39Communications & Multimedia • Selected Facts & Figures Q4 2010
Tahun Suku Kediaman Bilangan langganan Jumlah langganan Bilangan Kadar perniagaan (‘000) langganan penembusan (‘000) (‘000) (per 100 isi rumah)
2000 3,392 66.4 1,236 4,628 2001 3,400 65.1 1,310 4,710 2002 3,323 62.3 1,347 4,670 2003 3,194 58.0 1,378 4,572 2004 2,938 52.3 1,508 4,446 2005 2,839 49.5 1,527 4,366 2006 2,831 48.3 1,511 4,342 2007 2,851 47.8 1,499 4,350 2008 2,734 44.9 1,558 4,292
2009 1 2,734 44.7 1,563 4,297 2 2,741 44.5 1,570 4,311 3 2,735 44.2 1,574 4,309 4 2,734 44.0 1,578 4,312
2010 1 2,745 42.5 1,583 4,328 2 2,767 42.3 1,592 4,359 3 2,796 42.4 1,595 4,391 4 2,804 42.5 1,602 4,406
Year Qtr Residential Number of Total subscriptions Number of Penetration rate business (‘000) subscriptions (per 100 subscriptions (‘000) households) (‘000) Nota penjelasan: Explanatory notes:
Sambungan Talian Ibusawat Terus merujuk kepada talian tetap yang menyambungkan peralatan pelanggan terus ke ibusawat. Direct Exchange Line (DEL) connects a customer’s equipment to the Public Switched Telephone Network (PSTN) and has a dedicated port on a telephone exchange.
29 Bilangan Talian Ibusawat Terus dan kadar penembusan Number of DEL connections and penetration rate
40 Communications & Multimedia • Selected Facts & Figures Q4 2010 Communications & Multimedia • Selected Facts & Figures Q4 2010
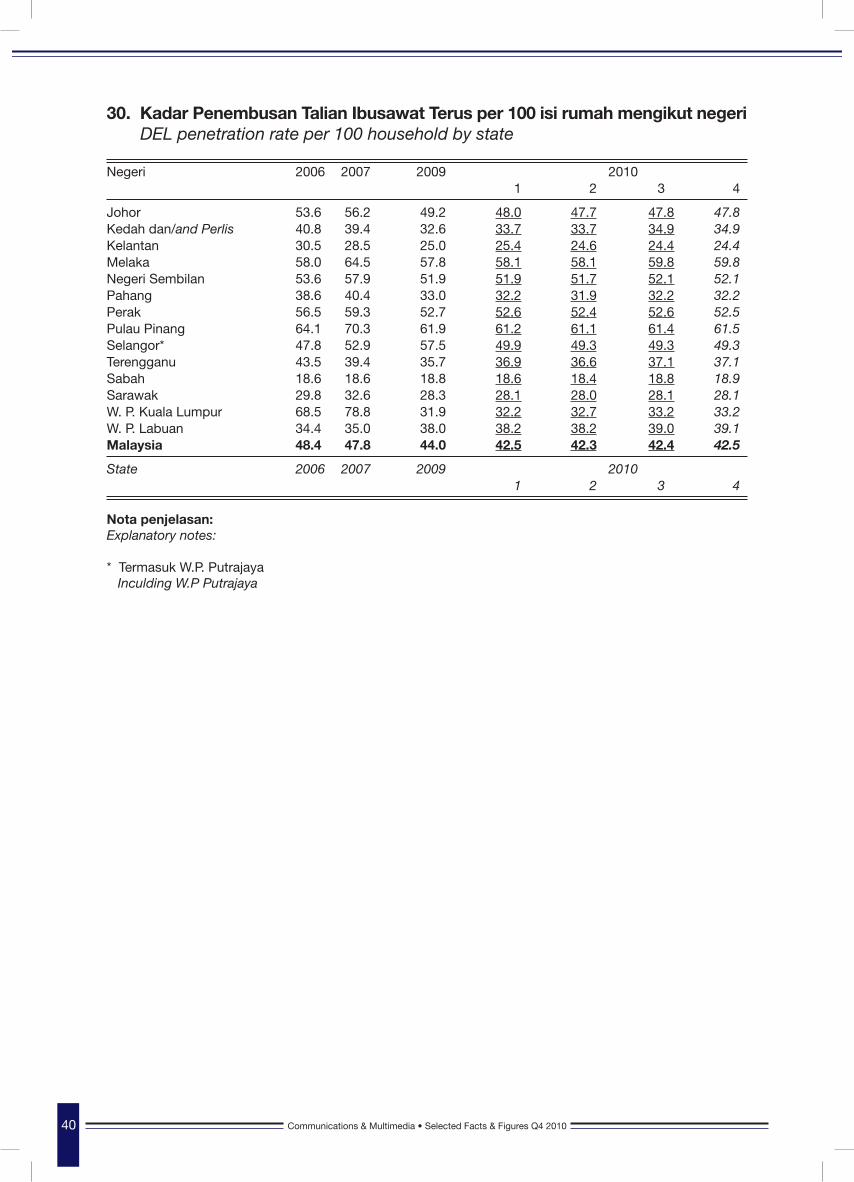
30. Kadar Penembusan Talian Ibusawat Terus per 100 isi rumah mengikut negeri DEL penetration rate per 100 household by state
Negeri 2006 2007 2009 2010 1 2 3 4
Johor 53.6 56.2 49.2 48.0 47.7 47.8 47.8Kedah dan/and Perlis 40.8 39.4 32.6 33.7 33.7 34.9 34.9Kelantan 30.5 28.5 25.0 25.4 24.6 24.4 24.4Melaka 58.0 64.5 57.8 58.1 58.1 59.8 59.8Negeri Sembilan 53.6 57.9 51.9 51.9 51.7 52.1 52.1Pahang 38.6 40.4 33.0 32.2 31.9 32.2 32.2Perak 56.5 59.3 52.7 52.6 52.4 52.6 52.5 Pulau Pinang 64.1 70.3 61.9 61.2 61.1 61.4 61.5Selangor* 47.8 52.9 57.5 49.9 49.3 49.3 49.3Terengganu 43.5 39.4 35.7 36.9 36.6 37.1 37.1Sabah 18.6 18.6 18.8 18.6 18.4 18.8 18.9Sarawak 29.8 32.6 28.3 28.1 28.0 28.1 28.1W. P. Kuala Lumpur 68.5 78.8 31.9 32.2 32.7 33.2 33.2W. P. Labuan 34.4 35.0 38.0 38.2 38.2 39.0 39.1Malaysia 48.4 47.8 44.0 42.5 42.3 42.4 42.5
State 2006 2007 2009 2010 1 2 3 4
Nota penjelasan: Explanatory notes:
* Termasuk W.P. Putrajaya Inculding W.P Putrajaya
Communications & Multimedia • Selected Facts & Figures Q4 2010 41Communications & Multimedia • Selected Facts & Figures Q4 2010
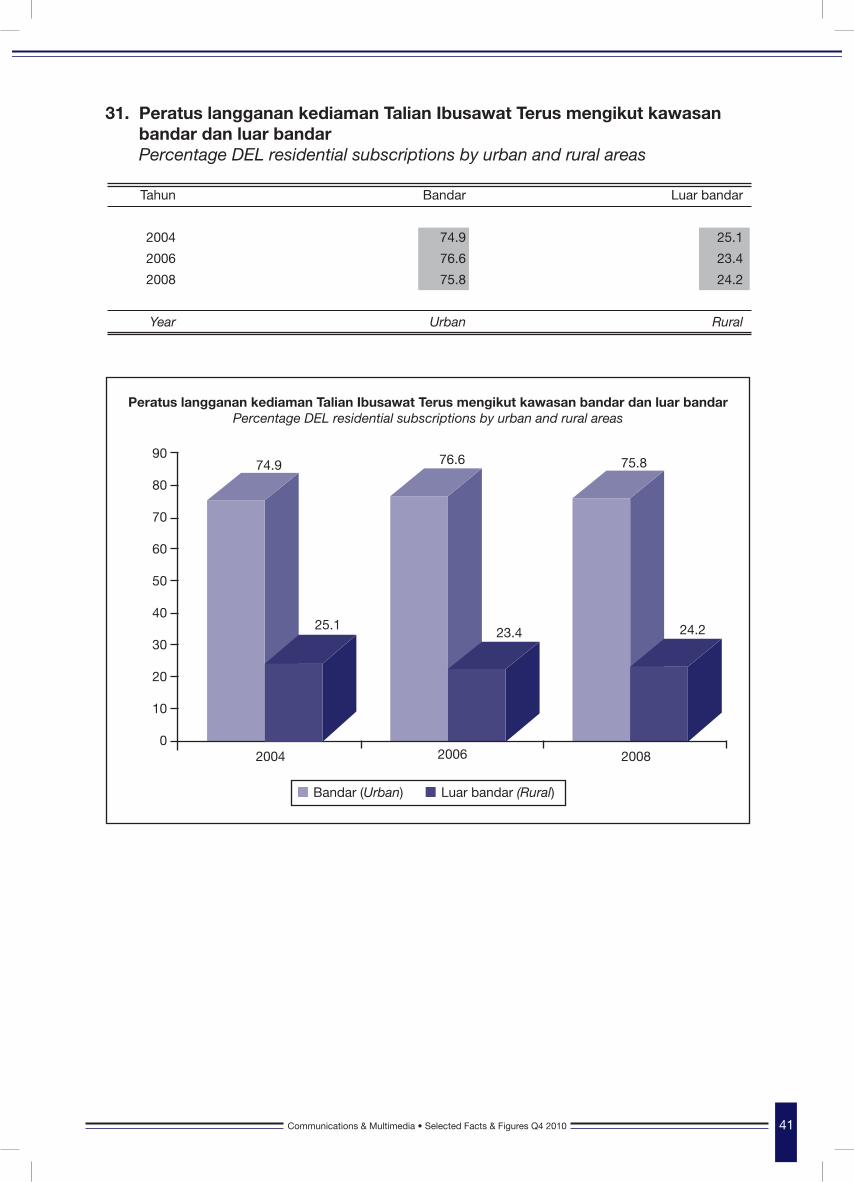
31. Peratus langganan kediaman Talian Ibusawat Terus mengikut kawasan bandar dan luar bandar Percentage DEL residential subscriptions by urban and rural areas
Tahun Bandar Luar bandar
2004 74.9 25.1
2006 76.6 23.4
2008 75.8 24.2
Year Urban Rural
Bandar (Urban) Luar bandar (Rural)
2004 2006 2008
90
80
70
60
50
40
30
20
10
0
74.9 76.6 75.8
23.4 24.2
Peratus langganan kediaman Talian Ibusawat Terus mengikut kawasan bandar dan luar bandarPercentage DEL residential subscriptions by urban and rural areas
25.1
42 Communications & Multimedia • Selected Facts & Figures Q4 2010 Communications & Multimedia • Selected Facts & Figures Q4 2010
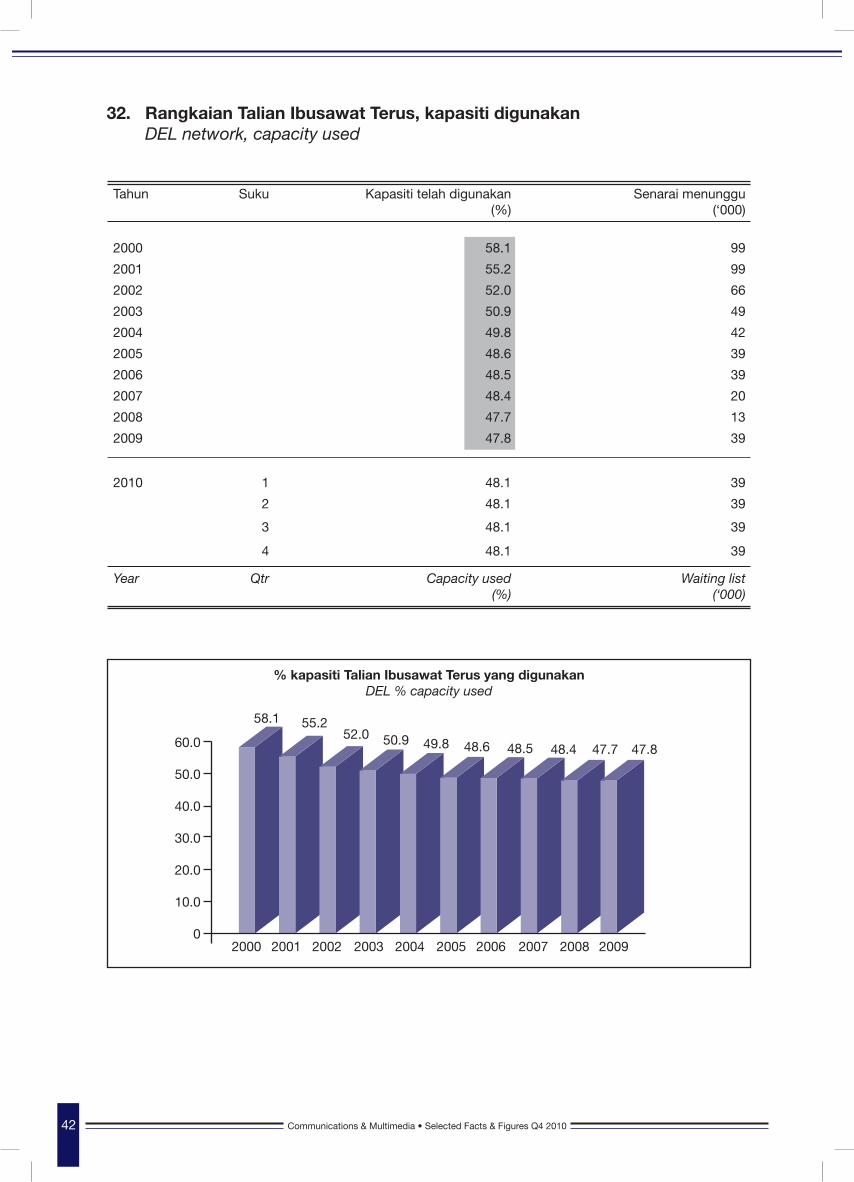
32. Rangkaian Talian Ibusawat Terus, kapasiti digunakan DEL network, capacity used
Tahun Suku Kapasiti telah digunakan (%)
Senarai menunggu (‘000)
2000 58.1 99
2001 55.2 99
2002 52.0 66
2003 50.9 49
2004 49.8 42
2005 48.6 39
2006 48.5 39
2007 48.4 20
2008 47.7 13
2009 47.8 39
2010 1 48.1 39
2 48.1 39
3 48.1 39
4 48.1 39
Year Qtr Capacity used (%)
Waiting list (‘000)
% kapasiti Talian Ibusawat Terus yang digunakanDEL % capacity used
60.0
50.0
40.0
30.0
20.0
10.0
02000 2001 2002 2003 2004 2005 2006 2007 2008 2009
58.1 55.252.0 50.9 49.8 48.6 48.5 48.4 47.7 47.8
Communications & Multimedia • Selected Facts & Figures Q4 2010 43Communications & Multimedia • Selected Facts & Figures Q4 2010
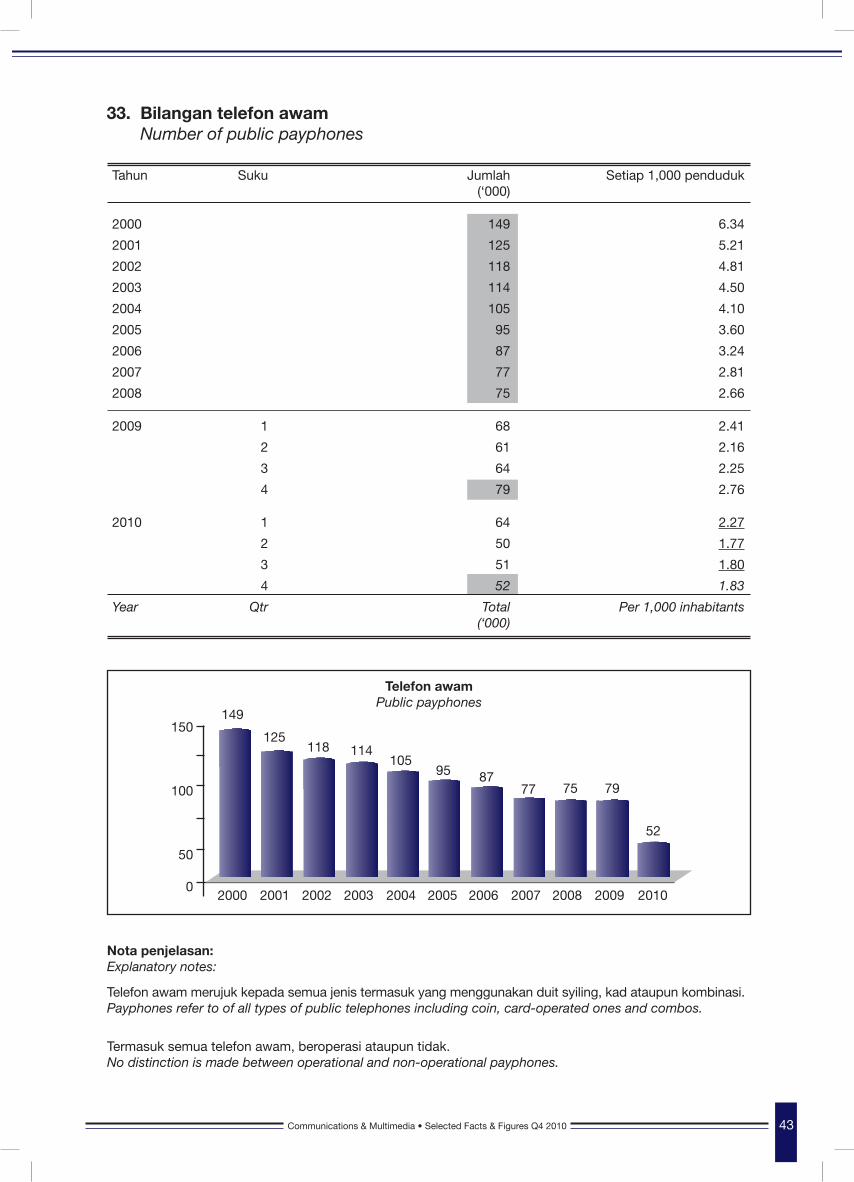
33. Bilangan telefon awam Number of public payphones
Tahun Suku Jumlah (‘000)
Setiap 1,000 penduduk
2000 149 6.34
2001 125 5.21
2002 118 4.81
2003 114 4.50
2004 105 4.10
2005 95 3.60
2006 87 3.24
2007 77 2.81
2008 75 2.66
2009 1 68 2.41
2 61 2.16
3 64 2.25
4 79 2.76
2010 1 64 2.27
2 50 1.77
3 51 1.80
4 52 1.83
Year Qtr Total (‘000)
Per 1,000 inhabitants
Nota penjelasan: Explanatory notes:
Telefon awam merujuk kepada semua jenis termasuk yang menggunakan duit syiling, kad ataupun kombinasi. Payphones refer to of all types of public telephones including coin, card-operated ones and combos.
Termasuk semua telefon awam, beroperasi ataupun tidak. No distinction is made between operational and non-operational payphones.
Telefon awam Public payphones
150
100
50
02000 2001 2002 2003 2004 2005 2006 2007 2008 2009 2010
149
125118 114
10595 87
77 75 79
52
44 Communications & Multimedia • Selected Facts & Figures Q4 2010 Communications & Multimedia • Selected Facts & Figures Q4 2010
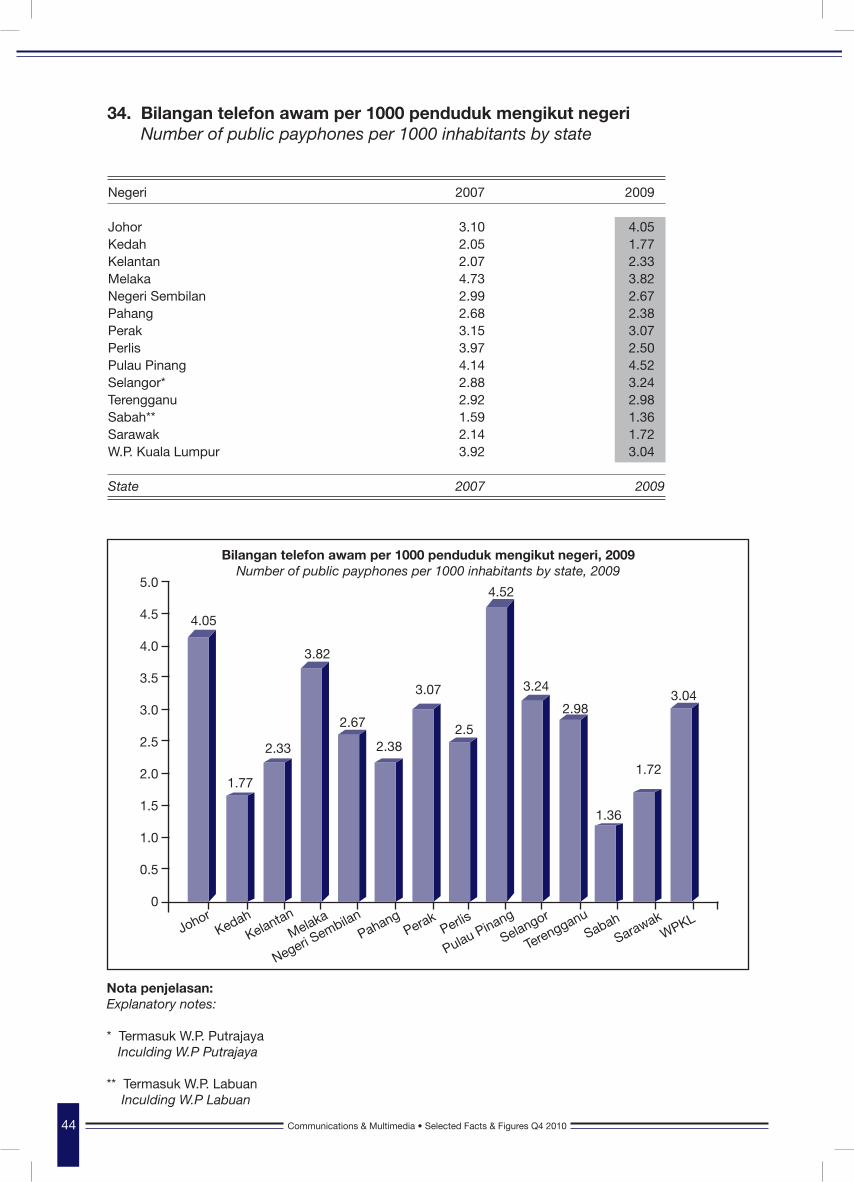
34. Bilangan telefon awam per 1000 penduduk mengikut negeri Number of public payphones per 1000 inhabitants by state
Negeri 2007 2009 Johor 3.10 4.05Kedah 2.05 1.77Kelantan 2.07 2.33Melaka 4.73 3.82Negeri Sembilan 2.99 2.67Pahang 2.68 2.38Perak 3.15 3.07Perlis 3.97 2.50Pulau Pinang 4.14 4.52Selangor* 2.88 3.24Terengganu 2.92 2.98Sabah** 1.59 1.36Sarawak 2.14 1.72W.P. Kuala Lumpur 3.92 3.04
State 2007 2009
Bilangan telefon awam per 1000 penduduk mengikut negeri, 2009Number of public payphones per 1000 inhabitants by state, 2009
5.0
4.5
4.0
3.5
3.0
2.5
2.0
1.5
1.0
0.5
0
Johor
Negeri Sembilan
Selangor
Kelantan
Pulau PinangSabah
WPKLKedah
Pahang
TerengganuMelaka
PerlisPerak
Sarawak
4.05
1.77
2.33
3.82
2.67
2.38
3.24
4.52
2.983.07
1.36
3.04
2.5
1.72
Nota penjelasan: Explanatory notes:
* Termasuk W.P. Putrajaya Inculding W.P Putrajaya
** Termasuk W.P. Labuan Inculding W.P Labuan

Communications & Multimedia • Selected Facts & Figures Q4 2010 45Communications & Multimedia • Selected Facts & Figures Q4 2010
Tahun Bandar Luar bandar
2004 79.4 20.6
2006 82.3 17.7
2008 76.7 23.3
Year Urban Rural
35. Peratus telefon awam mengikut kawasan bandar dan luar bandar Percentage of public payphones by urban and rural areas
Peratus telefon awam mengikut kawasan bandar dan luar bandarPercentage of public payphones by urban and rural areas
90
80
70
60
50
40
30
20
10
0
79.4
20.6
82.3
17.7
76.7
23.3
Bandar (Urban) Luar bandar (Rural)
2004 2006 2008
46 Communications & Multimedia • Selected Facts & Figures Q4 2010 Communications & Multimedia • Selected Facts & Figures Q4 2010
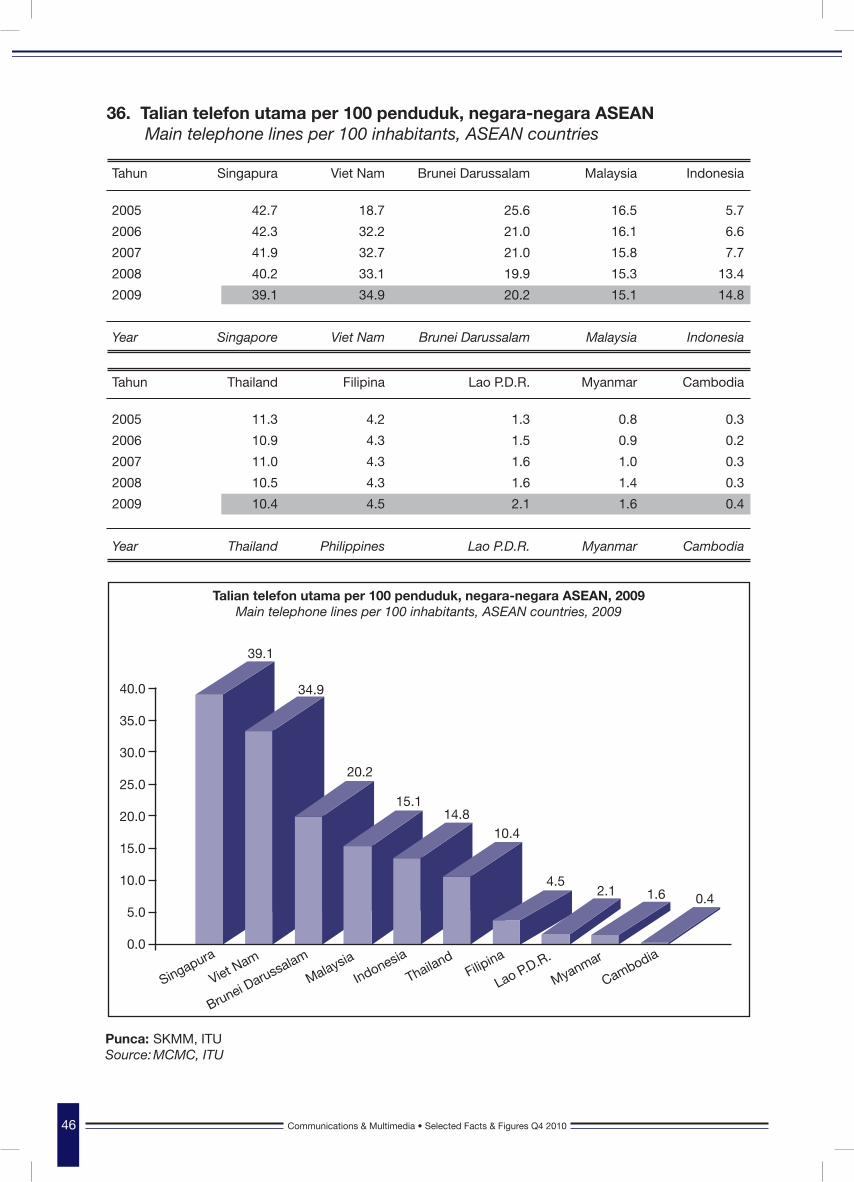
36. Talian telefon utama per 100 penduduk, negara-negara ASEAN Main telephone lines per 100 inhabitants, ASEAN countries
Tahun Singapura Viet Nam Brunei Darussalam Malaysia Indonesia
2005 42.7 18.7 25.6 16.5 5.7
2006 42.3 32.2 21.0 16.1 6.6
2007 41.9 32.7 21.0 15.8 7.7
2008 40.2 33.1 19.9 15.3 13.4
2009 39.1 34.9 20.2 15.1 14.8
Year Singapore Viet Nam Brunei Darussalam Malaysia Indonesia
Tahun Thailand Filipina Lao P.D.R. Myanmar Cambodia
2005 11.3 4.2 1.3 0.8 0.3
2006 10.9 4.3 1.5 0.9 0.2
2007 11.0 4.3 1.6 1.0 0.3
2008 10.5 4.3 1.6 1.4 0.3
2009 10.4 4.5 2.1 1.6 0.4
Year Thailand Philippines Lao P.D.R. Myanmar Cambodia
Talian telefon utama per 100 penduduk, negara-negara ASEAN, 2009Main telephone lines per 100 inhabitants, ASEAN countries, 2009
40.0
35.0
30.0
25.0
20.0
15.0
10.0
5.0
0.0
Singapura
Indonesia
Cambodia
Brunei DarussalamFilip
ina
Viet Nam
Thailand
Malaysia
Myanmar
Lao P.D.R.
39.1
34.9
20.2
15.114.8
10.4
0.44.5
2.1 1.6
Punca: SKMM, ITUSource: MCMC, ITU
Communications & Multimedia • Selected Facts & Figures Q4 2010 47Communications & Multimedia • Selected Facts & Figures Q4 2010
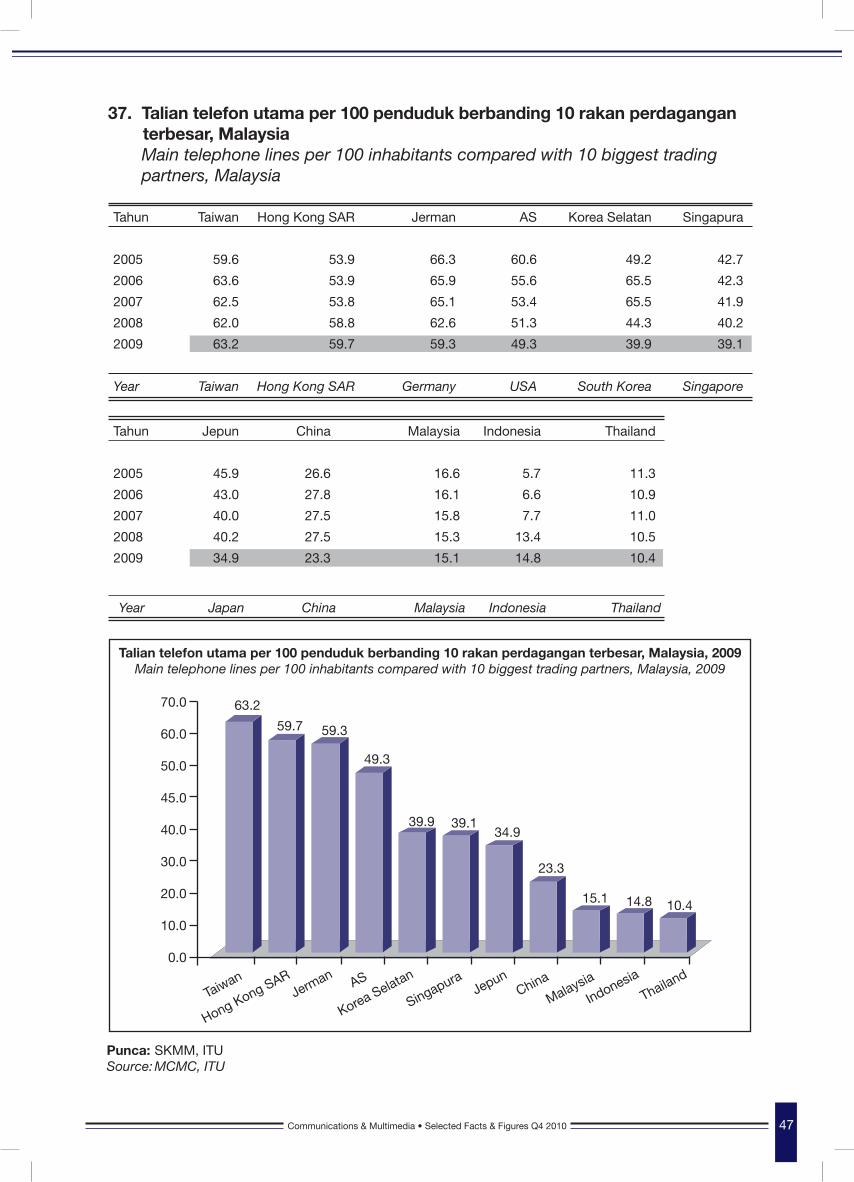
37. Talian telefon utama per 100 penduduk berbanding 10 rakan perdagangan terbesar, Malaysia Main telephone lines per 100 inhabitants compared with 10 biggest trading partners, Malaysia
Tahun Taiwan Hong Kong SAR Jerman AS Korea Selatan Singapura
2005 59.6 53.9 66.3 60.6 49.2 42.7
2006 63.6 53.9 65.9 55.6 65.5 42.3
2007 62.5 53.8 65.1 53.4 65.5 41.9
2008 62.0 58.8 62.6 51.3 44.3 40.2
2009 63.2 59.7 59.3 49.3 39.9 39.1
Year Taiwan Hong Kong SAR Germany USA South Korea Singapore
Tahun Jepun China Malaysia Indonesia Thailand
2005 45.9 26.6 16.6 5.7 11.3
2006 43.0 27.8 16.1 6.6 10.9
2007 40.0 27.5 15.8 7.7 11.0
2008 40.2 27.5 15.3 13.4 10.5
2009 34.9 23.3 15.1 14.8 10.4
Year Japan China Malaysia Indonesia Thailand
Talian telefon utama per 100 penduduk berbanding 10 rakan perdagangan terbesar, Malaysia, 2009Main telephone lines per 100 inhabitants compared with 10 biggest trading partners, Malaysia, 2009
Punca: SKMM, ITU Source: MCMC, ITU
70.0
60.0
50.0
45.0
40.0
30.0
20.0
10.0
0.0
Jerman
Korea Selatan
Indonesia
Thailand
Hong Kong SARJepun
Taiwan
SingapuraAS
Malaysia China
63.2
59.7 59.3
49.3
39.9 39.1
14.8 10.4
34.9
23.3
15.1


KOMUNIKASI & MULTIMEDIAFAKTA & ANGKA TERPILIH
COMMUNICATIONS & MULTIMEDIASELECTED FACTS & FIGURES
Q42 0 1 0

Communications & Multimedia • Selected Facts & Figures Q4 2010 51Communications & Multimedia • Selected Facts & Figures Q4 2010
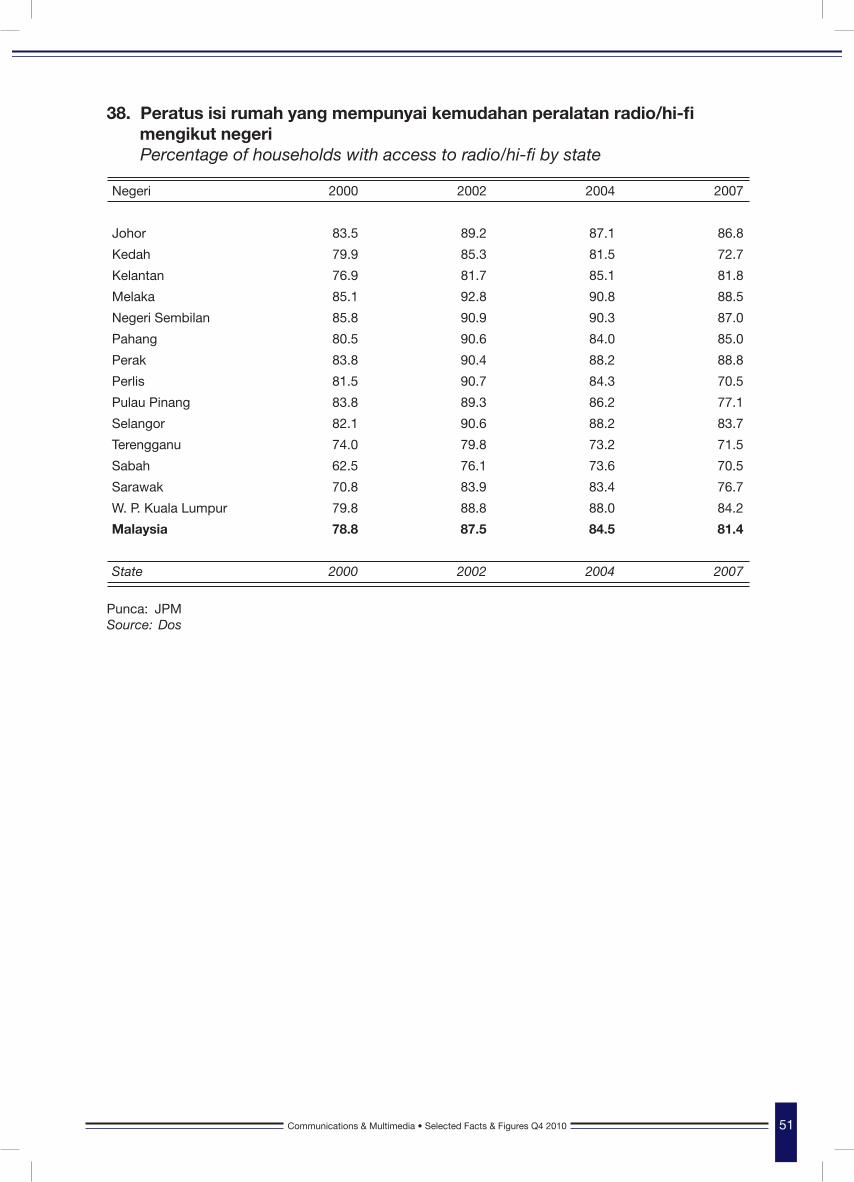
Negeri 2000 2002 2004 2007
Johor 83.5 89.2 87.1 86.8
Kedah 79.9 85.3 81.5 72.7
Kelantan 76.9 81.7 85.1 81.8
Melaka 85.1 92.8 90.8 88.5
Negeri Sembilan 85.8 90.9 90.3 87.0
Pahang 80.5 90.6 84.0 85.0
Perak 83.8 90.4 88.2 88.8
Perlis 81.5 90.7 84.3 70.5
Pulau Pinang 83.8 89.3 86.2 77.1
Selangor 82.1 90.6 88.2 83.7
Terengganu 74.0 79.8 73.2 71.5
Sabah 62.5 76.1 73.6 70.5
Sarawak 70.8 83.9 83.4 76.7
W. P. Kuala Lumpur 79.8 88.8 88.0 84.2
Malaysia 78.8 87.5 84.5 81.4
State 2000 2002 2004 2007
38. Peratus isi rumah yang mempunyai kemudahan peralatan radio/hi-fi mengikut negeri Percentage of households with access to radio/hi-fi by state
Punca: JPMSource: Dos
52 Communications & Multimedia • Selected Facts & Figures Q4 2010 Communications & Multimedia • Selected Facts & Figures Q4 2010
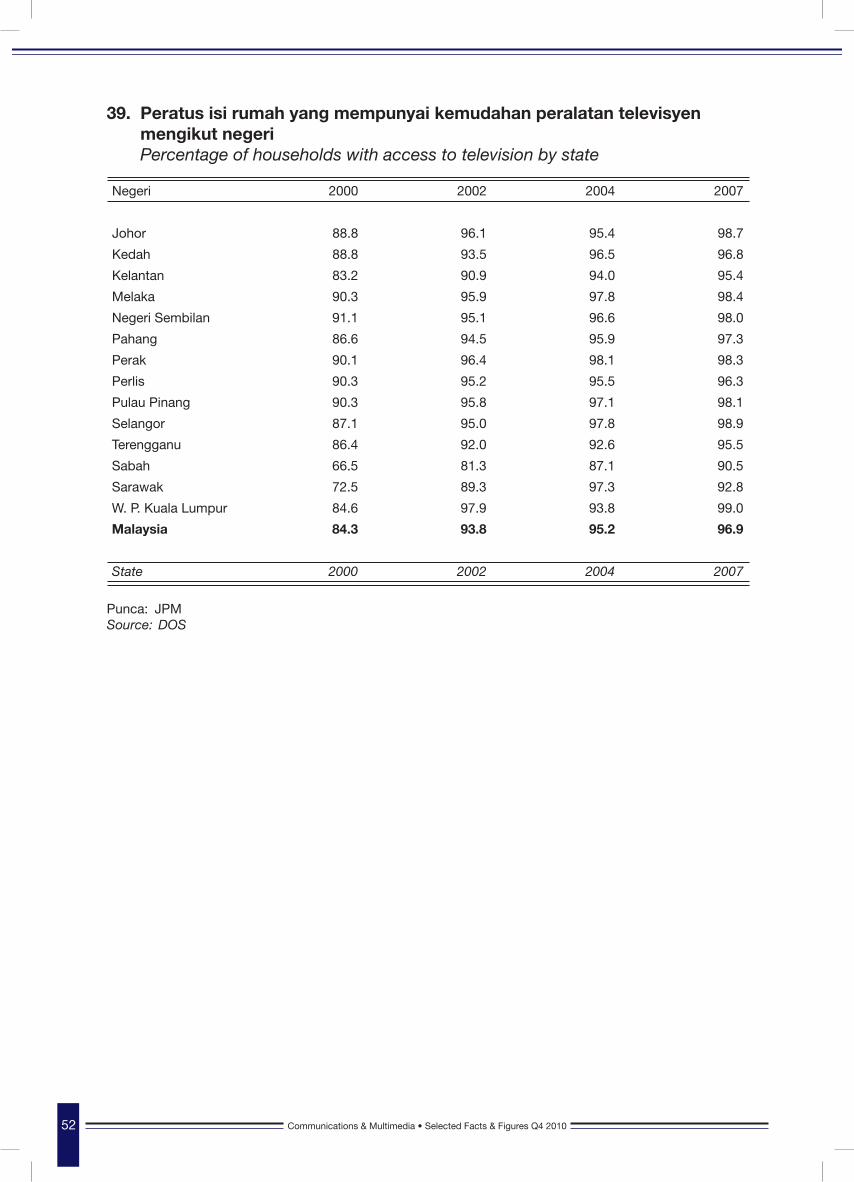
Negeri 2000 2002 2004 2007
Johor 88.8 96.1 95.4 98.7
Kedah 88.8 93.5 96.5 96.8
Kelantan 83.2 90.9 94.0 95.4
Melaka 90.3 95.9 97.8 98.4
Negeri Sembilan 91.1 95.1 96.6 98.0
Pahang 86.6 94.5 95.9 97.3
Perak 90.1 96.4 98.1 98.3
Perlis 90.3 95.2 95.5 96.3
Pulau Pinang 90.3 95.8 97.1 98.1
Selangor 87.1 95.0 97.8 98.9
Terengganu 86.4 92.0 92.6 95.5
Sabah 66.5 81.3 87.1 90.5
Sarawak 72.5 89.3 97.3 92.8
W. P. Kuala Lumpur 84.6 97.9 93.8 99.0
Malaysia 84.3 93.8 95.2 96.9
State 2000 2002 2004 2007
39. Peratus isi rumah yang mempunyai kemudahan peralatan televisyen mengikut negeri Percentage of households with access to television by state
Punca: JPMSource: DOS
Communications & Multimedia • Selected Facts & Figures Q4 2010 53Communications & Multimedia • Selected Facts & Figures Q4 2010
Negeri 2000 2002 2004 2007
Johor 56.0 74.8 78.9 84.0
Kedah 45.4 61.5 71.6 72.8
Kelantan 28.2 51.3 68.1 65.6
Melaka 59.4 74.7 78.7 81.6
Negeri Sembilan 60.3 76.0 81.7 83.1
Pahang 49.1 66.9 75.1 75.0
Perak 57.3 73.8 76.9 78.1
Perlis 41.8 59.4 71.0 68.7
Pulau Pinang 69.5 80.6 83.5 85.7
Selangor 66.8 78.4 85.8 87.8
Terengganu 36.3 56.7 62.4 64.2
Sabah 35.8 56.2 68.1 72.5
Sarawak 45.6 64.6 84.7 77.1
W. P. Kuala Lumpur 68.6 82.1 83.5 79.8
Malaysia 53.5 71.0 77.4 79.4
State 2000 2002 2004 2007
40. Peratus isi rumah yang mempunyai kemudahan peralatan VCR/VCD/DVD mengikut negeri Percentage of households with access to VCR/VCD/DVD by state
Punca: JPMSource: DOS
54 Communications & Multimedia • Selected Facts & Figures Q4 2010 Communications & Multimedia • Selected Facts & Figures Q4 2010
Stesen TVTahun Suku
RTM 1 RTM 2 TV3 NTV7 8TV Channel 9 Jumlah
2002 431,097 352,816 428,403 393,277 … … 1,605,593
2003 458,621 357,640 436,108 363,607 … … 1,615,976
2004 461,535 355,269 454,026 363,959 351,989 347,681 2,334,459
2005 467,467 396,937 470,868 368,289 400,620 33,364 2,137,545
2006 468,474 488,338 486,325 367,579 399,735 190,432 2,400,883
2007 463,289 521,605 498,855 396,687 447,117 381,035 2,708,588
2008 464,801 524,618 524,152 423,504 435,959 429,046 2,802,080
2009 1 132,925 127,438 129,122 104,498 105,844 101,666 701,493
2 134,304 130,801 130,071 99,743 103,568 103,393 701,880
3 119,881 132,145 113,448 100,742 104,667 105,810 676,693
4 110,219 131,557 117,463 101,551 105,523 99,968 666,281
2010 1 106,091 128,890 129,866 99,439 103,082 99,162 666,530
2 112,858 130,972 131,263 99,467 104,078 99,640 678,278
3 118,531 132,568 133,157 103,438 105,457 105,448 698,599
4 108,714 132,374 133,162 103,869 105,373 101,212 684,704
Year Qtr
RTM 1 RTM 2 TV3 NTV7 8TV Channel 9 Total
41. Bilangan minit penyiaran, TV bebas ke udara Number of broadcast minutes, free to air TV
Stesen TV
Bilangan minit penyiaran, TV bebas ke udaraNumber of broadcast minutes, free to air TV
Q4/2010
140,000
120,000
100,000
80,000
60,000
40,000
20,000
0RTM 1 NTV7RTM 2 8TVTV3 Channel 9
132,374 133,162
101,212108,714
103,869 105,373
Punca: AGB Nielsen Source: AGB Nielsen
Communications & Multimedia • Selected Facts & Figures Q4 2010 55Communications & Multimedia • Selected Facts & Figures Q4 2010
Tahun Suku
Isi Rumah Bukan Isi Rumah Jumlah
Kadar Penembusan per 100 isi rumah
2008 1 2,368 216 2,584 39.5
2 2,469 219 2,688 41.0
3 2,565 223 2,788 42.3
4 2,646 223 2,869 43.4
2009 1 2,728 225 2,953 44.6
2 2,781 231 3,012 45.2
3 2,875 237 3,112 46.5
4 2,930 242 3,172 47.1
2010 1 2,940 247 3,187 47.0
Year Qtr
Household Non-household Total
Penetration Rate per 100 household
Bilangan langganan (‘000)
Number of subscriptions (‘000)
42. Bilangan langganan televisyen berbayar Number of pay TV subscriptions


KOMUNIKASI & MULTIMEDIAFAKTA & ANGKA TERPILIH
COMMUNICATIONS & MULTIMEDIASELECTED FACTS & FIGURES
Q42 0 1 0

59Communications & Multimedia • Selected Facts & Figures Q4 2010
Tahun Suku Bilangan lesen
2005 3
2006 3
2007 3
2008 2
2009 2
2010 1 2
2 2
3 2
4 2
Year Qtr Number of licenses
43. Bilangan lesen Pihak Berkuasa Pemerakuan Number of Certification Authorities
Nota penjelasan: Explanatory notes:
Merujuk kepada Pihak Berkuasa Pemerakuan yang dilesenkan di bawah Akta Tandatangan Digital 1997. Refers to Certification Authorities licenced under the Digital Signature Act 1997.
60 Communications & Multimedia • Selected Facts & Figures Q4 2010
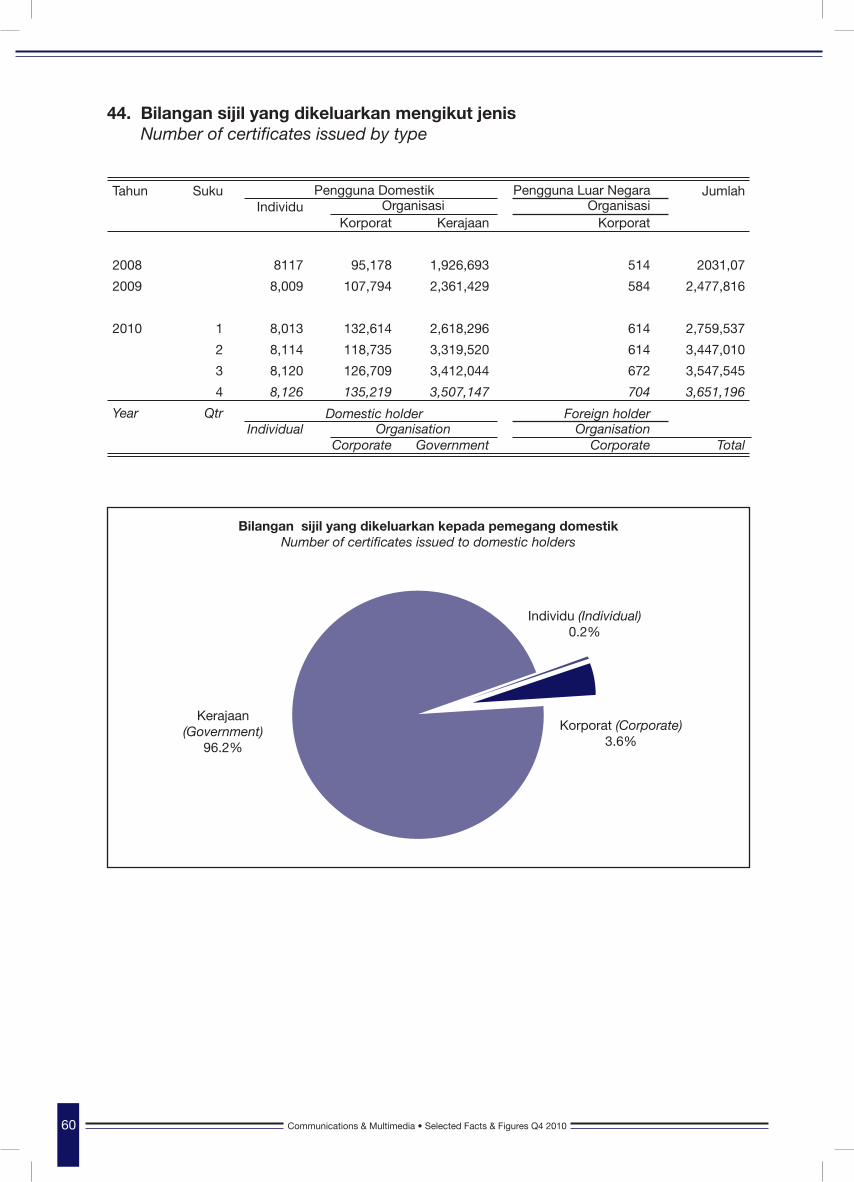
Pengguna DomestikTahun SukuIndividu
Korporat Kerajaan Korporat
Jumlah
2008 8117 95,178 1,926,693 514 2031,07
2009 8,009 107,794 2,361,429 584 2,477,816
2010 1 8,013 132,614 2,618,296 614 2,759,537
2 8,114 118,735 3,319,520 614 3,447,010
3 8,120 126,709 3,412,044 672 3,547,545
4 8,126 135,219 3,507,147 704 3,651,196
Year QtrIndividual
Corporate Government Corporate Total
Domestic holder
Organisasi
Organisation
Organisasi
Organisation
Pengguna Luar Negara
Foreign holder
44. Bilangan sijil yang dikeluarkan mengikut jenis Number of certificates issued by type
Bilangan sijil yang dikeluarkan kepada pemegang domestikNumber of certificates issued to domestic holders
Kerajaan(Government)
96.2%
Individu (Individual)0.2%
Korporat (Corporate)3.6%
KOMUNIKASI & MULTIMEDIAFAKTA & ANGKA TERPILIH
COMMUNICATIONS & MULTIMEDIASELECTED FACTS & FIGURES
Q42 0 1 0

63Communications & Multimedia • Selected Facts & Figures Q4 2010
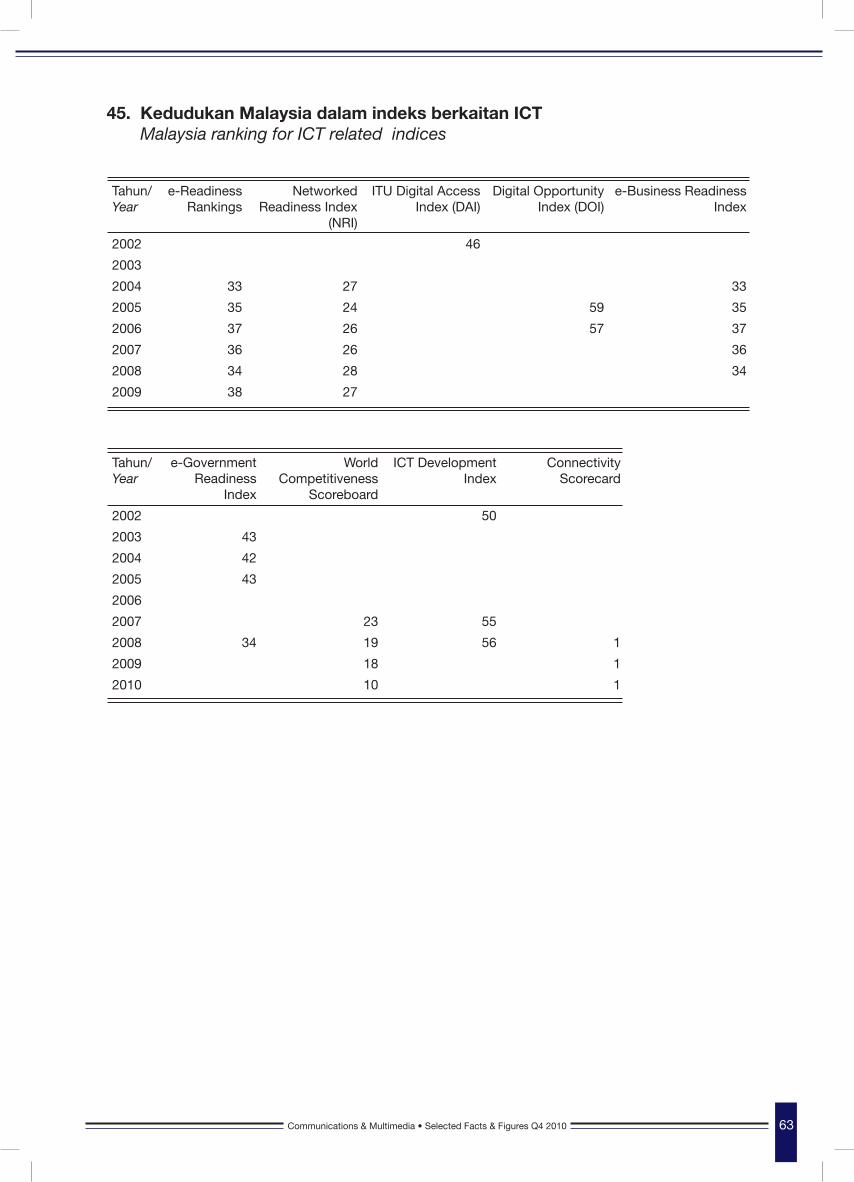
Tahun/Year
e-Readiness Rankings
Networked Readiness Index
(NRI)
ITU Digital Access Index (DAI)
Digital Opportunity Index (DOI)
e-Business Readiness Index
2002 46
2003
2004 33 27 33
2005 35 24 59 35
2006 37 26 57 37
2007 36 26 36
2008 34 28 34
2009 38 27
Tahun/Year
e-Government Readiness
Index
World Competitiveness
Scoreboard
ICT Development Index
ConnectivityScorecard
2002 50
2003 43
2004 42
2005 43
2006
2007 23 55
2008 34 19 56 1
2009 18 1
2010 10 1
45. Kedudukan Malaysia dalam indeks berkaitan ICT Malaysia ranking for ICT related indices
64 Communications & Multimedia • Selected Facts & Figures Q4 2010 Communications & Multimedia • Selected Facts & Figures Q4 2010
e-Readiness Ranking e-Readiness adalah tahap kesediaan infrastruktur teknologi maklumat dan komunikasi (ICT) sesebuah negara dan juga keupayaan pengguna, perniagaan dan kerajaannya menggunakan ICT. Indeks ini telah disusun untuk 69 ekonomi oleh Economist Intelligence Unit.e-Readiness is the readiness of a country’s information and communications technology (ICT) infrastructure and the ability of its consumers, businesses and government to use ICT to their benefit. The index has been compiled for 69 economies by Economist Intelligence Unit.
Networked Readiness Index (NRI)NRI mengukur kenderungan negara mengeksploitasikan peluang-peluang yang disediakan oleh ICT. Indeks ini telah disusun untuk 115 ekonomi oleh World Economic Forum.(NRI) measures the propensity for countries to exploit the opportunities offered by ICT. The index has been compiled for 115 economies by World Economic Forum .
Digital Access Index (DAI)DAI mengukur keupayaan keseluruhan individu dalam sesebuah negara dalam mengakses dan menggunakan ICT baru. Indeks ini telah disusun untuk 178 ekonomi, oleh International Telecommunication Union. Ia diterbitkan hanya bagi dua tahun iaitu 1998 dan 2002.Measures the overall ability of individuals in a country to access and use new ICTs. The index has been compiled for 178 economies by International Telecommunication Union. It was published only for 1998 and 2002.
Digital Opportunity Index (DOI)DOI adalah satu kaedah yang boleh digunakan oleh kerajaan, pengusaha, agensi pembangunan, penyelidik dan sebagainya untuk mengukur jurang digital dan membuat perbandingan prestasi ICT dalam sesebuah neg-ara dan berbanding negara-negara lain. DOI telah disusun untuk 181 ekonomi oleh International Telecomunica-tion Union untuk 2005 dan 2006.The DOI is a standard tool that governments, operators, development agencies, researchers and others can use to measure the digital divide and compare ICT performance within and across countries. The DOI has been compiled for 181 economies by International Telecommunication Union for 2005 and 2006.
e-Business Readinesse-Business Readiness adalah satu ukuran bagi persekitaran e-perniagaan, satu koleksi faktor yang menunjukkan betapa responsif sesuatu pasaran terhadap peluang-peluang berasaskan Internete-Business Readiness is a measure of e-business environment, a collection of factors that indicate how amenable a market is to Internet-based opportunities.
e-Government Readiness Indexe-kerajaan kini digunakan bukan sahaja untuk menyediakan perkhidmatan kepada penduduk tetapi juga untuk tujuan meningkatkan kecekapan sektor awam, memperbaiki ketelusan dan kebertanggungjawaban kerajaan dalam melaksanakan fungsi-fungsinya selain menjimatkan kos dalam pentadbiran kerajaan.e-government is being deployed not only to provide citizen services but for public sector efficiency purposes, improving transparency and accountability in government functions and allowing for cost savings in government administration.
World CompetitivenessLaporan Daya Saing Dunia diterbitkan untuk menunjukkan daya saing negara, kedudukan dan menganalisa bagaimana negara menguruskan sumber dan kecekapan mereka. Diterbitkan semenjak 1989, ianya membandingkan daya saing untuk 58 ekonomi berdasarkan 300 kriteria.World Competitiveness Yearbook publishes competitiveness of nations, ranking and analysing how a nation manages its resources and competencies. Published since 1989 it compares the competitiveness of 58 economics on the basis of over 300 criteria.
ICT Development Index (IDI) Indeks ini mengukur tahap kemajuan ICT. Ia juga mengukur jurang digital global dan mengkaji bagaimana jurang ini berkembang pada tahun-tahun kebelakangan ini.The Index captures the level of advancement of ICTs. It also measures the global digital divide and examines how it has developed in recent years
Nota penjelasan:Explanatory notes:
Communications & Multimedia • Selected Facts & Figures Q4 2010 65Communications & Multimedia • Selected Facts & Figures Q4 2010
Connectivity Scorecard Connectivity Scorecard menekan kepada kualiti dan kuantiti penggunaan dan infrastruktur ICT danmengaitkannya kepada kemakmuran ekonomi dan sosial negara. Ekonomi yang dikaji dibahagi kepada 2 kumpulan, iaitu 25 buah ekonomi di mana penjana utama ialah sumber dan kecekapan dan 25 buah ekonomi lain di mana penjana utama ialah inovasi (seperti yang didefinisikan oleh World Economic Forum). Kajian ini ditaja oleh Nokia Siemens Networks. Malaysia berada di dalam kumpulan ekonomi di mana penjana utama ialah sumber dan kecekapan.The Connectivity Scorecard looks at quality and quantity of ICT usage and infrastructure and relates it to a country’s social and economic prosperity. 25 ‘Resource and Efficiency Driven’ and 25 ‘Innovation Driven’economies are studied (as defined by the World Economic Forum (WEF)). Study commissioned by NokiaSiemens Networks. Malaysia is in the “Resource and Efficiency Driven” group of economies.
Nota penjelasan (samb):Explanatory notes (cont’d):


KOMUNIKASI & MULTIMEDIAFAKTA & ANGKA TERPILIH
COMMUNICATIONS & MULTIMEDIASELECTED FACTS & FIGURES
Q42 0 1 0

69Communications & Multimedia • Selected Facts & Figures Q4 2010
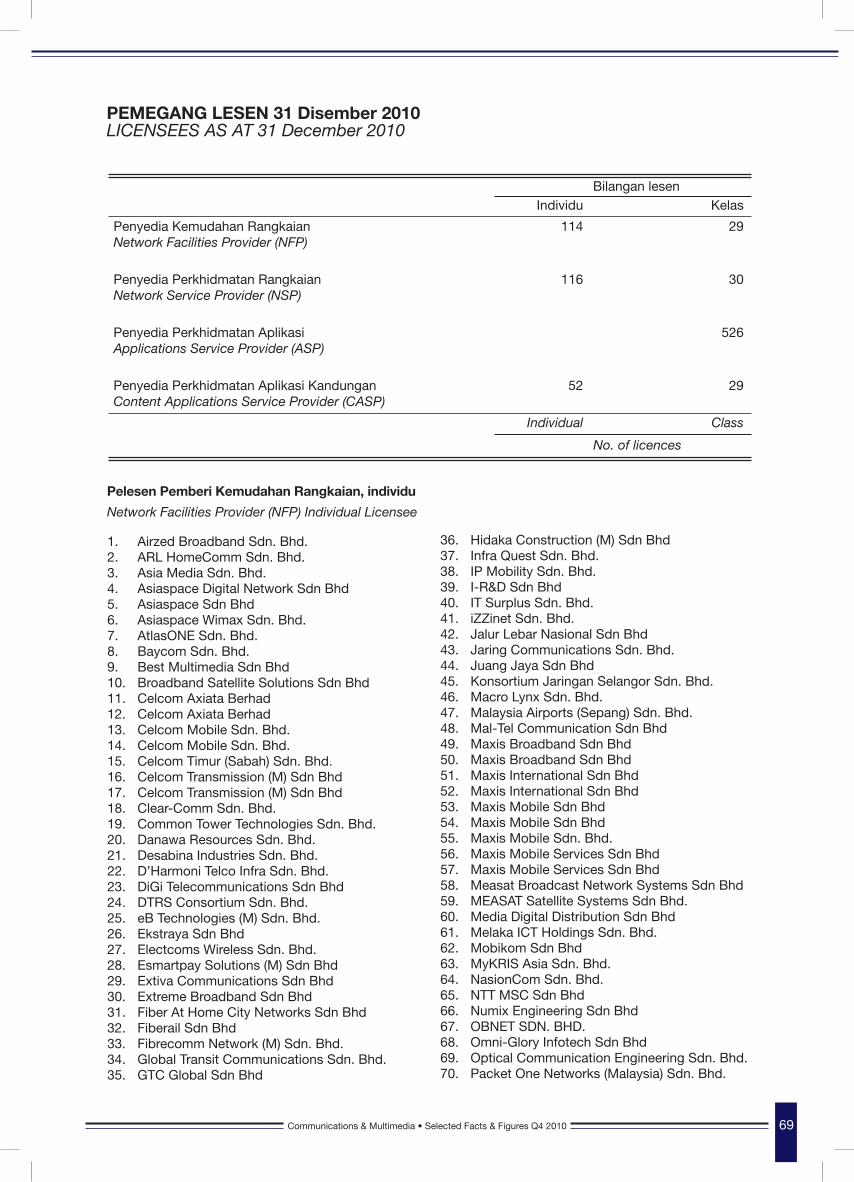
1. Airzed Broadband Sdn. Bhd.2. ARL HomeComm Sdn. Bhd. 3. Asia Media Sdn. Bhd.4. Asiaspace Digital Network Sdn Bhd5. Asiaspace Sdn Bhd 6. Asiaspace Wimax Sdn. Bhd.7. AtlasONE Sdn. Bhd. 8. Baycom Sdn. Bhd.9. Best Multimedia Sdn Bhd10. Broadband Satellite Solutions Sdn Bhd11. Celcom Axiata Berhad 12. Celcom Axiata Berhad 13. Celcom Mobile Sdn. Bhd. 14. Celcom Mobile Sdn. Bhd. 15. Celcom Timur (Sabah) Sdn. Bhd.16. Celcom Transmission (M) Sdn Bhd17. Celcom Transmission (M) Sdn Bhd18. Clear-Comm Sdn. Bhd.19. Common Tower Technologies Sdn. Bhd.20. Danawa Resources Sdn. Bhd.21. Desabina Industries Sdn. Bhd.22. D’Harmoni Telco Infra Sdn. Bhd.23. DiGi Telecommunications Sdn Bhd24. DTRS Consortium Sdn. Bhd.25. eB Technologies (M) Sdn. Bhd.26. Ekstraya Sdn Bhd27. Electcoms Wireless Sdn. Bhd.28. Esmartpay Solutions (M) Sdn Bhd29. Extiva Communications Sdn Bhd30. Extreme Broadband Sdn Bhd31. Fiber At Home City Networks Sdn Bhd 32. Fiberail Sdn Bhd33. Fibrecomm Network (M) Sdn. Bhd.34. Global Transit Communications Sdn. Bhd.35. GTC Global Sdn Bhd
Pelesen Pemberi Kemudahan Rangkaian, individu
Network Facilities Provider (NFP) Individual Licensee
PEMEGANG LESEN 31 Disember 2010LICENSEES AS AT 31 December 2010
Individu Kelas
Penyedia Kemudahan RangkaianNetwork Facilities Provider (NFP)
114 29
Penyedia Perkhidmatan Rangkaian Network Service Provider (NSP)
116 30
Penyedia Perkhidmatan Aplikasi Applications Service Provider (ASP)
526
Penyedia Perkhidmatan Aplikasi KandunganContent Applications Service Provider (CASP)
52 29
Individual Class
Bilangan lesen
No. of licences
36. Hidaka Construction (M) Sdn Bhd37. Infra Quest Sdn. Bhd.38. IP Mobility Sdn. Bhd.39. I-R&D Sdn Bhd40. IT Surplus Sdn. Bhd.41. iZZinet Sdn. Bhd. 42. Jalur Lebar Nasional Sdn Bhd 43. Jaring Communications Sdn. Bhd. 44. Juang Jaya Sdn Bhd45. Konsortium Jaringan Selangor Sdn. Bhd.46. Macro Lynx Sdn. Bhd.47. Malaysia Airports (Sepang) Sdn. Bhd.48. Mal-Tel Communication Sdn Bhd49. Maxis Broadband Sdn Bhd50. Maxis Broadband Sdn Bhd51. Maxis International Sdn Bhd52. Maxis International Sdn Bhd53. Maxis Mobile Sdn Bhd54. Maxis Mobile Sdn Bhd55. Maxis Mobile Sdn. Bhd. 56. Maxis Mobile Services Sdn Bhd 57. Maxis Mobile Services Sdn Bhd58. Measat Broadcast Network Systems Sdn Bhd59. MEASAT Satellite Systems Sdn Bhd. 60. Media Digital Distribution Sdn Bhd61. Melaka ICT Holdings Sdn. Bhd.62. Mobikom Sdn Bhd63. MyKRIS Asia Sdn. Bhd.64. NasionCom Sdn. Bhd. 65. NTT MSC Sdn Bhd66. Numix Engineering Sdn Bhd67. OBNET SDN. BHD. 68. Omni-Glory Infotech Sdn Bhd69. Optical Communication Engineering Sdn. Bhd.70. Packet One Networks (Malaysia) Sdn. Bhd.
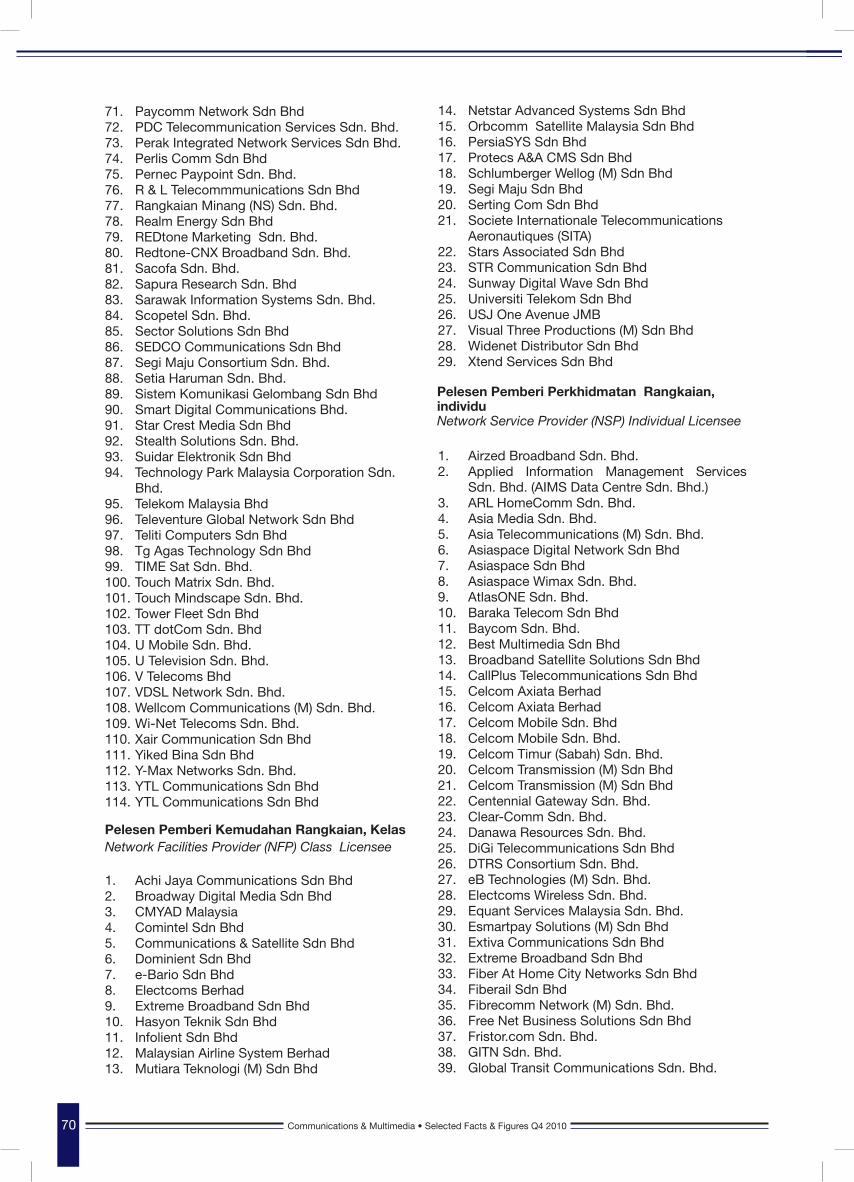
70 Communications & Multimedia • Selected Facts & Figures Q4 2010 Communications & Multimedia • Selected Facts & Figures Q4 2010
14. Netstar Advanced Systems Sdn Bhd15. Orbcomm Satellite Malaysia Sdn Bhd16. PersiaSYS Sdn Bhd17. Protecs A&A CMS Sdn Bhd18. Schlumberger Wellog (M) Sdn Bhd19. Segi Maju Sdn Bhd20. Serting Com Sdn Bhd21. Societe Internationale Telecommunications Aeronautiques (SITA)22. Stars Associated Sdn Bhd23. STR Communication Sdn Bhd24. Sunway Digital Wave Sdn Bhd25. Universiti Telekom Sdn Bhd26. USJ One Avenue JMB27. Visual Three Productions (M) Sdn Bhd28. Widenet Distributor Sdn Bhd29. Xtend Services Sdn Bhd
1. Airzed Broadband Sdn. Bhd.2. Applied Information Management Services
Sdn. Bhd. (AIMS Data Centre Sdn. Bhd.)3. ARL HomeComm Sdn. Bhd. 4. Asia Media Sdn. Bhd.5. Asia Telecommunications (M) Sdn. Bhd.6. Asiaspace Digital Network Sdn Bhd7. Asiaspace Sdn Bhd 8. Asiaspace Wimax Sdn. Bhd.9. AtlasONE Sdn. Bhd. 10. Baraka Telecom Sdn Bhd11. Baycom Sdn. Bhd.12. Best Multimedia Sdn Bhd13. Broadband Satellite Solutions Sdn Bhd14. CallPlus Telecommunications Sdn Bhd15. Celcom Axiata Berhad 16. Celcom Axiata Berhad 17. Celcom Mobile Sdn. Bhd18. Celcom Mobile Sdn. Bhd. 19. Celcom Timur (Sabah) Sdn. Bhd.20. Celcom Transmission (M) Sdn Bhd21. Celcom Transmission (M) Sdn Bhd22. Centennial Gateway Sdn. Bhd.23. Clear-Comm Sdn. Bhd.24. Danawa Resources Sdn. Bhd.25. DiGi Telecommunications Sdn Bhd26. DTRS Consortium Sdn. Bhd.27. eB Technologies (M) Sdn. Bhd.28. Electcoms Wireless Sdn. Bhd.29. Equant Services Malaysia Sdn. Bhd.30. Esmartpay Solutions (M) Sdn Bhd31. Extiva Communications Sdn Bhd32. Extreme Broadband Sdn Bhd33. Fiber At Home City Networks Sdn Bhd 34. Fiberail Sdn Bhd35. Fibrecomm Network (M) Sdn. Bhd.36. Free Net Business Solutions Sdn Bhd37. Fristor.com Sdn. Bhd.38. GITN Sdn. Bhd.39. Global Transit Communications Sdn. Bhd.
71. Paycomm Network Sdn Bhd 72. PDC Telecommunication Services Sdn. Bhd.73. Perak Integrated Network Services Sdn Bhd.74. Perlis Comm Sdn Bhd75. Pernec Paypoint Sdn. Bhd. 76. R & L Telecommmunications Sdn Bhd77. Rangkaian Minang (NS) Sdn. Bhd.78. Realm Energy Sdn Bhd79. REDtone Marketing Sdn. Bhd.80. Redtone-CNX Broadband Sdn. Bhd. 81. Sacofa Sdn. Bhd.82. Sapura Research Sdn. Bhd83. Sarawak Information Systems Sdn. Bhd.84. Scopetel Sdn. Bhd.85. Sector Solutions Sdn Bhd86. SEDCO Communications Sdn Bhd87. Segi Maju Consortium Sdn. Bhd.88. Setia Haruman Sdn. Bhd.89. Sistem Komunikasi Gelombang Sdn Bhd90. Smart Digital Communications Bhd. 91. Star Crest Media Sdn Bhd92. Stealth Solutions Sdn. Bhd.93. Suidar Elektronik Sdn Bhd94. Technology Park Malaysia Corporation Sdn.
Bhd.95. Telekom Malaysia Bhd96. Televenture Global Network Sdn Bhd97. Teliti Computers Sdn Bhd98. Tg Agas Technology Sdn Bhd99. TIME Sat Sdn. Bhd.100. Touch Matrix Sdn. Bhd.101. Touch Mindscape Sdn. Bhd.102. Tower Fleet Sdn Bhd103. TT dotCom Sdn. Bhd104. U Mobile Sdn. Bhd. 105. U Television Sdn. Bhd. 106. V Telecoms Bhd 107. VDSL Network Sdn. Bhd.108. Wellcom Communications (M) Sdn. Bhd.109. Wi-Net Telecoms Sdn. Bhd.110. Xair Communication Sdn Bhd111. Yiked Bina Sdn Bhd112. Y-Max Networks Sdn. Bhd. 113. YTL Communications Sdn Bhd 114. YTL Communications Sdn Bhd
1. Achi Jaya Communications Sdn Bhd2. Broadway Digital Media Sdn Bhd3. CMYAD Malaysia4. Comintel Sdn Bhd5. Communications & Satellite Sdn Bhd6. Dominient Sdn Bhd7. e-Bario Sdn Bhd8. Electcoms Berhad9. Extreme Broadband Sdn Bhd10. Hasyon Teknik Sdn Bhd11. Infolient Sdn Bhd12. Malaysian Airline System Berhad13. Mutiara Teknologi (M) Sdn Bhd
Pelesen Pemberi Kemudahan Rangkaian, KelasNetwork Facilities Provider (NFP) Class Licensee
Pelesen Pemberi Perkhidmatan Rangkaian, individuNetwork Service Provider (NSP) Individual Licensee
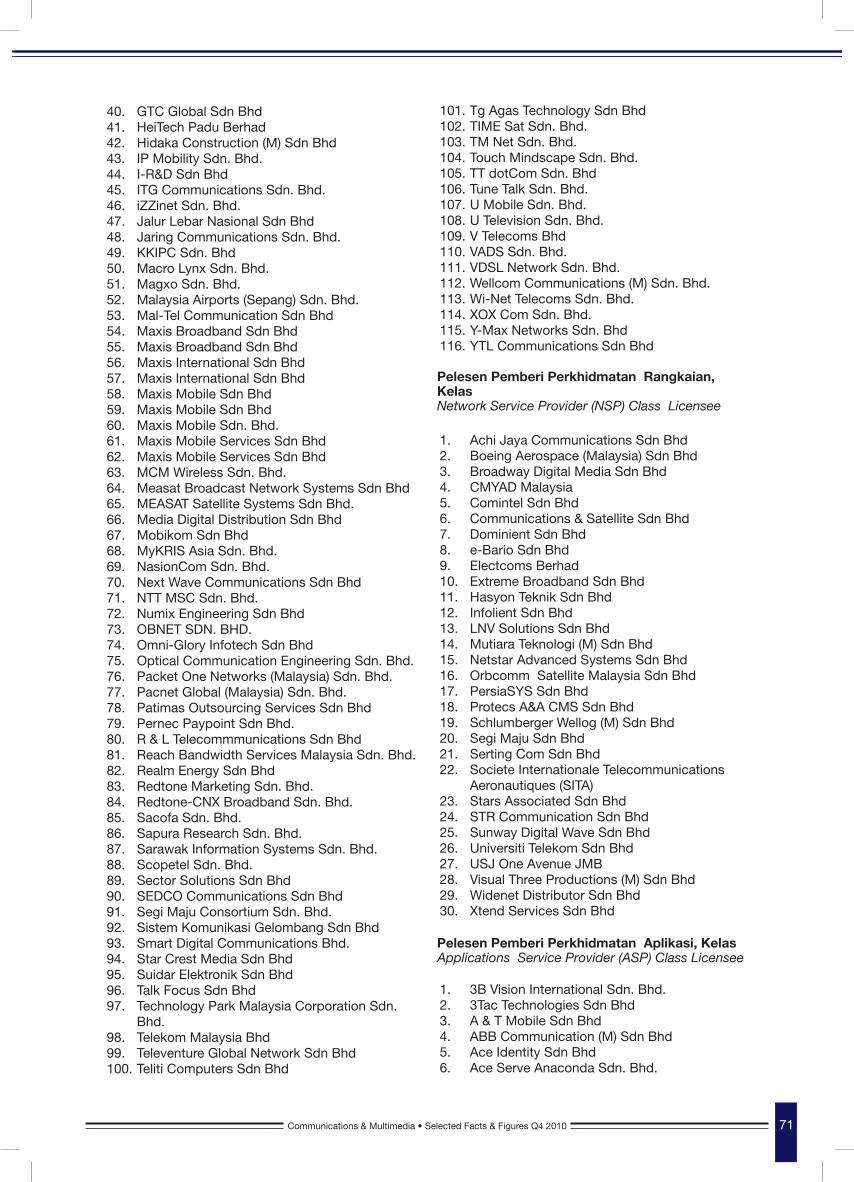
Communications & Multimedia • Selected Facts & Figures Q4 2010 71Communications & Multimedia • Selected Facts & Figures Q4 2010
101. Tg Agas Technology Sdn Bhd102. TIME Sat Sdn. Bhd.103. TM Net Sdn. Bhd.104. Touch Mindscape Sdn. Bhd.105. TT dotCom Sdn. Bhd106. Tune Talk Sdn. Bhd.107. U Mobile Sdn. Bhd. 108. U Television Sdn. Bhd. 109. V Telecoms Bhd 110. VADS Sdn. Bhd.111. VDSL Network Sdn. Bhd.112. Wellcom Communications (M) Sdn. Bhd.113. Wi-Net Telecoms Sdn. Bhd.114. XOX Com Sdn. Bhd.115. Y-Max Networks Sdn. Bhd116. YTL Communications Sdn Bhd
1. Achi Jaya Communications Sdn Bhd2. Boeing Aerospace (Malaysia) Sdn Bhd3. Broadway Digital Media Sdn Bhd4. CMYAD Malaysia5. Comintel Sdn Bhd6. Communications & Satellite Sdn Bhd7. Dominient Sdn Bhd8. e-Bario Sdn Bhd9. Electcoms Berhad10. Extreme Broadband Sdn Bhd11. Hasyon Teknik Sdn Bhd12. Infolient Sdn Bhd13. LNV Solutions Sdn Bhd14. Mutiara Teknologi (M) Sdn Bhd15. Netstar Advanced Systems Sdn Bhd16. Orbcomm Satellite Malaysia Sdn Bhd17. PersiaSYS Sdn Bhd18. Protecs A&A CMS Sdn Bhd19. Schlumberger Wellog (M) Sdn Bhd20. Segi Maju Sdn Bhd21. Serting Com Sdn Bhd22. Societe Internationale Telecommunications Aeronautiques (SITA)23. Stars Associated Sdn Bhd24. STR Communication Sdn Bhd25. Sunway Digital Wave Sdn Bhd26. Universiti Telekom Sdn Bhd27. USJ One Avenue JMB28. Visual Three Productions (M) Sdn Bhd29. Widenet Distributor Sdn Bhd30. Xtend Services Sdn Bhd
1. 3B Vision International Sdn. Bhd.2. 3Tac Technologies Sdn Bhd3. A & T Mobile Sdn Bhd4. ABB Communication (M) Sdn Bhd5. Ace Identity Sdn Bhd6. Ace Serve Anaconda Sdn. Bhd.
Pelesen Pemberi Perkhidmatan Rangkaian, KelasNetwork Service Provider (NSP) Class Licensee
40. GTC Global Sdn Bhd 41. HeiTech Padu Berhad42. Hidaka Construction (M) Sdn Bhd43. IP Mobility Sdn. Bhd.44. I-R&D Sdn Bhd45. ITG Communications Sdn. Bhd.46. iZZinet Sdn. Bhd. 47. Jalur Lebar Nasional Sdn Bhd 48. Jaring Communications Sdn. Bhd. 49. KKIPC Sdn. Bhd50. Macro Lynx Sdn. Bhd.51. Magxo Sdn. Bhd.52. Malaysia Airports (Sepang) Sdn. Bhd.53. Mal-Tel Communication Sdn Bhd54. Maxis Broadband Sdn Bhd55. Maxis Broadband Sdn Bhd56. Maxis International Sdn Bhd57. Maxis International Sdn Bhd58. Maxis Mobile Sdn Bhd59. Maxis Mobile Sdn Bhd60. Maxis Mobile Sdn. Bhd. 61. Maxis Mobile Services Sdn Bhd 62. Maxis Mobile Services Sdn Bhd63. MCM Wireless Sdn. Bhd.64. Measat Broadcast Network Systems Sdn Bhd65. MEASAT Satellite Systems Sdn Bhd. 66. Media Digital Distribution Sdn Bhd67. Mobikom Sdn Bhd68. MyKRIS Asia Sdn. Bhd.69. NasionCom Sdn. Bhd. 70. Next Wave Communications Sdn Bhd71. NTT MSC Sdn. Bhd.72. Numix Engineering Sdn Bhd73. OBNET SDN. BHD. 74. Omni-Glory Infotech Sdn Bhd75. Optical Communication Engineering Sdn. Bhd.76. Packet One Networks (Malaysia) Sdn. Bhd. 77. Pacnet Global (Malaysia) Sdn. Bhd.78. Patimas Outsourcing Services Sdn Bhd 79. Pernec Paypoint Sdn Bhd.80. R & L Telecommmunications Sdn Bhd81. Reach Bandwidth Services Malaysia Sdn. Bhd.82. Realm Energy Sdn Bhd83. Redtone Marketing Sdn. Bhd.84. Redtone-CNX Broadband Sdn. Bhd. 85. Sacofa Sdn. Bhd.86. Sapura Research Sdn. Bhd. 87. Sarawak Information Systems Sdn. Bhd.88. Scopetel Sdn. Bhd.89. Sector Solutions Sdn Bhd90. SEDCO Communications Sdn Bhd91. Segi Maju Consortium Sdn. Bhd.92. Sistem Komunikasi Gelombang Sdn Bhd93. Smart Digital Communications Bhd. 94. Star Crest Media Sdn Bhd95. Suidar Elektronik Sdn Bhd96. Talk Focus Sdn Bhd97. Technology Park Malaysia Corporation Sdn.
Bhd.98. Telekom Malaysia Bhd99. Televenture Global Network Sdn Bhd100. Teliti Computers Sdn Bhd
Pelesen Pemberi Perkhidmatan Aplikasi, KelasApplications Service Provider (ASP) Class Licensee
72 Communications & Multimedia • Selected Facts & Figures Q4 2010 Communications & Multimedia • Selected Facts & Figures Q4 2010
68. Centurise Tech Sdn. Bhd.69. Century Convergence Sdn Bhd70. Chatgate Communications Sdn. Bhd.71. Chuntake Technology Sdn Bhd72. Citiway Logistics Sdn Bhd73. Clear-Comm Sdn. Bhd.74. Click N Ring Sdn. Bhd.75. Clicque Technology Sdn. Bhd.76. CMYAD Malaysia Sdn Bhd77. CN Telecom (Malaysia) Sdn Bhd78. COM2U Sdn. Bhd.79. Comintel Sdn. Bhd.80. Commerce Access Sdn Bhd81. Commzgate Sdn. Bhd.82. Compute Galaxy Sdn Bhd83. Confident Communications Sdn. Bhd.84. Cool Mobile Sdn. Bhd.85. CQ Communications86. Creative Century Management Sdn Bhd87. Creative Radius Sdn Bhd88. Crystalfone Networks Sdn Bhd89. CSC Malaysia Sdn Bhd90. CSL Manufacturing (M) Sdn Bhd91. CTAPPS MSC Sdn Bhd92. CTOS Data Systems Sdn Bhd93. Cworks Mobile Sdn Bhd94. D’Synergy Sdn Bhd95. DACS Network Solutions Sdn Bhd96. Dalrus Technology Sdn Bhd97. Danawa Resources Sdn. Bhd.98. Dan-One Concept Sdn Bhd99. Dany Holdings Sdn Bhd100. Dany Press Sdn Bhd101. Dapat Vista (M) Sdn Bhd102. Datacraft Advanced Network Servcies Sdn
Bhd103. Deshi Digital Sdn. Bhd.104. Didadee Sdn. Bhd.105. DiGi Telecommunications Sdn. Bhd.106. Digital Five Sdn Bhd107. Directhere Sdn. Bhd.108. DJR Tech Sdn Bhd109. Dominient Sdn. Bhd.110. Dream Chorus Sdn. Bhd.111. Dubaitech Marketing Sdn. Bhd.112. Duniapro Entertaunment Sdn Bhd113. D-Xpert Solutions Sdn Bhd114. Dyna Inspirasi Sdn Bhd115. Dynamic Numeric Dreams Sdn Bhd116. Dynasty IT Services Sdn Bhd117. ECS Astar Sdn Bhd118. Edgecomms Sdn. Bhd.119. EDP Network Sdn Bhd120. Eghtesad Novin Sdn Bhd121. E-Jaaring .com (M) Sdn Bhd122. Ekstraya Sdn Bhd123. Ektech Consulting Sdn Bhd124. EL Computer125. Elanet Sdn. Bhd.126. Electcoms Sdn. Bhd.127. Emas Talian Komunikasi Sdn Bhd128. Eminent Display Sdn Bhd
7. Ace Touchtone Sdn. Bhd.8. Acer Sales & Services Sdn Bhd9. Achi Jaya Communications Sdn. Bhd.10. ACV Mobile Sdn Bhd11. Agih Tinta Sdn Bhd12. Ahead Mobile Sdn. Bhd.13. AIMS Data Centre 2 Sdn. Bhd.14. AIMS Data Centre Sdn. Bhd.15. Airocom Technology Sdn. Bhd.16. Airtime Management & Programming Sdn. Bhd.17. Airzed Services Sdn Bhd.18. Aktif Setegap Sdn Bhd19. Alam Teknokrat Sdn Bhd20. Alpha Orange Sdn Bhd21. Alt Media Sdn. Bhd.22. AMZ Telecommunication Sdn Bhd23. Antechnic Systems Sdn. Bhd.24. ARL Homecomm Sdn Bhd25. Array Technology Sdn. Bhd.26. Arrow Multimode Sdn Bhd27. Arthatek Resources Corporation Sdn. Bhd.28. Asia Media Sdn. Bhd.29. Asian Contact Centres Sdn Bhd30. Asiaspace WiMax Sdn. Bhd.31. Aspati Sdn. Bhd.32. Aspect Engineering (M) Sdn Bhd33. AT & T Worldwide Network Services (Malaysia)
Sdn Bhd.34. Atlantic Air-Conditioners & Electrical35. AU Networks Sdn. Bhd.36. Avanser Malaysia Sdn Bhd37. Avenue Telecommunications Sdn. Bhd.38. Avo Technology Sdn. Bhd.39. Axis Technologies Solutions (M) Sdn. Bhd.40. Azea Communications Sdn. Bhd.41. B&B Urban Ventures Sdn Bhd42. B.D. Call Sdn. Bhd.43. Baraka Telecom Sdn Bhd44. Basenet Technology Sdn Bhd45. Basic Depth Sdn. Bhd.46. Baycom Sdn. Bhd.47. Be Ace Corporation (M) Sdn Bhd48. Bell Network Sdn Bhd49. Best Debut Sdn. Bhd.50. Bestec (South East Asia) Sdn Bhd51. Beta Technology Sdn. Bhd.52. Bimbit.com Sdn. Bhd.53. Blue Ice Technology Sdn Bhd54. BlueHorus Solutions Sdn. Bhd.55. Boeing Aerospace (Malaysia) Sdn. Bhd.56. Brilliant Communications Sdn. Bhd.57. Broadband Service Integrators Sdn Bhd58. BT Systems (Malaysia) Sdn. Bhd.59. Business Continuity Solution Sdn Bhd60. Callplus Telecommunications Sdn. Bhd.61. Camar Impresif Sdn Bhd62. Celcom Axiata Berhad63. Celcom Mobile Sdn. Bhd.64. Celcom Technology (M) Sdn. Bhd.65. Celcom Timur (Sabah) Sdn Bhd66. Cellab (M) Sdn Bhd67. Centennial Gateway Sdn. Bhd.
Communications & Multimedia • Selected Facts & Figures Q4 2010 73Communications & Multimedia • Selected Facts & Figures Q4 2010
191. Hitz Mobile Sdn. Bhd.192. HLA Integrated Sdn Bhd193. Hybrinix Technology Sdn Bhd194. I Cosmos Sdn Bhd195. IBM Malaysia Sdn. Bhd.196. IdotTV Sdn. Bhd.197. iGlow.com.my Sdn. Bhd.198. IGMobile Holdings Sdn. Bhd.199. Ikogo Sdn. Bhd.200. Ikonasoftware (M) Sdn Bhd201. IMA Network (M) Sdn. Bhd.202. iNavigate Sdn. Bhd.203. Index Storage Corporation Sdn Bhd204. Infindo Technology Sdn Bhd205. Info-Age Technology Sdn. Bhd.206. Infofame Sdn. Bhd207. Infolient Sdn. Bhd.208. Information Network Services Sdn Bhd209. Inobel Sdn. Bhd. 210. Intelligence PC Centre211. Inter Community Telecom212. Inter Continental Enterprise213. Inventive Computing Sdn. Bhd.214. I-Office2 Sdn. Bhd.215. Ionnex Sdn. Bhd.216. IP Innovation Sdn. Bhd.217. IP Mobility Sdn Bhd218. IPSAT Sdn. Bhd.219. IPTEL Sdn. Bhd.220. Iridea (M) Sdn. Bhd.221. Irmatel Communications Sdn Bhd222. Isentric Media Sdn. Bhd.223. iSentric Sdn. Bhd.224. i-Skill Dynamics Sdn Bhd225. i-Tech Network Solutions Sdn Bhd226. ITG Technologies Sdn Bhd227. ITG Telecommunications Sdn. Bhd.228. ITX Marketing Sdn. Bhd.229. I-Way Network Sdn. Bhd.230. Iwire Technology Sdn Bhd231. IX Telecom Sdn Bhd232. J & C Pacific Sdn. Bhd.233. Jaguh Canggih Technology Sdn Bhd234. Jalur Lebar Nasional Sdn Bhd235. Jaring Communications Sdn. Bhd.236. Jaringan Data Sdn Bhd237. Jasa Astana Sdn Bhd238. JJ Industries Sdn Bhd239. JNI System Sdn. Bhd.240. Jobmobile Service Centre (M) Sdn. Bhd241. Juang Jaya Sdn Bhd242. KDDI MalaysiaSdn. Bhd.243. KIGB Dot Com244. Kist Prepaid Retail Sdn. Bhd.245. KKIPC Sdn. Bhd.246. Komiso Computer & Printer Clinic247. Kompakar INC Sdn Bhd248. Konsortium Jaya Sdn Bhd249. Kosmosvox Communications Sdn Bhd250. Kurnia Insurans (Malaysia) Berhad251. Laser Profile Sdn Bhd252. Lavish Team Sdn. Bhd.
129. Emprical Systems (M) Sdn Bhd130. Enershia Sdn Bhd131. Equant Services Malaysia Sdn. Bhd.132. Ericsson (Malaysia) Sdn. Bhd.133. E-Room Sdn. Bhd.134. ERP Twenty One Sdn. Bhd.135. Esky Multimedia Sdn Bhd136. eSmartpay Solutions (M) Sdn Bhd137. EsseCall Sdn. Bhd.138. ETA Network Systems Sdn. Bhd.139. ETD Makmur (M) Sdn Bhd140. Etnet.com Sdn. Bhd.141. Everest Mobile Sdn. Bhd.142. Everest Web Sdn. Bhd.143. Everworks Mobile (MSC) Sdn Bhd144. Everworks Solutions (M) Sdn. Bhd.145. Evino Mobile Sdn Bhd146. Evolving Solutions (M) Sdn Bhd147. Excel Commerce Solutions Sdn. Bhd.148. Exticom Sdn. Bhd.149. Extiva Communications Sdn. Bhd.150. Extreme Broadband Sdn. Bhd.151. Ezymobile International Sdn. Bhd.152. Fibrecomm Network (M) Sdn. Bhd.153. First Click Sdn. Bhd.154. Fixed Mobile Sdn Bhd155. FM Mobility Sdn Bhd156. Fonpackets Sdn. Bhd.157. Forest Interactive Sdn. Bhd.158. Formis Computer Services Sdn Bhd159. Foundermall Dot Com Sdn. Bhd.160. Free Net Business Solutions Sdn Bhd161. Frezhtalkz Mobile Sdn Bhd162. Frizzhub VOB Sdn. Bhd.163. FSBM Net Media Sdn Bhd164. Ftone Sdn. Bhd.165. Function Ramslink Sdn. Bhd.166. Future Telecommunications Sdn Bhd167. Gading Kencana Sdn Bhd168. Gang Mobile Sdn. Bhd.169. Gateway Option Sdn. Bhd.170. Gema Inovatif Sdn Bhd171. Genting Malaysia Berhad172. Genusis Consultancy Sdn. Bhd.173. Gen-X Technology Sdn. Bhd.174. Gerakan Padu Sdn. Bhd.175. GITN Sdn. Bhd.176. Global Forway Sdn. Bhd.177. Global Maxlink Sdn Bhd178. Global Surf Sdn. Bhd.179. Global Transit Communications Sdn. Bhd.180. Golden Digit Resources Sdn. Bhd.181. Golden Saga Communications Sdn Bhd 182. Green Web Sdn. Bhd.183. GTC Global Sdn. Bhd.184. HAHD Communications Sdn Bhd185. Happy Team Global (M) Sdn Bhd186. Hasyon Teknik Sdn. Bhd.187. HeiTech Padu Berhad188. Hewlett Packard (M) Sdn Bhd189. Hidaka Construction (M) Sdn Bhd190. Hing Lee Technology
74 Communications & Multimedia • Selected Facts & Figures Q4 2010 Communications & Multimedia • Selected Facts & Figures Q4 2010
315. MSD Digital Intelligence Sdn Bhd316. MSE dotNet Sdn Bhd317. MTL E-solutions Sdn. Bhd.318. MTN Solution Sdn Bhd319. Mudah.my Sdn Bhd 320. Multi Scope Resources (M) Sdn Bhd321. Mura Communications Sdn Bhd322. Mutiara Smart Computing Sdn Bhd323. Mutiara Teknologi (M) Sdn Bhd324. Mutual Digital Sdn. Bhd.325. M-Village Sdn. Bhd.326. M-Village Solutions Sdn. Bhd.327. My IT Depot Enterprise328. My Penang Fon Sdn Bhd329. Myit Technology Sdn. Bhd.330. Mykris Asia Sdn Bhd331. Mypressto.Com Sdn. Bhd.332. N2N Connect Berhad333. Nadi-Ayu Technologies Sdn Bhd334. Nassion Systems (M) Sdn. Bhd.335. Navitel Sdn. Bhd.336. Netstar Advanced Systems Sdn. Bhd.337. New Core Sdn Bhd338. Newtech ICT Services Sdn Bhd339. Next Pearl International Sdn Bhd340. Next Telecommunications Sdn. Bhd.341. Nextnation Network Sdn. Bhd.342. Nglobe Sdn. Bhd.343. Niche Access Sdn Bhd344. Nik Senara Sdn Bhd345. Nisajaya Communication Sdn Bhd346. Nplay Sdn. Bhd.347. NTT MSC Sdn. Bhd.348. Numsatu Sdn Bhd349. Obnet Sdn. Bhd.350. Octazen Sdn Bhd351. Omni-Glory Infotech Sdn Bhd352. Optical Communication Engineering Sdn. Bhd.353. ORBCOMM Satellite Malaysia Sdn. Bhd.354. Otelo Telecommunications Sdn. Bhd.355. P1.Com Sdn. Bhd.356. Pacific Tone Communications Sdn. Bhd.357. Packet One Networks (Malaysia) Sdn. Bhd.358. Pacnet Global (M) Sdn. Bhd.359. Pacnet Internet (Malaysia) Sdn. Bhd.360. Pan Malaysian Pools Sdn. Bhd.361. Pavo Communications Sdn Bhd362. Paycomm Network Sdn Bhd 363. PC-Soft (M) Sdn Bhd.364. Pegasus Premark Sdn Bhd365. Pennytel Communications Sdn. Bhd.366. PERNEC Corporation Berhad367. Pernec Integrated Network Systems Sdn Bhd368. Pernec Paypoint Sdn. Bhd.369. Persiasys Sdn. Bhd.370. PG Communications Sdn. Bhd.371. Planetunes Mobiles Sdn. Bhd.372. Planworth Communications (M) Sdn. Bhd.373. Planworth Telecommunications (M) Sdn Bhd374. Platinum-Z Sdn Bhd375. PP Telecommunication Sdn Bhd376. Prestige Strategies Concept Sdn Bhd
253. Lenovo Technology Sdn Bhd254. Lestari Unggul Sdn Bhd255. Level 1 Communications (M) Sdn. Bhd.256. Lightsup Network Solution Sdn Bhd257. LNV Solutions (M) Sdn. Bhd.258. Logitel Sdn Bhd259. Long Tail Sdn. Bhd.260. M3 Technologies (Asia) Berhad261. Macro Kiosk Berhad262. Macrobuzz Interactive Sdn. Bhd.263. Maju Nusa Sdn Bhd264. Malaysia Airports Technologies Sdn Bhd265. Malitnet Computer Services Sdn Bhd266. MAL-TEL Communications Sdn. Bhd.267. Matrix Internet & Wireless Sdn. Bhd.268. Matrix Tech Management Sdn. Bhd.269. Maxcall Mobile Services Sdn Bhd270. Maxgross Sdn Bhd271. Maxis Broadband Sdn. Bhd.272. Maxis Mobile Sdn. Bhd.273. Maxis Mobile Services Sdn Bhd274. MBf Holdings Sdn. Bhd.275. Mblox Sdn Bhd276. Mboard Media Sdn. Bhd.277. MCAV Technology Sdn Bhd278. MCOM Media Technology Sdn. Bhd.279. MCOM Messaging Sdn. Bhd.280. MCOM Network Sdn Bhd281. Measat Broadcast Network Systems Sdn. Bhd.282. Mediacliq Sdn. Bhd.283. Mediaconcise Sdn. Bhd.284. Mediaring Sdn. Bhd.285. Mega Two Sdn Bhd286. Mega Two Trade Sdn Bhd287. Megahtron Unik Sdn Bhd288. Megamobile Solutions Sdn. Bhd.289. Melaka ICT Holdings Sdn Bhd290. Menang Anika Sdn Bhd291. Merchantrade Asia Sdn. Bhd.292. Meridian Surveys (M) Sdn. Bhd.293. Mesiniaga Berhad294. Metro Telecom Sdn Bhd295. Mexcomm Sdn. Bhd.296. Micro Ocean Technologies Sdn Bhd297. Mikimoto Communications Sdn. Bhd.298. Mikro Oasis Sdn. Bhd.299. MK Rich Marketing300. M-Mode Mobile Sdn. Bhd.301. MNC Wireless Berhad302. Mobif Global Sdn. Bhd.303. Mobile E-Transaction Sdn Bhd304. Mobile Money International Sdn. Bhd.305. Mobile Multimedia Sdn. Bhd.306. Mobile Touchetek Sdn. Bhd.307. Mobility Gateway Sdn. Bhd.308. Mobilityone Sdn Bhd309. Moblife.TV Sdn. Bhd.310. Modern Solution Sdn. Bhd.311. Moore Nasser Infra Sdn. Bhd.312. Motion Cards Malaysia Sdn Bhd313. Move Success Sdn. Bhd.314. MRCB Technologies Sdn. Bhd.
Communications & Multimedia • Selected Facts & Figures Q4 2010 75Communications & Multimedia • Selected Facts & Figures Q4 2010
438. Supreme Landmobile & Wireless Corporation Sdn Bhd
439. Suprima Holdings Sdn. Bhd.440. Switch Services441. Syamiz Corporation (M) Sdn Bhd442. Sybase Software (Malaysia) Sdn. Bhd.443. Symphonet Sdn. Bhd.444. Synergycentric Sdn Bhd445. Syntomos Technologies Sdn Bhd446. Talk Focus Sdn Bhd447. Tanjung Plus Engineering Sdn Bhd448. Techavenue Sdn. Bhd.449. Techninier Sdn. Bhd.450. Technowlogic Trading Sdn Bhd451. Tekad Communications (M) Sdn Bhd452. Teleinfo Technology & Services Sdn Bhd453. Telekom Applied Business Sdn. Bhd.454. Telekom Malaysia Berhad455. Teletouch Communications Sdn. Bhd.456. Teliti Computers Sdn. Bhd.457. Telshine Sdn. Bhd.458. Telshine Telecommunication Sdn. Bhd.459. Temasek Communication Sdn Bhd460. Teramicro Sdn Bhd461. T-Force Technology Sdn. Bhd.462. Tg Agas Technology Sdn Bhd463. Thames Technology Sdn Bhd464. Threesixty Technologies Sdn. Bhd.465. Tim Systems (M) Sdn Bhd466. Tirai Jitu (M) Sdn Bhd467. TM Info-Media Sdn. Bhd.468. T-Melmax Sdn Bhd.469. TMT Solutions Sdn Bhd470. Top IT Industries Sdn Bhd471. TPM IT Sdn. Bhd.472. Tranglo Sdn. Bhd.473. Tranz-I Technology Sdn Bhd474. Travel Mobile Sdn Bhd475. Tri-Castle Express Sdn Bhd476. Tridimas Sdn Bhd477. Trio Mobile Sdn. Bhd.478. Triprogram Solutions Sdn Bhd479. Trylah Sdn. Bhd.480. TT dotCom Sdn. Bhd.481. Tune Talk Sdn. Bhd.482. Turbo Venture Sdn Bhd483. Two Tale Marketing Sdn. Bhd.484. Two-P Technology (M) Sdn. Bhd. 485. U Mobile Sdn. Bhd.486. Uberfusion Sdn. Bhd.487. Uncover Technology Sdn. Bhd.488. Union Vector Alliance Sdn Bhd489. USJ One Avenue JMB490. VADS Bhd.491. Vasetti Datatech Berhad492. Vast Meridian Sdn. Bhd.493. Vastronic Sdn Bhd494. VDSL Network Sdn Bhd495. Vegasari Teknologi Sdn Bhd496. Venus Telecommnications Sdn Bhd497. Verizon Communications Malaysia Sdn Bhd498. Verve Consulting Sdn. Bhd.
377. Protecs A&A CMS Sdn. Bhd.378. Puncak Langit Sdn Bhd379. Pure Access Sdn Bhd380. Puretech Northern Sdn Bhd381. Purple Gum Sdn. Bhd.382. Qasima Technology Sdn. Bhd.383. Quick Access Technology Sdn. Bhd.384. Radius-ED Sdn. Bhd.385. Reach Bandwidth Services Malaysia Sdn. Bhd.386. Reach Ten Communication Sdn Bhd387. Reapfield Technology Sdn. Bhd.388. Redtone Marketing Sdn Bhd389. Redtone Mobile Sdn. Bhd.390. Redtone Mytel Sdn. Bhd.391. Redtone Telecommunications Sdn. Bhd.392. Redtone-CNX Broadband Sdn. Bhd.393. Reliva Technology Sdn Bhd394. Remula Corporation Sdn Bhd395. Rentak Pintar Sdn Bhd396. Rentak Setia Sdn. Bhd.397. Rexaplus Sdn Bhd398. Richmentech (M) Sdn Bhd399. SABA Legend (M) Sdn Bhd400. Sacofa Sdn. Bhd.401. Sadiatec Sdn. Bhd.402. Salamfone Sdn Bhd403. Samsung Malaysia Electronic (SME) Sdn Bhd404. Sarawak Information Systems Sdn Bhd405. Savvis Malaysia Sdn Bhd406. Scenic Connections Sdn Bhd407. Schlumberger Wellog (M) Sdn. Bhd.408. Sedania Corporation Sdn. Bhd.409. Segi Maju Sdn. Bhd.410. Seri Long Builders Sdn Bhd411. Serting Com Sdn. Bhd.412. Setia Haruman Technology Sdn. Bhd.413. Shrad Computing Sdn Bhd414. Signcharge Sdn Bhd415. Significant Technologies Sdn Bhd416. Silver Mountaine Sdn Bhd417. Sistem Komunikasi Gelombang Sdn Bhd418. Sky Award Sdn Bhd419. Skydoor420. Skyline Theme Sdn. Bhd.421. SM Telecommunication Sdn Bhd422. Smart Voip Telco Sdn Bhd423. Smartag Technologies Sdn. Bhd.424. SMS91.Com Sdn. Bhd.425. Societe Internationale Telecommunications
Aeronautiques (SITA)426. Speedy Marvel Sdn Bhd427. Sphinx Fusion Sdn. Bhd.428. Stars Associated Sdn. Bhd.429. Starwing Technologies Sdn Bhd430. Statworks Technology Sdn Bhd431. Stirk Lamont (MSC) Sdn Bhd432. STR Communication Sdn. Bhd.433. Struktur Mestika Sdn Bhd434. Suitelab Technology Sdn. Bhd.435. Sunlight Universal Corporation Sdn Bhd436. Sunway Digital Wave Sdn Bhd437. Superceed (M) Sdn Bhd
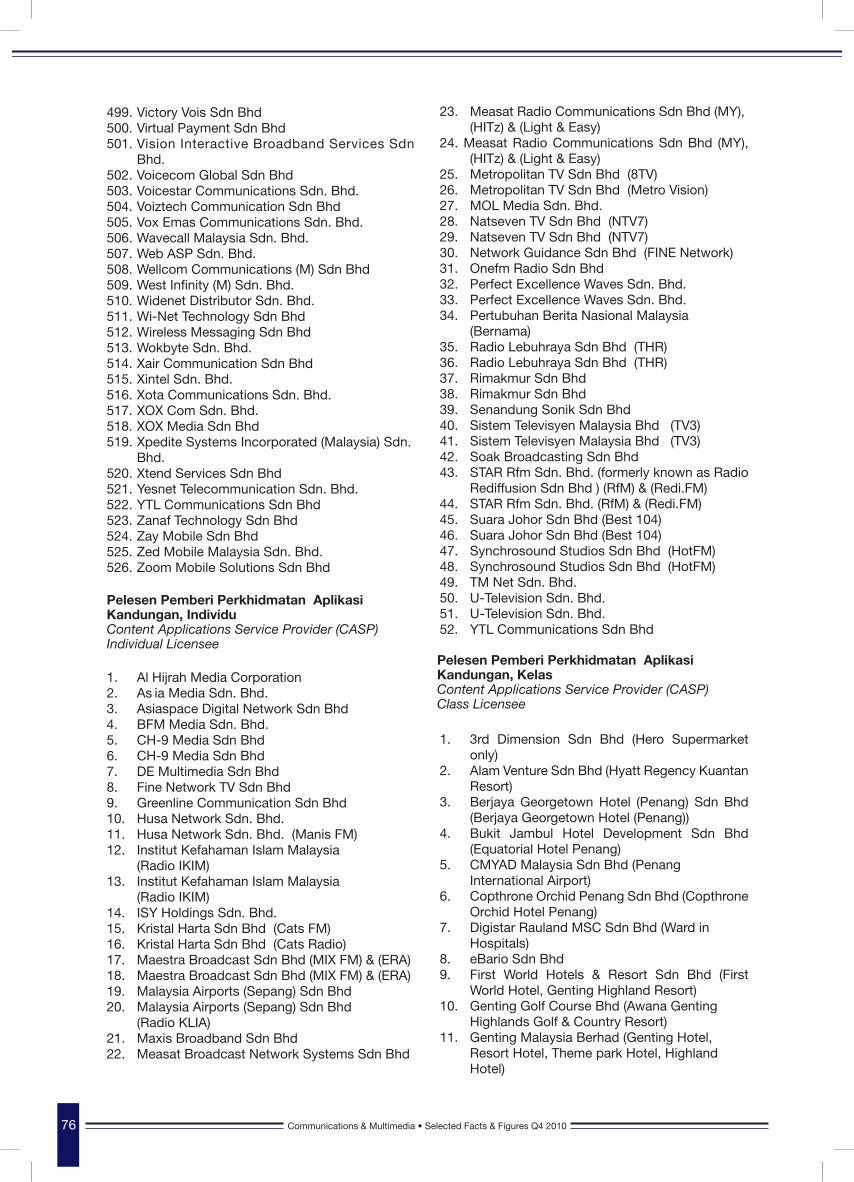
76 Communications & Multimedia • Selected Facts & Figures Q4 2010 Communications & Multimedia • Selected Facts & Figures Q4 2010
23. Measat Radio Communications Sdn Bhd (MY), (HITz) & (Light & Easy)
24. Measat Radio Communications Sdn Bhd (MY), (HITz) & (Light & Easy)
25. Metropolitan TV Sdn Bhd (8TV)26. Metropolitan TV Sdn Bhd (Metro Vision)27. MOL Media Sdn. Bhd.28. Natseven TV Sdn Bhd (NTV7)29. Natseven TV Sdn Bhd (NTV7)30. Network Guidance Sdn Bhd (FINE Network)31. Onefm Radio Sdn Bhd 32. Perfect Excellence Waves Sdn. Bhd. 33. Perfect Excellence Waves Sdn. Bhd.34. Pertubuhan Berita Nasional Malaysia (Bernama)35. Radio Lebuhraya Sdn Bhd (THR)36. Radio Lebuhraya Sdn Bhd (THR)37. Rimakmur Sdn Bhd38. Rimakmur Sdn Bhd39. Senandung Sonik Sdn Bhd40. Sistem Televisyen Malaysia Bhd (TV3)41. Sistem Televisyen Malaysia Bhd (TV3)42. Soak Broadcasting Sdn Bhd43. STAR Rfm Sdn. Bhd. (formerly known as Radio
Rediffusion Sdn Bhd ) (RfM) & (Redi.FM)44. STAR Rfm Sdn. Bhd. (RfM) & (Redi.FM)45. Suara Johor Sdn Bhd (Best 104)46. Suara Johor Sdn Bhd (Best 104)47. Synchrosound Studios Sdn Bhd (HotFM)48. Synchrosound Studios Sdn Bhd (HotFM)49. TM Net Sdn. Bhd.50. U-Television Sdn. Bhd. 51. U-Television Sdn. Bhd.52. YTL Communications Sdn Bhd
1. 3rd Dimension Sdn Bhd (Hero Supermarket only)
2. Alam Venture Sdn Bhd (Hyatt Regency Kuantan Resort)
3. Berjaya Georgetown Hotel (Penang) Sdn Bhd (Berjaya Georgetown Hotel (Penang))
4. Bukit Jambul Hotel Development Sdn Bhd (Equatorial Hotel Penang)
5. CMYAD Malaysia Sdn Bhd (Penang International Airport)6. Copthrone Orchid Penang Sdn Bhd (Copthrone
Orchid Hotel Penang)7. Digistar Rauland MSC Sdn Bhd (Ward in Hospitals)8. eBario Sdn Bhd9. First World Hotels & Resort Sdn Bhd (First
World Hotel, Genting Highland Resort)10. Genting Golf Course Bhd (Awana Genting Highlands Golf & Country Resort)11. Genting Malaysia Berhad (Genting Hotel, Resort Hotel, Theme park Hotel, Highland Hotel)
499. Victory Vois Sdn Bhd500. Virtual Payment Sdn Bhd501. Vision Interactive Broadband Services Sdn
Bhd.502. Voicecom Global Sdn Bhd503. Voicestar Communications Sdn. Bhd.504. Voiztech Communication Sdn Bhd505. Vox Emas Communications Sdn. Bhd.506. Wavecall Malaysia Sdn. Bhd.507. Web ASP Sdn. Bhd.508. Wellcom Communications (M) Sdn Bhd509. West Infinity (M) Sdn. Bhd.510. Widenet Distributor Sdn. Bhd.511. Wi-Net Technology Sdn Bhd512. Wireless Messaging Sdn Bhd513. Wokbyte Sdn. Bhd.514. Xair Communication Sdn Bhd515. Xintel Sdn. Bhd.516. Xota Communications Sdn. Bhd.517. XOX Com Sdn. Bhd.518. XOX Media Sdn Bhd519. Xpedite Systems Incorporated (Malaysia) Sdn.
Bhd.520. Xtend Services Sdn Bhd521. Yesnet Telecommunication Sdn. Bhd.522. YTL Communications Sdn Bhd523. Zanaf Technology Sdn Bhd524. Zay Mobile Sdn Bhd525. Zed Mobile Malaysia Sdn. Bhd.526. Zoom Mobile Solutions Sdn Bhd
1. Al Hijrah Media Corporation2. As ia Media Sdn. Bhd.3. Asiaspace Digital Network Sdn Bhd4. BFM Media Sdn. Bhd. 5. CH-9 Media Sdn Bhd 6. CH-9 Media Sdn Bhd7. DE Multimedia Sdn Bhd8. Fine Network TV Sdn Bhd9. Greenline Communication Sdn Bhd10. Husa Network Sdn. Bhd.11. Husa Network Sdn. Bhd. (Manis FM)12. Institut Kefahaman Islam Malaysia (Radio IKIM)13. Institut Kefahaman Islam Malaysia (Radio IKIM)14. ISY Holdings Sdn. Bhd.15. Kristal Harta Sdn Bhd (Cats FM)16. Kristal Harta Sdn Bhd (Cats Radio)17. Maestra Broadcast Sdn Bhd (MIX FM) & (ERA)18. Maestra Broadcast Sdn Bhd (MIX FM) & (ERA)19. Malaysia Airports (Sepang) Sdn Bhd 20. Malaysia Airports (Sepang) Sdn Bhd (Radio KLIA)21. Maxis Broadband Sdn Bhd22. Measat Broadcast Network Systems Sdn Bhd
Pelesen Pemberi Perkhidmatan Aplikasi Kandungan, IndividuContent Applications Service Provider (CASP) Individual Licensee
Pelesen Pemberi Perkhidmatan Aplikasi Kandungan, KelasContent Applications Service Provider (CASP) Class Licensee
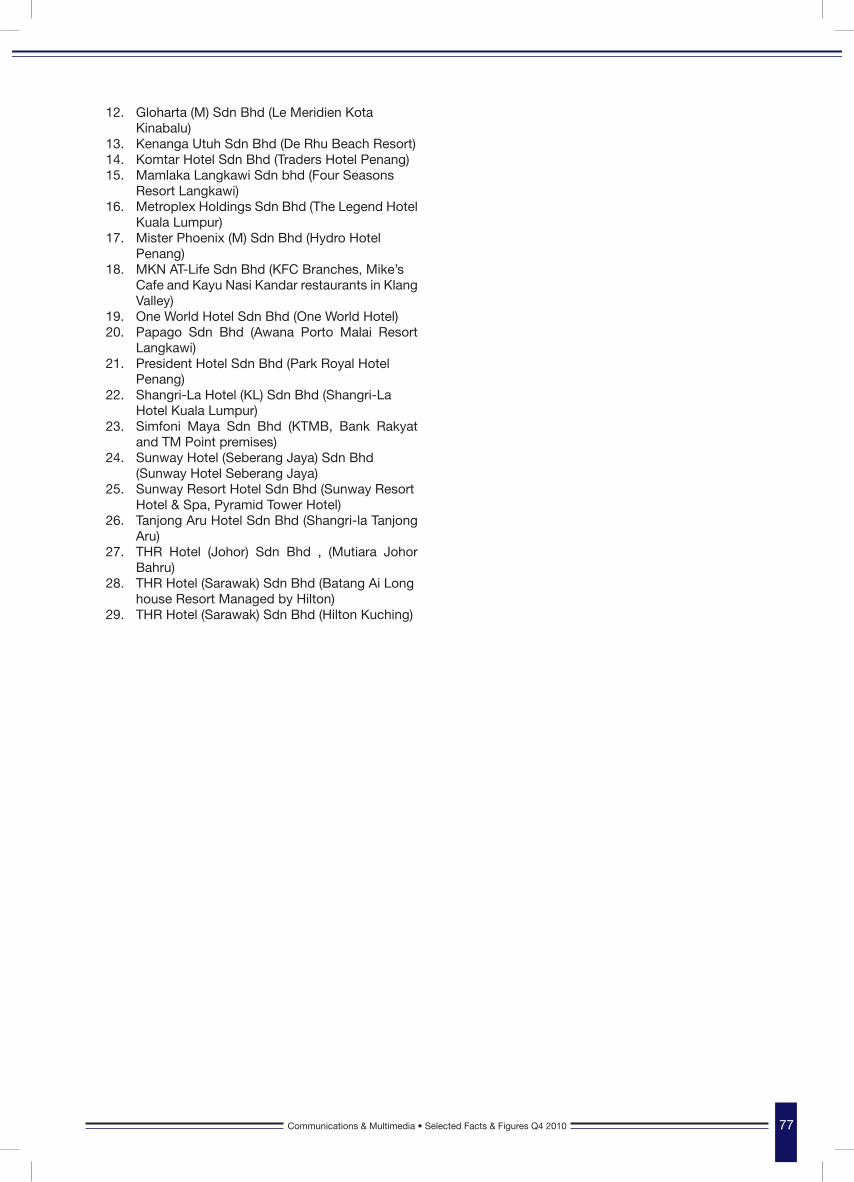
Communications & Multimedia • Selected Facts & Figures Q4 2010 77Communications & Multimedia • Selected Facts & Figures Q4 2010
12. Gloharta (M) Sdn Bhd (Le Meridien Kota Kinabalu)13. Kenanga Utuh Sdn Bhd (De Rhu Beach Resort)14. Komtar Hotel Sdn Bhd (Traders Hotel Penang) 15. Mamlaka Langkawi Sdn bhd (Four Seasons Resort Langkawi)16. Metroplex Holdings Sdn Bhd (The Legend Hotel
Kuala Lumpur)17. Mister Phoenix (M) Sdn Bhd (Hydro Hotel Penang)18. MKN AT-Life Sdn Bhd (KFC Branches, Mike’s
Cafe and Kayu Nasi Kandar restaurants in Klang Valley)
19. One World Hotel Sdn Bhd (One World Hotel)20. Papago Sdn Bhd (Awana Porto Malai Resort
Langkawi)21. President Hotel Sdn Bhd (Park Royal Hotel Penang)22. Shangri-La Hotel (KL) Sdn Bhd (Shangri-La Hotel Kuala Lumpur)23. Simfoni Maya Sdn Bhd (KTMB, Bank Rakyat
and TM Point premises)24. Sunway Hotel (Seberang Jaya) Sdn Bhd (Sunway Hotel Seberang Jaya)25. Sunway Resort Hotel Sdn Bhd (Sunway Resort
Hotel & Spa, Pyramid Tower Hotel)26. Tanjong Aru Hotel Sdn Bhd (Shangri-la Tanjong
Aru)27. THR Hotel (Johor) Sdn Bhd , (Mutiara Johor
Bahru)28. THR Hotel (Sarawak) Sdn Bhd (Batang Ai Long
house Resort Managed by Hilton)29. THR Hotel (Sarawak) Sdn Bhd (Hilton Kuching)
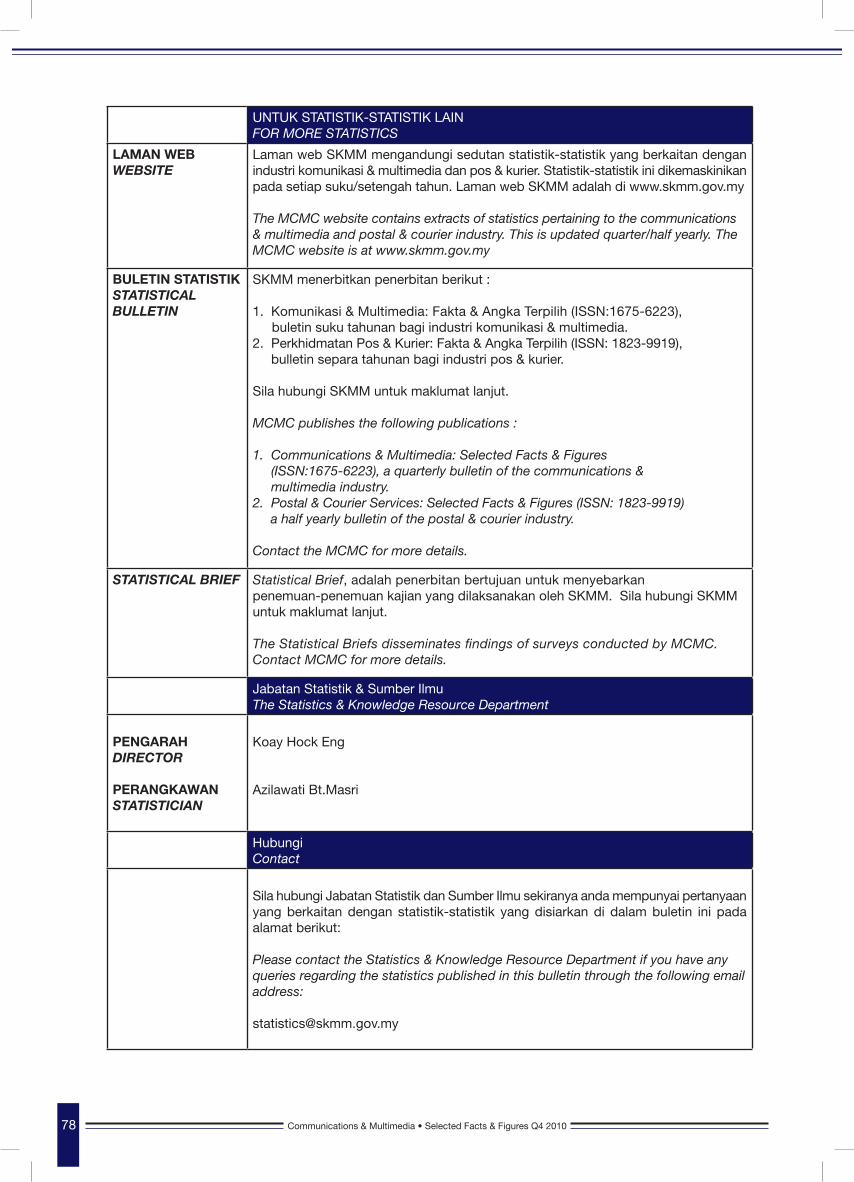
78 Communications & Multimedia • Selected Facts & Figures Q4 2010
UNTUK STATISTIK-STATISTIK LAIN FOR MORE STATISTICS
LAMAN WEBWEBSITE
Laman web SKMM mengandungi sedutan statistik-statistik yang berkaitan dengan industri komunikasi & multimedia dan pos & kurier. Statistik-statistik ini dikemaskinikan pada setiap suku/setengah tahun. Laman web SKMM adalah di www.skmm.gov.my
The MCMC website contains extracts of statistics pertaining to the communications & multimedia and postal & courier industry. This is updated quarter/half yearly. The MCMC website is at www.skmm.gov.my
BULETIN STATISTIKSTATISTICAL BULLETIN
SKMM menerbitkan penerbitan berikut :
1. Komunikasi & Multimedia: Fakta & Angka Terpilih (ISSN:1675-6223), buletin suku tahunan bagi industri komunikasi & multimedia.2. Perkhidmatan Pos & Kurier: Fakta & Angka Terpilih (ISSN: 1823-9919), bulletin separa tahunan bagi industri pos & kurier.
Sila hubungi SKMM untuk maklumat lanjut.
MCMC publishes the following publications :
1. Communications & Multimedia: Selected Facts & Figures (ISSN:1675-6223), a quarterly bulletin of the communications & multimedia industry.2. Postal & Courier Services: Selected Facts & Figures (ISSN: 1823-9919) a half yearly bulletin of the postal & courier industry.
Contact the MCMC for more details.
STATISTICAL BRIEF Statistical Brief, adalah penerbitan bertujuan untuk menyebarkanpenemuan-penemuan kajian yang dilaksanakan oleh SKMM. Sila hubungi SKMM untuk maklumat lanjut.
The Statistical Briefs disseminates findings of surveys conducted by MCMC. Contact MCMC for more details.
Jabatan Statistik & Sumber IlmuThe Statistics & Knowledge Resource Department
PENGARAHDIRECTOR
PERANGKAWANSTATISTICIAN
Koay Hock Eng
Azilawati Bt.Masri
HubungiContact
Sila hubungi Jabatan Statistik dan Sumber Ilmu sekiranya anda mempunyai pertanyaan yang berkaitan dengan statistik-statistik yang disiarkan di dalam buletin ini pada alamat berikut:
Please contact the Statistics & Knowledge Resource Department if you have any queries regarding the statistics published in this bulletin through the following email address: