Embed Size (px)
Citation preview
UNITED STATESSECURITIES AND EXCHANGE COMMISSION
Washington, D.C. 20549
FORM 10-K(Mark One)È Annual Report Pursuant to Section 13 or 15(d) of the Securities Exchange Act of 1934
For the fiscal year ended January 30, 2010
or
‘ Transition Report Pursuant to Section 13 or 15(d) of the Securities Exchange Act of 1934
For the Transition period from to
Commission File No. 1-11084
KOHL’S CORPORATION(Exact name of registrant as specified in its charter)
WISCONSIN 39-1630919(State or other jurisdiction ofincorporation or organization)
(I.R.S. Employer Identification No.)
N56 W17000 Ridgewood Drive,Menomonee Falls, Wisconsin 53051
(Address of principal executive offices) (Zip Code)
Registrant’s telephone number, including area code (262) 703-7000
Securities registered pursuant to Section 12(b) of the Act:Title of each class Name of each exchange on which registered
Common Stock, $.01 Par Value New York Stock Exchange
Securities registered pursuant to Section 12(g) of the Act: NONE
Indicate by check mark if the registrant is a well-known seasoned issuer, as defined in Rule 405 of the SecuritiesAct. Yes X No .
Indicate by check mark if the registrant is not required to file reports pursuant to Section 13 or Section 15(d) ofthe Act. Yes No X .
Indicate by check mark whether the registrant (1) has filed all reports required to be filed by Section 13 or 15(d) ofthe Securities Exchange Act of 1934 during the preceding 12 months (or for such shorter period that the registrant wasrequired to file such reports), and (2) has been subject to such filing requirements for the past 90 days.Yes X No .
Indicate by check mark whether the registrant has submitted electronically and posted on its corporate Website, ifany, every Interactive Data File required to be submitted and posted pursuant to Rule 405 of Regulations S-T (232.405of this chapter) during the preceding 12 months (or for such shorter period that the registrant was required to submitand post such files). Yes X No .
Indicate by check mark if disclosure of delinquent filers pursuant to Item 405 of Regulation S-K is not containedherein, and will not be contained, to the best of registrant’s knowledge, in definitive proxy or information statementsincorporated by reference in Part III of this Form 10-K or any amendment to this Form 10-K. È
Indicate by check mark whether the registrant is a large accelerated filer, an accelerated filer, a non-acceleratedfiler or a smaller reporting company. See definitions of “large accelerated filer,” “accelerated filer” and “smallerreporting company” in Rule 12b-2 of the Exchange Act. (Check one):Large accelerated filer X Accelerated filer Non-accelerated filer (Do not check if a smallerreporting company) Smaller reporting company
Indicate by check mark whether the registrant is a shell company (as defined in Rule 12b-2 of the Exchange Act).Yes No X .
At August 1, 2009, the aggregate market value of the voting stock of the Registrant held by stockholders whowere not affiliates of the Registrant was approximately $14.8 billion (based upon the closing price of Registrant’sCommon Stock on the New York Stock Exchange on such date). At March 10, 2010, the Registrant had outstanding anaggregate of 306,974,796 shares of its Common Stock.
Documents Incorporated by Reference:
Portions of the Proxy Statement for the Registrant’s Annual Meeting of Shareholders to be held on May 13, 2010 areincorporated into Parts II and III.
Table of Contents
PART I . . . . . . . . . . . . . . . . . . . . . . . . . . . . . . . . . . . . . . . . . . . . . . . . . . . . . . . . . . . . . . . . . . . . . . . . . . . . . . . . 3Item 1. Business . . . . . . . . . . . . . . . . . . . . . . . . . . . . . . . . . . . . . . . . . . . . . . . . . . . . . . . . . . . . . . . . . 3Item 1A. Risk Factors . . . . . . . . . . . . . . . . . . . . . . . . . . . . . . . . . . . . . . . . . . . . . . . . . . . . . . . . . . . . . . 7Item 1B. Unresolved Staff Comments . . . . . . . . . . . . . . . . . . . . . . . . . . . . . . . . . . . . . . . . . . . . . . . . . 11Item 2. Properties . . . . . . . . . . . . . . . . . . . . . . . . . . . . . . . . . . . . . . . . . . . . . . . . . . . . . . . . . . . . . . . . 11Item 3. Legal Proceedings . . . . . . . . . . . . . . . . . . . . . . . . . . . . . . . . . . . . . . . . . . . . . . . . . . . . . . . . . 16Item 4. Reserved . . . . . . . . . . . . . . . . . . . . . . . . . . . . . . . . . . . . . . . . . . . . . . . . . . . . . . . . . . . . . . . . 16
PART II . . . . . . . . . . . . . . . . . . . . . . . . . . . . . . . . . . . . . . . . . . . . . . . . . . . . . . . . . . . . . . . . . . . . . . . . . . . . . . . 17Item 5. Market for Registrant’s Common Equity, Related Stockholder Matters and Issuer
Purchases of Equity Securities . . . . . . . . . . . . . . . . . . . . . . . . . . . . . . . . . . . . . . . . . . . . . 17Item 6. Selected Consolidated Financial Data . . . . . . . . . . . . . . . . . . . . . . . . . . . . . . . . . . . . . . . . . . 20Item 7. Management’s Discussion and Analysis of Financial Condition and Results of
Operations . . . . . . . . . . . . . . . . . . . . . . . . . . . . . . . . . . . . . . . . . . . . . . . . . . . . . . . . . . . . . 21Item 7A. Quantitative and Qualitative Disclosures About Market Risk . . . . . . . . . . . . . . . . . . . . . . . 33Item 8. Financial Statements and Supplementary Data . . . . . . . . . . . . . . . . . . . . . . . . . . . . . . . . . . . 33Item 9. Changes In and Disagreements with Accountants on Accounting and Financial
Disclosures . . . . . . . . . . . . . . . . . . . . . . . . . . . . . . . . . . . . . . . . . . . . . . . . . . . . . . . . . . . . . 33Item 9A. Controls and Procedures . . . . . . . . . . . . . . . . . . . . . . . . . . . . . . . . . . . . . . . . . . . . . . . . . . . . 33Item 9B. Other Information . . . . . . . . . . . . . . . . . . . . . . . . . . . . . . . . . . . . . . . . . . . . . . . . . . . . . . . . . 35
PART III . . . . . . . . . . . . . . . . . . . . . . . . . . . . . . . . . . . . . . . . . . . . . . . . . . . . . . . . . . . . . . . . . . . . . . . . . . . . . . 36Item 10. Directors, Executive Officers and Corporate Governance . . . . . . . . . . . . . . . . . . . . . . . . . . 36Item 11. Executive Compensation . . . . . . . . . . . . . . . . . . . . . . . . . . . . . . . . . . . . . . . . . . . . . . . . . . . . 37Item 12. Security Ownership of Certain Beneficial Owners and Management and Related
Stockholder Matters . . . . . . . . . . . . . . . . . . . . . . . . . . . . . . . . . . . . . . . . . . . . . . . . . . . . . . 37Item 13. Certain Relationships and Related Transactions, and Director Independence . . . . . . . . . . . 37Item 14. Principal Accountant Fees and Services . . . . . . . . . . . . . . . . . . . . . . . . . . . . . . . . . . . . . . . . 37
PART IV . . . . . . . . . . . . . . . . . . . . . . . . . . . . . . . . . . . . . . . . . . . . . . . . . . . . . . . . . . . . . . . . . . . . . . . . . . . . . . 38Item 15. Exhibits and Financial Statement Schedules . . . . . . . . . . . . . . . . . . . . . . . . . . . . . . . . . . . . . 38
Signatures . . . . . . . . . . . . . . . . . . . . . . . . . . . . . . . . . . . . . . . . . . . . . . . . . . . . . . . . . . . . . . . 39Exhibit Index . . . . . . . . . . . . . . . . . . . . . . . . . . . . . . . . . . . . . . . . . . . . . . . . . . . . . . . . . . . . . 40Index to Consolidated Financial Statements . . . . . . . . . . . . . . . . . . . . . . . . . . . . . . . . . . . . . F-1
PART I
Item 1. Business
Kohl’s Corporation (the “Company” or “Kohl’s”) was organized in 1988 and is a Wisconsin corporation.We operate family-oriented department stores that sell moderately priced apparel, footwear and accessories forwomen, men and children; soft home products such as sheets and pillows; and housewares. Our stores generallycarry a consistent merchandise assortment with some differences attributable to regional preferences. Our storesfeature quality private and exclusive brands which are found “Only at Kohl’s” as well as national brands. Ourapparel and home fashions appeal to classic, modern classic and contemporary customers. As of January 30,2010, we operated 1,058 stores in 49 states.
As reflected in the table below, our merchandise mix has been consistent over the last three years:
2009 2008 2007
Women’s . . . . . . . . . . . . . . . . . . . . . . . . . . . . . . . . . . . . . . . . . . . . . . . . . . . . . . . . 32% 32% 33%Men’s . . . . . . . . . . . . . . . . . . . . . . . . . . . . . . . . . . . . . . . . . . . . . . . . . . . . . . . . . . . 19 19 19Home . . . . . . . . . . . . . . . . . . . . . . . . . . . . . . . . . . . . . . . . . . . . . . . . . . . . . . . . . . . 18 18 18Children’s . . . . . . . . . . . . . . . . . . . . . . . . . . . . . . . . . . . . . . . . . . . . . . . . . . . . . . . . 13 13 13Accessories . . . . . . . . . . . . . . . . . . . . . . . . . . . . . . . . . . . . . . . . . . . . . . . . . . . . . . . 10 10 9Footwear . . . . . . . . . . . . . . . . . . . . . . . . . . . . . . . . . . . . . . . . . . . . . . . . . . . . . . . . . 8 8 8
In addition, Kohl’s offers on-line shopping on our website at www.Kohls.com. Designed as an addedservice for customers who prefer to shop using the internet, the website has grown to include a selection of itemsand categories beyond what is available in stores, with a primary focus on extended sizes, product lineextensions, and web-exclusive product lines. The website is designed to provide a convenient, easy-to-navigate,on-line shopping environment that complements our in-store focus.
An important aspect of our pricing strategy and overall profitability is a culture focused on maintaining alow-cost structure. Critical elements of this low-cost structure are our unique store format, lean staffing levels,sophisticated management information systems and operating efficiencies which are the result of centralizedbuying, advertising and distribution.
Our fiscal year ends on the Saturday closest to January 31. Unless otherwise noted, references to years inthis report relate to fiscal years, rather than to calendar years. Fiscal year 2009 (“2009”) ended on January 30,2010. Fiscal year 2008 (“2008”) ended on January 31, 2009. Fiscal year 2007 (“2007”) ended on February 2,2008. Fiscal 2009, 2008 and 2007 were 52-week years.
Strategic Committees and Initiatives
We have two strategic committees which focus on opportunities to drive our overall profitability. Themission of the Regional Assortment Committee is to accelerate sales growth by varying merchandise assortment,marketing and store presentation by region to reflect the lifestyle preferences and climate needs of our customers.The mission of the In-Store Experience Committee is to consistently deliver an improved store experience thatgenerates loyalty and grows market share.
The following initiatives have been designed to achieve the goals of the strategic committees:
• Our merchandise content initiatives are focused on increasing market share by expanding Kohl’sappeal to a broader range of customers and by creating value and differentiation with private andexclusive brands which are available “Only at Kohl’s.” New brand launches in 2009 included:
• Dana Buchman – a classic lifestyle brand, spanning several categories including women’s apparel,intimate apparel, accessories, and footwear, launched in February 2009. Ultimately, the brand maybe extended into home, beauty and fragrance categories.
• Hang Ten – a California lifestyle collection for young shoppers launched in Spring 2009.
3
• Mudd – launched in juniors and girls prior to the 2009 back-to-school shopping season.
• LC Lauren Conrad – exclusive partnership with Lauren Conrad, launched in approximately 300Kohl’s stores and Kohls.com in October 2009. LC Lauren Conrad will be rolled out to all storesnationwide in March 2010. We accelerated the roll-out due to better than expected sales. Ouroriginal plans did not call for roll out until Fall 2010.
Helix, our newest private brand, launched in February 2010. Helix is an opening-price brand positionedin our Contemporary Good lifestyle/price zone and will be featured in young men’s tops, fashionbottoms and shorts.
The success of our recently launched brands, as well as our other exclusive and private brands,continue to drive increased penetration of our exclusive and private labels. Exclusive and private brandsales as a percentage of total sales increased approximately 220 basis points to 44.3% for 2009.
• Our marketing initiatives are designed to differentiate Kohl’s in the marketplace while maximizing thereturn on our marketing investment. Our 2009 marketing efforts used “The More You Know, The MoreYou Kohl’s” platform to focus on the value of shopping at Kohl’s. Our marketing emphasized thepower of Kohl’s savings tools that allow our customer to save more money—like compelling saleevents, savings for Kohl’s Charge cardholders, sale events with no exclusions, and unique “Only atKohl’s” events such as Kohl’s Cash and Power Hours.
We used all media types to communicate the message including both national and spot television,radio, newspaper tab insertions, direct mail, e-mail and digital media along with our own Kohl’s.comwebsite. Our marketing also emphasized our flexible, no questions asked, return policy.
• Our inventory management initiatives are designed to ensure that we have the right inventory, in theright stores, at the right time. Size optimization is focused on ensuring that each of our individual storeshas inventory in the correct style, color and size. Markdown optimization is focused on pricingclearance items at the appropriate price for each location’s inventory and sales history.
Another important inventory management initiative is to increase our speed-to-market through ourconcept-to customer strategy. Two years ago, it took 45 weeks from the start of development to thedelivery of products to the stores. Today, our cycle time is typically 20 to 32 weeks, with our fastestbrands delivering in 12 weeks and reorders in four to six weeks.
During 2009, we continued to aggressively manage our inventory levels by reducing seasonalinventory levels, while maintaining levels in basic areas such as hosiery and underwear. As a result ofstrong inventory management and cycle time reductions, clearance inventory levels have decreased fora second consecutive year. Our year-end inventory per store (on a dollar basis) decreased 0.9% fromlast year.
• The objective of our in-store shopping experience initiative is to satisfy the changing needs andexpectations of our customers. Practical, easy shopping is about convenience. At Kohl’s, convenienceincludes a neighborhood location close to home, convenient parking, easily accessible entry,knowledgeable and friendly associates, wide aisles, a functional store layout, shopping carts/strollersand fast, centralized checkouts. Though our stores have fewer departments than traditional, full-linedepartment stores, the physical layout of the store and our focus on strong in-stock positions in style,color and size is aimed at providing a convenient shopping experience for an increasingly time-starvedcustomer.
Remodels are also an important part of our in-store shopping experience initiative as we believe it isextremely important to maintain our existing store base, even in this difficult environment. Wecompleted 51 store remodels in 2009—an increase from the 36 stores which were remodeled in2008—and currently plan to remodel 85 stores in 2010. We have been able to compress the remodelduration period from 16 weeks to nine weeks over the past two years to minimize costs and disruptionto our stores, benefiting our sales and customer experience.
4
Our new and remodeled stores continue to reflect our latest thoughts in store design. Recentenhancements include new and updated exteriors and point-of-sale stations; improved fitting rooms,lounges, restrooms and customer service areas; and specialty fixturing. We have also updated thejunior’s, kids, young men’s and shoe departments and redesigned our center core to improve sightlinesthroughout the store. Remodels and new stores in 2010 will contain a dramatically re-designed homearea which will allow us to have more capacity on the sales floor and provide more flexibility in ourfixtures.
As a result of our in-store experience and other initiatives, we have seen an approximately 7%improvement in our customer service scorecard results in 2009. Customer service scores are deliveredfrom direct customer surveys conducted by an independent research firm.
For discussion of our financial results, see Item 7, “Management’s Discussion and Analysis of FinancialCondition and Results of Operations.”
Expansion
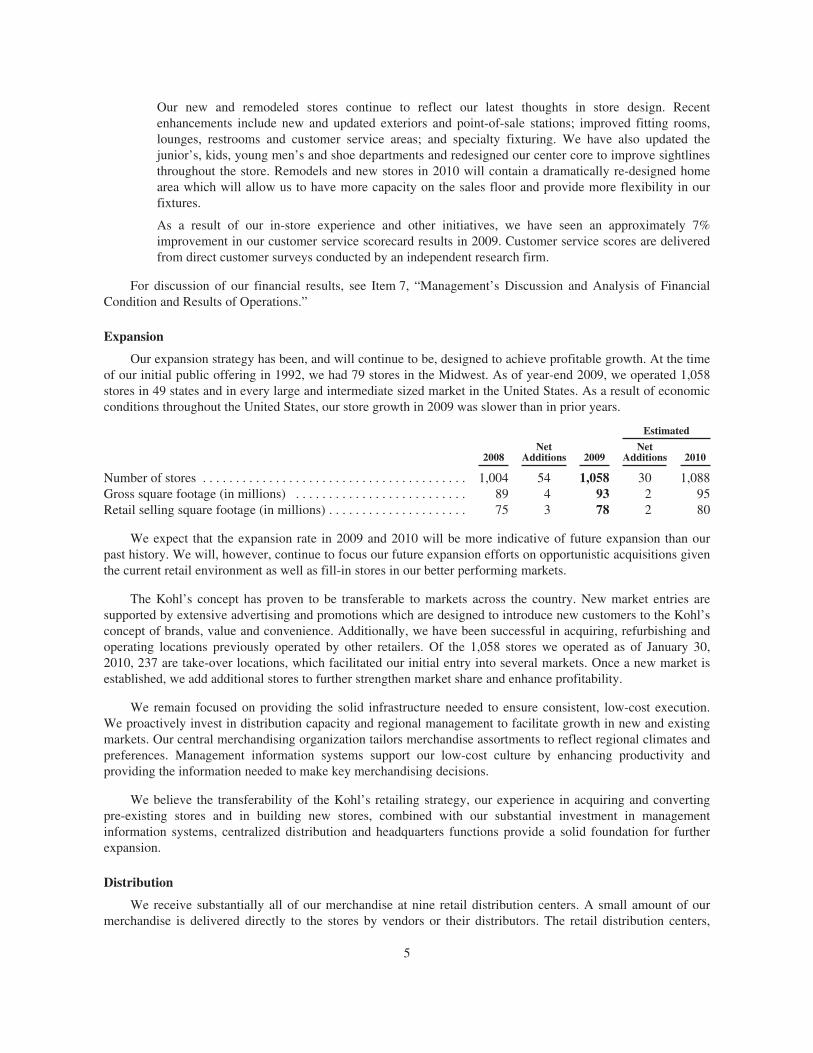
Our expansion strategy has been, and will continue to be, designed to achieve profitable growth. At the timeof our initial public offering in 1992, we had 79 stores in the Midwest. As of year-end 2009, we operated 1,058stores in 49 states and in every large and intermediate sized market in the United States. As a result of economicconditions throughout the United States, our store growth in 2009 was slower than in prior years.
Estimated
2008Net
Additions 2009Net
Additions 2010
Number of stores . . . . . . . . . . . . . . . . . . . . . . . . . . . . . . . . . . . . . . . . 1,004 54 1,058 30 1,088Gross square footage (in millions) . . . . . . . . . . . . . . . . . . . . . . . . . . 89 4 93 2 95Retail selling square footage (in millions) . . . . . . . . . . . . . . . . . . . . . 75 3 78 2 80
We expect that the expansion rate in 2009 and 2010 will be more indicative of future expansion than ourpast history. We will, however, continue to focus our future expansion efforts on opportunistic acquisitions giventhe current retail environment as well as fill-in stores in our better performing markets.
The Kohl’s concept has proven to be transferable to markets across the country. New market entries aresupported by extensive advertising and promotions which are designed to introduce new customers to the Kohl’sconcept of brands, value and convenience. Additionally, we have been successful in acquiring, refurbishing andoperating locations previously operated by other retailers. Of the 1,058 stores we operated as of January 30,2010, 237 are take-over locations, which facilitated our initial entry into several markets. Once a new market isestablished, we add additional stores to further strengthen market share and enhance profitability.
We remain focused on providing the solid infrastructure needed to ensure consistent, low-cost execution.We proactively invest in distribution capacity and regional management to facilitate growth in new and existingmarkets. Our central merchandising organization tailors merchandise assortments to reflect regional climates andpreferences. Management information systems support our low-cost culture by enhancing productivity andproviding the information needed to make key merchandising decisions.
We believe the transferability of the Kohl’s retailing strategy, our experience in acquiring and convertingpre-existing stores and in building new stores, combined with our substantial investment in managementinformation systems, centralized distribution and headquarters functions provide a solid foundation for furtherexpansion.
Distribution
We receive substantially all of our merchandise at nine retail distribution centers. A small amount of ourmerchandise is delivered directly to the stores by vendors or their distributors. The retail distribution centers,
5
which are strategically located through the United Sates, ship merchandise to each store by contract carrierseveral times a week. We also operate a 940,000 square foot fulfillment center in Monroe, Ohio that services oure-commerce business. Additionally, we plan to open a 970,000 square foot e-commerce fulfillment center in SanBernardino, California in June 2010 to provide increased capacity to support our growing e-commerce business.
See Item 2, “Properties,” for additional information about our distribution centers.
Employees
As of January 30, 2010, we employed approximately 133,000 associates, including approximately 29,000full-time and 104,000 part-time associates. The number of associates varies during the year, peaking during theback-to-school and holiday seasons. None of our associates are represented by a collective bargaining unit. Webelieve our relations with our associates are very good.
Competition
The retail industry is highly competitive. Management considers quality, value, merchandise mix, serviceand convenience to be the most significant competitive factors in the industry. Our primary competitors aretraditional department stores, upscale mass merchandisers and specialty stores. Our specific competitors varyfrom market to market.
Merchandise Vendors
We purchase merchandise from numerous domestic and foreign suppliers. We have Terms of Engagementrequirements which set forth the basic minimum requirements all business partners must meet in order to dobusiness with Kohl’s. Our Terms of Engagement include provisions regarding laws and regulations, employmentpractices, ethical standards, environmental and legal requirements, communication, monitoring/compliance,record keeping, subcontracting and corrective action. Our expectation is that all business partners will complywith these Terms of Engagement and quickly remediate any deficiencies, if noted, in order to maintain ourbusiness relationship.
None of our vendors accounted for more than 5% of our net purchases during 2009. We have no long-termpurchase commitments or arrangements with any of our suppliers, and believe that we are not dependent on anyone supplier. We believe we have good working relationships with our suppliers.
Seasonality
Our business, like that of most retailers, is subject to seasonal influences. The majority of our sales andincome are typically realized during the second half of each fiscal year. The back-to-school season extends fromAugust through September and represents approximately 15% of our annual sales. Approximately 30% of oursales occur during the holiday season in the months of November and December. Because of the seasonality ofour business, results for any quarter are not necessarily indicative of the results that may be achieved for thefiscal year. In addition, quarterly results of operations depend upon the timing and amount of revenues and costsassociated with the opening of new stores.
Trademarks and Service Marks
The name “Kohl’s” is a registered service mark of one of our wholly-owned subsidiaries. We consider thismark and the accompanying name recognition to be valuable to our business. This subsidiary has over 125additional registered trademarks, trade names and service marks, most of which are used in our private labelprogram.
6
Available Information
Our internet website is www.Kohls.com. Through the “Investor Relations” portion of this website, we makeavailable, free of charge, our proxy statements, Annual Reports on Form 10-K, Quarterly Reports on Form 10-Q,Current Reports on Form 8-K, SEC Forms 3, 4 and 5 and any amendments to those reports as soon as reasonablypracticable after such material has been filed with, or furnished to, the Securities and Exchange Commission(“SEC”).
The following have also been posted on our website, under the caption “Investor Relations-CorporateGovernance:”
• Committee charters of our Board of Directors’ Audit Committee, Compensation Committee andGovernance & Nominating Committee
• Report to Shareholders on Social Responsibility
• Corporate Governance Guidelines
• Code of Ethics
Any amendment to or waiver from the provisions of the Code of Ethics that is applicable to our ChiefExecutive Officer, Chief Financial Officer or other key finance associates will be disclosed on the “CorporateGovernance” portion of the website.
Information contained on our website is not part of this Annual Report on Form 10-K. Paper copies of anyof the materials listed above will be provided without charge to any shareholder submitting a written request toour Investor Relations Department at N56 W17000 Ridgewood Drive, Menomonee Falls, Wisconsin 53051 orvia e-mail to [email protected].
Item 1A. Risk Factors
Forward Looking Statements
Items 1, 2, 3, 5, 7 and 7A of this Form 10-K contain “forward-looking statements,” made within themeaning of the Private Securities Litigation Reform Act of 1995. Words such as “believes,” “anticipates,”“plans,” “may,” “intends,” “will,” “should,” “expects” and similar expressions are intended to identify forward-looking statements. In addition, statements covering our future sales or financial performance and our plans,performance and other objectives, expectations or intentions are forward-looking statements, such as statementsregarding our liquidity, debt service requirements, planned capital expenditures, future store openings andadequacy of capital resources and reserves. There are a number of important factors that could cause our resultsto differ materially from those indicated by the forward-looking statements, including among others, those riskfactors described below. Forward-looking statements relate to the date made, and we undertake no obligations toupdate them.
Declines in general economic conditions, consumer spending levels and other conditions could lead toreduced consumer demand for our merchandise and cause reductions in our sales and/or gross margin.
Consumer spending habits, including spending for the merchandise that we sell, are affected by, amongother things, prevailing economic conditions, levels of employment, salaries and wage rates, prevailing interestrates, housing costs, energy costs, income tax rates and policies, consumer confidence and consumer perceptionof economic conditions. In addition, consumer purchasing patterns may be influenced by consumers’ disposableincome, credit availability and debt levels.
The recent slowdown has caused disruptions and significant volatility in financial markets, increased ratesof default and bankruptcy and declining consumer and business confidence, which has led to decreased levels of
7
consumer spending, particularly on discretionary items. A continued or incremental slowdown in the U.S.economy and the uncertain economic outlook could continue to adversely affect consumer spending habitsresulting in lower net sales and profits than expected on a quarterly or annual basis. As all of our stores arelocated in the United States, we are especially susceptible to deteriorations in the U.S. economy.
Consumer confidence is also affected by the domestic and international political situation. The outbreak orescalation of war, or the occurrence of terrorist acts or other hostilities in or affecting the United States, couldlead to a decrease in spending by consumers.
Actions by our competitors could adversely affect our operating results.
The retail business is highly competitive. We compete for customers, associates, locations, merchandise,services and other important aspects of our business with many other local, regional and national retailers. Thosecompetitors, some of which have a greater market presence than Kohl’s, include traditional store-based retailers,internet and catalog businesses and other forms of retail commerce. Unanticipated changes in the pricing andother practices of those competitors may adversely affect our performance.
Product safety concerns could adversely affect our sales and operating results.
If our merchandise offerings do not meet applicable safety standards or our customers’ expectationsregarding safety, we could experience lost sales, experience increased costs and/or be exposed to legal andreputational risk. Events that give rise to actual, potential or perceived product safety concerns could expose us togovernment enforcement action and/or private litigation. Reputational damage caused by real or perceivedproduct safety concerns, could have a negative impact on our sales.
If we do not offer merchandise our customers want and fail to successfully manage our inventory levels, oursales and/or gross margin may be adversely impacted.
Our business is dependent on our ability to anticipate fluctuations in consumer demand for a wide variety ofmerchandise. Failure to accurately predict constantly changing consumer tastes, preferences, spending patternsand other lifestyle decisions could create inventory imbalances and adversely affect our performance and long-term relationships with our customers. Additionally, failure to accurately predict changing consumer tastes mayresult in excess inventory, which could result in additional markdowns and adversely affect our operating results.
Ineffective marketing could adversely affect our sales and profitability.
In 2009, advertising costs, net of related vendor allowances, were $846 million. We believe thatdifferentiating Kohl’s in the marketplace is critical to our success. We design our marketing programs to increaseawareness of our brands, which we expect will create and maintain customer loyalty, increase the number ofcustomers that shop our stores and increase our sales. If our marketing programs are not successful, our sales andprofitability could be adversely affected.
We may be unable to raise additional capital, if needed, or to raise capital on favorable terms.
Recently, the general economic and capital market conditions in the United States and other parts of theworld have deteriorated significantly and have adversely affected access to capital and increased the cost ofcapital. If our existing cash, cash generated from operations and funds available on our lines of credit areinsufficient to fund our future activities, including capital expenditures, or repay debt when it becomes due, wemay need to raise additional funds through public or private equity or debt financing. If unfavorable capitalmarket conditions exist if and when we were to seek additional financing, we may not be able to raise sufficientcapital on favorable terms and on a timely basis (if at all). Failure to obtain capital on acceptable terms, or at all,when required by our business circumstances could have a material adverse effect on us including an inability tofund new growth and other capital expenditures.
8
Inefficient or ineffective allocation of capital could adversely affect our operating results and/or shareholdervalue.
Our goal is to invest capital to maximize our overall long-term returns. This includes spending on inventory,capital projects and expenses, managing debt levels, and periodically returning value to our shareholders throughshare repurchases. To a large degree, capital efficiency reflects how well we manage our other key risks. Theactions taken to address other specific risks may affect how well we manage the more general risk of capitalefficiency. If we do not properly allocate our capital to maximize returns, we may fail to produce optimalfinancial results and we may experience a reduction in shareholder value.
Changes in our credit card operations could adversely affect our sales and/or profitability.
Our credit card operations facilitate sales in our stores and generate additional revenue from fees related toextending credit. In connection with the April 2006 sale of our proprietary credit card accounts to JPMorganChase & Co. (“JPMorgan Chase”), we entered into a revenue-sharing agreement with JPMorgan Chase, whichissues Kohl’s branded private label credit cards to new and existing Kohl’s customers. Net revenues of theprogram are shared with JPMorgan Chase according to a fixed percentage and are settled monthly. Net revenuesinclude finance charge and late fee revenues, less write-offs of uncollectible accounts and other expenses.
The Credit Card Accountability Responsibility and Disclosure Act of 2009 (the “CARD Act”) mandatesfundamental changes to many of our current business practices, including marketing, underwriting, pricing andbilling. Most of the requirements became effective in February 2010 and others will become effective in August2010. Legislation has been proposed to accelerate the effective date of all of the CARD Act provisions effectiveas soon as the legislation is enacted, but prospects for enactment are uncertain. Although the Federal Reserve hasissued final rules implementing most of the provisions of the CARD Act, it has yet to issue rules implementingthe provisions that take effect in August 2010. Accordingly, it is difficult to assess the impact of those provisionsat this time. While we have already made, and anticipate making additional, changes designed to lessen theimpact of the changes required by the CARD Act, there is no assurance that we will be successful. If we are notable to lessen the impact of the changes required by the CARD Act, the changes could adversely impact theprofitability of our credit operations and make it more difficult to extend credit to our customers and collectpayments which would have a material adverse effect on our results of operations.
Changes in credit card use, payment patterns and default rates may also result from a variety of economic,legal, social and other factors that we cannot control or predict with certainty. Changes that adversely impact ourability to extend credit and collect payments could negatively affect our results.
Our current agreement with JPMorgan Chase expires in 2011. We are currently exploring variousalternatives to this agreement, including entering into a new agreement with an alternative partner and expect toreach a decision by Fall 2010. This timing could be impacted by the timing of the issuance of final CARD Actregulations. We may be unable to negotiate a new contract at comparable terms which could significantly reducethe net revenues which we currently earn under this program. Should we be unable to negotiate a new agreement,we may repurchase the receivables. We currently expect to use a combination of cash and cash equivalents onhand and new debt to finance such a repurchase. As of January 30, 2010, outstanding receivables totaledapproximately $3 billion. The outstanding receivable balance fluctuates during the year and typically reaches itshighest level during the holiday season and its lowest level during the first quarter of the year.
Weather conditions could adversely affect our sales and/or profitability by affecting consumer shoppingpatterns.
Because a significant portion of our business is apparel and subject to weather conditions in our markets,our operating results may be adversely affected by severe or unexpected weather conditions. Frequent orunusually heavy snow, ice or rain storms or extended periods of unseasonable temperatures in our markets couldadversely affect our performance by affecting consumer shopping patterns or diminishing demand for seasonalmerchandise.
9
Our business is seasonal, which could adversely affect the market price of our common stock.
Our business is subject to seasonal influences, with a major portion of sales and income historically realizedduring the second half of the fiscal year, which includes the back-to-school and holiday seasons. This seasonalitycauses our operating results to vary considerably from quarter to quarter and could materially adversely affect themarket price of our common stock.
We may be unable to source merchandise in a timely and cost-effective manner, which could adversely affectour sales and operating results.
Approximately 20% of the merchandise we sell is sourced through a third party purchasing agent. Theremaining merchandise is sourced from a wide variety of domestic and international vendors. All of our vendorsmust comply with applicable laws and our required Terms of Engagement. Our ability to find qualified vendorsand access products in a timely and efficient manner is a significant challenge which is typically even moredifficult with respect to goods sourced outside the United States. Political or financial instability, traderestrictions, tariffs, currency exchange rates, transport capacity and costs and other factors relating to foreigntrade, and the ability to access suitable merchandise on acceptable terms are beyond our control and couldadversely impact our performance.
If any of our vendors were to become subject to bankruptcy, receivership or similar proceedings, we may beunable to arrange for alternate or replacement contracts, transactions or business relationships on terms asfavorable as current terms, which could adversely affect our sales and operating results.
An inability to attract and retain quality employees could result in higher payroll costs and adversely affectour operating results.
Our performance is dependent on attracting and retaining a large and growing number of quality associates.Many of those associates are in entry level or part-time positions with historically high rates of turnover. Ourability to meet our labor needs while controlling costs is subject to external factors such as unemployment levels,prevailing wage rates, minimum wage legislation and changing demographics. Changes that adversely impact ourability to attract and retain quality associates could adversely affect our performance.
An inability to open new stores could adversely affect our financial performance.
Our plan to continue to increase the number of our stores will depend in part upon the availability ofexisting retail stores or store sites on acceptable terms. Increases in real estate, construction and developmentcosts could limit our growth opportunities and affect our return on investment. There can be no assurance thatsuch stores or sites will be available for purchase or lease, or that they will be available on acceptable terms. Ifwe are unable to grow our retail business, our financial performance could be adversely affected.
Regulatory and litigation developments could adversely affect our business operations and financialperformance.
Various aspects of our operations are subject to federal, state or local laws, rules and regulations, any ofwhich may change from time to time. We continually monitor the state and federal employment law environmentfor developments that may adversely impact us. Failure to detect changes and comply with such laws andregulations may result in an erosion of our reputation, disruption of business and/or loss of employee morale.Additionally, we are regularly involved in various litigation matters that arise in the ordinary course of ourbusiness. Litigation or regulatory developments could adversely affect our business operations and financialperformance.
Damage to the reputation of our private and exclusive brands could adversely affect our sales.
We develop and promote private and exclusive brands that have generated national recognition. In somecases, the brands or the marketing of such brands are tied to or affiliated with well-known individuals. Damage to
10
the reputations of our private and exclusive label brand names or any affiliated individuals, could arise fromproduct failures, litigation or various forms of adverse publicity and may generate negative customer sentiment,potentially resulting in a reduction in sales, earnings, and shareholder value.
Disruptions in our information systems could adversely affect our sales and profitability.
The efficient operation of our business is dependent on our information systems. In particular, we rely onour information systems to effectively manage sales, distribution, merchandise planning and allocation functions.We also generate sales though the operations of our Kohls.com website. The failure of our information systemsto perform as designed could disrupt our business and harm sales and profitability.
Unauthorized disclosure of sensitive or confidential customer information could severely damage ourreputation, expose us to risks of litigation and liability, disrupt our operations and harm our business.
As part of our normal course of business, we collect, process and retain sensitive and confidential customerinformation. Despite the security measures we have in place, our facilities and systems, and those of our thirdparty service providers, may be vulnerable to security breaches, acts of vandalism, computer viruses, misplacedor lost data, programming and/or human errors, or other similar events. Any security breach involving themisappropriation, loss or other unauthorized disclosure of confidential information, whether by us or ourvendors, could severely damage our reputation, expose us to risks of litigation and liability, disrupt ouroperations and harm our business.
New legal requirements could adversely affect our operating results.
Our sales and results of operations may be adversely affected by new legal requirements, includingproposed health care reform legislation and climate change and other environmental legislation and regulations.The costs and other effects of new legal requirements cannot be determined with certainty. For example, newlegislation or regulations may result in increased costs directly for our compliance or indirectly to the extent suchrequirements increase prices of goods and services because of increased compliance costs or reduced availabilityof raw materials. At this point, we are unable to determine the impact that healthcare reform could have on ouremployer-sponsored medical plans.
Item 1B. Unresolved Staff Comments
Not applicable
Item 2. Properties
Stores
As of January 30, 2010, we operated 1,058 stores in 49 states. Our typical, or “prototype,” store has 88,000gross square feet of retail space and serves trade areas of 150,000 to 200,000 people. Most “small” stores are68,000 square feet and serve trade areas of 100,000 to 150,000 people. Our “urban” stores, currently located inthe New York and Chicago markets, serve very densely populated areas of up to 500,000 people and averageapproximately 125,000 gross square feet of retail space.
Our typical lease has an initial term of 20-25 years and two to eight renewal options for consecutive five orten-year extension terms. Substantially all of our leases provide for a minimum annual rent that is fixed or adjuststo set levels during the lease term, including renewals. Approximately one-fourth of the leases provide foradditional rent based on a percentage of sales over designated levels.
11
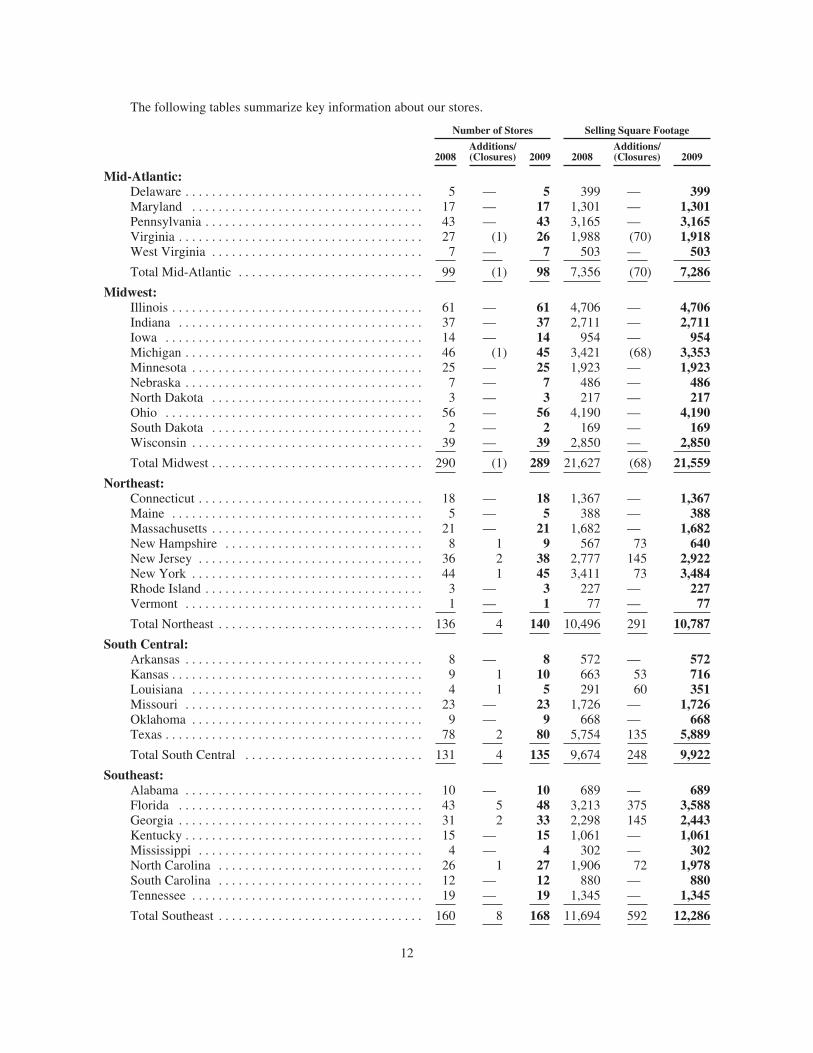
The following tables summarize key information about our stores.
Number of Stores Selling Square Footage
2008Additions/(Closures) 2009 2008
Additions/(Closures) 2009
Mid-Atlantic:Delaware . . . . . . . . . . . . . . . . . . . . . . . . . . . . . . . . . . . . 5 — 5 399 — 399Maryland . . . . . . . . . . . . . . . . . . . . . . . . . . . . . . . . . . . 17 — 17 1,301 — 1,301Pennsylvania . . . . . . . . . . . . . . . . . . . . . . . . . . . . . . . . . 43 — 43 3,165 — 3,165Virginia . . . . . . . . . . . . . . . . . . . . . . . . . . . . . . . . . . . . . 27 (1) 26 1,988 (70) 1,918West Virginia . . . . . . . . . . . . . . . . . . . . . . . . . . . . . . . . 7 — 7 503 — 503
Total Mid-Atlantic . . . . . . . . . . . . . . . . . . . . . . . . . . . . 99 (1) 98 7,356 (70) 7,286
Midwest:Illinois . . . . . . . . . . . . . . . . . . . . . . . . . . . . . . . . . . . . . . 61 — 61 4,706 — 4,706Indiana . . . . . . . . . . . . . . . . . . . . . . . . . . . . . . . . . . . . . 37 — 37 2,711 — 2,711Iowa . . . . . . . . . . . . . . . . . . . . . . . . . . . . . . . . . . . . . . . 14 — 14 954 — 954Michigan . . . . . . . . . . . . . . . . . . . . . . . . . . . . . . . . . . . . 46 (1) 45 3,421 (68) 3,353Minnesota . . . . . . . . . . . . . . . . . . . . . . . . . . . . . . . . . . . 25 — 25 1,923 — 1,923Nebraska . . . . . . . . . . . . . . . . . . . . . . . . . . . . . . . . . . . . 7 — 7 486 — 486North Dakota . . . . . . . . . . . . . . . . . . . . . . . . . . . . . . . . 3 — 3 217 — 217Ohio . . . . . . . . . . . . . . . . . . . . . . . . . . . . . . . . . . . . . . . 56 — 56 4,190 — 4,190South Dakota . . . . . . . . . . . . . . . . . . . . . . . . . . . . . . . . 2 — 2 169 — 169Wisconsin . . . . . . . . . . . . . . . . . . . . . . . . . . . . . . . . . . . 39 — 39 2,850 — 2,850
Total Midwest . . . . . . . . . . . . . . . . . . . . . . . . . . . . . . . . 290 (1) 289 21,627 (68) 21,559
Northeast:Connecticut . . . . . . . . . . . . . . . . . . . . . . . . . . . . . . . . . . 18 — 18 1,367 — 1,367Maine . . . . . . . . . . . . . . . . . . . . . . . . . . . . . . . . . . . . . . 5 — 5 388 — 388Massachusetts . . . . . . . . . . . . . . . . . . . . . . . . . . . . . . . . 21 — 21 1,682 — 1,682New Hampshire . . . . . . . . . . . . . . . . . . . . . . . . . . . . . . 8 1 9 567 73 640New Jersey . . . . . . . . . . . . . . . . . . . . . . . . . . . . . . . . . . 36 2 38 2,777 145 2,922New York . . . . . . . . . . . . . . . . . . . . . . . . . . . . . . . . . . . 44 1 45 3,411 73 3,484Rhode Island . . . . . . . . . . . . . . . . . . . . . . . . . . . . . . . . . 3 — 3 227 — 227Vermont . . . . . . . . . . . . . . . . . . . . . . . . . . . . . . . . . . . . 1 — 1 77 — 77
Total Northeast . . . . . . . . . . . . . . . . . . . . . . . . . . . . . . . 136 4 140 10,496 291 10,787
South Central:Arkansas . . . . . . . . . . . . . . . . . . . . . . . . . . . . . . . . . . . . 8 — 8 572 — 572Kansas . . . . . . . . . . . . . . . . . . . . . . . . . . . . . . . . . . . . . . 9 1 10 663 53 716Louisiana . . . . . . . . . . . . . . . . . . . . . . . . . . . . . . . . . . . 4 1 5 291 60 351Missouri . . . . . . . . . . . . . . . . . . . . . . . . . . . . . . . . . . . . 23 — 23 1,726 — 1,726Oklahoma . . . . . . . . . . . . . . . . . . . . . . . . . . . . . . . . . . . 9 — 9 668 — 668Texas . . . . . . . . . . . . . . . . . . . . . . . . . . . . . . . . . . . . . . . 78 2 80 5,754 135 5,889
Total South Central . . . . . . . . . . . . . . . . . . . . . . . . . . . 131 4 135 9,674 248 9,922
Southeast:Alabama . . . . . . . . . . . . . . . . . . . . . . . . . . . . . . . . . . . . 10 — 10 689 — 689Florida . . . . . . . . . . . . . . . . . . . . . . . . . . . . . . . . . . . . . 43 5 48 3,213 375 3,588Georgia . . . . . . . . . . . . . . . . . . . . . . . . . . . . . . . . . . . . . 31 2 33 2,298 145 2,443Kentucky . . . . . . . . . . . . . . . . . . . . . . . . . . . . . . . . . . . . 15 — 15 1,061 — 1,061Mississippi . . . . . . . . . . . . . . . . . . . . . . . . . . . . . . . . . . 4 — 4 302 — 302North Carolina . . . . . . . . . . . . . . . . . . . . . . . . . . . . . . . 26 1 27 1,906 72 1,978South Carolina . . . . . . . . . . . . . . . . . . . . . . . . . . . . . . . 12 — 12 880 — 880Tennessee . . . . . . . . . . . . . . . . . . . . . . . . . . . . . . . . . . . 19 — 19 1,345 — 1,345
Total Southeast . . . . . . . . . . . . . . . . . . . . . . . . . . . . . . . 160 8 168 11,694 592 12,286
12
Number of Stores Selling Square Footage
2008Additions/(Closures) 2009 2008
Additions/(Closures) 2009
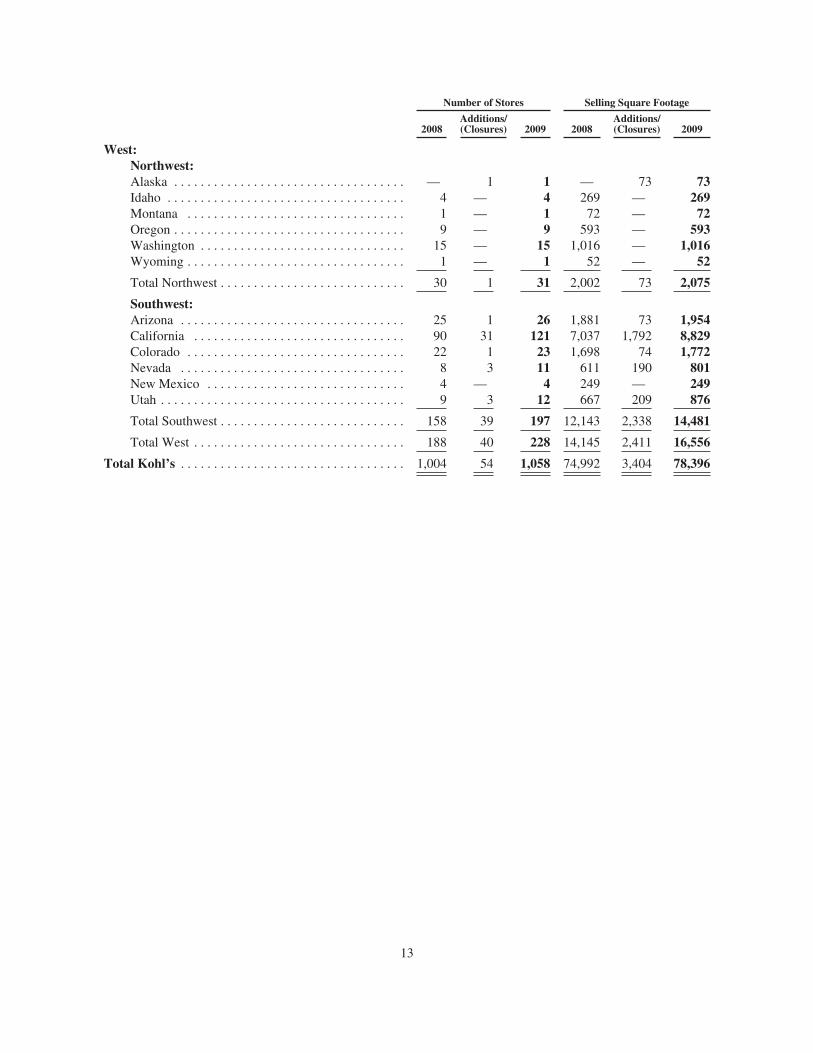
West:Northwest:Alaska . . . . . . . . . . . . . . . . . . . . . . . . . . . . . . . . . . . — 1 1 — 73 73Idaho . . . . . . . . . . . . . . . . . . . . . . . . . . . . . . . . . . . . 4 — 4 269 — 269Montana . . . . . . . . . . . . . . . . . . . . . . . . . . . . . . . . . 1 — 1 72 — 72Oregon . . . . . . . . . . . . . . . . . . . . . . . . . . . . . . . . . . . 9 — 9 593 — 593Washington . . . . . . . . . . . . . . . . . . . . . . . . . . . . . . . 15 — 15 1,016 — 1,016Wyoming . . . . . . . . . . . . . . . . . . . . . . . . . . . . . . . . . 1 — 1 52 — 52
Total Northwest . . . . . . . . . . . . . . . . . . . . . . . . . . . . 30 1 31 2,002 73 2,075
Southwest:Arizona . . . . . . . . . . . . . . . . . . . . . . . . . . . . . . . . . . 25 1 26 1,881 73 1,954California . . . . . . . . . . . . . . . . . . . . . . . . . . . . . . . . 90 31 121 7,037 1,792 8,829Colorado . . . . . . . . . . . . . . . . . . . . . . . . . . . . . . . . . 22 1 23 1,698 74 1,772Nevada . . . . . . . . . . . . . . . . . . . . . . . . . . . . . . . . . . 8 3 11 611 190 801New Mexico . . . . . . . . . . . . . . . . . . . . . . . . . . . . . . 4 — 4 249 — 249Utah . . . . . . . . . . . . . . . . . . . . . . . . . . . . . . . . . . . . . 9 3 12 667 209 876
Total Southwest . . . . . . . . . . . . . . . . . . . . . . . . . . . . 158 39 197 12,143 2,338 14,481
Total West . . . . . . . . . . . . . . . . . . . . . . . . . . . . . . . . 188 40 228 14,145 2,411 16,556
Total Kohl’s . . . . . . . . . . . . . . . . . . . . . . . . . . . . . . . . . . 1,004 54 1,058 74,992 3,404 78,396
13
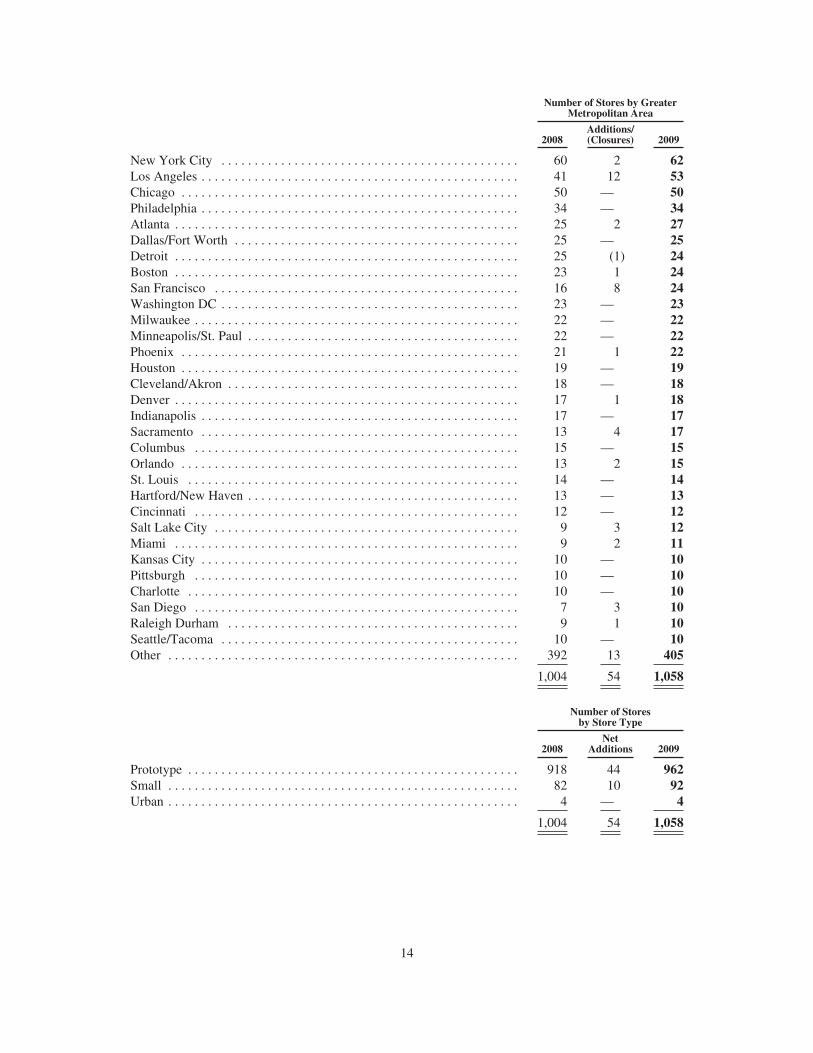
Number of Stores by GreaterMetropolitan Area
2008Additions/(Closures) 2009
New York City . . . . . . . . . . . . . . . . . . . . . . . . . . . . . . . . . . . . . . . . . . . . . 60 2 62Los Angeles . . . . . . . . . . . . . . . . . . . . . . . . . . . . . . . . . . . . . . . . . . . . . . . . 41 12 53Chicago . . . . . . . . . . . . . . . . . . . . . . . . . . . . . . . . . . . . . . . . . . . . . . . . . . . 50 — 50Philadelphia . . . . . . . . . . . . . . . . . . . . . . . . . . . . . . . . . . . . . . . . . . . . . . . . 34 — 34Atlanta . . . . . . . . . . . . . . . . . . . . . . . . . . . . . . . . . . . . . . . . . . . . . . . . . . . . 25 2 27Dallas/Fort Worth . . . . . . . . . . . . . . . . . . . . . . . . . . . . . . . . . . . . . . . . . . . 25 — 25Detroit . . . . . . . . . . . . . . . . . . . . . . . . . . . . . . . . . . . . . . . . . . . . . . . . . . . . 25 (1) 24Boston . . . . . . . . . . . . . . . . . . . . . . . . . . . . . . . . . . . . . . . . . . . . . . . . . . . . 23 1 24San Francisco . . . . . . . . . . . . . . . . . . . . . . . . . . . . . . . . . . . . . . . . . . . . . . 16 8 24Washington DC . . . . . . . . . . . . . . . . . . . . . . . . . . . . . . . . . . . . . . . . . . . . . 23 — 23Milwaukee . . . . . . . . . . . . . . . . . . . . . . . . . . . . . . . . . . . . . . . . . . . . . . . . . 22 — 22Minneapolis/St. Paul . . . . . . . . . . . . . . . . . . . . . . . . . . . . . . . . . . . . . . . . . 22 — 22Phoenix . . . . . . . . . . . . . . . . . . . . . . . . . . . . . . . . . . . . . . . . . . . . . . . . . . . 21 1 22Houston . . . . . . . . . . . . . . . . . . . . . . . . . . . . . . . . . . . . . . . . . . . . . . . . . . . 19 — 19Cleveland/Akron . . . . . . . . . . . . . . . . . . . . . . . . . . . . . . . . . . . . . . . . . . . . 18 — 18Denver . . . . . . . . . . . . . . . . . . . . . . . . . . . . . . . . . . . . . . . . . . . . . . . . . . . . 17 1 18Indianapolis . . . . . . . . . . . . . . . . . . . . . . . . . . . . . . . . . . . . . . . . . . . . . . . . 17 — 17Sacramento . . . . . . . . . . . . . . . . . . . . . . . . . . . . . . . . . . . . . . . . . . . . . . . . 13 4 17Columbus . . . . . . . . . . . . . . . . . . . . . . . . . . . . . . . . . . . . . . . . . . . . . . . . . 15 — 15Orlando . . . . . . . . . . . . . . . . . . . . . . . . . . . . . . . . . . . . . . . . . . . . . . . . . . . 13 2 15St. Louis . . . . . . . . . . . . . . . . . . . . . . . . . . . . . . . . . . . . . . . . . . . . . . . . . . 14 — 14Hartford/New Haven . . . . . . . . . . . . . . . . . . . . . . . . . . . . . . . . . . . . . . . . . 13 — 13Cincinnati . . . . . . . . . . . . . . . . . . . . . . . . . . . . . . . . . . . . . . . . . . . . . . . . . 12 — 12Salt Lake City . . . . . . . . . . . . . . . . . . . . . . . . . . . . . . . . . . . . . . . . . . . . . . 9 3 12Miami . . . . . . . . . . . . . . . . . . . . . . . . . . . . . . . . . . . . . . . . . . . . . . . . . . . . 9 2 11Kansas City . . . . . . . . . . . . . . . . . . . . . . . . . . . . . . . . . . . . . . . . . . . . . . . . 10 — 10Pittsburgh . . . . . . . . . . . . . . . . . . . . . . . . . . . . . . . . . . . . . . . . . . . . . . . . . 10 — 10Charlotte . . . . . . . . . . . . . . . . . . . . . . . . . . . . . . . . . . . . . . . . . . . . . . . . . . 10 — 10San Diego . . . . . . . . . . . . . . . . . . . . . . . . . . . . . . . . . . . . . . . . . . . . . . . . . 7 3 10Raleigh Durham . . . . . . . . . . . . . . . . . . . . . . . . . . . . . . . . . . . . . . . . . . . . 9 1 10Seattle/Tacoma . . . . . . . . . . . . . . . . . . . . . . . . . . . . . . . . . . . . . . . . . . . . . 10 — 10Other . . . . . . . . . . . . . . . . . . . . . . . . . . . . . . . . . . . . . . . . . . . . . . . . . . . . . 392 13 405
1,004 54 1,058
Number of Storesby Store Type
2008Net
Additions 2009
Prototype . . . . . . . . . . . . . . . . . . . . . . . . . . . . . . . . . . . . . . . . . . . . . . . . . . 918 44 962Small . . . . . . . . . . . . . . . . . . . . . . . . . . . . . . . . . . . . . . . . . . . . . . . . . . . . . 82 10 92Urban . . . . . . . . . . . . . . . . . . . . . . . . . . . . . . . . . . . . . . . . . . . . . . . . . . . . . 4 — 4
1,004 54 1,058
14
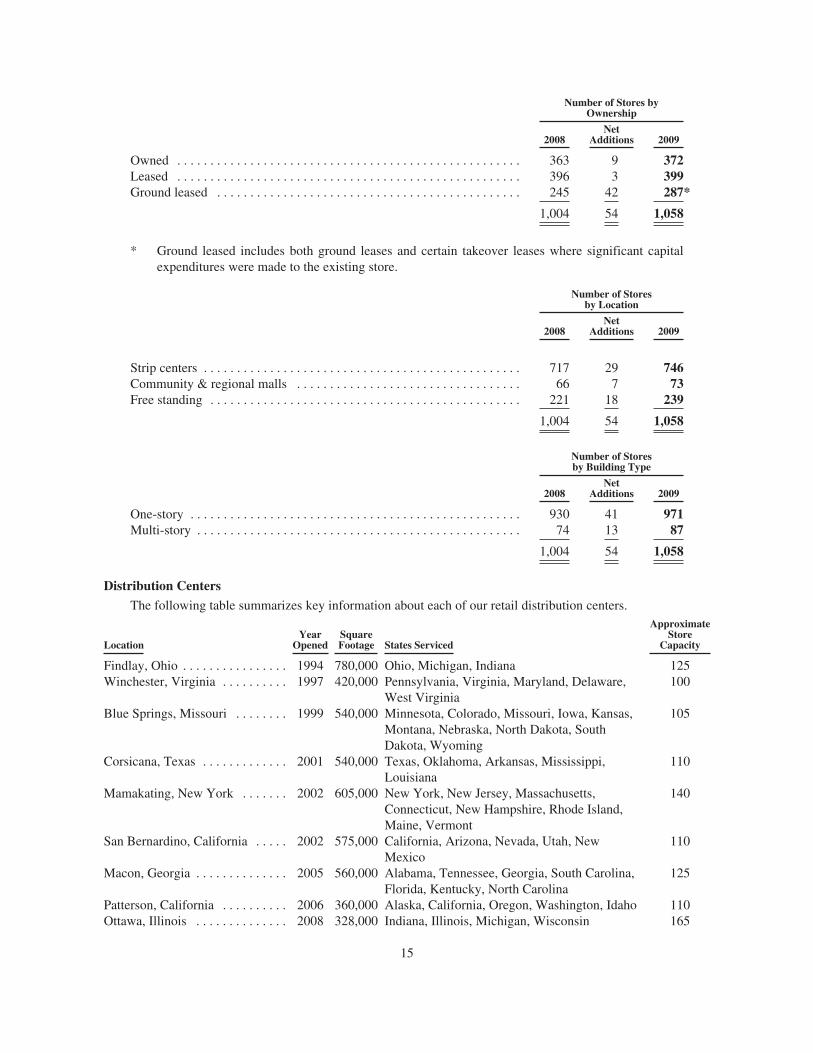
Number of Stores byOwnership
2008Net
Additions 2009
Owned . . . . . . . . . . . . . . . . . . . . . . . . . . . . . . . . . . . . . . . . . . . . . . . . . . . . 363 9 372Leased . . . . . . . . . . . . . . . . . . . . . . . . . . . . . . . . . . . . . . . . . . . . . . . . . . . . 396 3 399Ground leased . . . . . . . . . . . . . . . . . . . . . . . . . . . . . . . . . . . . . . . . . . . . . . 245 42 287*
1,004 54 1,058
* Ground leased includes both ground leases and certain takeover leases where significant capitalexpenditures were made to the existing store.
Number of Storesby Location
2008Net
Additions 2009
Strip centers . . . . . . . . . . . . . . . . . . . . . . . . . . . . . . . . . . . . . . . . . . . . . . . . 717 29 746Community & regional malls . . . . . . . . . . . . . . . . . . . . . . . . . . . . . . . . . . 66 7 73Free standing . . . . . . . . . . . . . . . . . . . . . . . . . . . . . . . . . . . . . . . . . . . . . . . 221 18 239
1,004 54 1,058
Number of Storesby Building Type
2008Net
Additions 2009
One-story . . . . . . . . . . . . . . . . . . . . . . . . . . . . . . . . . . . . . . . . . . . . . . . . . . 930 41 971Multi-story . . . . . . . . . . . . . . . . . . . . . . . . . . . . . . . . . . . . . . . . . . . . . . . . . 74 13 87
1,004 54 1,058
Distribution Centers
The following table summarizes key information about each of our retail distribution centers.
LocationYear
OpenedSquareFootage States Serviced
ApproximateStore
Capacity
Findlay, Ohio . . . . . . . . . . . . . . . . 1994 780,000 Ohio, Michigan, Indiana 125Winchester, Virginia . . . . . . . . . . 1997 420,000 Pennsylvania, Virginia, Maryland, Delaware,
West Virginia100
Blue Springs, Missouri . . . . . . . . 1999 540,000 Minnesota, Colorado, Missouri, Iowa, Kansas,Montana, Nebraska, North Dakota, SouthDakota, Wyoming
105
Corsicana, Texas . . . . . . . . . . . . . 2001 540,000 Texas, Oklahoma, Arkansas, Mississippi,Louisiana
110
Mamakating, New York . . . . . . . 2002 605,000 New York, New Jersey, Massachusetts,Connecticut, New Hampshire, Rhode Island,Maine, Vermont
140
San Bernardino, California . . . . . 2002 575,000 California, Arizona, Nevada, Utah, NewMexico
110
Macon, Georgia . . . . . . . . . . . . . . 2005 560,000 Alabama, Tennessee, Georgia, South Carolina,Florida, Kentucky, North Carolina
125
Patterson, California . . . . . . . . . . 2006 360,000 Alaska, California, Oregon, Washington, Idaho 110Ottawa, Illinois . . . . . . . . . . . . . . 2008 328,000 Indiana, Illinois, Michigan, Wisconsin 165
15
We own all of the retail distribution centers except Corsicana, Texas, which is leased. We also own ourcorporate headquarters in Menomonee Falls, Wisconsin and a 940,000 square foot e-commerce fulfillment centerin Monroe, Ohio. Additionally, we plan to open a 970,000 square foot e-commerce fulfillment center in SanBernardino, California in June 2010 to provide increased capacity to support our growing e-commerce business.
During the fourth quarter of 2009, we closed our Menomonee Falls, Wisconsin distribution center, theoldest and least efficient distribution center in our network. Stores previously supplied by this distribution centerwill be serviced by one of our nine remaining distribution centers, primarily the Ottawa, Illinois distributioncenter.
Item 3. Legal Proceedings
We are not currently a party to any material legal proceedings, but are subject to certain legal proceedingsand claims from time to time that are incidental to our ordinary course of business.
Item 4. Reserved
16
PART II
Item 5. Market for Registrant’s Common Equity, Related Stockholder Matters and Issuer Purchases ofEquity Securities
(a) Market information
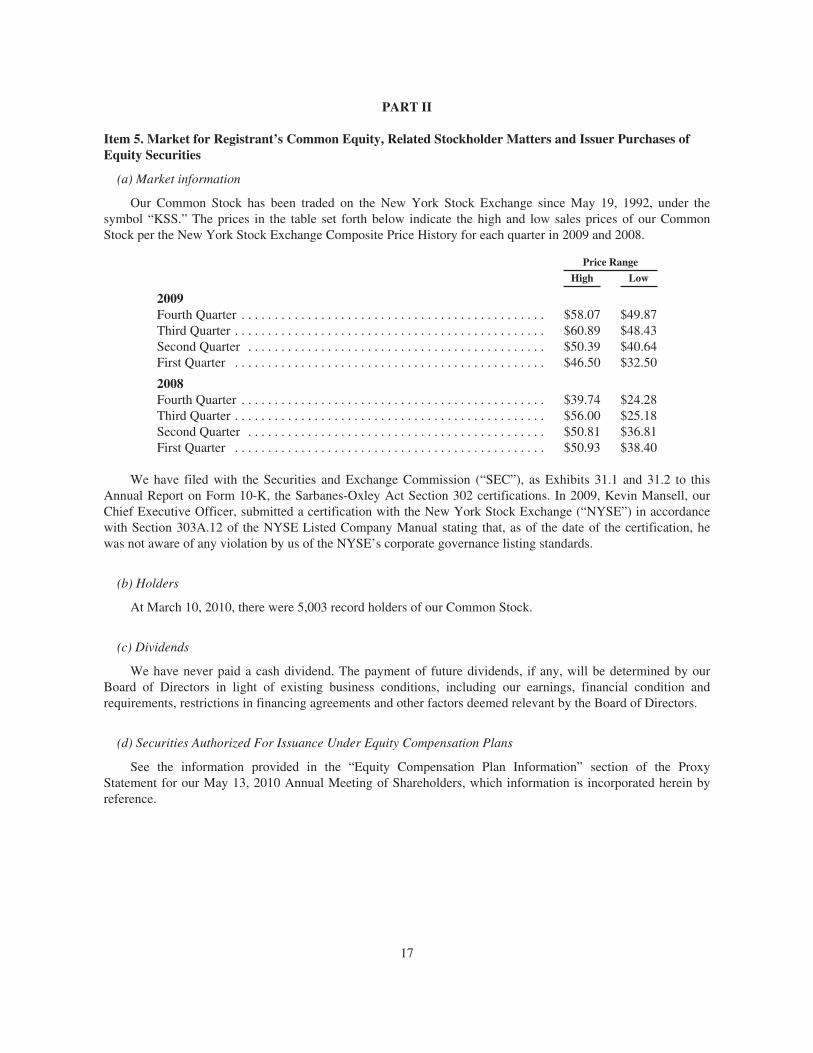
Our Common Stock has been traded on the New York Stock Exchange since May 19, 1992, under thesymbol “KSS.” The prices in the table set forth below indicate the high and low sales prices of our CommonStock per the New York Stock Exchange Composite Price History for each quarter in 2009 and 2008.
Price Range
High Low
2009Fourth Quarter . . . . . . . . . . . . . . . . . . . . . . . . . . . . . . . . . . . . . . . . . . . . . . $58.07 $49.87Third Quarter . . . . . . . . . . . . . . . . . . . . . . . . . . . . . . . . . . . . . . . . . . . . . . . $60.89 $48.43Second Quarter . . . . . . . . . . . . . . . . . . . . . . . . . . . . . . . . . . . . . . . . . . . . . $50.39 $40.64First Quarter . . . . . . . . . . . . . . . . . . . . . . . . . . . . . . . . . . . . . . . . . . . . . . . $46.50 $32.50
2008Fourth Quarter . . . . . . . . . . . . . . . . . . . . . . . . . . . . . . . . . . . . . . . . . . . . . . $39.74 $24.28Third Quarter . . . . . . . . . . . . . . . . . . . . . . . . . . . . . . . . . . . . . . . . . . . . . . . $56.00 $25.18Second Quarter . . . . . . . . . . . . . . . . . . . . . . . . . . . . . . . . . . . . . . . . . . . . . $50.81 $36.81First Quarter . . . . . . . . . . . . . . . . . . . . . . . . . . . . . . . . . . . . . . . . . . . . . . . $50.93 $38.40
We have filed with the Securities and Exchange Commission (“SEC”), as Exhibits 31.1 and 31.2 to thisAnnual Report on Form 10-K, the Sarbanes-Oxley Act Section 302 certifications. In 2009, Kevin Mansell, ourChief Executive Officer, submitted a certification with the New York Stock Exchange (“NYSE”) in accordancewith Section 303A.12 of the NYSE Listed Company Manual stating that, as of the date of the certification, hewas not aware of any violation by us of the NYSE’s corporate governance listing standards.
(b) Holders
At March 10, 2010, there were 5,003 record holders of our Common Stock.
(c) Dividends
We have never paid a cash dividend. The payment of future dividends, if any, will be determined by ourBoard of Directors in light of existing business conditions, including our earnings, financial condition andrequirements, restrictions in financing agreements and other factors deemed relevant by the Board of Directors.
(d) Securities Authorized For Issuance Under Equity Compensation Plans
See the information provided in the “Equity Compensation Plan Information” section of the ProxyStatement for our May 13, 2010 Annual Meeting of Shareholders, which information is incorporated herein byreference.
17
(e) Performance Graph
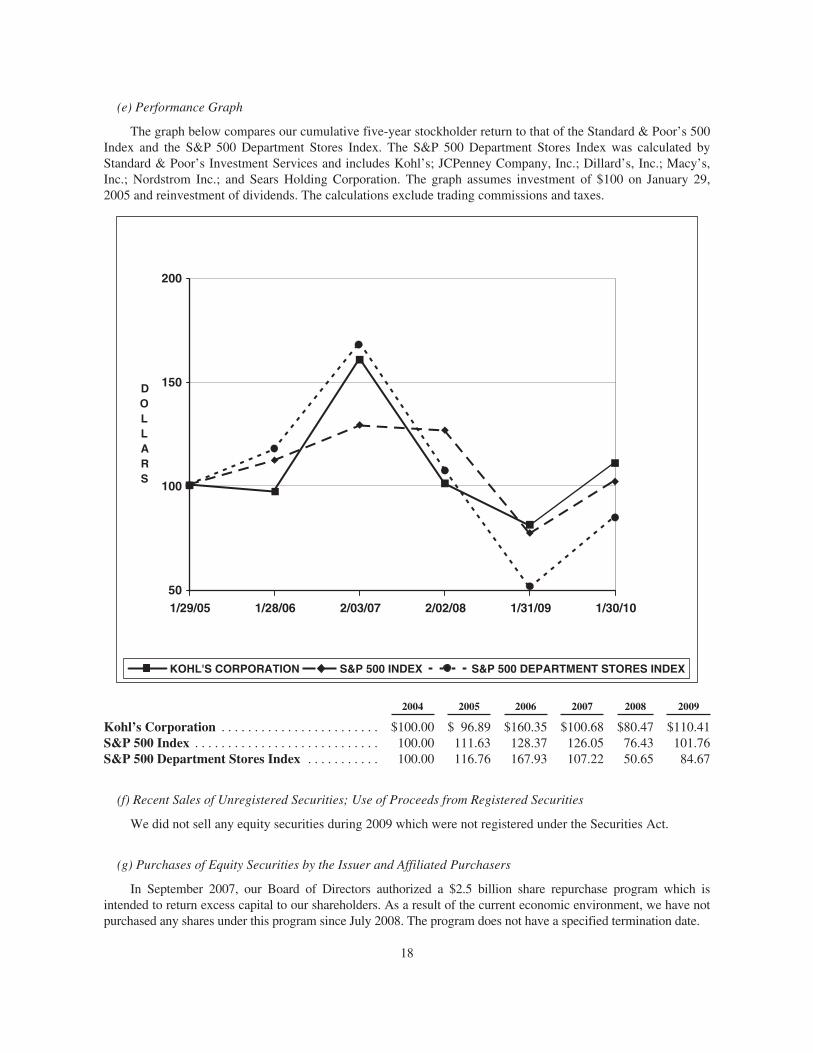
The graph below compares our cumulative five-year stockholder return to that of the Standard & Poor’s 500Index and the S&P 500 Department Stores Index. The S&P 500 Department Stores Index was calculated byStandard & Poor’s Investment Services and includes Kohl’s; JCPenney Company, Inc.; Dillard’s, Inc.; Macy’s,Inc.; Nordstrom Inc.; and Sears Holding Corporation. The graph assumes investment of $100 on January 29,2005 and reinvestment of dividends. The calculations exclude trading commissions and taxes.
50
100
150
200
1/29/05 1/28/06 2/03/07 2/02/08 1/30/101/31/09
DOLLARS
KOHL'S CORPORATION S&P 500 INDEX S&P 500 DEPARTMENT STORES INDEX
2004 2005 2006 2007 2008 2009
Kohl’s Corporation . . . . . . . . . . . . . . . . . . . . . . . . $100.00 $ 96.89 $160.35 $100.68 $80.47 $110.41S&P 500 Index . . . . . . . . . . . . . . . . . . . . . . . . . . . . 100.00 111.63 128.37 126.05 76.43 101.76S&P 500 Department Stores Index . . . . . . . . . . . 100.00 116.76 167.93 107.22 50.65 84.67
(f) Recent Sales of Unregistered Securities; Use of Proceeds from Registered Securities
We did not sell any equity securities during 2009 which were not registered under the Securities Act.
(g) Purchases of Equity Securities by the Issuer and Affiliated Purchasers
In September 2007, our Board of Directors authorized a $2.5 billion share repurchase program which isintended to return excess capital to our shareholders. As a result of the current economic environment, we have notpurchased any shares under this program since July 2008. The program does not have a specified termination date.
18
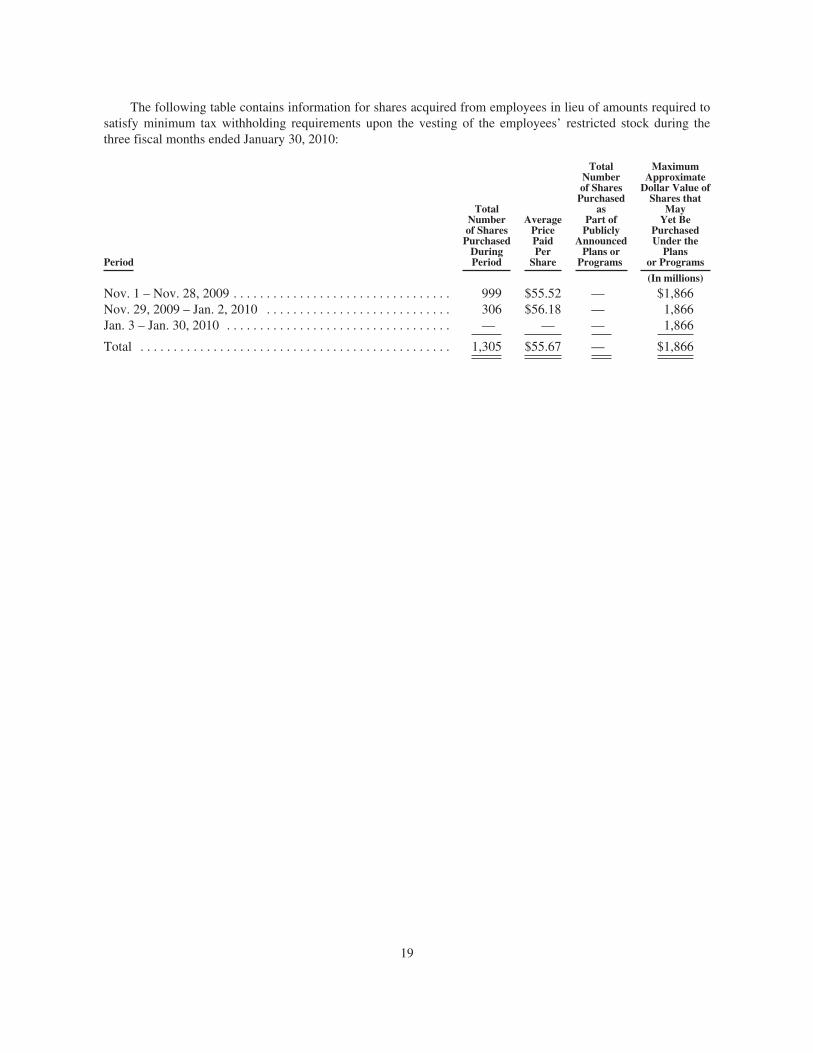
The following table contains information for shares acquired from employees in lieu of amounts required tosatisfy minimum tax withholding requirements upon the vesting of the employees’ restricted stock during thethree fiscal months ended January 30, 2010:
Period
TotalNumberof Shares
PurchasedDuringPeriod
AveragePricePaidPer
Share
TotalNumberof Shares
Purchasedas
Part ofPublicly
AnnouncedPlans or
Programs
MaximumApproximate
Dollar Value ofShares that
MayYet Be
PurchasedUnder the
Plansor Programs
(In millions)
Nov. 1 – Nov. 28, 2009 . . . . . . . . . . . . . . . . . . . . . . . . . . . . . . . . . 999 $55.52 — $1,866Nov. 29, 2009 – Jan. 2, 2010 . . . . . . . . . . . . . . . . . . . . . . . . . . . . 306 $56.18 — 1,866Jan. 3 – Jan. 30, 2010 . . . . . . . . . . . . . . . . . . . . . . . . . . . . . . . . . . — — — 1,866
Total . . . . . . . . . . . . . . . . . . . . . . . . . . . . . . . . . . . . . . . . . . . . . . . 1,305 $55.67 — $1,866
19
Item 6. Selected Consolidated Financial Data
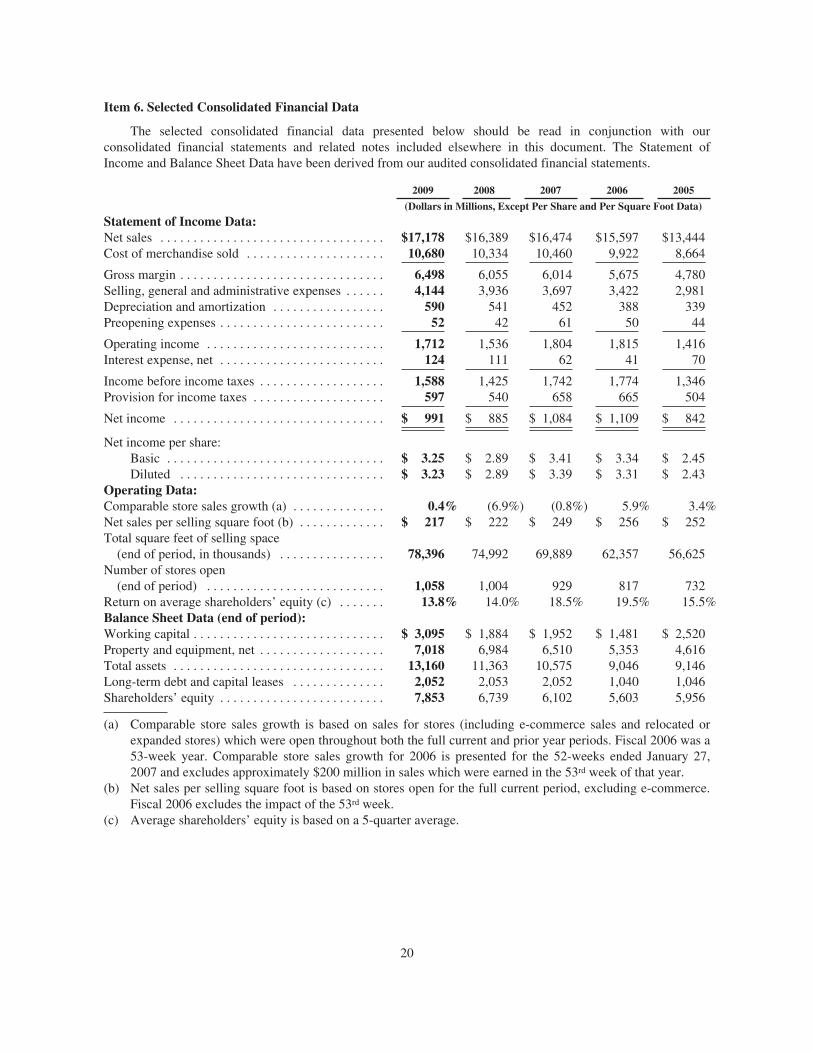
The selected consolidated financial data presented below should be read in conjunction with ourconsolidated financial statements and related notes included elsewhere in this document. The Statement ofIncome and Balance Sheet Data have been derived from our audited consolidated financial statements.
2009 2008 2007 2006 2005
(Dollars in Millions, Except Per Share and Per Square Foot Data)
Statement of Income Data:Net sales . . . . . . . . . . . . . . . . . . . . . . . . . . . . . . . . . . $17,178 $16,389 $16,474 $15,597 $13,444Cost of merchandise sold . . . . . . . . . . . . . . . . . . . . . 10,680 10,334 10,460 9,922 8,664
Gross margin . . . . . . . . . . . . . . . . . . . . . . . . . . . . . . . 6,498 6,055 6,014 5,675 4,780Selling, general and administrative expenses . . . . . . 4,144 3,936 3,697 3,422 2,981Depreciation and amortization . . . . . . . . . . . . . . . . . 590 541 452 388 339Preopening expenses . . . . . . . . . . . . . . . . . . . . . . . . . 52 42 61 50 44
Operating income . . . . . . . . . . . . . . . . . . . . . . . . . . . 1,712 1,536 1,804 1,815 1,416Interest expense, net . . . . . . . . . . . . . . . . . . . . . . . . . 124 111 62 41 70
Income before income taxes . . . . . . . . . . . . . . . . . . . 1,588 1,425 1,742 1,774 1,346Provision for income taxes . . . . . . . . . . . . . . . . . . . . 597 540 658 665 504
Net income . . . . . . . . . . . . . . . . . . . . . . . . . . . . . . . . $ 991 $ 885 $ 1,084 $ 1,109 $ 842
Net income per share:Basic . . . . . . . . . . . . . . . . . . . . . . . . . . . . . . . . . $ 3.25 $ 2.89 $ 3.41 $ 3.34 $ 2.45Diluted . . . . . . . . . . . . . . . . . . . . . . . . . . . . . . . $ 3.23 $ 2.89 $ 3.39 $ 3.31 $ 2.43
Operating Data:Comparable store sales growth (a) . . . . . . . . . . . . . . 0.4% (6.9%) (0.8%) 5.9% 3.4%Net sales per selling square foot (b) . . . . . . . . . . . . . $ 217 $ 222 $ 249 $ 256 $ 252Total square feet of selling space
(end of period, in thousands) . . . . . . . . . . . . . . . . 78,396 74,992 69,889 62,357 56,625Number of stores open
(end of period) . . . . . . . . . . . . . . . . . . . . . . . . . . . 1,058 1,004 929 817 732Return on average shareholders’ equity (c) . . . . . . . 13.8% 14.0% 18.5% 19.5% 15.5%Balance Sheet Data (end of period):Working capital . . . . . . . . . . . . . . . . . . . . . . . . . . . . . $ 3,095 $ 1,884 $ 1,952 $ 1,481 $ 2,520Property and equipment, net . . . . . . . . . . . . . . . . . . . 7,018 6,984 6,510 5,353 4,616Total assets . . . . . . . . . . . . . . . . . . . . . . . . . . . . . . . . 13,160 11,363 10,575 9,046 9,146Long-term debt and capital leases . . . . . . . . . . . . . . 2,052 2,053 2,052 1,040 1,046Shareholders’ equity . . . . . . . . . . . . . . . . . . . . . . . . . 7,853 6,739 6,102 5,603 5,956
(a) Comparable store sales growth is based on sales for stores (including e-commerce sales and relocated orexpanded stores) which were open throughout both the full current and prior year periods. Fiscal 2006 was a53-week year. Comparable store sales growth for 2006 is presented for the 52-weeks ended January 27,2007 and excludes approximately $200 million in sales which were earned in the 53rd week of that year.
(b) Net sales per selling square foot is based on stores open for the full current period, excluding e-commerce.Fiscal 2006 excludes the impact of the 53rd week.
(c) Average shareholders’ equity is based on a 5-quarter average.
20
Item 7. Management’s Discussion and Analysis of Financial Condition and Results of Operations
Executive Summary
The current economic slowdown has caused disruptions and significant volatility in financial markets,increased rates of mortgage loan default and personal bankruptcy, and declining consumer and businessconfidence, which has led to decreased levels of consumer spending, particularly on discretionary items. Thoughwe have seen some improvement throughout 2009, as evidenced by increases in our comparable store sales, webelieve that our core customer continues to face economic challenges which will result in a very competitive2010.
Total net sales for 2009 were $17.2 billion, a 4.8% increase from 2008. Comparable store sales increased0.4% over 2008. The Southwest region and the Accessories business reported the strongest comparable storesales growth.
Gross margin as a percent of net sales for the year increased approximately 88 basis points over the 2008rate to 37.8%. Strong inventory management as well as increased penetration of private and exclusive brandscontributed to the margin strength. Ending inventory per store (in dollars) decreased 0.9% compared to 2008.
Selling, general and administrative expenses (“SG&A”) increased approximately 5% compared to the prioryear. SG&A as a percentage of net sales, increased, or “deleveraged” primarily due to increased incentivecompensation and changes made to our non-management compensation structure. SG&A expenses for the yearincreased at a rate faster than sales, but at a rate slower than new store growth of 5.5%. Our cost controlinitiatives are focused on sustainable productivity improvements, not one-time cutting of expenses. While wewill continue to look for ways to become more efficient, we intend to keep the customer experience in our storesa priority in order to provide consistency across our stores and intend to continue to invest more in store payrollto improve our customer service.
Net income increased approximately 12% for 2009 to $991 million, or $3.23 per diluted share, compared to$885 million, or $2.89 per diluted share for 2008.
We ended the year with 1,058 stores in 49 states, including 56 which were successfully opened in 2009. Wecompleted 51 store remodels, compared to 36 stores last year. In fiscal 2010, we expect to open approximately 30stores and remodel 85 stores. Remodels remain a critical part of our long-term strategy as we believe it isextremely important to maintain our existing store base, even in this difficult economic environment.
Our current expectations for fiscal 2010 assume that consumer spending will continue to be weakthroughout 2010. We expect comparable store sales will be driven by increased market share as we expectaverage transaction value to remain under pressure. Our current expectations for both the first quarter and fiscal2010 compared to comparable fiscal 2009 periods are as follows:
• Total sales increase of 4% to 6%
• Comparable store sales increase of 1% to 3%
• Gross margin increase of 20 to 30 basis points
• SG&A dollars to increase 4% to 5%
• Earnings per diluted share of $0.48 to $0.52 for the first quarter of 2010 and $3.40 to $3.63 for fiscal2010.
Results of Operations
Our fiscal year ends on the Saturday closest to January 31. Unless otherwise noted, references to years inthis report relate to fiscal years, rather than to calendar years. Fiscal year 2009 (“2009”) ended on January 30,2010, fiscal year 2008 (“2008”) ended on January 31, 2009 and fiscal year 2007 (“2007”) ended on February 2,2008. All three years were 52-week years.
21
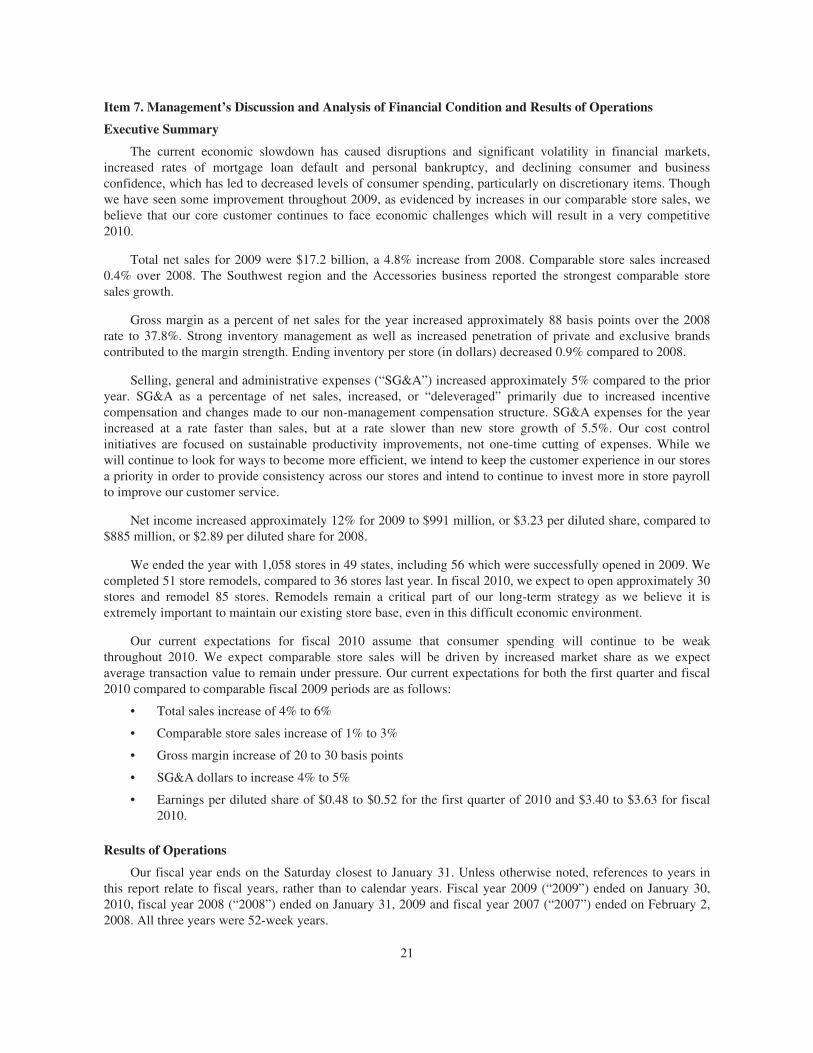
Net sales.
2009 2008 2007
Net sales (in millions) . . . . . . . . . . . . . . . . . . . . . . . . . . . . . . . . . . . . $17,178 $16,389 $16,474Number of stores:
Open at end of period . . . . . . . . . . . . . . . . . . . . . . . . . . . . . . . . . 1,058 1,004 929Comparable stores (a) . . . . . . . . . . . . . . . . . . . . . . . . . . . . . . . . . 929 817 732
Sales growth:All stores . . . . . . . . . . . . . . . . . . . . . . . . . . . . . . . . . . . . . . . . . . 4.8% (0.5%) 5.6%Comparable stores (a) . . . . . . . . . . . . . . . . . . . . . . . . . . . . . . . . . 0.4% (6.9%) (0.8%)
Net sales per selling square foot (b) . . . . . . . . . . . . . . . . . . . . . . . . . . $ 217 $ 222 $ 249
(a) Comparable store sales growth is based on sales for stores (including e-commerce sales and relocated orexpanded stores) which were open throughout both the full current and prior year periods.
(b) Net sales per selling square foot is based on stores open for the full current period, excluding e-commerce.
Net sales for 2009 increased $789 million, or 4.8%, over 2008. New stores contributed $719 million to theincrease in net sales over the prior year. Comparable store sales increased $70 million. We opened 56 new storesin 2009, 75 stores in 2008 and 112 stores in 2007. As we open new stores, especially in existing markets, salesmay be transferred from existing stores. We estimate that opening new stores in existing markets negativelyimpacted comparable store sales by approximately 1% in 2009.
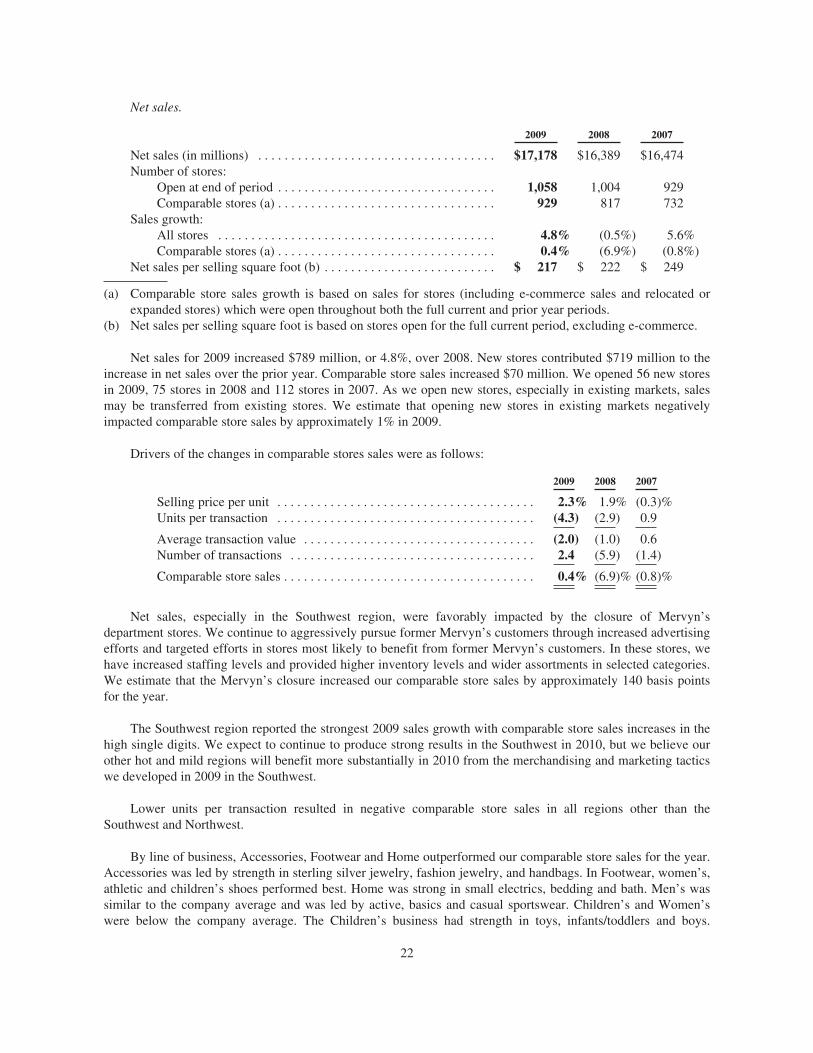
Drivers of the changes in comparable stores sales were as follows:
2009 2008 2007
Selling price per unit . . . . . . . . . . . . . . . . . . . . . . . . . . . . . . . . . . . . . . . 2.3% 1.9% (0.3)%Units per transaction . . . . . . . . . . . . . . . . . . . . . . . . . . . . . . . . . . . . . . . (4.3) (2.9) 0.9
Average transaction value . . . . . . . . . . . . . . . . . . . . . . . . . . . . . . . . . . . (2.0) (1.0) 0.6Number of transactions . . . . . . . . . . . . . . . . . . . . . . . . . . . . . . . . . . . . . 2.4 (5.9) (1.4)
Comparable store sales . . . . . . . . . . . . . . . . . . . . . . . . . . . . . . . . . . . . . . 0.4% (6.9)% (0.8)%
Net sales, especially in the Southwest region, were favorably impacted by the closure of Mervyn’sdepartment stores. We continue to aggressively pursue former Mervyn’s customers through increased advertisingefforts and targeted efforts in stores most likely to benefit from former Mervyn’s customers. In these stores, wehave increased staffing levels and provided higher inventory levels and wider assortments in selected categories.We estimate that the Mervyn’s closure increased our comparable store sales by approximately 140 basis pointsfor the year.
The Southwest region reported the strongest 2009 sales growth with comparable store sales increases in thehigh single digits. We expect to continue to produce strong results in the Southwest in 2010, but we believe ourother hot and mild regions will benefit more substantially in 2010 from the merchandising and marketing tacticswe developed in 2009 in the Southwest.
Lower units per transaction resulted in negative comparable store sales in all regions other than theSouthwest and Northwest.
By line of business, Accessories, Footwear and Home outperformed our comparable store sales for the year.Accessories was led by strength in sterling silver jewelry, fashion jewelry, and handbags. In Footwear, women’s,athletic and children’s shoes performed best. Home was strong in small electrics, bedding and bath. Men’s wassimilar to the company average and was led by active, basics and casual sportswear. Children’s and Women’swere below the company average. The Children’s business had strength in toys, infants/toddlers and boys.
22
Women’s was strongest in intimate and both classic and updated sportswear, driven by substantial improvementin key private brands such as Sonoma, Croft and Barrow and Apt 9 which achieved strong fourth quarterincreases.
E-commerce revenues increased 38.0% to $492 million for 2009. The sales growth is primarily the result ofincreased style and size selections offered on-line compared with our in-store selection as well as the expansionof product categories not available in our stores.
Net sales per selling square foot decreased 2% to $217 in 2009. The decrease is primarily due to theunderperformance of stores opened in 2008.
Net sales for 2008 decreased $85 million, or 0.5%, from 2007. New stores contributed $1.0 billion to theincrease in net sales over the prior year. Comparable store sales decreased $1.1 billion, or 6.9% (see the tableabove for drivers of the change). From a line of business perspective, Accessories reported the strongestcomparable store sales in 2008 with strength in sterling silver jewelry and accessories/handbags. Children’s,Men’s and Footwear outperformed the comparable store sales for the year, while Women’s and Home trailed thecompany. The Northeast, Midwest and Mid-Atlantic regions reported the strongest comparable store sales for2008. E-commerce revenues increased 48% to $356 million for 2008 as we continued to expand the selectionsoffered on-line.
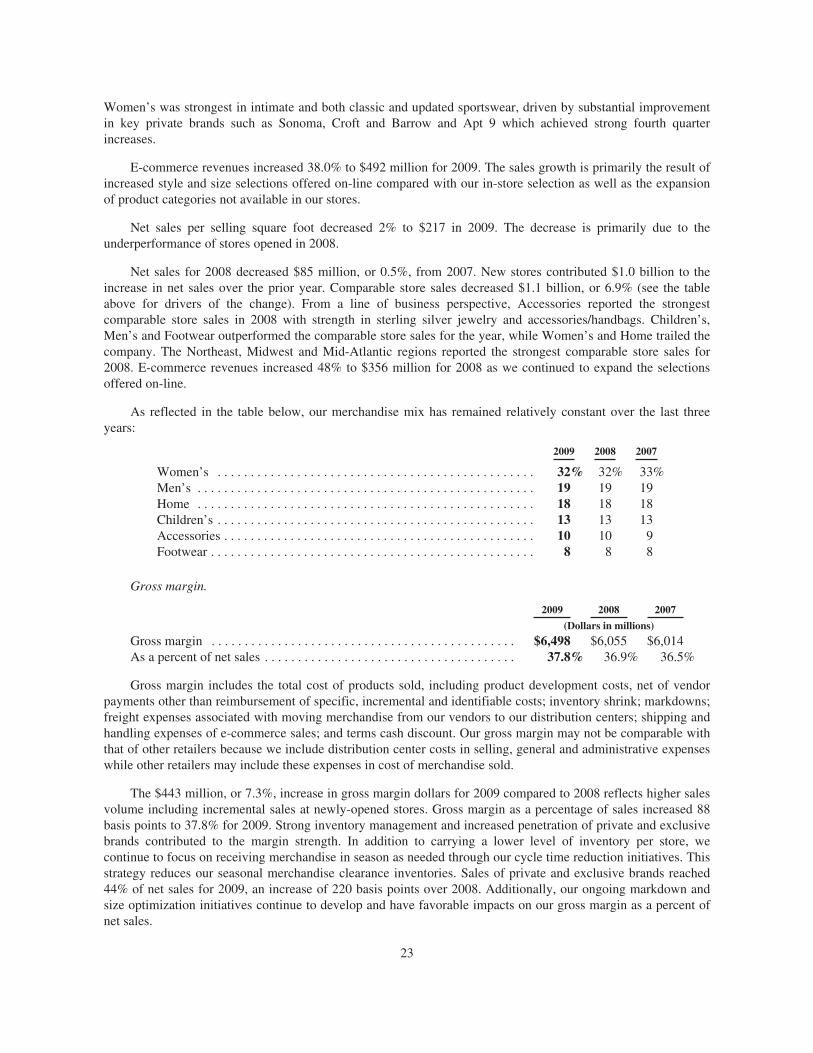
As reflected in the table below, our merchandise mix has remained relatively constant over the last threeyears:
2009 2008 2007
Women’s . . . . . . . . . . . . . . . . . . . . . . . . . . . . . . . . . . . . . . . . . . . . . . . . 32% 32% 33%Men’s . . . . . . . . . . . . . . . . . . . . . . . . . . . . . . . . . . . . . . . . . . . . . . . . . . . 19 19 19Home . . . . . . . . . . . . . . . . . . . . . . . . . . . . . . . . . . . . . . . . . . . . . . . . . . . 18 18 18Children’s . . . . . . . . . . . . . . . . . . . . . . . . . . . . . . . . . . . . . . . . . . . . . . . . 13 13 13Accessories . . . . . . . . . . . . . . . . . . . . . . . . . . . . . . . . . . . . . . . . . . . . . . . 10 10 9Footwear . . . . . . . . . . . . . . . . . . . . . . . . . . . . . . . . . . . . . . . . . . . . . . . . . 8 8 8
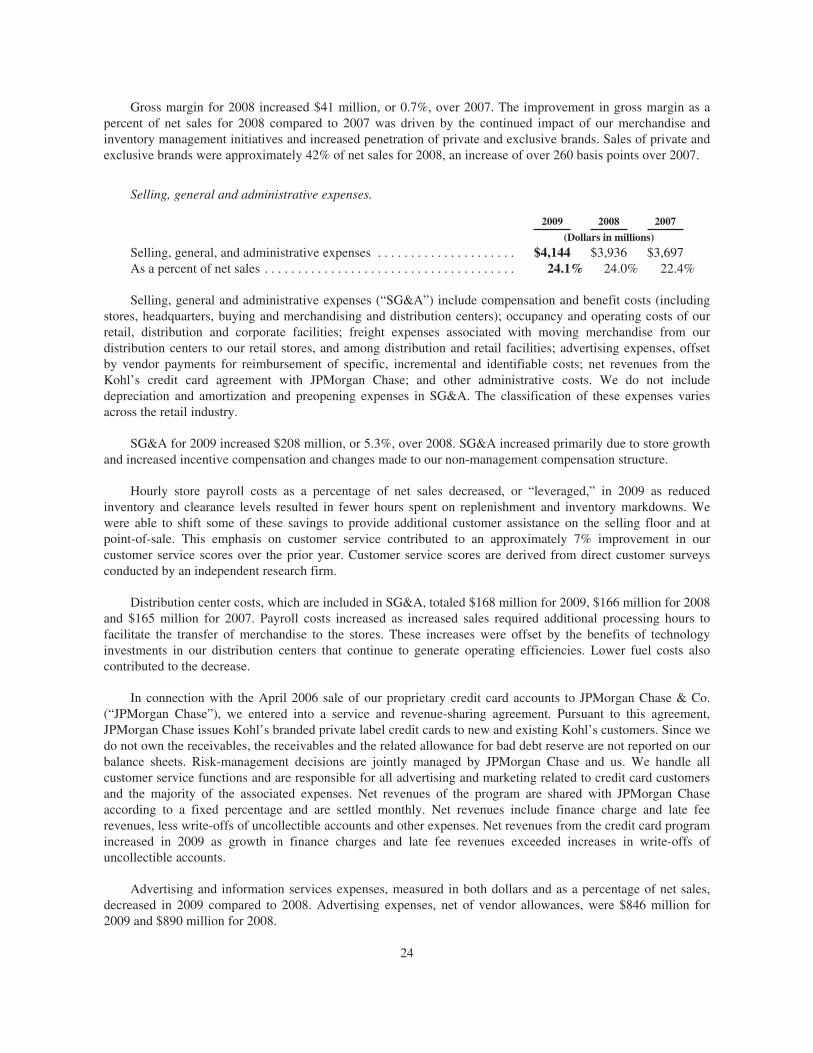
Gross margin.
2009 2008 2007
(Dollars in millions)
Gross margin . . . . . . . . . . . . . . . . . . . . . . . . . . . . . . . . . . . . . . . . . . . . . . $6,498 $6,055 $6,014As a percent of net sales . . . . . . . . . . . . . . . . . . . . . . . . . . . . . . . . . . . . . . 37.8% 36.9% 36.5%
Gross margin includes the total cost of products sold, including product development costs, net of vendorpayments other than reimbursement of specific, incremental and identifiable costs; inventory shrink; markdowns;freight expenses associated with moving merchandise from our vendors to our distribution centers; shipping andhandling expenses of e-commerce sales; and terms cash discount. Our gross margin may not be comparable withthat of other retailers because we include distribution center costs in selling, general and administrative expenseswhile other retailers may include these expenses in cost of merchandise sold.
The $443 million, or 7.3%, increase in gross margin dollars for 2009 compared to 2008 reflects higher salesvolume including incremental sales at newly-opened stores. Gross margin as a percentage of sales increased 88basis points to 37.8% for 2009. Strong inventory management and increased penetration of private and exclusivebrands contributed to the margin strength. In addition to carrying a lower level of inventory per store, wecontinue to focus on receiving merchandise in season as needed through our cycle time reduction initiatives. Thisstrategy reduces our seasonal merchandise clearance inventories. Sales of private and exclusive brands reached44% of net sales for 2009, an increase of 220 basis points over 2008. Additionally, our ongoing markdown andsize optimization initiatives continue to develop and have favorable impacts on our gross margin as a percent ofnet sales.
23
Gross margin for 2008 increased $41 million, or 0.7%, over 2007. The improvement in gross margin as apercent of net sales for 2008 compared to 2007 was driven by the continued impact of our merchandise andinventory management initiatives and increased penetration of private and exclusive brands. Sales of private andexclusive brands were approximately 42% of net sales for 2008, an increase of over 260 basis points over 2007.
Selling, general and administrative expenses.
2009 2008 2007
(Dollars in millions)
Selling, general, and administrative expenses . . . . . . . . . . . . . . . . . . . . . $4,144 $3,936 $3,697As a percent of net sales . . . . . . . . . . . . . . . . . . . . . . . . . . . . . . . . . . . . . . 24.1% 24.0% 22.4%
Selling, general and administrative expenses (“SG&A”) include compensation and benefit costs (includingstores, headquarters, buying and merchandising and distribution centers); occupancy and operating costs of ourretail, distribution and corporate facilities; freight expenses associated with moving merchandise from ourdistribution centers to our retail stores, and among distribution and retail facilities; advertising expenses, offsetby vendor payments for reimbursement of specific, incremental and identifiable costs; net revenues from theKohl’s credit card agreement with JPMorgan Chase; and other administrative costs. We do not includedepreciation and amortization and preopening expenses in SG&A. The classification of these expenses variesacross the retail industry.
SG&A for 2009 increased $208 million, or 5.3%, over 2008. SG&A increased primarily due to store growthand increased incentive compensation and changes made to our non-management compensation structure.
Hourly store payroll costs as a percentage of net sales decreased, or “leveraged,” in 2009 as reducedinventory and clearance levels resulted in fewer hours spent on replenishment and inventory markdowns. Wewere able to shift some of these savings to provide additional customer assistance on the selling floor and atpoint-of-sale. This emphasis on customer service contributed to an approximately 7% improvement in ourcustomer service scores over the prior year. Customer service scores are derived from direct customer surveysconducted by an independent research firm.
Distribution center costs, which are included in SG&A, totaled $168 million for 2009, $166 million for 2008and $165 million for 2007. Payroll costs increased as increased sales required additional processing hours tofacilitate the transfer of merchandise to the stores. These increases were offset by the benefits of technologyinvestments in our distribution centers that continue to generate operating efficiencies. Lower fuel costs alsocontributed to the decrease.
In connection with the April 2006 sale of our proprietary credit card accounts to JPMorgan Chase & Co.(“JPMorgan Chase”), we entered into a service and revenue-sharing agreement. Pursuant to this agreement,JPMorgan Chase issues Kohl’s branded private label credit cards to new and existing Kohl’s customers. Since wedo not own the receivables, the receivables and the related allowance for bad debt reserve are not reported on ourbalance sheets. Risk-management decisions are jointly managed by JPMorgan Chase and us. We handle allcustomer service functions and are responsible for all advertising and marketing related to credit card customersand the majority of the associated expenses. Net revenues of the program are shared with JPMorgan Chaseaccording to a fixed percentage and are settled monthly. Net revenues include finance charge and late feerevenues, less write-offs of uncollectible accounts and other expenses. Net revenues from the credit card programincreased in 2009 as growth in finance charges and late fee revenues exceeded increases in write-offs ofuncollectible accounts.
Advertising and information services expenses, measured in both dollars and as a percentage of net sales,decreased in 2009 compared to 2008. Advertising expenses, net of vendor allowances, were $846 million for2009 and $890 million for 2008.
24
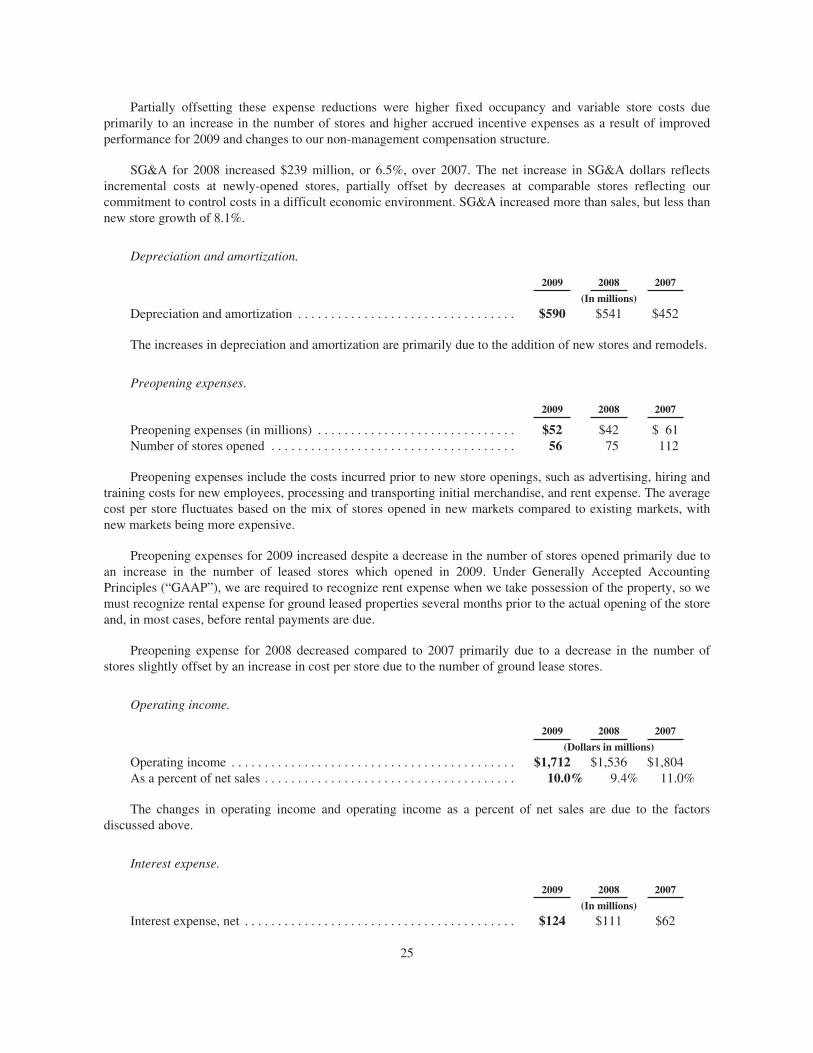
Partially offsetting these expense reductions were higher fixed occupancy and variable store costs dueprimarily to an increase in the number of stores and higher accrued incentive expenses as a result of improvedperformance for 2009 and changes to our non-management compensation structure.
SG&A for 2008 increased $239 million, or 6.5%, over 2007. The net increase in SG&A dollars reflectsincremental costs at newly-opened stores, partially offset by decreases at comparable stores reflecting ourcommitment to control costs in a difficult economic environment. SG&A increased more than sales, but less thannew store growth of 8.1%.
Depreciation and amortization.
2009 2008 2007
(In millions)
Depreciation and amortization . . . . . . . . . . . . . . . . . . . . . . . . . . . . . . . . . $590 $541 $452
The increases in depreciation and amortization are primarily due to the addition of new stores and remodels.
Preopening expenses.
2009 2008 2007
Preopening expenses (in millions) . . . . . . . . . . . . . . . . . . . . . . . . . . . . . . $52 $42 $ 61Number of stores opened . . . . . . . . . . . . . . . . . . . . . . . . . . . . . . . . . . . . . 56 75 112
Preopening expenses include the costs incurred prior to new store openings, such as advertising, hiring andtraining costs for new employees, processing and transporting initial merchandise, and rent expense. The averagecost per store fluctuates based on the mix of stores opened in new markets compared to existing markets, withnew markets being more expensive.
Preopening expenses for 2009 increased despite a decrease in the number of stores opened primarily due toan increase in the number of leased stores which opened in 2009. Under Generally Accepted AccountingPrinciples (“GAAP”), we are required to recognize rent expense when we take possession of the property, so wemust recognize rental expense for ground leased properties several months prior to the actual opening of the storeand, in most cases, before rental payments are due.
Preopening expense for 2008 decreased compared to 2007 primarily due to a decrease in the number ofstores slightly offset by an increase in cost per store due to the number of ground lease stores.
Operating income.
2009 2008 2007
(Dollars in millions)
Operating income . . . . . . . . . . . . . . . . . . . . . . . . . . . . . . . . . . . . . . . . . . . $1,712 $1,536 $1,804As a percent of net sales . . . . . . . . . . . . . . . . . . . . . . . . . . . . . . . . . . . . . . 10.0% 9.4% 11.0%
The changes in operating income and operating income as a percent of net sales are due to the factorsdiscussed above.
Interest expense.
2009 2008 2007
(In millions)
Interest expense, net . . . . . . . . . . . . . . . . . . . . . . . . . . . . . . . . . . . . . . . . . $124 $111 $62
25
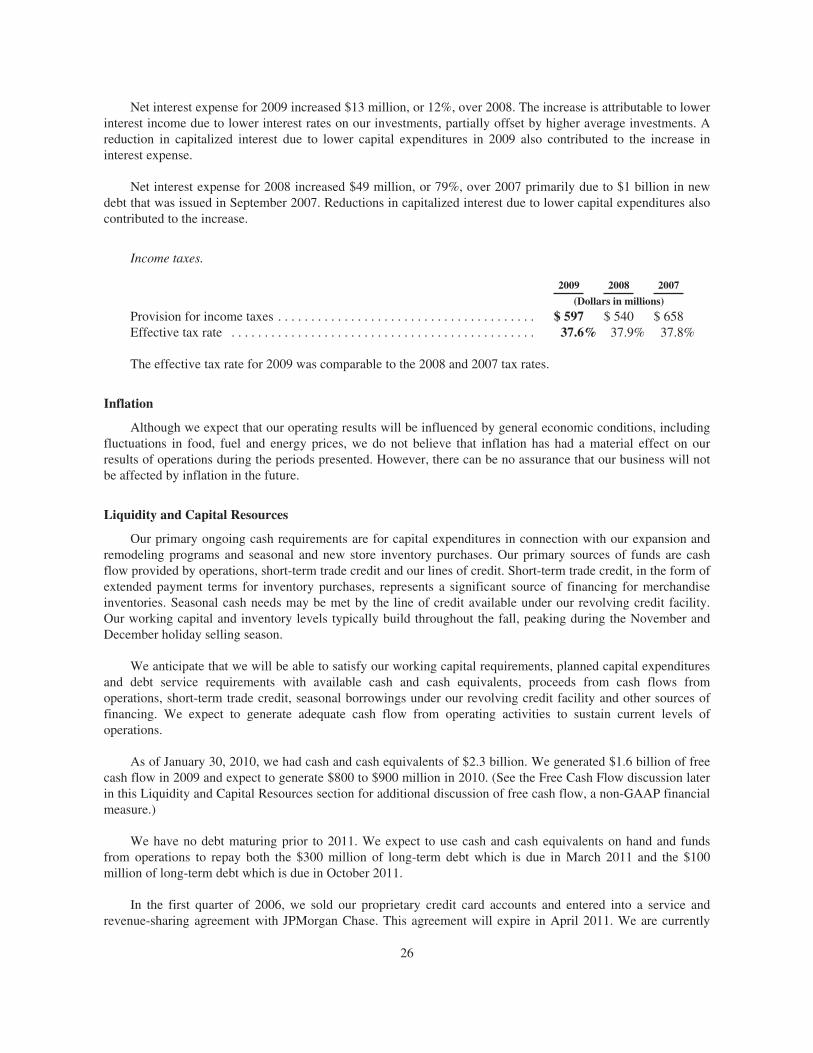
Net interest expense for 2009 increased $13 million, or 12%, over 2008. The increase is attributable to lowerinterest income due to lower interest rates on our investments, partially offset by higher average investments. Areduction in capitalized interest due to lower capital expenditures in 2009 also contributed to the increase ininterest expense.
Net interest expense for 2008 increased $49 million, or 79%, over 2007 primarily due to $1 billion in newdebt that was issued in September 2007. Reductions in capitalized interest due to lower capital expenditures alsocontributed to the increase.
Income taxes.
2009 2008 2007
(Dollars in millions)
Provision for income taxes . . . . . . . . . . . . . . . . . . . . . . . . . . . . . . . . . . . . . . . $ 597 $ 540 $ 658Effective tax rate . . . . . . . . . . . . . . . . . . . . . . . . . . . . . . . . . . . . . . . . . . . . . . 37.6% 37.9% 37.8%
The effective tax rate for 2009 was comparable to the 2008 and 2007 tax rates.
Inflation
Although we expect that our operating results will be influenced by general economic conditions, includingfluctuations in food, fuel and energy prices, we do not believe that inflation has had a material effect on ourresults of operations during the periods presented. However, there can be no assurance that our business will notbe affected by inflation in the future.
Liquidity and Capital Resources
Our primary ongoing cash requirements are for capital expenditures in connection with our expansion andremodeling programs and seasonal and new store inventory purchases. Our primary sources of funds are cashflow provided by operations, short-term trade credit and our lines of credit. Short-term trade credit, in the form ofextended payment terms for inventory purchases, represents a significant source of financing for merchandiseinventories. Seasonal cash needs may be met by the line of credit available under our revolving credit facility.Our working capital and inventory levels typically build throughout the fall, peaking during the November andDecember holiday selling season.
We anticipate that we will be able to satisfy our working capital requirements, planned capital expendituresand debt service requirements with available cash and cash equivalents, proceeds from cash flows fromoperations, short-term trade credit, seasonal borrowings under our revolving credit facility and other sources offinancing. We expect to generate adequate cash flow from operating activities to sustain current levels ofoperations.
As of January 30, 2010, we had cash and cash equivalents of $2.3 billion. We generated $1.6 billion of freecash flow in 2009 and expect to generate $800 to $900 million in 2010. (See the Free Cash Flow discussion laterin this Liquidity and Capital Resources section for additional discussion of free cash flow, a non-GAAP financialmeasure.)
We have no debt maturing prior to 2011. We expect to use cash and cash equivalents on hand and fundsfrom operations to repay both the $300 million of long-term debt which is due in March 2011 and the $100million of long-term debt which is due in October 2011.
In the first quarter of 2006, we sold our proprietary credit card accounts and entered into a service andrevenue-sharing agreement with JPMorgan Chase. This agreement will expire in April 2011. We are currently
26
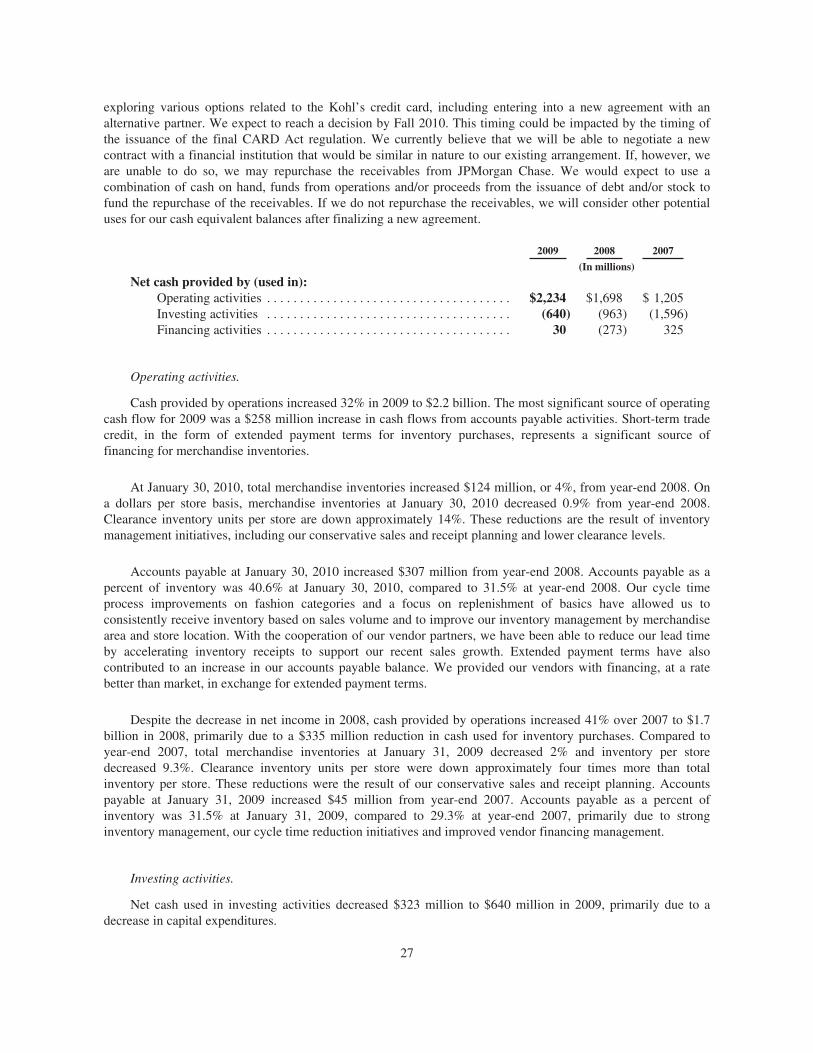
exploring various options related to the Kohl’s credit card, including entering into a new agreement with analternative partner. We expect to reach a decision by Fall 2010. This timing could be impacted by the timing ofthe issuance of the final CARD Act regulation. We currently believe that we will be able to negotiate a newcontract with a financial institution that would be similar in nature to our existing arrangement. If, however, weare unable to do so, we may repurchase the receivables from JPMorgan Chase. We would expect to use acombination of cash on hand, funds from operations and/or proceeds from the issuance of debt and/or stock tofund the repurchase of the receivables. If we do not repurchase the receivables, we will consider other potentialuses for our cash equivalent balances after finalizing a new agreement.
2009 2008 2007
(In millions)
Net cash provided by (used in):Operating activities . . . . . . . . . . . . . . . . . . . . . . . . . . . . . . . . . . . . . $2,234 $1,698 $ 1,205Investing activities . . . . . . . . . . . . . . . . . . . . . . . . . . . . . . . . . . . . . (640) (963) (1,596)Financing activities . . . . . . . . . . . . . . . . . . . . . . . . . . . . . . . . . . . . . 30 (273) 325
Operating activities.
Cash provided by operations increased 32% in 2009 to $2.2 billion. The most significant source of operatingcash flow for 2009 was a $258 million increase in cash flows from accounts payable activities. Short-term tradecredit, in the form of extended payment terms for inventory purchases, represents a significant source offinancing for merchandise inventories.
At January 30, 2010, total merchandise inventories increased $124 million, or 4%, from year-end 2008. Ona dollars per store basis, merchandise inventories at January 30, 2010 decreased 0.9% from year-end 2008.Clearance inventory units per store are down approximately 14%. These reductions are the result of inventorymanagement initiatives, including our conservative sales and receipt planning and lower clearance levels.
Accounts payable at January 30, 2010 increased $307 million from year-end 2008. Accounts payable as apercent of inventory was 40.6% at January 30, 2010, compared to 31.5% at year-end 2008. Our cycle timeprocess improvements on fashion categories and a focus on replenishment of basics have allowed us toconsistently receive inventory based on sales volume and to improve our inventory management by merchandisearea and store location. With the cooperation of our vendor partners, we have been able to reduce our lead timeby accelerating inventory receipts to support our recent sales growth. Extended payment terms have alsocontributed to an increase in our accounts payable balance. We provided our vendors with financing, at a ratebetter than market, in exchange for extended payment terms.
Despite the decrease in net income in 2008, cash provided by operations increased 41% over 2007 to $1.7billion in 2008, primarily due to a $335 million reduction in cash used for inventory purchases. Compared toyear-end 2007, total merchandise inventories at January 31, 2009 decreased 2% and inventory per storedecreased 9.3%. Clearance inventory units per store were down approximately four times more than totalinventory per store. These reductions were the result of our conservative sales and receipt planning. Accountspayable at January 31, 2009 increased $45 million from year-end 2007. Accounts payable as a percent ofinventory was 31.5% at January 31, 2009, compared to 29.3% at year-end 2007, primarily due to stronginventory management, our cycle time reduction initiatives and improved vendor financing management.
Investing activities.
Net cash used in investing activities decreased $323 million to $640 million in 2009, primarily due to adecrease in capital expenditures.
27
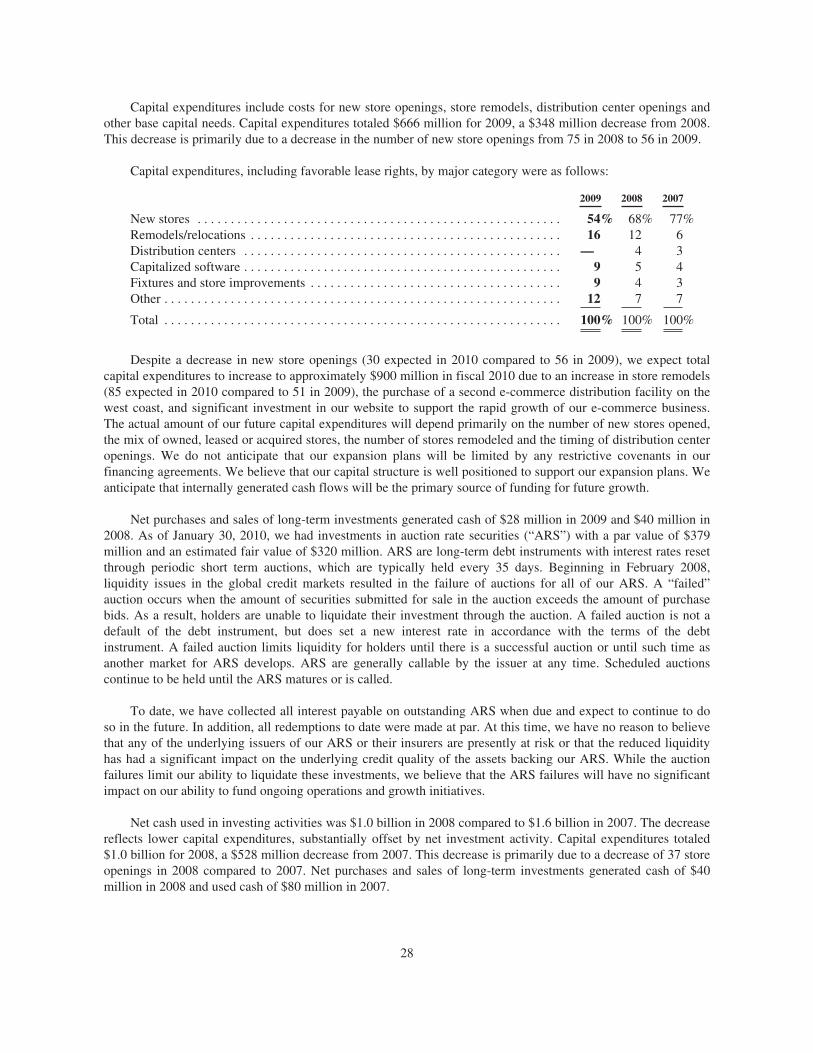
Capital expenditures include costs for new store openings, store remodels, distribution center openings andother base capital needs. Capital expenditures totaled $666 million for 2009, a $348 million decrease from 2008.This decrease is primarily due to a decrease in the number of new store openings from 75 in 2008 to 56 in 2009.
Capital expenditures, including favorable lease rights, by major category were as follows:
2009 2008 2007
New stores . . . . . . . . . . . . . . . . . . . . . . . . . . . . . . . . . . . . . . . . . . . . . . . . . . . . . . . 54% 68% 77%Remodels/relocations . . . . . . . . . . . . . . . . . . . . . . . . . . . . . . . . . . . . . . . . . . . . . . . 16 12 6Distribution centers . . . . . . . . . . . . . . . . . . . . . . . . . . . . . . . . . . . . . . . . . . . . . . . . — 4 3Capitalized software . . . . . . . . . . . . . . . . . . . . . . . . . . . . . . . . . . . . . . . . . . . . . . . . 9 5 4Fixtures and store improvements . . . . . . . . . . . . . . . . . . . . . . . . . . . . . . . . . . . . . . 9 4 3Other . . . . . . . . . . . . . . . . . . . . . . . . . . . . . . . . . . . . . . . . . . . . . . . . . . . . . . . . . . . . 12 7 7
Total . . . . . . . . . . . . . . . . . . . . . . . . . . . . . . . . . . . . . . . . . . . . . . . . . . . . . . . . . . . . 100% 100% 100%
Despite a decrease in new store openings (30 expected in 2010 compared to 56 in 2009), we expect totalcapital expenditures to increase to approximately $900 million in fiscal 2010 due to an increase in store remodels(85 expected in 2010 compared to 51 in 2009), the purchase of a second e-commerce distribution facility on thewest coast, and significant investment in our website to support the rapid growth of our e-commerce business.The actual amount of our future capital expenditures will depend primarily on the number of new stores opened,the mix of owned, leased or acquired stores, the number of stores remodeled and the timing of distribution centeropenings. We do not anticipate that our expansion plans will be limited by any restrictive covenants in ourfinancing agreements. We believe that our capital structure is well positioned to support our expansion plans. Weanticipate that internally generated cash flows will be the primary source of funding for future growth.
Net purchases and sales of long-term investments generated cash of $28 million in 2009 and $40 million in2008. As of January 30, 2010, we had investments in auction rate securities (“ARS”) with a par value of $379million and an estimated fair value of $320 million. ARS are long-term debt instruments with interest rates resetthrough periodic short term auctions, which are typically held every 35 days. Beginning in February 2008,liquidity issues in the global credit markets resulted in the failure of auctions for all of our ARS. A “failed”auction occurs when the amount of securities submitted for sale in the auction exceeds the amount of purchasebids. As a result, holders are unable to liquidate their investment through the auction. A failed auction is not adefault of the debt instrument, but does set a new interest rate in accordance with the terms of the debtinstrument. A failed auction limits liquidity for holders until there is a successful auction or until such time asanother market for ARS develops. ARS are generally callable by the issuer at any time. Scheduled auctionscontinue to be held until the ARS matures or is called.
To date, we have collected all interest payable on outstanding ARS when due and expect to continue to doso in the future. In addition, all redemptions to date were made at par. At this time, we have no reason to believethat any of the underlying issuers of our ARS or their insurers are presently at risk or that the reduced liquidityhas had a significant impact on the underlying credit quality of the assets backing our ARS. While the auctionfailures limit our ability to liquidate these investments, we believe that the ARS failures will have no significantimpact on our ability to fund ongoing operations and growth initiatives.
Net cash used in investing activities was $1.0 billion in 2008 compared to $1.6 billion in 2007. The decreasereflects lower capital expenditures, substantially offset by net investment activity. Capital expenditures totaled$1.0 billion for 2008, a $528 million decrease from 2007. This decrease is primarily due to a decrease of 37 storeopenings in 2008 compared to 2007. Net purchases and sales of long-term investments generated cash of $40million in 2008 and used cash of $80 million in 2007.
28
Financing activities.
Our financing activities provided cash of $30 million in 2009 compared to using $273 million in 2008. Thechange is primarily due to treasury stock purchases in the first six months of 2008.
We have no debt maturing until 2011. We expect to use cash on hand and funds from operations to repayboth the $300 million of long-term debt which is due in March 2011 and the $100 million of long-term debtwhich is due in October 2011.
Our credit ratings have been unchanged since September 2007 when we issued $1 billion in debt. Ourratings are currently as follows:
Moody’sStandard& Poor’s Fitch
Long-term debt . . . . . . . . . . . . . . . . . . . . . . . . . . . . . . . . . . . . Baa1 BBB+ BBB+
We may from time to time seek to retire or purchase our outstanding debt through open market cashpurchases, privately negotiated transactions or otherwise. Such repurchases, if any, will depend on prevailingmarket conditions, our liquidity requirements, contractual restrictions and other factors. The amounts involvedcould be material. In September 2007, our Board of Directors authorized a $2.5 billion share repurchase programwhich is intended to return excess capital to our shareholders. As a result of the current economic environment,we have not purchased any shares under this program since July 2008. In 2008, we repurchased 6.0 millionshares at a total cost of $261 million. The program does not have a specified termination date.
Our financing activities used cash of $273 million in 2008 and provided cash of $325 million in 2007. Thechange reflects the proceeds from the issuance of $1 billion of debt in 2007 and lower treasury stock purchases in2008.
Key financial ratios.
Key financial ratios that provide certain measures of our liquidity are as follows:
2009 2008 2007
Working capital (In Millions) . . . . . . . . . . . . . . . . . . . . . . . . . . . . . . . . $ 3,095 $ 1,884 $ 1,952Current ratio . . . . . . . . . . . . . . . . . . . . . . . . . . . . . . . . . . . . . . . . . . . . . 2.29:1 2.02:1 2.09:1Debt/capitalization . . . . . . . . . . . . . . . . . . . . . . . . . . . . . . . . . . . . . . . . 20.8% 23.5% 25.3%Ratio of earnings to fixed charges . . . . . . . . . . . . . . . . . . . . . . . . . . . . 4.42 4.47 5.97
The increase in working capital and the current ratio as of year-end 2009 compared to year-end 2008 wasprimarily due to higher cash and cash equivalents. The decrease in the debt/capitalization ratio reflects highercapitalization, primarily due to earnings. The ratio of earnings to fixed charges was comparable to 2008. SeeExhibit 12.1 to this Annual Report on Form 10-K for the calculation of this ratio.
The decreases in working capital and the current ratio as of year-end 2008 compared to year-end 2007 wereprimarily due to lower inventory levels and a higher accounts payable balance. The debt/capitalization ratioreflects higher capitalization at year-end 2008 compared to year-end 2007 due to current year earnings. Thedecrease in the earnings to fixed charges ratio was the result of lower income before taxes and higher interestexpense on our debt due to the $1 billion in debt that was issued in September 2007.
29
Debt Covenant Compliance. Our debt agreements contain various covenants including limitations onadditional indebtedness and the following leverage ratio:
(Dollars inMillions)
Total Debt per Balance Sheet . . . . . . . . . . . . . . . . . . . . . . . . . . . . . . . . . . . . $ 2,068Other Debt . . . . . . . . . . . . . . . . . . . . . . . . . . . . . . . . . . . . . . . . . . . . . . . . . . . —
Subtotal . . . . . . . . . . . . . . . . . . . . . . . . . . . . . . . . . . . . . . . . . . . . . . . . . . . . . 2,068Rent x 8 . . . . . . . . . . . . . . . . . . . . . . . . . . . . . . . . . . . . . . . . . . . . . . . . . . . . . 3,987
A Included Indebtedness . . . . . . . . . . . . . . . . . . . . . . . . . . . . . . . . . . . . . . . . . . $ 6,055
Net Worth . . . . . . . . . . . . . . . . . . . . . . . . . . . . . . . . . . . . . . . . . . . . . . . . . . . . $ 7,853Investments (accounted for under equity method) . . . . . . . . . . . . . . . . . . . . —
Subtotal . . . . . . . . . . . . . . . . . . . . . . . . . . . . . . . . . . . . . . . . . . . . . . . . . . . . . 7,853Included Indebtedness . . . . . . . . . . . . . . . . . . . . . . . . . . . . . . . . . . . . . . . . . . 6,055
B Capitalization . . . . . . . . . . . . . . . . . . . . . . . . . . . . . . . . . . . . . . . . . . . . . . . . . $13,908
Leverage Ratio (A/B) . . . . . . . . . . . . . . . . . . . . . . . . . . . . . . . . . . . . . . . . . . . 0.44Maximum permitted Leverage Ratio . . . . . . . . . . . . . . . . . . . . . . . . . . . . . . . 0.70
As of January 30, 2010, we were in compliance with all debt covenants and expect to remain in complianceduring fiscal 2010.
Free Cash Flow. We generated free cash flow of $1.6 billion in 2009, more than double our 2008 free cashflow of $684 million. Free cash flow is a non-GAAP financial measure which we define as net cash provided byoperating activities less capital expenditures. Free cash flow should be evaluated in addition to, and notconsidered a substitute for, other financial measures such as net income and cash flow provided by operations.We believe that free cash flow represents our ability to generate additional cash flow from our businessoperations.
The following table reconciles net cash provided by operating activities (a GAAP measure) to free cash flow(a non-GAAP measure).
2009 2008 2007
(In Millions)
Net cash provided by operating activities . . . . . . . . . . . . . . . . . . . . . . . $2,234 $ 1,701 $ 1,235Acquisition of property and equipment and favorable lease rights . . . . (666) (1,014) (1,542)
Free cash flow . . . . . . . . . . . . . . . . . . . . . . . . . . . . . . . . . . . . . . . . . . . . $1,568 $ 687 $ (307)
We expect to generate $800 to $900 million of free cash flow in fiscal 2010.
30
Contractual Obligations
Our contractual obligations as of January 30, 2010 were as follows:
TotalLess Than 1
Year1 - 3
Years3 - 5
YearsMore than 5
Years
(In Millions)
Recorded contractual obligations:Long-term debt . . . . . . . . . . . . . . . . . . . . . . . . . . . . . . $ 1,900 $ — $ 400 $ — $ 1,500Capital leases . . . . . . . . . . . . . . . . . . . . . . . . . . . . . . . 174 16 29 20 109
2,074 16 429 20 1,609
Unrecorded contractual obligations:Interest payments:
Long-term debt . . . . . . . . . . . . . . . . . . . . . . . . . . 1,738 123 211 194 1,210Capital leases . . . . . . . . . . . . . . . . . . . . . . . . . . . 103 12 21 18 52
Operating leases (a) . . . . . . . . . . . . . . . . . . . . . . . . . . 11,038 479 931 917 8,711Royalties . . . . . . . . . . . . . . . . . . . . . . . . . . . . . . . . . . . 255 58 105 74 18Purchase obligations (b) . . . . . . . . . . . . . . . . . . . . . . . 3,245 3,245 — — —
16,379 3,917 1,268 1,203 9,991
Total . . . . . . . . . . . . . . . . . . . . . . . . . . . . . . . . . . . . . . $18,453 $3,933 $1,697 $1,223 $11,600
(a) Our leases typically require that we pay real estate taxes, insurance and maintenance costs in addition to theminimum rental payments included in the table above. Such costs vary from period to period and totaled$157 million for 2009, $148 million for 2008 and $135 million for 2007.
(b) Our purchase obligations consist mainly of purchase orders for merchandise. Amounts committed underopen purchase orders for merchandise are cancelable without penalty prior to a date that precedes thevendors’ scheduled shipment date.
It is reasonably possible that our unrecognized tax positions may change within the next 12 months,primarily as a result of ongoing audits. While it is possible that one or more of these audits may be resolved inthe next year, it is not anticipated that payment of any such amounts in future periods will affect liquidity andcash flows.
Off-Balance Sheet Arrangements
We have not provided any financial guarantees as of year-end 2009.
We have not created, and are not party to, any special-purpose or off-balance sheet entities for the purposeof raising capital, incurring debt or operating our business. We do not have any arrangements or relationshipswith entities that are not consolidated into the financial statements that are reasonably likely to materially affectour liquidity or the availability of capital resources.
Critical Accounting Policies and Estimates
The preparation of financial statements in conformity with accounting principles generally accepted in theUnited States requires us to make estimates and assumptions that affect the reported amounts. A discussion of themore significant estimates follows. Management has discussed the development, selection and disclosure of theseestimates and assumptions with the Audit Committee of our Board of Directors.
Retail Inventory Method and Inventory Valuation
We value our inventory at the lower of cost or market with cost determined on the first-in, first-out(“FIFO”) basis using the retail inventory method (“RIM”). RIM is an averaging method that has been widely
31
used in the retail industry due to its practicality. Under RIM, the valuation of inventories at cost and the resultinggross margins are calculated by applying a cost-to-retail ratio to the retail value of the inventories. The use ofRIM will result in inventories being valued at the lower of cost or market as markdowns are currently taken as areduction of the retail value of inventories.
Based on a review of historical clearance markdowns, current business trends, expected vendor funding anddiscontinued merchandise categories, an adjustment to inventory is recorded to reflect additional markdownswhich are estimated to be necessary to liquidate existing clearance inventories and reduce inventories to thelower of cost or market. Management believes that our inventory valuation approximates the net realizable valueof clearance inventory and results in carrying inventory at the lower of cost or market.
Vendor Allowances
We record vendor allowances and discounts in the income statement when the purpose for which thosemonies were designated is fulfilled. Allowances provided by vendors generally relate to profitability of inventoryrecently sold and, accordingly, are reflected as reductions to cost of merchandise sold as negotiated. Vendorallowances received for advertising or fixture programs reduce our expense or expenditure for the relatedadvertising or fixture program when appropriate. Vendor allowances will fluctuate based on the amount ofpromotional and clearance markdowns necessary to liquidate the inventory. See also Note 1 to the consolidatedfinancial statements, “Business and Summary of Accounting Policies.”
Insurance Reserve Estimates
We use a combination of insurance and self-insurance for a number of risks including workers’compensation, general liability and employee-related health care benefits, a portion of which is paid by ourassociates. We use a third-party actuary, which considers historical claims experience, demographic factors,severity factors and other actuarial assumptions, to estimate the liabilities associated with these risks. A change inclaims frequency and severity of claims from historical experience as well as changes in state statutes and themix of states in which we operate could result in a change to the required reserve levels. We retain the initial riskof $500,000 per occurrence under our workers’ compensation insurance policy and $250,000 per occurrenceunder our general liability policy. We also have a lifetime medical payment limit of $1.5 million per planparticipant.
Impairment of Assets and Closed Store Reserves
We have a significant investment in property and equipment and favorable lease rights. The relateddepreciation and amortization is computed using estimated useful lives of up to 50 years. We review our long-lived assets held for use (including favorable lease rights, goodwill and trademarks) for impairment whenever anevent or change in circumstances, such as decisions to close a store, indicates the carrying value of the asset maynot be recoverable. We have historically not experienced any significant impairment of long-lived assets orclosed store reserves. Decisions to close a store can also result in accelerated depreciation over the revised usefullife. When operations at a leased store are discontinued, a reserve is established for the discounted differencebetween the rent and the expected sublease rental income. A significant change in cash flows, market valuation,demand for real estate or other factors, could result in an increase or decrease in the reserve requirement orimpairment charge.
Income Taxes
We pay income taxes based on tax statutes, regulations and case law of the various jurisdictions in which weoperate. At any one time, multiple tax years are subject to audit by the various taxing authorities. Our effectiveincome tax rate was 37.6% in 2009, 37.9% in 2008 and 37.8% in 2007. The effective rate is impacted by changesin law, location of new stores, level of earnings and the result of tax audits.
32
Operating Leases
As of January 30, 2010, we leased 686 of our 1,058 retail stores. Many lease agreements contain rentholidays, rent escalation clauses and/or contingent rent provisions. We recognize rent expense on a straight-linebasis over the expected lease term, including cancelable option periods where failure to exercise such optionswould result in an economic penalty. We use a time period for our straight-line rent expense calculation thatequals or exceeds the time period used for depreciation. In addition, the commencement date of the lease term isthe earlier of the date when we become legally obligated for the rent payments or the date when we takepossession of the building or land for initial setup of fixtures and merchandise or land improvements.
Item 7A. Quantitative and Qualitative Disclosures About Market Risk
All of our long-term debt at year-end 2009 is at fixed interest rates and, therefore, is not affected by changesin interest rates. When our long-term debt instruments mature, we may refinance them at then existing marketinterest rates, which may be more or less than interest rates on the maturing debt.
Cash equivalents and long-term investments earn interest at variable rates and are affected by changes ininterest rates. During 2009, average investments were $1.6 billion and average yield was 0.6%. If interest rateson the average 2009 variable rate cash equivalents and long-term investments increased by 100 basis points, ourannual interest income would also increase by approximately $16 million assuming comparable investmentlevels.
We were not a party to any material derivative financial instruments in 2009, 2008 or 2007.
Item 8. Financial Statements and Supplementary Data
The financial statements are included in this report beginning on page F-3.
Item 9. Changes In and Disagreements with Accountants on Accounting and Financial Disclosures
None
Item 9A. Controls and Procedures
(a) Evaluation of Disclosure Controls and Procedures
Under the supervision and with the participation of our management, including our Chief Executive Officerand Chief Financial Officer, we carried out an evaluation of the effectiveness of the design and operation of ourdisclosure controls and procedures (the “Evaluation”) at a reasonable assurance level as of the last day of theperiod covered by this Report.
Based upon the Evaluation, our Chief Executive Officer and Chief Financial Officer concluded that ourdisclosure controls and procedures are effective at the reasonable assurance level. Disclosure controls andprocedures are defined by Rules 13a-15(e) and 15d-15(e) of the Securities Exchange Act of 1934 (the “ExchangeAct”) as controls and other procedures that are designed to ensure that information required to be disclosed in thereports that we file or submit under the Exchange Act is recorded, processed, summarized and reported within thetime periods specified by the SEC’s rules and forms. Disclosure controls and procedures include, withoutlimitation, controls and procedures designed to ensure that information required to be disclosed in the reports thatwe file or submit under the Exchange Act is accumulated and communicated to our management, including ourChief Executive Officer and Chief Financial Officer, to allow timely decisions regarding required disclosures.
It should be noted that the design of any system of controls is based in part upon certain assumptions aboutthe likelihood of future events, and there can be no assurance that any design will succeed in achieving our statedgoals under all potential future conditions, regardless of how remote.
33
(b) Management’s Annual Report on Internal Control over Financial Reporting
Our management is responsible for establishing and maintaining adequate internal control over financialreporting. Our internal control system was designed to provide reasonable assurance to our management andBoard of Directors regarding the preparation and fair presentation of our published financial statements.
All internal control systems, no matter how well designed, have inherent limitations. Therefore, even thosesystems determined to be effective can provide only reasonable assurance with respect to financial statementpreparation and presentation.
Our management assessed the effectiveness of our internal control over financial reporting as of January 30,2010. In making this assessment, it used the criteria set forth by the Committee of Sponsoring Organizations ofthe Treadway Commission (“COSO”) in Internal Control—Integrated Framework. Based on our assessment,management believes that, as of January 30, 2010, our internal control over financial reporting is effective basedon those criteria.
Ernst & Young LLP, an independent registered public accounting firm, has audited the ConsolidatedFinancial Statements included in this Annual Report on Form 10-K and, as part of its audit, has issued anattestation report, included herein, on the effectiveness of our internal control over financial reporting.
(c) Changes in Internal Control Over Financial Reporting
During the last fiscal quarter, there were no changes in our internal controls that have materially affected orare reasonably likely to materially affect such controls, including any corrective actions with regard to significantdeficiencies and material weaknesses.
34
REPORT OF INDEPENDENT REGISTERED PUBLIC ACCOUNTING FIRM
The Board of Directors and Shareholders ofKohl’s Corporation
We have audited Kohl’s Corporation’s internal control over financial reporting as of January 30, 2010,based on criteria established in Internal Control—Integrated Framework issued by the Committee of SponsoringOrganizations of the Treadway Commission (the COSO criteria). Kohl’s Corporation’s management isresponsible for maintaining effective internal control over financial reporting, and for its assessment of theeffectiveness of internal control over financial reporting included in the accompanying Management’s AnnualReport on Internal Control over Financial Reporting. Our responsibility is to express an opinion on thecompany’s internal control over financial reporting based on our audit.
We conducted our audit in accordance with the standards of the Public Company Accounting OversightBoard (United States). Those standards require that we plan and perform the audit to obtain reasonable assuranceabout whether effective internal control over financial reporting was maintained in all material respects. Ouraudit included obtaining an understanding of internal control over financial reporting, assessing the risk that amaterial weakness exists, testing and evaluating the design and operating effectiveness of internal control basedon the assessed risk, and performing such other procedures as we considered necessary in the circumstances. Webelieve that our audit provides a reasonable basis for our opinion.
A company’s internal control over financial reporting is a process designed to provide reasonable assuranceregarding the reliability of financial reporting and the preparation of financial statements for external purposes inaccordance with generally accepted accounting principles. A company’s internal control over financial reportingincludes those policies and procedures that (1) pertain to the maintenance of records that, in reasonable detail,accurately and fairly reflect the transactions and dispositions of the assets of the company; (2) provide reasonableassurance that transactions are recorded as necessary to permit preparation of financial statements in accordancewith generally accepted accounting principles, and that receipts and expenditures of the company are being madeonly in accordance with authorizations of management and directors of the company; and (3) provide reasonableassurance regarding prevention or timely detection of unauthorized acquisition, use or disposition of thecompany’s assets that could have a material effect on the financial statements.
Because of its inherent limitations, internal control over financial reporting may not prevent or detectmisstatements. Also, projections of any evaluation of effectiveness to future periods are subject to the risk thatcontrols may become inadequate because of changes in conditions, or that the degree of compliance with thepolicies or procedures may deteriorate.
In our opinion, Kohl’s Corporation maintained, in all material respects, effective internal control overfinancial reporting as of January 30, 2010 based on the COSO criteria.
We also have audited, in accordance with the standards of the Public Company Accounting Oversight Board(United States), the consolidated balance sheets of Kohl’s Corporation as of January 30, 2010 and January 31,2009, and the related consolidated statements of income, changes in shareholders’ equity, and cash flows for eachof the three years in the period ended January 30, 2010 and our report dated March 19, 2010 expressed anunqualified opinion thereon.
/s/ ERNST & YOUNG LLP
Milwaukee, WisconsinMarch 19, 2010
Item 9B. Other Information
None
35
PART III
Item 10. Directors, Executive Officers and Corporate Governance
For information with respect to our Directors, the Board of Directors’ Audit Committee and our writtencode of ethics, see the applicable portions of the “Questions and Answers About our Board of Directors andCorporate Governance Matters” and “Item 1: Election of Directors” sections of the Proxy Statement for ourMay 13, 2010 Annual Meeting of Shareholders (“our 2010 Proxy”), which information is incorporated herein byreference. For information with respect to Section 16 reports, see the information provided in the “Section 16(a)Beneficial Ownership Reporting Compliance” section of our 2010 Proxy, which information is incorporatedherein by reference.
Our executive officers as of March 10, 2010 are as follows:
Name Age Position
Kevin Mansell . . . . . . . . . . . . . . . . . . . . . . 57 Chairman, Chief Executive Officer, President and Director
Don Brennan . . . . . . . . . . . . . . . . . . . . . . . 49 Senior Executive Vice President
John Worthington . . . . . . . . . . . . . . . . . . . 46 Senior Executive Vice President
Wesley S. McDonald . . . . . . . . . . . . . . . . 47 Executive Vice President—Chief Financial Officer
Mr. Mansell was promoted to Chairman in September 2009 and has served as Chief Executive Officer sinceAugust 2008 and President and Director since February 1999. He served as Executive Vice President—GeneralMerchandise Manager from 1987 to 1998. Mr. Mansell joined Kohl’s as a Divisional Merchandise Manager in1982. Mr. Mansell began his retail career in 1975.
Mr. Brennan has served as Senior Executive Vice President since September 2007. He joined Kohl’s inApril 2001 as Executive Vice President, Merchandise Planning and Allocation, and also served as ExecutiveVice President, General Merchandise Manager Men’s and Children’s from April 2004 to September 2007. Priorto joining Kohl’s, Mr. Brennan served in a variety of management positions with Burdines Department Stores, adivision of Federated Department Stores, Inc. since 1982. Mr. Brennan has almost 30 years of experience in theretail industry.
Mr. Worthington has served as Senior Executive Vice President since September 2007. Prior to thisassignment, Mr. Worthington has served in a variety of positions with Kohl’s, including Executive VicePresident, Director of Stores from 2005 to September 2007, Senior Vice President of Stores from 2004 to 2005and Vice President, Regional Manager from 2002 to 2004. Mr. Worthington was with May Department Stores,Inc. before joining Kohl’s and has over 20 years of experience in the retail industry.
Mr. McDonald has served as Executive Vice President, Chief Financial Officer since August 2003. Prior tojoining Kohl’s, Mr. McDonald was Vice President, Chief Financial Officer of Abercrombie & Fitch since June2000. Mr. McDonald served in a variety of management positions with Target Corporation from 1988 to 2000,most recently as Director, Target Corporation IS Finance & Administration. Mr. McDonald has over 20 years ofexperience in the retail industry.
36
Members of our Board of Directors as of March 10, 2010 were as follows:
Kevin MansellChairman, President and Chief Executive OfficerKohl’s Corporation
William S. KelloggFormer Chairman and Chief Executive
Officer,Kohl’s Corporation
Peter Boneparth (a)(c)
Senior Advisor,Irving Capital Partners
Frank V. Sica (b)*(c)
Managing Partner,Tailwind Capital
Steven A. Burd (b)(c)
Chairman, President and Chief Executive Officer,Safeway Inc.
Peter M. SommerhauserShareholder,Godfrey & Kahn, S.C. Law Firm
John F. Herma (a)(c)
Former Chief Operating Officer and Secretary,Kohl’s Corporation
Stephanie A. Streeter (a)(c)
Former Chairman, President, and ChiefExecutive Officer,
Banta Corporation
Dale E. Jones (b)(c)
Vice Chairman and Partner of the CEO andBoard Practice in the Americas,
Heidrick and Struggles
Stephen E. Watson (a)*(c)*
Former President, Chief ExecutiveOfficer of Gander Mountain, L.L.C.
Former Chairman and Chief ExecutiveOfficer, Department Store Divisionof Dayton-Hudson Corporation
(a) 2009 Audit Committee member(b) 2009 Compensation Committee member(c) 2009 Governance & Nominating Committee member* Denotes Chair
Item 11. Executive Compensation
See the information provided in the applicable portions of the “Questions and Answers About our Board ofDirectors and Corporate Governance Matters” and “Item 1: Election of Directors” sections of our 2010 Proxy,which information is incorporated herein by reference.
Item 12. Security Ownership of Certain Beneficial Owners and Management and Related StockholderMatters
See the information provided in the “Security Ownership of Certain Beneficial Owners, Directors andManagement” and “Equity Compensation Plan Information” sections of our 2010 Proxy, which information isincorporated herein by reference.
Item 13. Certain Relationships and Related Transactions, and Director Independence
See the information provided in the “Independence Determinations & Related Party Transactions” section ofour 2010 Proxy, which information is incorporated herein by reference.
Item 14. Principal Accountant Fees and Services
See the information provided in the “Fees Paid to Ernst & Young” section of our 2010 Proxy, whichinformation is incorporated herein by reference.
37
PART IV
Item 15. Exhibits and Financial Statement Schedules
(a) Documents filed as part of this report:
1. Consolidated Financial Statements:
See “Index to Consolidated Financial Statements” on page F-1, the Report of IndependentRegistered Public Accounting Firm on page F-2 and the Consolidated Financial Statements beginningon page F-3, all of which are incorporated herein by reference.
2. Financial Statement Schedule:
All schedules have been omitted as they are not applicable.
3. Exhibits:
See “Exhibit Index” of this Form 10-K, which is incorporated herein by reference.
38
SIGNATURES
Pursuant to the requirements of Section 13 or 15 (d) of the Securities Exchange Act of 1934, the Registranthas duly caused this report to be signed on our behalf by the undersigned, thereunto duly authorized.
Kohl’s Corporation
By: /s/ KEVIN MANSELL
Kevin MansellChairman, President, Chief Executive Officerand Director(Principal Executive Officer)
/s/ WESLEY S. MCDONALD
Wesley S. McDonaldExecutive Vice President, Chief Financial Officer(Principal Financial and Accounting Officer)
Dated: March 18, 2010
Pursuant to the requirements of the Securities Exchange Act of 1934, this report has been signed below bythe following persons on behalf of the Registrant and in the capacities and on the date indicated above:
/s/ KEVIN MANSELL
Kevin MansellChairman, President, Chief Executive Officer andDirector(Principal Executive Officer)
/s/ FRANK SICA
Frank SicaDirector
/s/ PETER BONEPARTH
Peter BoneparthDirector
/s/ PETER M. SOMMERHAUSER
Peter M. SommerhauserDirector
/s/ STEVEN A. BURD
Steven A. BurdDirector
/s/ STEPHANIE A. STREETER
Stephanie A. StreeterDirector
/s/ JOHN F. HERMA
John F. HermaDirector
/s/ STEPHEN E. WATSON
Stephen E. WatsonDirector
/s/ DALE E. JONES
Dale E. JonesDirector
/s/ WILLIAM S. KELLOGG
William S. KelloggDirector
39
Exhibit Index
ExhibitNumber Description
3.1 Articles of Incorporation of the Company, incorporated herein by reference to Exhibit 3.1 of theCompany’s Quarterly Report on Form 10-Q for the fiscal quarter ended July 31, 1999.
3.2 Amendment to Articles of Incorporation of the Company, incorporated herein by reference toExhibit 3.1 of the Company’s Quarterly Report on Form 10-Q for the fiscal quarter ended April 29,2006.
3.3 Amendment to Articles of Incorporation of the Company, incorporated herein by reference toExhibit 3.1 of the Company’s Quarterly Report on Form 10-Q for the fiscal quarter ended May 5,2007.
3.4 Amended and Restated Bylaws of the Company, incorporated herein by reference to Exhibit 3.1 ofthe Company’s Current Report on Form 8-K filed on February 27, 2009.
4.1 Credit Agreement dated as of October 12, 2006 by and among the Company, the Lenders partythereto, Bank of America, N.A., as an Issuing Bank and Syndication Agent, JPMorgan Chase Bank,N.A., US Bank National Association and Wachovia Bank National Association, asCo-Documentation Agents and The Bank of New York, as an Issuing Bank, the Swing Line Lenderand the Administrative Agent, incorporated herein by reference to Exhibit 10.1 of the Company’sQuarterly Report on Form 10-Q for the fiscal quarter ended October 28, 2006.
4.2 Certain other long-term debt is described in Note 3 of the Notes to Consolidated FinancialStatements. The Company agrees to furnish to the Commission, upon request, copies of anyinstruments defining the rights of holders of any such long-term debt described in Note 3 and notfiled herewith.
10.1 Private Label Credit Card Program Agreement dated as of March 5, 2006, by and between Kohl’sDepartment Stores, Inc., and Chase Bank USA, National Association, incorporated herein byreference to Exhibit 10.2 of the Company’s Annual Report on Form 10-K for the fiscal year endedJanuary 28, 2006.
10.2. Amended and Restated Executive Deferred Compensation Plan, incorporated herein by reference toExhibit 10.1 of the Company’s Annual Report on Form 10-K for the fiscal year ended February 1,2003.*
10.3. Kohl’s Corporation 2005 Deferred Compensation Plan, as amended and restated effective January 1,2005, incorporated herein by reference to Exhibit 10.4 of the Company’s Annual Report onForm 10-K for the fiscal year ended January 28, 2006.*
10.4. Summary of Executive Medical Plan, incorporated herein by reference to Exhibit 10.6 of theCompany’s Annual Report on Form 10-K for the fiscal year ended January 29, 2005.*
10.5. Summary of Executive Life and Accidental Death and Dismemberment Plans, incorporated herein byreference to Exhibit 10.7 of the Company’s Annual Report on Form 10-K for the fiscal year endedJanuary 29, 2005.*
10.6. Kohl’s Corporation Executive Bonus Plan, incorporated herein by reference to the Company’sSchedule 14A (File No. 001-11084) filed on March 27, 2007.*
10.7. 1992 Long Term Compensation Plan, incorporated herein by reference to Exhibit 10.13 of theCompany’s registration statement on Form S-1 (File No. 33-46883).*
10.8. 1994 Long-Term Compensation Plan, incorporated herein by reference to Exhibit 10.15 of theCompany’s Quarterly Report on Form 10-Q for the fiscal quarter ended May 4, 1996.*
40
ExhibitNumber Description
10.9. 1997 Stock Option Plan for Outside Directors, incorporated herein by reference to Exhibit 4.4 of theCompany’s registration statement on Form S-8 (File No. 333-26409), filed on May 2, 1997.*
10.10. Amended and Restated 2003 Long-Term Compensation Plan, incorporated herein by reference to theCompany’s Quarterly Report on Form 10-Q for the fiscal quarter ended August 2, 2008.*
10.11. Form of Restricted Stock Agreement, incorporated herein by reference to Exhibit 10.31 of theCompany’s Annual Report on Form 10-K for the fiscal year ended January 29, 2005.*
10.12. Form of Executive Stock Option Award, incorporated herein by reference to Exhibit 10.1 of theCompany’s Current Report on Form 8-K dated February 23, 2005. *
10.13. Form of Outside Director Stock Option Award, incorporated herein by reference to Exhibit 10.14 ofthe Company’s Annual Report on Form 10-K for the fiscal year ended January 29, 2005.*
10.14. Summary of Outside Director Compensation.*
10.15. Employment Agreement between the Company and R. Lawrence Montgomery, incorporated hereinby reference to Exhibit 10.4 of the Company’s Annual Report on Form 10-K for the fiscal year endedJanuary 31, 1998.*
10.16. First Amendment to Employment Agreement between the Company and Mr. Montgomery, datedNovember 15, 2000, incorporated herein by reference to Exhibit 10.13 of the Company’s AnnualReport on Form 10-K for the fiscal year ended February 3, 2001.*
10.17. Second Amendment to Employment Agreement between the Company and Mr. Montgomery, datedJanuary 31, 2004, incorporated herein by reference to Exhibit 10.24 of the Company’s Annual Reporton Form 10-K for the fiscal year ended January 31, 2004.*
10.18. Third Amendment to Employment Agreement between the Company and Mr. Montgomery, datedAugust 20, 2008, incorporated herein by reference to Exhibit 10.3 of the Company’s QuarterlyReport on Form 10-Q for the fiscal quarter ended August 2, 2008.*
10.19. Amendment to Employment Agreement between the Company and Mr. Montgomery, datedNovember 17, 2008, incorporated herein by reference to Exhibit 99.1 to the Company’s CurrentReport on Form 8-K filed on November 19, 2008.*
10.20. Noncompetition and Consulting Agreement between Kohl’s Corporation and Kohl’s DepartmentStores, Inc. and R. Lawrence Montgomery dated as of September 1, 2009, incorporated by referenceto Exhibit 10.4 of the Company’s Current Report on Form 8-K dated August 26, 2009.*
10.21. Amended and Restated Employment Agreement between Kohl’s Corporation and Kohl’s DepartmentStores, Inc. and Kevin Mansell dated as of September 1, 2009, incorporated by reference toExhibit 10.1 of the Company’s Current Report on Form 8-K dated August 26, 2009.*
10.22. Amended and Restated Employment Agreement between Kohl’s Corporation and Kohl’s DepartmentStores, Inc. and Donald Brennan dated as of September 1, 2009, incorporated by reference toExhibit 10.2 of the Company’s Current Report on Form 8-K dated August 26, 2009.*
10.23. Amended and Restated Employment Agreement between Kohl’s Corporation and Kohl’s DepartmentStores, Inc. and John Worthington dated as of September 1, 2009, incorporated by reference toExhibit 10.3 of the Company’s Current Report on Form 8-K dated August 26, 2009.*
10.24. Form of Executive Compensation Agreement between the Company and various key executives,including Wesley McDonald, incorporated herein by reference to Exhibit 10.31 of the Company’sAnnual Report on Form 10-K for the fiscal year ended February 3, 2007.*
41
ExhibitNumber Description
10.25. Summary of Strategic Action Committee Incentive Program.*
12.1 Ratio of Earnings to Fixed Charges.
21.1 Subsidiaries of the Registrant.
23.1 Consent of Ernst & Young LLP.
31.1 Certification of the Chief Executive Officer pursuant to Section 302 of the Sarbanes-Oxley Act of2002.
31.2 Certification of the Chief Financial Officer pursuant to Section 302 of the Sarbanes-Oxley Act of2002.
32.1 Certification of the Chief Executive Officer pursuant to 18 U.S.C. Section 1350, as adoptedpursuant to Section 906 of the Sarbanes-Oxley Act of 2002.
32.2 Certification of the Chief Financial Officer pursuant to 18 U.S.C. Section 1350, as adoptedpursuant to Section 906 of the Sarbanes-Oxley Act of 2002.
101.INS XBRL Instance Document
101.SCH XBRL Taxonomy Extension Schema
101.CAL XBRL Taxonomy Extension Calculation Linkbase
101.DEF XBRL Taxonomy Extension Definition Linkbase
101.LAB XBRL Taxonomy Extension Label Linkbase
101.PRE XBRL Taxonomy Extension Presentation Linkbase
* A management contract or compensatory plan or arrangement.
42
INDEX TO CONSOLIDATED FINANCIAL STATEMENTS
Page
Consolidated Financial Statements
Report of Independent Registered Public Accounting Firm . . . . . . . . . . . . . . . . . . . . . . . . . . . . . . . . . . . . . . F-2
Consolidated Balance Sheets . . . . . . . . . . . . . . . . . . . . . . . . . . . . . . . . . . . . . . . . . . . . . . . . . . . . . . . . . . . . . . F-3
Consolidated Statements of Income . . . . . . . . . . . . . . . . . . . . . . . . . . . . . . . . . . . . . . . . . . . . . . . . . . . . . . . . . F-4
Consolidated Statements of Changes in Shareholders’ Equity . . . . . . . . . . . . . . . . . . . . . . . . . . . . . . . . . . . . F-5
Consolidated Statements of Cash Flows . . . . . . . . . . . . . . . . . . . . . . . . . . . . . . . . . . . . . . . . . . . . . . . . . . . . . F-6
Notes to Consolidated Financial Statements . . . . . . . . . . . . . . . . . . . . . . . . . . . . . . . . . . . . . . . . . . . . . . . . . . F-7
Schedules have been omitted as they are not applicable.
F-1
REPORT OF INDEPENDENT REGISTERED PUBLIC ACCOUNTING FIRM
The Board of Directors and Shareholders ofKohl’s Corporation
We have audited the accompanying consolidated balance sheets of Kohl’s Corporation (the Company) as ofJanuary 30, 2010 and January 31, 2009, and the related consolidated statements of income, changes inshareholders’ equity, and cash flows for each of the three years in the period ended January 30, 2010. Thesefinancial statements are the responsibility of the Company’s management. Our responsibility is to express anopinion on these financial statements based on our audits.
We conducted our audits in accordance with the standards of the Public Company Accounting OversightBoard (United States). Those standards require that we plan and perform the audit to obtain reasonable assuranceabout whether the financial statements are free of material misstatement. An audit includes examining, on a testbasis, evidence supporting the amounts and disclosures in the financial statements. An audit also includesassessing the accounting principles used and significant estimates made by management, as well as evaluatingthe overall financial statement presentation. We believe that our audits provide a reasonable basis for ouropinion.
In our opinion, the financial statements referred to above present fairly, in all material respects, theconsolidated financial position of Kohl’s Corporation at January 30, 2010 and January 31, 2009, and theconsolidated results of its operations and its cash flows for each of the three years in the period ended January 30,2010, in conformity with U.S. generally accepted accounting principles.
We also have audited, in accordance with the standards of the Public Company Accounting Oversight Board(United States), Kohl’s Corporation’s internal control over financial reporting as of January 30, 2010, based oncriteria established in Internal Control-Integrated Framework issued by the Committee of SponsoringOrganizations of the Treadway Commission and our report dated March 19, 2010, expressed an unqualifiedopinion thereon.
/s/ ERNST & YOUNG LLP
Milwaukee, WisconsinMarch 19, 2010
F-2
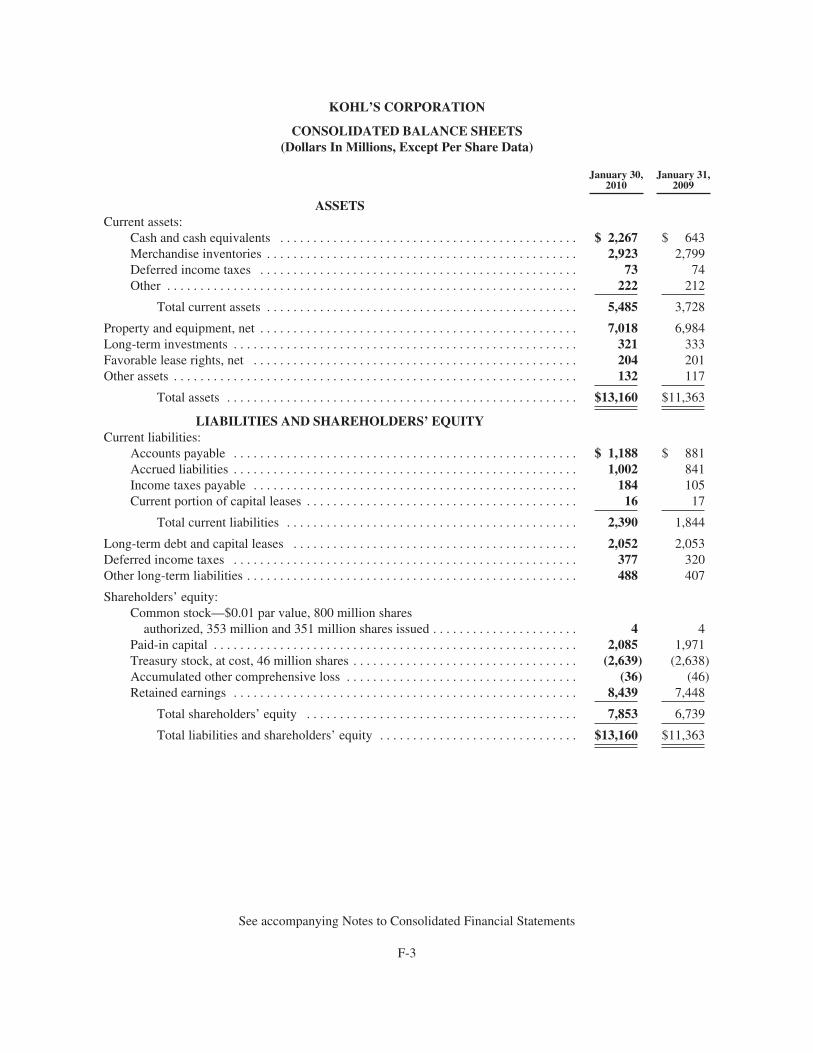
KOHL’S CORPORATION
CONSOLIDATED BALANCE SHEETS(Dollars In Millions, Except Per Share Data)
January 30,2010
January 31,2009
ASSETSCurrent assets:
Cash and cash equivalents . . . . . . . . . . . . . . . . . . . . . . . . . . . . . . . . . . . . . . . . . . . . . $ 2,267 $ 643Merchandise inventories . . . . . . . . . . . . . . . . . . . . . . . . . . . . . . . . . . . . . . . . . . . . . . . 2,923 2,799Deferred income taxes . . . . . . . . . . . . . . . . . . . . . . . . . . . . . . . . . . . . . . . . . . . . . . . . 73 74Other . . . . . . . . . . . . . . . . . . . . . . . . . . . . . . . . . . . . . . . . . . . . . . . . . . . . . . . . . . . . . . 222 212
Total current assets . . . . . . . . . . . . . . . . . . . . . . . . . . . . . . . . . . . . . . . . . . . . . . . 5,485 3,728
Property and equipment, net . . . . . . . . . . . . . . . . . . . . . . . . . . . . . . . . . . . . . . . . . . . . . . . . 7,018 6,984Long-term investments . . . . . . . . . . . . . . . . . . . . . . . . . . . . . . . . . . . . . . . . . . . . . . . . . . . . 321 333Favorable lease rights, net . . . . . . . . . . . . . . . . . . . . . . . . . . . . . . . . . . . . . . . . . . . . . . . . . 204 201Other assets . . . . . . . . . . . . . . . . . . . . . . . . . . . . . . . . . . . . . . . . . . . . . . . . . . . . . . . . . . . . . 132 117
Total assets . . . . . . . . . . . . . . . . . . . . . . . . . . . . . . . . . . . . . . . . . . . . . . . . . . . . . $13,160 $11,363
LIABILITIES AND SHAREHOLDERS’ EQUITYCurrent liabilities:
Accounts payable . . . . . . . . . . . . . . . . . . . . . . . . . . . . . . . . . . . . . . . . . . . . . . . . . . . . $ 1,188 $ 881Accrued liabilities . . . . . . . . . . . . . . . . . . . . . . . . . . . . . . . . . . . . . . . . . . . . . . . . . . . . 1,002 841Income taxes payable . . . . . . . . . . . . . . . . . . . . . . . . . . . . . . . . . . . . . . . . . . . . . . . . . 184 105Current portion of capital leases . . . . . . . . . . . . . . . . . . . . . . . . . . . . . . . . . . . . . . . . . 16 17
Total current liabilities . . . . . . . . . . . . . . . . . . . . . . . . . . . . . . . . . . . . . . . . . . . . 2,390 1,844
Long-term debt and capital leases . . . . . . . . . . . . . . . . . . . . . . . . . . . . . . . . . . . . . . . . . . . 2,052 2,053Deferred income taxes . . . . . . . . . . . . . . . . . . . . . . . . . . . . . . . . . . . . . . . . . . . . . . . . . . . . 377 320Other long-term liabilities . . . . . . . . . . . . . . . . . . . . . . . . . . . . . . . . . . . . . . . . . . . . . . . . . . 488 407
Shareholders’ equity:Common stock—$0.01 par value, 800 million shares
authorized, 353 million and 351 million shares issued . . . . . . . . . . . . . . . . . . . . . . 4 4Paid-in capital . . . . . . . . . . . . . . . . . . . . . . . . . . . . . . . . . . . . . . . . . . . . . . . . . . . . . . . 2,085 1,971Treasury stock, at cost, 46 million shares . . . . . . . . . . . . . . . . . . . . . . . . . . . . . . . . . . (2,639) (2,638)Accumulated other comprehensive loss . . . . . . . . . . . . . . . . . . . . . . . . . . . . . . . . . . . (36) (46)Retained earnings . . . . . . . . . . . . . . . . . . . . . . . . . . . . . . . . . . . . . . . . . . . . . . . . . . . . 8,439 7,448
Total shareholders’ equity . . . . . . . . . . . . . . . . . . . . . . . . . . . . . . . . . . . . . . . . . 7,853 6,739
Total liabilities and shareholders’ equity . . . . . . . . . . . . . . . . . . . . . . . . . . . . . . $13,160 $11,363
See accompanying Notes to Consolidated Financial Statements
F-3
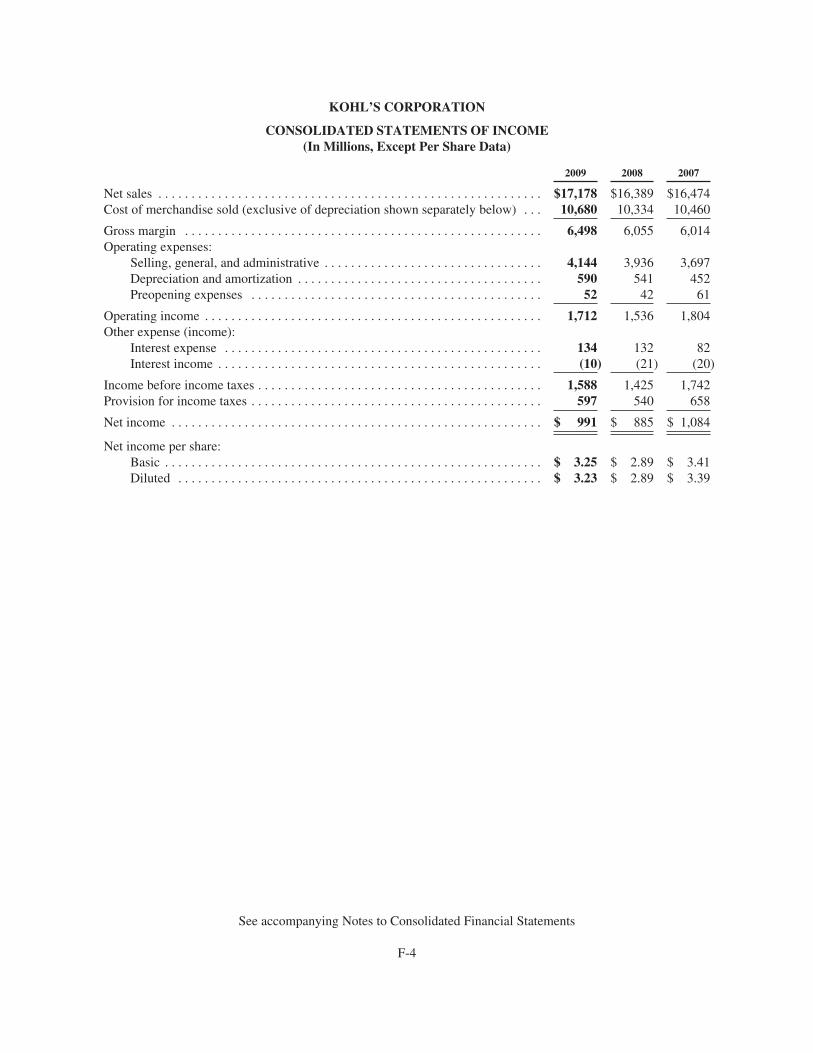
KOHL’S CORPORATION
CONSOLIDATED STATEMENTS OF INCOME(In Millions, Except Per Share Data)
2009 2008 2007
Net sales . . . . . . . . . . . . . . . . . . . . . . . . . . . . . . . . . . . . . . . . . . . . . . . . . . . . . . . . . . $17,178 $16,389 $16,474Cost of merchandise sold (exclusive of depreciation shown separately below) . . . 10,680 10,334 10,460
Gross margin . . . . . . . . . . . . . . . . . . . . . . . . . . . . . . . . . . . . . . . . . . . . . . . . . . . . . . 6,498 6,055 6,014Operating expenses:
Selling, general, and administrative . . . . . . . . . . . . . . . . . . . . . . . . . . . . . . . . . 4,144 3,936 3,697Depreciation and amortization . . . . . . . . . . . . . . . . . . . . . . . . . . . . . . . . . . . . . 590 541 452Preopening expenses . . . . . . . . . . . . . . . . . . . . . . . . . . . . . . . . . . . . . . . . . . . . 52 42 61
Operating income . . . . . . . . . . . . . . . . . . . . . . . . . . . . . . . . . . . . . . . . . . . . . . . . . . . 1,712 1,536 1,804Other expense (income):
Interest expense . . . . . . . . . . . . . . . . . . . . . . . . . . . . . . . . . . . . . . . . . . . . . . . . 134 132 82Interest income . . . . . . . . . . . . . . . . . . . . . . . . . . . . . . . . . . . . . . . . . . . . . . . . . (10) (21) (20)
Income before income taxes . . . . . . . . . . . . . . . . . . . . . . . . . . . . . . . . . . . . . . . . . . . 1,588 1,425 1,742Provision for income taxes . . . . . . . . . . . . . . . . . . . . . . . . . . . . . . . . . . . . . . . . . . . . 597 540 658
Net income . . . . . . . . . . . . . . . . . . . . . . . . . . . . . . . . . . . . . . . . . . . . . . . . . . . . . . . . $ 991 $ 885 $ 1,084
Net income per share:Basic . . . . . . . . . . . . . . . . . . . . . . . . . . . . . . . . . . . . . . . . . . . . . . . . . . . . . . . . . $ 3.25 $ 2.89 $ 3.41Diluted . . . . . . . . . . . . . . . . . . . . . . . . . . . . . . . . . . . . . . . . . . . . . . . . . . . . . . . $ 3.23 $ 2.89 $ 3.39
See accompanying Notes to Consolidated Financial Statements
F-4
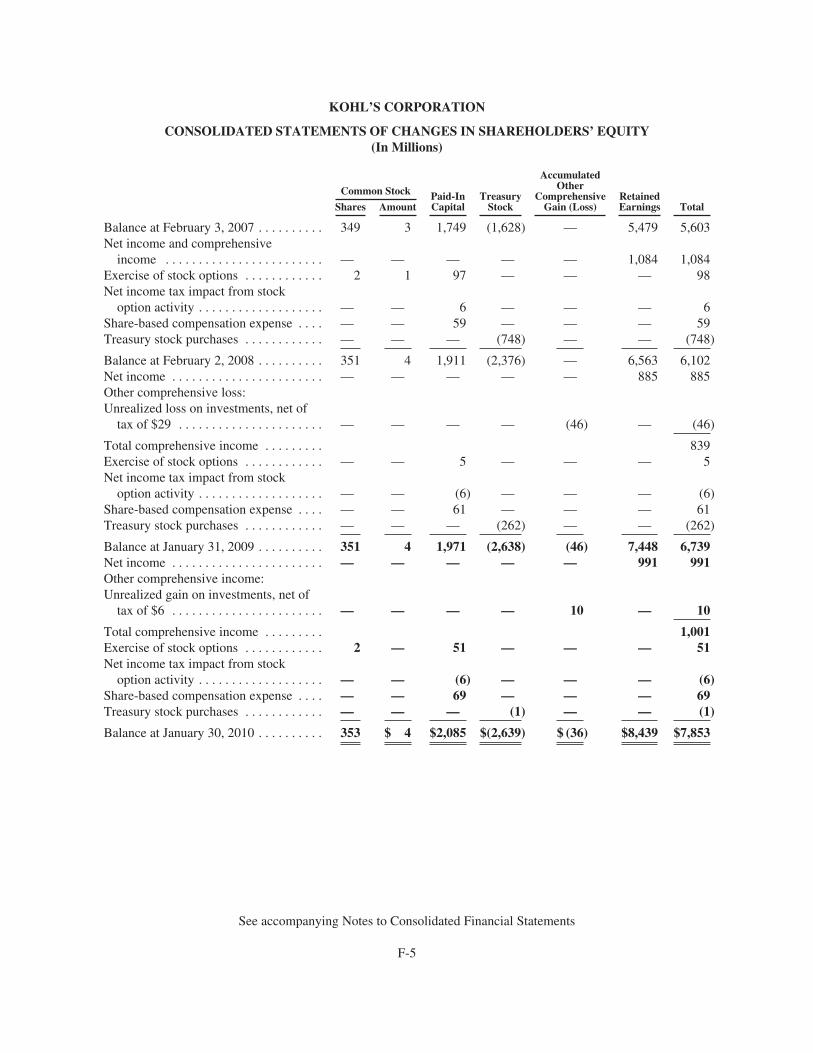
KOHL’S CORPORATION
CONSOLIDATED STATEMENTS OF CHANGES IN SHAREHOLDERS’ EQUITY(In Millions)
Common Stock Paid-InCapital
TreasuryStock
AccumulatedOther
ComprehensiveGain (Loss)
RetainedEarnings TotalShares Amount
Balance at February 3, 2007 . . . . . . . . . . 349 3 1,749 (1,628) — 5,479 5,603Net income and comprehensive
income . . . . . . . . . . . . . . . . . . . . . . . . — — — — — 1,084 1,084Exercise of stock options . . . . . . . . . . . . 2 1 97 — — — 98Net income tax impact from stock
option activity . . . . . . . . . . . . . . . . . . . — — 6 — — — 6Share-based compensation expense . . . . — — 59 — — — 59Treasury stock purchases . . . . . . . . . . . . — — — (748) — — (748)
Balance at February 2, 2008 . . . . . . . . . . 351 4 1,911 (2,376) — 6,563 6,102Net income . . . . . . . . . . . . . . . . . . . . . . . — — — — — 885 885Other comprehensive loss:Unrealized loss on investments, net of
tax of $29 . . . . . . . . . . . . . . . . . . . . . . — — — — (46) — (46)
Total comprehensive income . . . . . . . . . 839Exercise of stock options . . . . . . . . . . . . — — 5 — — — 5Net income tax impact from stock
option activity . . . . . . . . . . . . . . . . . . . — — (6) — — — (6)Share-based compensation expense . . . . — — 61 — — — 61Treasury stock purchases . . . . . . . . . . . . — — — (262) — — (262)
Balance at January 31, 2009 . . . . . . . . . . 351 4 1,971 (2,638) (46) 7,448 6,739Net income . . . . . . . . . . . . . . . . . . . . . . . — — — — — 991 991Other comprehensive income:Unrealized gain on investments, net of
tax of $6 . . . . . . . . . . . . . . . . . . . . . . . — — — — 10 — 10
Total comprehensive income . . . . . . . . . 1,001Exercise of stock options . . . . . . . . . . . . 2 — 51 — — — 51Net income tax impact from stock
option activity . . . . . . . . . . . . . . . . . . . — — (6) — — — (6)Share-based compensation expense . . . . — — 69 — — — 69Treasury stock purchases . . . . . . . . . . . . — — — (1) — — (1)
Balance at January 30, 2010 . . . . . . . . . . 353 $ 4 $2,085 $(2,639) $ (36) $8,439 $7,853
See accompanying Notes to Consolidated Financial Statements
F-5
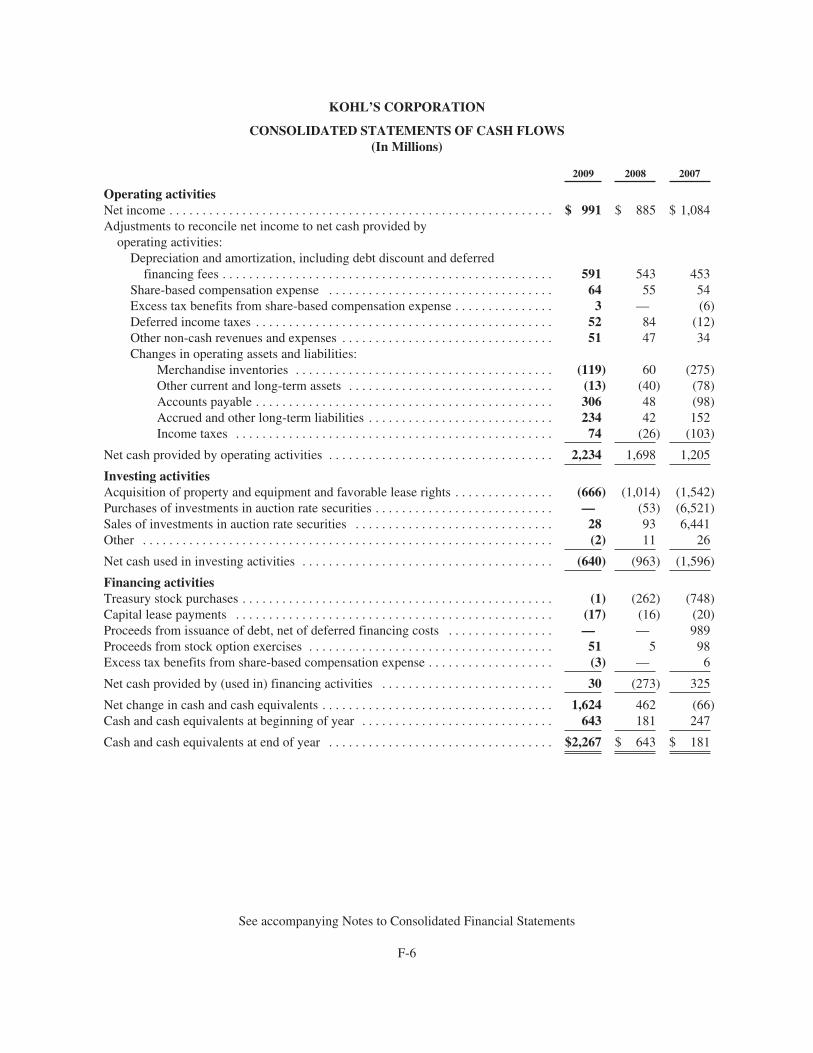
KOHL’S CORPORATION
CONSOLIDATED STATEMENTS OF CASH FLOWS(In Millions)
2009 2008 2007
Operating activitiesNet income . . . . . . . . . . . . . . . . . . . . . . . . . . . . . . . . . . . . . . . . . . . . . . . . . . . . . . . . . . $ 991 $ 885 $ 1,084Adjustments to reconcile net income to net cash provided by
operating activities:Depreciation and amortization, including debt discount and deferred
financing fees . . . . . . . . . . . . . . . . . . . . . . . . . . . . . . . . . . . . . . . . . . . . . . . . . . 591 543 453Share-based compensation expense . . . . . . . . . . . . . . . . . . . . . . . . . . . . . . . . . . 64 55 54Excess tax benefits from share-based compensation expense . . . . . . . . . . . . . . . 3 — (6)Deferred income taxes . . . . . . . . . . . . . . . . . . . . . . . . . . . . . . . . . . . . . . . . . . . . . 52 84 (12)Other non-cash revenues and expenses . . . . . . . . . . . . . . . . . . . . . . . . . . . . . . . . 51 47 34Changes in operating assets and liabilities:
Merchandise inventories . . . . . . . . . . . . . . . . . . . . . . . . . . . . . . . . . . . . . . . (119) 60 (275)Other current and long-term assets . . . . . . . . . . . . . . . . . . . . . . . . . . . . . . . (13) (40) (78)Accounts payable . . . . . . . . . . . . . . . . . . . . . . . . . . . . . . . . . . . . . . . . . . . . . 306 48 (98)Accrued and other long-term liabilities . . . . . . . . . . . . . . . . . . . . . . . . . . . . 234 42 152Income taxes . . . . . . . . . . . . . . . . . . . . . . . . . . . . . . . . . . . . . . . . . . . . . . . . 74 (26) (103)
Net cash provided by operating activities . . . . . . . . . . . . . . . . . . . . . . . . . . . . . . . . . . 2,234 1,698 1,205
Investing activitiesAcquisition of property and equipment and favorable lease rights . . . . . . . . . . . . . . . (666) (1,014) (1,542)Purchases of investments in auction rate securities . . . . . . . . . . . . . . . . . . . . . . . . . . . — (53) (6,521)Sales of investments in auction rate securities . . . . . . . . . . . . . . . . . . . . . . . . . . . . . . 28 93 6,441Other . . . . . . . . . . . . . . . . . . . . . . . . . . . . . . . . . . . . . . . . . . . . . . . . . . . . . . . . . . . . . . (2) 11 26
Net cash used in investing activities . . . . . . . . . . . . . . . . . . . . . . . . . . . . . . . . . . . . . . (640) (963) (1,596)
Financing activitiesTreasury stock purchases . . . . . . . . . . . . . . . . . . . . . . . . . . . . . . . . . . . . . . . . . . . . . . . (1) (262) (748)Capital lease payments . . . . . . . . . . . . . . . . . . . . . . . . . . . . . . . . . . . . . . . . . . . . . . . . (17) (16) (20)Proceeds from issuance of debt, net of deferred financing costs . . . . . . . . . . . . . . . . — — 989Proceeds from stock option exercises . . . . . . . . . . . . . . . . . . . . . . . . . . . . . . . . . . . . . 51 5 98Excess tax benefits from share-based compensation expense . . . . . . . . . . . . . . . . . . . (3) — 6
Net cash provided by (used in) financing activities . . . . . . . . . . . . . . . . . . . . . . . . . . 30 (273) 325
Net change in cash and cash equivalents . . . . . . . . . . . . . . . . . . . . . . . . . . . . . . . . . . . 1,624 462 (66)Cash and cash equivalents at beginning of year . . . . . . . . . . . . . . . . . . . . . . . . . . . . . 643 181 247
Cash and cash equivalents at end of year . . . . . . . . . . . . . . . . . . . . . . . . . . . . . . . . . . $2,267 $ 643 $ 181
See accompanying Notes to Consolidated Financial Statements
F-6
KOHL’S CORPORATION
NOTES TO CONSOLIDATED FINANCIAL STATEMENTS
1. Business and Summary of Accounting Policies
Business
As of January 30, 2010, Kohl’s Corporation operated 1,058 family-oriented department stores that featureexclusive and national brand apparel, footwear, accessories, soft home products and housewares targeted tomiddle-income customers. Our stores are located in 49 states.
Our authorized capital stock consists of 800 million shares of $0.01 par value common stock and 10 millionshares of $0.01 par value preferred stock.
Consolidation
The consolidated financial statements include the accounts of Kohl’s Corporation and its subsidiariesincluding Kohl’s Department Stores, Inc., its primary operating company. All intercompany accounts andtransactions have been eliminated.
Accounting Period
Our fiscal year ends on the Saturday closest to January 31. Unless otherwise noted, references to years inthis report relate to fiscal years, rather than to calendar years. Fiscal year 2009 (“2009”) ended on January 30,2010. Fiscal year 2008 (“2008”) ended on January 31, 2009. Fiscal year 2007 (“2007”) ended on February 2,2008. Fiscal 2009, 2008 and 2007 were 52-week years.
Use of Estimates
The preparation of consolidated financial statements in conformity with accounting principles generallyaccepted in the United States requires management to make estimates and assumptions that affect the amountsreported in the consolidated financial statements and accompanying notes. Actual results could differ from thoseestimates.
Reclassifications
Certain reclassifications have been made to the prior period Consolidated Balance Sheets and Statements ofCash Flows to conform to the 2009 presentation.
Cash and Cash Equivalents
In addition to money market investments, cash equivalents include commercial paper with an originalmaturity of three months or less. We carry these investments at cost which approximates fair value.
Also included in cash and cash equivalents are amounts due from credit card transactions with settlementterms of less than five days. Credit and debit card receivables included within cash were $68 million atJanuary 30, 2010 and $71 million at January 31, 2009.
Long-term Investments
Long-term investments consist primarily of investments in auction rate securities (“ARS”) which areclassified as available-for-sale securities and recorded at market.
F-7
KOHL’S CORPORATION
NOTES TO CONSOLIDATED FINANCIAL STATEMENTS—(Continued)
1. Business and Summary of Accounting Policies (continued)
Merchandise Inventories
Merchandise inventories are valued at the lower of cost or market with cost determined on the first-in,first-out (“FIFO”) basis using the retail inventory method (“RIM”). Under RIM, the valuation of inventory at costand the resulting gross margins are calculated by applying a cost-to-retail ratio to the retail value inventory. RIMis an averaging method that has been widely used in the retail industry due to its practicality. The use of RIM willresult in inventory being valued at the lower of cost or market since permanent markdowns are currently taken asa reduction of the retail value of inventory. We record an additional reserve when the future estimated sellingprice is less than cost.
Property and Equipment
Property and equipment consist of the following:
Jan. 30,2010
Jan. 31,2009
(In Millions)
Land . . . . . . . . . . . . . . . . . . . . . . . . . . . . . . . . . . . . . . . . . . . . . . . . . . . . $ 1,040 $ 997Buildings and improvements . . . . . . . . . . . . . . . . . . . . . . . . . . . . . . . . . 5,887 5,490Store fixtures and equipment . . . . . . . . . . . . . . . . . . . . . . . . . . . . . . . . . 2,169 2,135Property under capital leases . . . . . . . . . . . . . . . . . . . . . . . . . . . . . . . . . 242 233Construction in progress . . . . . . . . . . . . . . . . . . . . . . . . . . . . . . . . . . . . . 138 257Capitalized software . . . . . . . . . . . . . . . . . . . . . . . . . . . . . . . . . . . . . . . . 395 337
Total property and equipment . . . . . . . . . . . . . . . . . . . . . . . . . . . . . . . . 9,871 9,449Less accumulated depreciation . . . . . . . . . . . . . . . . . . . . . . . . . . . . . . . . (2,853) (2,465)
$ 7,018 $ 6,984
Construction in progress includes land and improvements for locations not yet opened and for the expansionand remodeling of existing locations in process at the end of each year.
Property and equipment is recorded at cost, less accumulated depreciation. Depreciation is calculated usingthe straight-line method over the estimated useful lives of the assets. Property rights under capital leases andimprovements to leased property are amortized on a straight-line basis over the term of the lease or useful life ofthe asset, whichever is less. Depreciation and amortization expense for property and equipment, includingproperty under capital leases and capitalized software, totaled $580 million for 2009, $528 million for 2008 and$441 million for 2007.
The annual provisions for depreciation and amortization generally use the following ranges of useful lives:
Buildings and improvements . . . . . . . . . . . . . . . . . . . . . . . . . . . . . . . . . . . . . . . . 8-40 yearsStore fixtures and equipment . . . . . . . . . . . . . . . . . . . . . . . . . . . . . . . . . . . . . . . . 3-15 yearsProperty under capital leases . . . . . . . . . . . . . . . . . . . . . . . . . . . . . . . . . . . . . . . . 5-40 yearsComputer hardware and software . . . . . . . . . . . . . . . . . . . . . . . . . . . . . . . . . . . . . 3-8 years
Property and equipment acquired through capital leases totaled $14 million for 2009, $18 million for 2008and $29 million for 2007.
F-8

KOHL’S CORPORATION
NOTES TO CONSOLIDATED FINANCIAL STATEMENTS—(Continued)
1. Business and Summary of Accounting Policies (continued)
Capitalized Interest
We capitalize interest on the acquisition and construction of new locations and expansion of existinglocations and depreciate that amount over the lives of the related assets. Capitalized interest was $5 million for2009, $8 million for 2008 and $16 million for 2007.
Favorable Lease Rights
Favorable lease rights are generally amortized on a straight-line basis over the remaining base lease termplus certain options with a maximum of 50 years. Amortization begins when the respective stores are opened.Accumulated amortization was $119 million at January 30, 2010 and $108 million at January 31, 2009.Amortization expense was $10 million for 2009, $13 million for 2008 and $12 million for 2007. Amortizationexpense for current favorable lease rights is estimated to be $11 million per year for each of the next three yearsand $10 million per year for 2013 and 2014.
Long-Lived Assets
All property and equipment and other long-lived assets (including favorable lease rights, trademarks andgoodwill) are reviewed when events or changes in circumstances indicate that the asset’s carrying value may notbe recoverable. If such indicators are present, it is determined whether the sum of the estimated undiscountedfuture cash flows attributable to such assets is less than their carrying amounts. No material impairments wererecorded in 2009, 2008, or 2007 as a result of the tests performed.
Accrued Liabilities
Accrued liabilities consist of the following:
Jan. 30,2010
Jan. 31,2009
(In Millions)
Various liabilities to customers . . . . . . . . . . . . . . . . . . . . . . . . . . . . . . . . . $ 221 $200Payroll and related fringe benefits . . . . . . . . . . . . . . . . . . . . . . . . . . . . . . . 201 94Sales, property and use taxes . . . . . . . . . . . . . . . . . . . . . . . . . . . . . . . . . . . 156 131Due to JPMorgan Chase . . . . . . . . . . . . . . . . . . . . . . . . . . . . . . . . . . . . . . 121 85Accrued construction costs . . . . . . . . . . . . . . . . . . . . . . . . . . . . . . . . . . . . 76 116Accrued interest . . . . . . . . . . . . . . . . . . . . . . . . . . . . . . . . . . . . . . . . . . . . . 22 22Other . . . . . . . . . . . . . . . . . . . . . . . . . . . . . . . . . . . . . . . . . . . . . . . . . . . . . 205 193
$1,002 $841
The various liabilities to customers include gift cards and merchandise return cards that have been issuedbut not presented for redemption.
Self-Insurance
We use a combination of insurance and self-insurance for a number of risks including workers’compensation, general liability and employee-related health care benefits, a portion of which is paid by ourassociates. Liabilities associated with these losses include estimates of both reported losses and losses incurred
F-9
KOHL’S CORPORATION
NOTES TO CONSOLIDATED FINANCIAL STATEMENTS—(Continued)
1. Business and Summary of Accounting Policies (continued)
but not yet reported. We use a third-party actuary, which considers historical claims experience, demographicfactors, severity factors and other actuarial assumptions, to estimate the liabilities associated with these risks. Weretain the initial risk of $500,000 per occurrence under our workers’ compensation insurance policy and$250,000 per occurrence under our general liability policy. We also have a lifetime medical payment limit of$1.5 million per plan participant. Total estimated liabilities for workers’ compensation, general liability andemployee-related health benefits, excluding administrative expenses and before pre-funding, were approximately$85 million at January 30, 2010 and $81 million at January 31, 2009. Although these amounts are actuariallydetermined based on analysis of historical trends, the amounts that we will ultimately disburse could differ fromthese estimates.
Long-term Liabilities
Other long-term liabilities consist of the following:
Jan. 30,2010
Jan. 31,2009
(In Millions)
Property-related liabilities . . . . . . . . . . . . . . . . . . . . . . . . . . . . . . . . . . . . . $311 $250Unrecognized tax benefits, including accrued interest and penalties . . . . 114 115Deferred compensation . . . . . . . . . . . . . . . . . . . . . . . . . . . . . . . . . . . . . . . 35 29Other . . . . . . . . . . . . . . . . . . . . . . . . . . . . . . . . . . . . . . . . . . . . . . . . . . . . . . 28 13
$488 $407
Treasury Stock
We account for repurchases of common stock using the cost method with common stock in treasuryclassified in the Consolidated Balance Sheets as a reduction of shareholders’ equity.
Revenue Recognition
Revenue from the sale of merchandise at our stores is recognized at the time of sale, net of any returns.E-commerce sales are recorded based on estimated receipt of merchandise by the customer. Net sales do notinclude sales tax as we are considered a pass-through conduit for collecting and remitting sales taxes.
Revenue from gift card sales is recognized when the gift card is redeemed. Gift card breakage revenue isbased on historical redemption patterns and represents the balance of gift cards for which we believe thelikelihood of redemption by a customer is remote.
F-10
KOHL’S CORPORATION
NOTES TO CONSOLIDATED FINANCIAL STATEMENTS—(Continued)
1. Business and Summary of Accounting Policies (continued)
Cost of Merchandise Sold and Selling, General and Administrative Expenses
The following table illustrates the primary costs classified in Cost of Merchandise Sold and Selling, Generaland Administrative Expenses:
Cost of Merchandise SoldSelling, General and
Administrative Expenses
• Total cost of products sold including productdevelopment costs, net of vendor payments otherthan reimbursement of specific, incremental andidentifiable costs
• Inventory shrink
• Markdowns
• Freight expenses associated with movingmerchandise from our vendors to our distributioncenters
• Shipping and handling expenses of e-commercesales
• Terms cash discount
• Compensation and benefit costs including:
• Stores
• Corporate headquarters, including buyingand merchandising
• Distribution centers
• Occupancy and operating costs of our retail,distribution and corporate facilities
• Net revenues from the Kohl’s credit cardagreement with JPMorgan Chase
• Freight expenses associated with movingmerchandise from our distribution centers to ourretail stores, and among distribution and retailfacilities
• Advertising expenses, offset by vendorpayments for reimbursement of specific,incremental and identifiable costs
• Other administrative costs
The classification of these expenses varies across the retail industry.
Vendor Allowances
We receive consideration for a variety of vendor-sponsored programs, such as markdown allowances,volume rebates and promotion and advertising support. The vendor consideration is recorded either as areduction of inventory costs or Selling, General and Administrative (“SG&A”) expenses based on the applicationof Accounting Standards Codification (“ASC”) No. 605, Subtopic 50, “Customer Payments and Incentives.”Promotional and advertising allowances are intended to offset our advertising costs to promote vendors’merchandise. Markdown allowances and volume rebates are recorded as a reduction of inventory costs.
Advertising
Advertising costs, which include primarily television and radio broadcast, direct mail, and newspapercirculars, are expensed when the advertisement is first seen. Advertising costs, net of related vendor allowances,were as follows:
2009 2008 2007
(In Millions)Gross advertising costs . . . . . . . . . . . . . . . . . . . . . . . . . . . . . . . . . . $988 $1,037 $981Vendor allowances . . . . . . . . . . . . . . . . . . . . . . . . . . . . . . . . . . . . . 142 147 142
Net advertising costs . . . . . . . . . . . . . . . . . . . . . . . . . . . . . . . . . . . $846 $ 890 $839
F-11
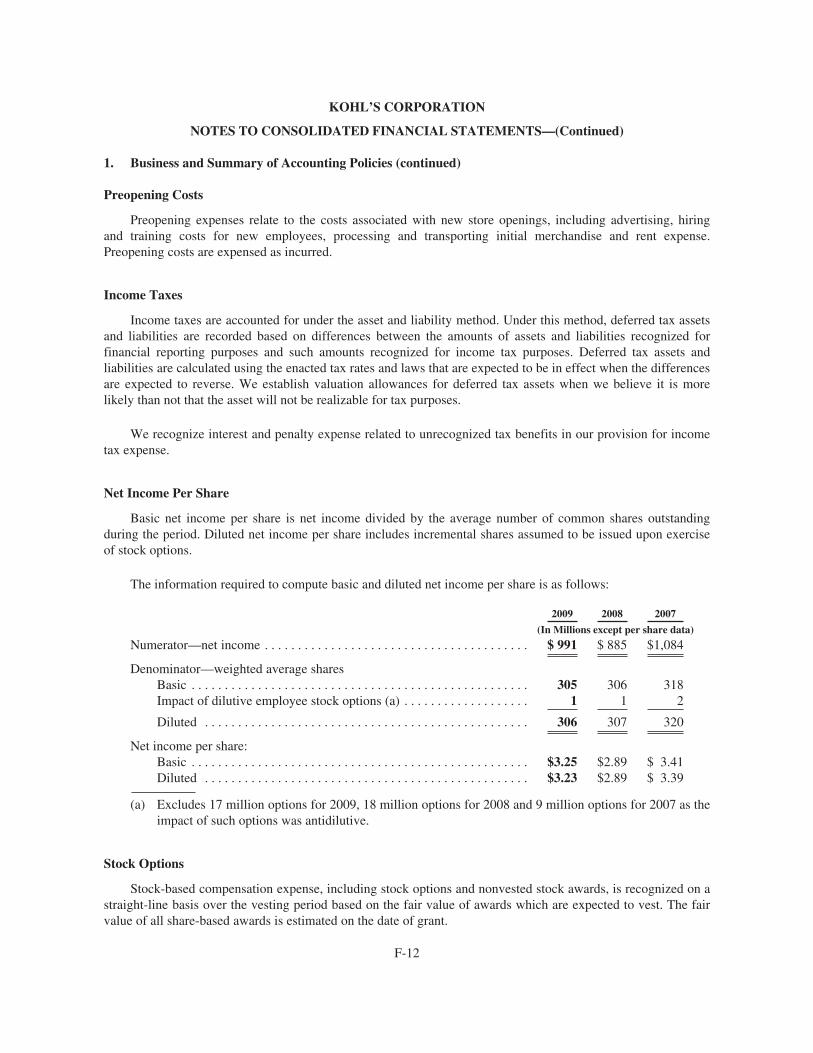
KOHL’S CORPORATION
NOTES TO CONSOLIDATED FINANCIAL STATEMENTS—(Continued)
1. Business and Summary of Accounting Policies (continued)
Preopening Costs
Preopening expenses relate to the costs associated with new store openings, including advertising, hiringand training costs for new employees, processing and transporting initial merchandise and rent expense.Preopening costs are expensed as incurred.
Income Taxes
Income taxes are accounted for under the asset and liability method. Under this method, deferred tax assetsand liabilities are recorded based on differences between the amounts of assets and liabilities recognized forfinancial reporting purposes and such amounts recognized for income tax purposes. Deferred tax assets andliabilities are calculated using the enacted tax rates and laws that are expected to be in effect when the differencesare expected to reverse. We establish valuation allowances for deferred tax assets when we believe it is morelikely than not that the asset will not be realizable for tax purposes.
We recognize interest and penalty expense related to unrecognized tax benefits in our provision for incometax expense.
Net Income Per Share
Basic net income per share is net income divided by the average number of common shares outstandingduring the period. Diluted net income per share includes incremental shares assumed to be issued upon exerciseof stock options.
The information required to compute basic and diluted net income per share is as follows:
2009 2008 2007
(In Millions except per share data)
Numerator—net income . . . . . . . . . . . . . . . . . . . . . . . . . . . . . . . . . . . . . . . . $ 991 $ 885 $1,084
Denominator—weighted average sharesBasic . . . . . . . . . . . . . . . . . . . . . . . . . . . . . . . . . . . . . . . . . . . . . . . . . . . 305 306 318Impact of dilutive employee stock options (a) . . . . . . . . . . . . . . . . . . . 1 1 2
Diluted . . . . . . . . . . . . . . . . . . . . . . . . . . . . . . . . . . . . . . . . . . . . . . . . . 306 307 320
Net income per share:Basic . . . . . . . . . . . . . . . . . . . . . . . . . . . . . . . . . . . . . . . . . . . . . . . . . . . $3.25 $2.89 $ 3.41Diluted . . . . . . . . . . . . . . . . . . . . . . . . . . . . . . . . . . . . . . . . . . . . . . . . . $3.23 $2.89 $ 3.39
(a) Excludes 17 million options for 2009, 18 million options for 2008 and 9 million options for 2007 as theimpact of such options was antidilutive.
Stock Options
Stock-based compensation expense, including stock options and nonvested stock awards, is recognized on astraight-line basis over the vesting period based on the fair value of awards which are expected to vest. The fairvalue of all share-based awards is estimated on the date of grant.
F-12
KOHL’S CORPORATION
NOTES TO CONSOLIDATED FINANCIAL STATEMENTS—(Continued)
2. Long-term Investments
As of January 30, 2010, the par value of our long-term investments was $380 million and the estimated fairvalue was $321 million. Our auction rate securities (“ARS”) portfolio consists entirely of highly-rated, insuredstudent loan backed securities. Substantially all of the principal and interest is insured by the federal governmentand the remainder is insured by highly-rated insurance companies. Approximately $224 million of our ARS (atfair value) are rated “AAA” by Moody’s, Standard & Poor’s and/or Fitch Ratings.
Beginning in February 2008, liquidity issues in the global credit markets resulted in the failure of auctionsfor all of our ARS. A “failed” auction occurs when the amount of securities submitted for sale in the auctionexceeds the amount of purchase bids. As a result, holders are unable to liquidate their investment through theauction. A failed auction is not a default of the debt instrument, but does set a new interest rate in accordancewith the terms of the debt instrument. A failed auction limits liquidity for holders until there is a successfulauction or until such time as another market for ARS develops. ARS are generally callable by the issuer at anytime. Scheduled auctions continue to be held until the ARS matures or is called.
To date, we have collected all interest payable on outstanding ARS when due and expect to continue to doso in the future. At this time, we have no reason to believe that any of the underlying issuers of our ARS or theirinsurers are presently at risk or that the reduced liquidity has had a significant impact on the underlying creditquality of the assets backing our ARS. While the auction failures limit our ability to liquidate these investments,we do not believe these failures will have any significant impact on our ability to fund ongoing operations andgrowth initiatives.
We intend to hold these ARS until maturity or until we can liquidate them at par value. Based on our othersources of liquidity, we do not believe we will be required to sell them before recovery of par value. Therefore,impairment charges are considered temporary and have been included in Accumulated Other ComprehensiveLoss within our Consolidated Balance Sheets at January 30, 2010 and January 31, 2009. In certain cases, holdingthe investments until recovery may mean until maturity, which ranges from 2015 to 2056. The weighted-averagematurity date is 2036. As a result of the persistent failed auctions and the uncertainty of when these investmentscould be successfully liquidated at par, we have recorded all of our ARS as Long-term Investments within theConsolidated Balance Sheet.
ASC No. 820, “Fair Value Measurements and Disclosures,” requires fair value measurements be classifiedand disclosed in one of the following three categories:
Level 1: Financial instruments with unadjusted, quoted prices listed on active market exchanges.
Level 2: Financial instruments lacking unadjusted, quoted prices from active market exchanges,including over-the-counter traded financial instruments. The prices for the financialinstruments are determined using prices for recently traded financial instruments withsimilar underlying terms as well as directly or indirectly observable inputs, such as interestrates and yield curves that are observable at commonly quoted intervals.
Level 3: Financial instruments that are not actively traded on a market exchange. This categoryincludes situations where there is little, if any, market activity for the financial instrument.The prices are determined using significant unobservable inputs or valuation techniques.
The fair value for our ARS is based on third-party pricing models and is classified as a Level 3 pricingcategory. We utilized a discounted cash flow model to estimate the current fair market value for each of the
F-13
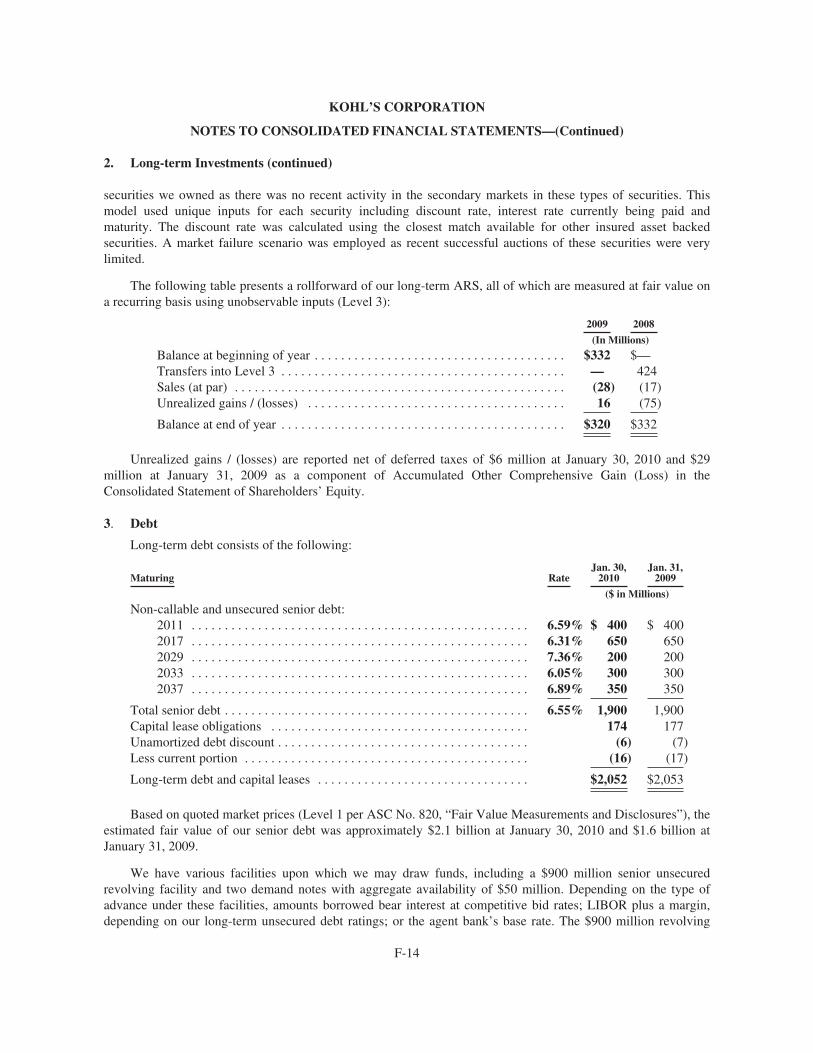
KOHL’S CORPORATION
NOTES TO CONSOLIDATED FINANCIAL STATEMENTS—(Continued)
2. Long-term Investments (continued)
securities we owned as there was no recent activity in the secondary markets in these types of securities. Thismodel used unique inputs for each security including discount rate, interest rate currently being paid andmaturity. The discount rate was calculated using the closest match available for other insured asset backedsecurities. A market failure scenario was employed as recent successful auctions of these securities were verylimited.
The following table presents a rollforward of our long-term ARS, all of which are measured at fair value ona recurring basis using unobservable inputs (Level 3):
2009 2008
(In Millions)
Balance at beginning of year . . . . . . . . . . . . . . . . . . . . . . . . . . . . . . . . . . . . . . $332 $—Transfers into Level 3 . . . . . . . . . . . . . . . . . . . . . . . . . . . . . . . . . . . . . . . . . . . — 424Sales (at par) . . . . . . . . . . . . . . . . . . . . . . . . . . . . . . . . . . . . . . . . . . . . . . . . . . (28) (17)Unrealized gains / (losses) . . . . . . . . . . . . . . . . . . . . . . . . . . . . . . . . . . . . . . . 16 (75)
Balance at end of year . . . . . . . . . . . . . . . . . . . . . . . . . . . . . . . . . . . . . . . . . . . $320 $332
Unrealized gains / (losses) are reported net of deferred taxes of $6 million at January 30, 2010 and $29million at January 31, 2009 as a component of Accumulated Other Comprehensive Gain (Loss) in theConsolidated Statement of Shareholders’ Equity.
3. Debt
Long-term debt consists of the following:
Maturing RateJan. 30,
2010Jan. 31,
2009
($ in Millions)
Non-callable and unsecured senior debt:2011 . . . . . . . . . . . . . . . . . . . . . . . . . . . . . . . . . . . . . . . . . . . . . . . . . . . 6.59% $ 400 $ 4002017 . . . . . . . . . . . . . . . . . . . . . . . . . . . . . . . . . . . . . . . . . . . . . . . . . . . 6.31% 650 6502029 . . . . . . . . . . . . . . . . . . . . . . . . . . . . . . . . . . . . . . . . . . . . . . . . . . . 7.36% 200 2002033 . . . . . . . . . . . . . . . . . . . . . . . . . . . . . . . . . . . . . . . . . . . . . . . . . . . 6.05% 300 3002037 . . . . . . . . . . . . . . . . . . . . . . . . . . . . . . . . . . . . . . . . . . . . . . . . . . . 6.89% 350 350
Total senior debt . . . . . . . . . . . . . . . . . . . . . . . . . . . . . . . . . . . . . . . . . . . . . . 6.55% 1,900 1,900Capital lease obligations . . . . . . . . . . . . . . . . . . . . . . . . . . . . . . . . . . . . . . . 174 177Unamortized debt discount . . . . . . . . . . . . . . . . . . . . . . . . . . . . . . . . . . . . . . (6) (7)Less current portion . . . . . . . . . . . . . . . . . . . . . . . . . . . . . . . . . . . . . . . . . . . (16) (17)
Long-term debt and capital leases . . . . . . . . . . . . . . . . . . . . . . . . . . . . . . . . $2,052 $2,053
Based on quoted market prices (Level 1 per ASC No. 820, “Fair Value Measurements and Disclosures”), theestimated fair value of our senior debt was approximately $2.1 billion at January 30, 2010 and $1.6 billion atJanuary 31, 2009.
We have various facilities upon which we may draw funds, including a $900 million senior unsecuredrevolving facility and two demand notes with aggregate availability of $50 million. Depending on the type ofadvance under these facilities, amounts borrowed bear interest at competitive bid rates; LIBOR plus a margin,depending on our long-term unsecured debt ratings; or the agent bank’s base rate. The $900 million revolving
F-14
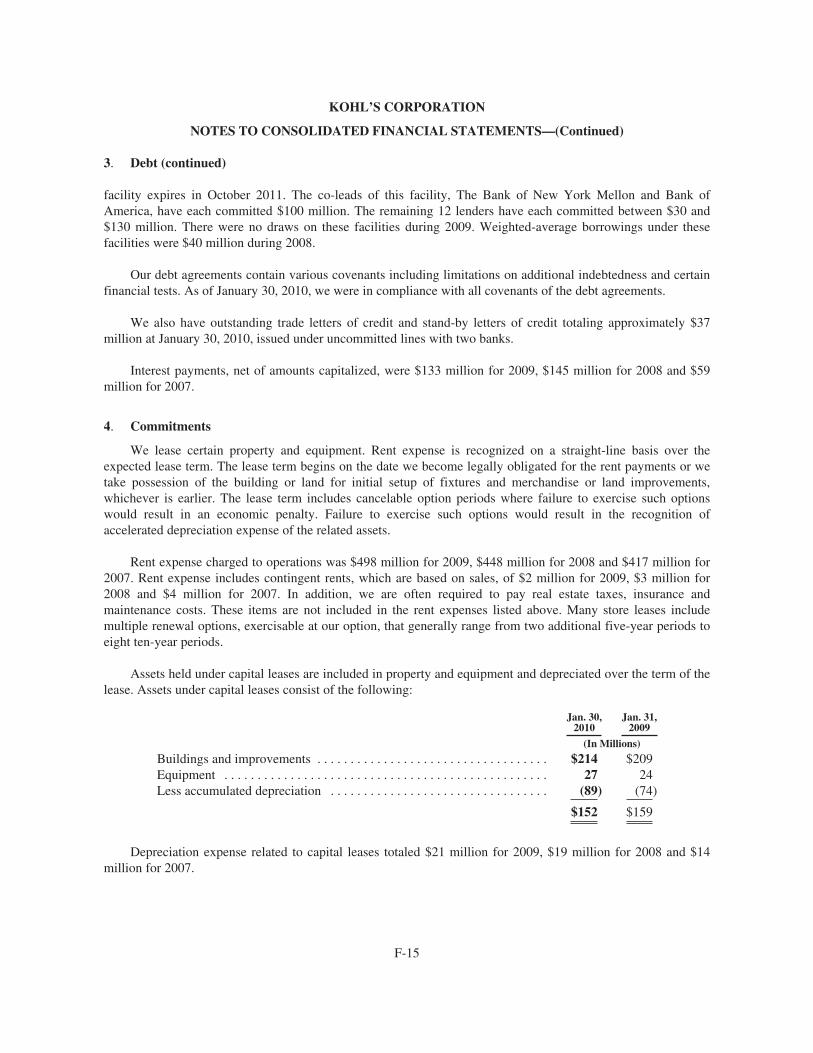
KOHL’S CORPORATION
NOTES TO CONSOLIDATED FINANCIAL STATEMENTS—(Continued)
3. Debt (continued)
facility expires in October 2011. The co-leads of this facility, The Bank of New York Mellon and Bank ofAmerica, have each committed $100 million. The remaining 12 lenders have each committed between $30 and$130 million. There were no draws on these facilities during 2009. Weighted-average borrowings under thesefacilities were $40 million during 2008.
Our debt agreements contain various covenants including limitations on additional indebtedness and certainfinancial tests. As of January 30, 2010, we were in compliance with all covenants of the debt agreements.
We also have outstanding trade letters of credit and stand-by letters of credit totaling approximately $37million at January 30, 2010, issued under uncommitted lines with two banks.
Interest payments, net of amounts capitalized, were $133 million for 2009, $145 million for 2008 and $59million for 2007.
4. Commitments
We lease certain property and equipment. Rent expense is recognized on a straight-line basis over theexpected lease term. The lease term begins on the date we become legally obligated for the rent payments or wetake possession of the building or land for initial setup of fixtures and merchandise or land improvements,whichever is earlier. The lease term includes cancelable option periods where failure to exercise such optionswould result in an economic penalty. Failure to exercise such options would result in the recognition ofaccelerated depreciation expense of the related assets.
Rent expense charged to operations was $498 million for 2009, $448 million for 2008 and $417 million for2007. Rent expense includes contingent rents, which are based on sales, of $2 million for 2009, $3 million for2008 and $4 million for 2007. In addition, we are often required to pay real estate taxes, insurance andmaintenance costs. These items are not included in the rent expenses listed above. Many store leases includemultiple renewal options, exercisable at our option, that generally range from two additional five-year periods toeight ten-year periods.
Assets held under capital leases are included in property and equipment and depreciated over the term of thelease. Assets under capital leases consist of the following:
Jan. 30,2010
Jan. 31,2009
(In Millions)
Buildings and improvements . . . . . . . . . . . . . . . . . . . . . . . . . . . . . . . . . . . $214 $209Equipment . . . . . . . . . . . . . . . . . . . . . . . . . . . . . . . . . . . . . . . . . . . . . . . . . 27 24Less accumulated depreciation . . . . . . . . . . . . . . . . . . . . . . . . . . . . . . . . . (89) (74)
$152 $159
Depreciation expense related to capital leases totaled $21 million for 2009, $19 million for 2008 and $14million for 2007.
F-15
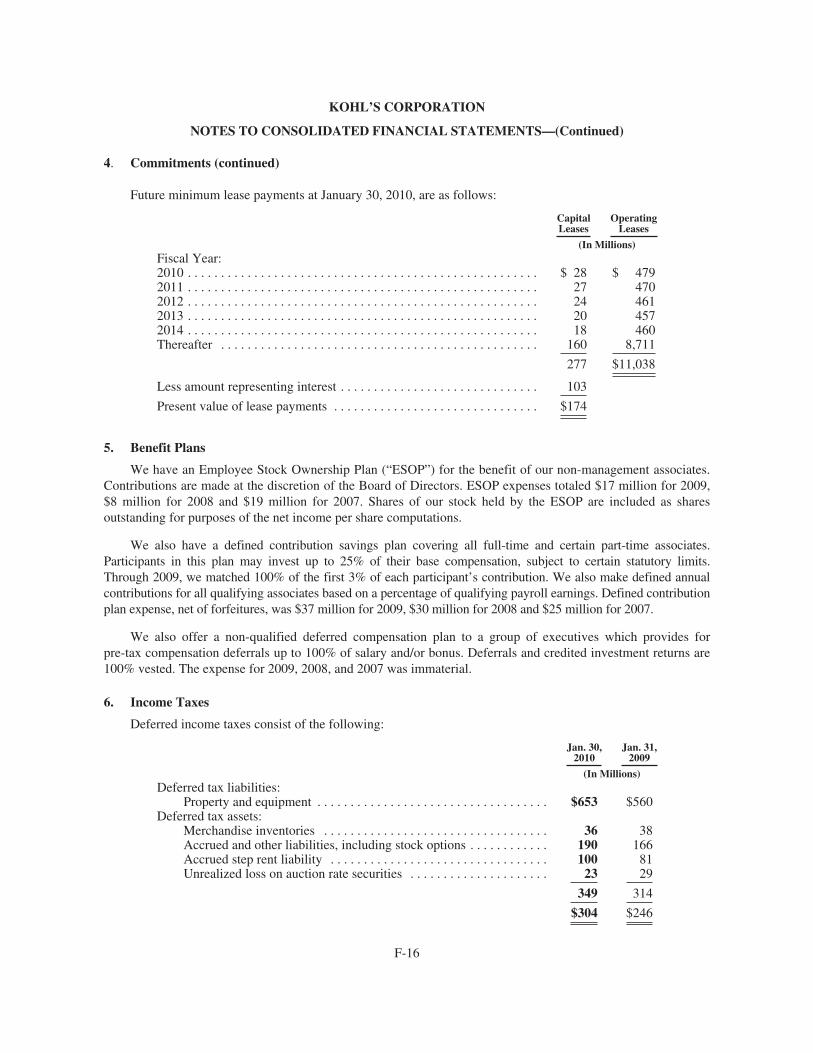
KOHL’S CORPORATION
NOTES TO CONSOLIDATED FINANCIAL STATEMENTS—(Continued)
4. Commitments (continued)
Future minimum lease payments at January 30, 2010, are as follows:
CapitalLeases
OperatingLeases
(In Millions)Fiscal Year:2010 . . . . . . . . . . . . . . . . . . . . . . . . . . . . . . . . . . . . . . . . . . . . . . . . . . . . . $ 28 $ 4792011 . . . . . . . . . . . . . . . . . . . . . . . . . . . . . . . . . . . . . . . . . . . . . . . . . . . . . 27 4702012 . . . . . . . . . . . . . . . . . . . . . . . . . . . . . . . . . . . . . . . . . . . . . . . . . . . . . 24 4612013 . . . . . . . . . . . . . . . . . . . . . . . . . . . . . . . . . . . . . . . . . . . . . . . . . . . . . 20 4572014 . . . . . . . . . . . . . . . . . . . . . . . . . . . . . . . . . . . . . . . . . . . . . . . . . . . . . 18 460Thereafter . . . . . . . . . . . . . . . . . . . . . . . . . . . . . . . . . . . . . . . . . . . . . . . . 160 8,711
277 $11,038
Less amount representing interest . . . . . . . . . . . . . . . . . . . . . . . . . . . . . . 103
Present value of lease payments . . . . . . . . . . . . . . . . . . . . . . . . . . . . . . . $174
5. Benefit Plans
We have an Employee Stock Ownership Plan (“ESOP”) for the benefit of our non-management associates.Contributions are made at the discretion of the Board of Directors. ESOP expenses totaled $17 million for 2009,$8 million for 2008 and $19 million for 2007. Shares of our stock held by the ESOP are included as sharesoutstanding for purposes of the net income per share computations.
We also have a defined contribution savings plan covering all full-time and certain part-time associates.Participants in this plan may invest up to 25% of their base compensation, subject to certain statutory limits.Through 2009, we matched 100% of the first 3% of each participant’s contribution. We also make defined annualcontributions for all qualifying associates based on a percentage of qualifying payroll earnings. Defined contributionplan expense, net of forfeitures, was $37 million for 2009, $30 million for 2008 and $25 million for 2007.
We also offer a non-qualified deferred compensation plan to a group of executives which provides forpre-tax compensation deferrals up to 100% of salary and/or bonus. Deferrals and credited investment returns are100% vested. The expense for 2009, 2008, and 2007 was immaterial.
6. Income Taxes
Deferred income taxes consist of the following:
Jan. 30,2010
Jan. 31,2009
(In Millions)Deferred tax liabilities:
Property and equipment . . . . . . . . . . . . . . . . . . . . . . . . . . . . . . . . . . . $653 $560Deferred tax assets:
Merchandise inventories . . . . . . . . . . . . . . . . . . . . . . . . . . . . . . . . . . 36 38Accrued and other liabilities, including stock options . . . . . . . . . . . . 190 166Accrued step rent liability . . . . . . . . . . . . . . . . . . . . . . . . . . . . . . . . . 100 81Unrealized loss on auction rate securities . . . . . . . . . . . . . . . . . . . . . 23 29
349 314
$304 $246
F-16
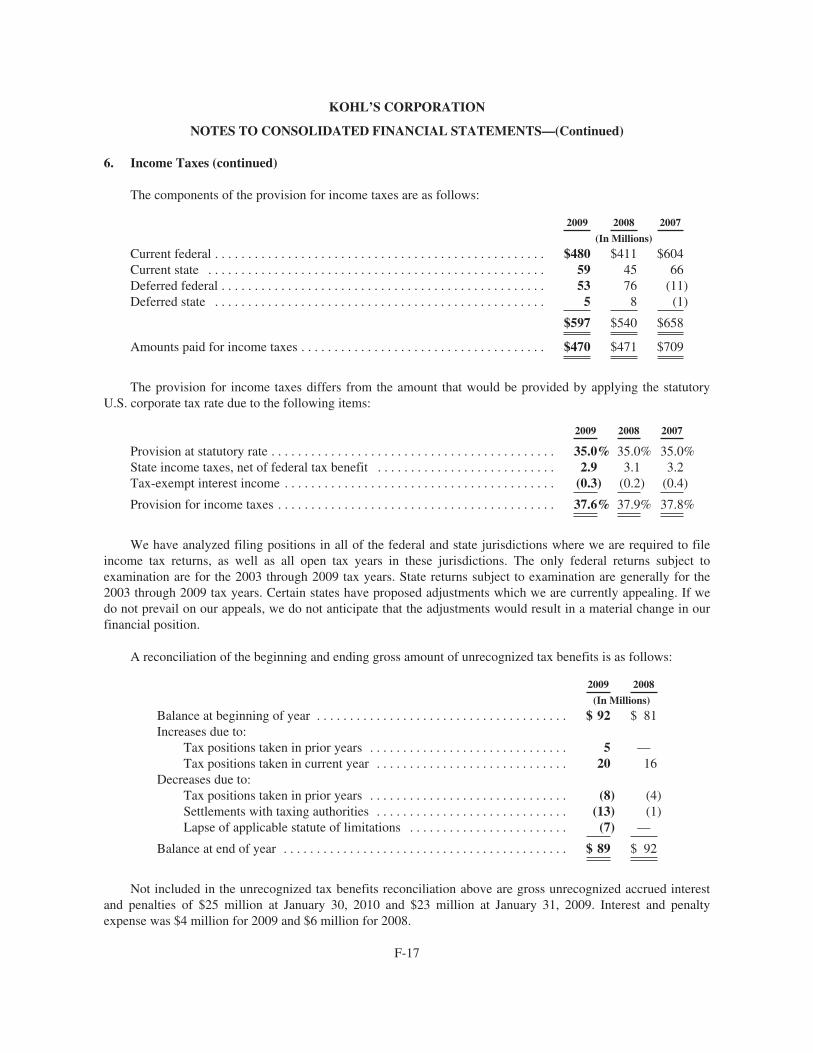
KOHL’S CORPORATION
NOTES TO CONSOLIDATED FINANCIAL STATEMENTS—(Continued)
6. Income Taxes (continued)
The components of the provision for income taxes are as follows:
2009 2008 2007
(In Millions)
Current federal . . . . . . . . . . . . . . . . . . . . . . . . . . . . . . . . . . . . . . . . . . . . . . . . . . $480 $411 $604Current state . . . . . . . . . . . . . . . . . . . . . . . . . . . . . . . . . . . . . . . . . . . . . . . . . . . 59 45 66Deferred federal . . . . . . . . . . . . . . . . . . . . . . . . . . . . . . . . . . . . . . . . . . . . . . . . . 53 76 (11)Deferred state . . . . . . . . . . . . . . . . . . . . . . . . . . . . . . . . . . . . . . . . . . . . . . . . . . 5 8 (1)
$597 $540 $658
Amounts paid for income taxes . . . . . . . . . . . . . . . . . . . . . . . . . . . . . . . . . . . . . $470 $471 $709
The provision for income taxes differs from the amount that would be provided by applying the statutoryU.S. corporate tax rate due to the following items:
2009 2008 2007
Provision at statutory rate . . . . . . . . . . . . . . . . . . . . . . . . . . . . . . . . . . . . . . . . . . . 35.0% 35.0% 35.0%State income taxes, net of federal tax benefit . . . . . . . . . . . . . . . . . . . . . . . . . . . 2.9 3.1 3.2Tax-exempt interest income . . . . . . . . . . . . . . . . . . . . . . . . . . . . . . . . . . . . . . . . . (0.3) (0.2) (0.4)
Provision for income taxes . . . . . . . . . . . . . . . . . . . . . . . . . . . . . . . . . . . . . . . . . . 37.6% 37.9% 37.8%
We have analyzed filing positions in all of the federal and state jurisdictions where we are required to fileincome tax returns, as well as all open tax years in these jurisdictions. The only federal returns subject toexamination are for the 2003 through 2009 tax years. State returns subject to examination are generally for the2003 through 2009 tax years. Certain states have proposed adjustments which we are currently appealing. If wedo not prevail on our appeals, we do not anticipate that the adjustments would result in a material change in ourfinancial position.
A reconciliation of the beginning and ending gross amount of unrecognized tax benefits is as follows:
2009 2008
(In Millions)
Balance at beginning of year . . . . . . . . . . . . . . . . . . . . . . . . . . . . . . . . . . . . . . $ 92 $ 81Increases due to:
Tax positions taken in prior years . . . . . . . . . . . . . . . . . . . . . . . . . . . . . . 5 —Tax positions taken in current year . . . . . . . . . . . . . . . . . . . . . . . . . . . . . 20 16
Decreases due to:Tax positions taken in prior years . . . . . . . . . . . . . . . . . . . . . . . . . . . . . . (8) (4)Settlements with taxing authorities . . . . . . . . . . . . . . . . . . . . . . . . . . . . . (13) (1)Lapse of applicable statute of limitations . . . . . . . . . . . . . . . . . . . . . . . . (7) —
Balance at end of year . . . . . . . . . . . . . . . . . . . . . . . . . . . . . . . . . . . . . . . . . . . $ 89 $ 92
Not included in the unrecognized tax benefits reconciliation above are gross unrecognized accrued interestand penalties of $25 million at January 30, 2010 and $23 million at January 31, 2009. Interest and penaltyexpense was $4 million for 2009 and $6 million for 2008.
F-17
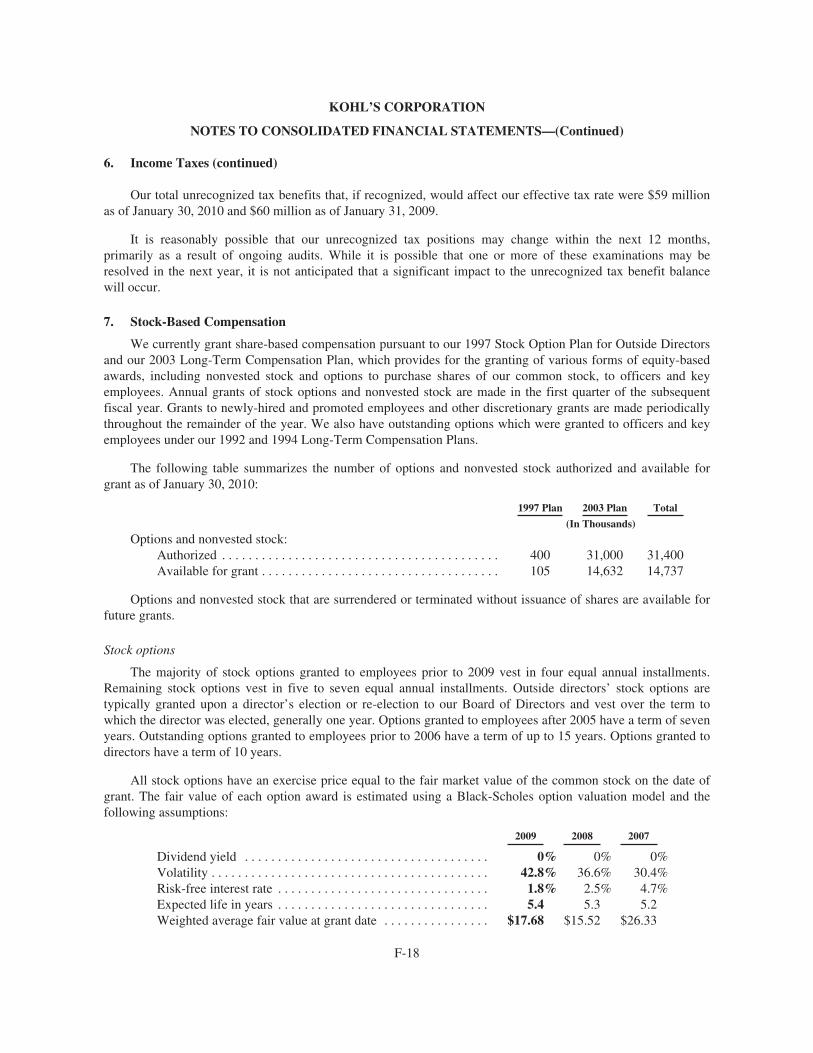
KOHL’S CORPORATION
NOTES TO CONSOLIDATED FINANCIAL STATEMENTS—(Continued)
6. Income Taxes (continued)
Our total unrecognized tax benefits that, if recognized, would affect our effective tax rate were $59 millionas of January 30, 2010 and $60 million as of January 31, 2009.
It is reasonably possible that our unrecognized tax positions may change within the next 12 months,primarily as a result of ongoing audits. While it is possible that one or more of these examinations may beresolved in the next year, it is not anticipated that a significant impact to the unrecognized tax benefit balancewill occur.
7. Stock-Based Compensation
We currently grant share-based compensation pursuant to our 1997 Stock Option Plan for Outside Directorsand our 2003 Long-Term Compensation Plan, which provides for the granting of various forms of equity-basedawards, including nonvested stock and options to purchase shares of our common stock, to officers and keyemployees. Annual grants of stock options and nonvested stock are made in the first quarter of the subsequentfiscal year. Grants to newly-hired and promoted employees and other discretionary grants are made periodicallythroughout the remainder of the year. We also have outstanding options which were granted to officers and keyemployees under our 1992 and 1994 Long-Term Compensation Plans.
The following table summarizes the number of options and nonvested stock authorized and available forgrant as of January 30, 2010:
1997 Plan 2003 Plan Total
(In Thousands)
Options and nonvested stock:Authorized . . . . . . . . . . . . . . . . . . . . . . . . . . . . . . . . . . . . . . . . . . 400 31,000 31,400Available for grant . . . . . . . . . . . . . . . . . . . . . . . . . . . . . . . . . . . . 105 14,632 14,737
Options and nonvested stock that are surrendered or terminated without issuance of shares are available forfuture grants.
Stock options
The majority of stock options granted to employees prior to 2009 vest in four equal annual installments.Remaining stock options vest in five to seven equal annual installments. Outside directors’ stock options aretypically granted upon a director’s election or re-election to our Board of Directors and vest over the term towhich the director was elected, generally one year. Options granted to employees after 2005 have a term of sevenyears. Outstanding options granted to employees prior to 2006 have a term of up to 15 years. Options granted todirectors have a term of 10 years.
All stock options have an exercise price equal to the fair market value of the common stock on the date ofgrant. The fair value of each option award is estimated using a Black-Scholes option valuation model and thefollowing assumptions:
2009 2008 2007
Dividend yield . . . . . . . . . . . . . . . . . . . . . . . . . . . . . . . . . . . . . 0% 0% 0%Volatility . . . . . . . . . . . . . . . . . . . . . . . . . . . . . . . . . . . . . . . . . . 42.8% 36.6% 30.4%Risk-free interest rate . . . . . . . . . . . . . . . . . . . . . . . . . . . . . . . . 1.8% 2.5% 4.7%Expected life in years . . . . . . . . . . . . . . . . . . . . . . . . . . . . . . . . 5.4 5.3 5.2Weighted average fair value at grant date . . . . . . . . . . . . . . . . $17.68 $15.52 $26.33
F-18
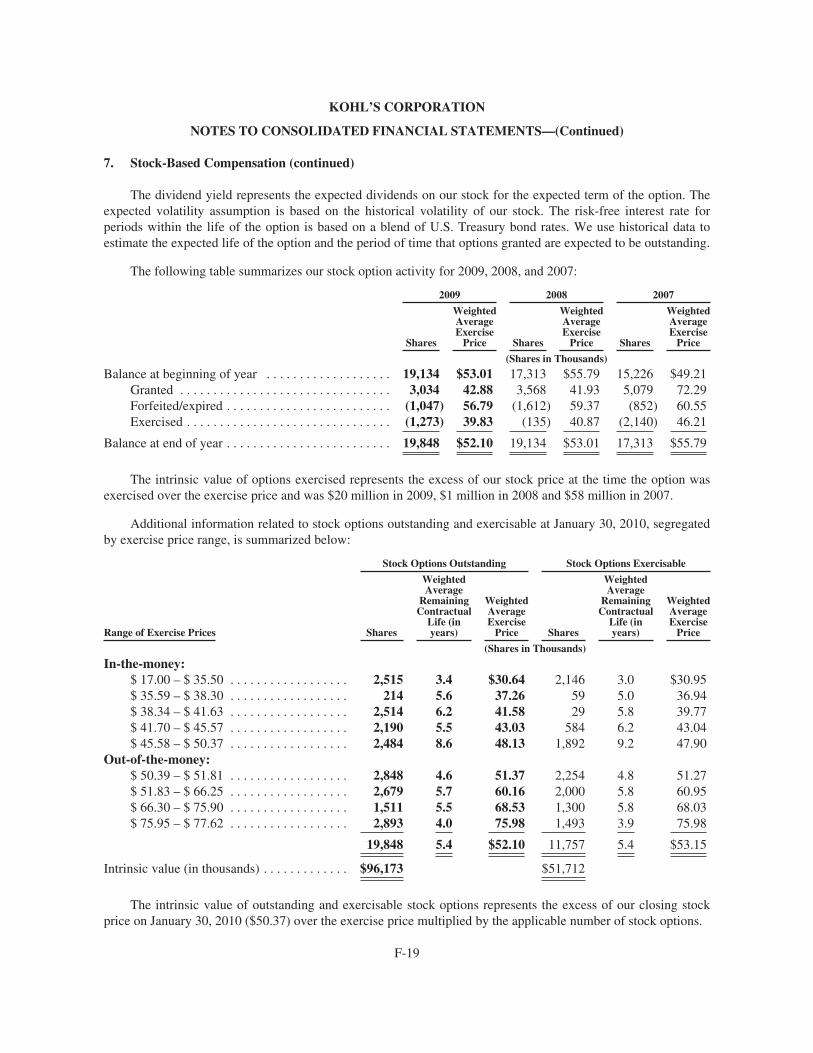
KOHL’S CORPORATION
NOTES TO CONSOLIDATED FINANCIAL STATEMENTS—(Continued)
7. Stock-Based Compensation (continued)
The dividend yield represents the expected dividends on our stock for the expected term of the option. Theexpected volatility assumption is based on the historical volatility of our stock. The risk-free interest rate forperiods within the life of the option is based on a blend of U.S. Treasury bond rates. We use historical data toestimate the expected life of the option and the period of time that options granted are expected to be outstanding.
The following table summarizes our stock option activity for 2009, 2008, and 2007:
2009 2008 2007
Shares
WeightedAverageExercise
Price Shares
WeightedAverageExercise
Price Shares
WeightedAverageExercise
Price
(Shares in Thousands)
Balance at beginning of year . . . . . . . . . . . . . . . . . . . 19,134 $53.01 17,313 $55.79 15,226 $49.21Granted . . . . . . . . . . . . . . . . . . . . . . . . . . . . . . . . 3,034 42.88 3,568 41.93 5,079 72.29Forfeited/expired . . . . . . . . . . . . . . . . . . . . . . . . . (1,047) 56.79 (1,612) 59.37 (852) 60.55Exercised . . . . . . . . . . . . . . . . . . . . . . . . . . . . . . . (1,273) 39.83 (135) 40.87 (2,140) 46.21
Balance at end of year . . . . . . . . . . . . . . . . . . . . . . . . . 19,848 $52.10 19,134 $53.01 17,313 $55.79
The intrinsic value of options exercised represents the excess of our stock price at the time the option wasexercised over the exercise price and was $20 million in 2009, $1 million in 2008 and $58 million in 2007.
Additional information related to stock options outstanding and exercisable at January 30, 2010, segregatedby exercise price range, is summarized below:
Stock Options Outstanding Stock Options Exercisable
Range of Exercise Prices Shares
WeightedAverage
RemainingContractual
Life (inyears)
WeightedAverageExercise
Price Shares
WeightedAverage
RemainingContractual
Life (inyears)
WeightedAverageExercise
Price
(Shares in Thousands)
In-the-money:$ 17.00 – $ 35.50 . . . . . . . . . . . . . . . . . . 2,515 3.4 $30.64 2,146 3.0 $30.95$ 35.59 – $ 38.30 . . . . . . . . . . . . . . . . . . 214 5.6 37.26 59 5.0 36.94$ 38.34 – $ 41.63 . . . . . . . . . . . . . . . . . . 2,514 6.2 41.58 29 5.8 39.77$ 41.70 – $ 45.57 . . . . . . . . . . . . . . . . . . 2,190 5.5 43.03 584 6.2 43.04$ 45.58 – $ 50.37 . . . . . . . . . . . . . . . . . . 2,484 8.6 48.13 1,892 9.2 47.90
Out-of-the-money:$ 50.39 – $ 51.81 . . . . . . . . . . . . . . . . . . 2,848 4.6 51.37 2,254 4.8 51.27$ 51.83 – $ 66.25 . . . . . . . . . . . . . . . . . . 2,679 5.7 60.16 2,000 5.8 60.95$ 66.30 – $ 75.90 . . . . . . . . . . . . . . . . . . 1,511 5.5 68.53 1,300 5.8 68.03$ 75.95 – $ 77.62 . . . . . . . . . . . . . . . . . . 2,893 4.0 75.98 1,493 3.9 75.98
19,848 5.4 $52.10 11,757 5.4 $53.15
Intrinsic value (in thousands) . . . . . . . . . . . . . $96,173 $51,712
The intrinsic value of outstanding and exercisable stock options represents the excess of our closing stockprice on January 30, 2010 ($50.37) over the exercise price multiplied by the applicable number of stock options.
F-19
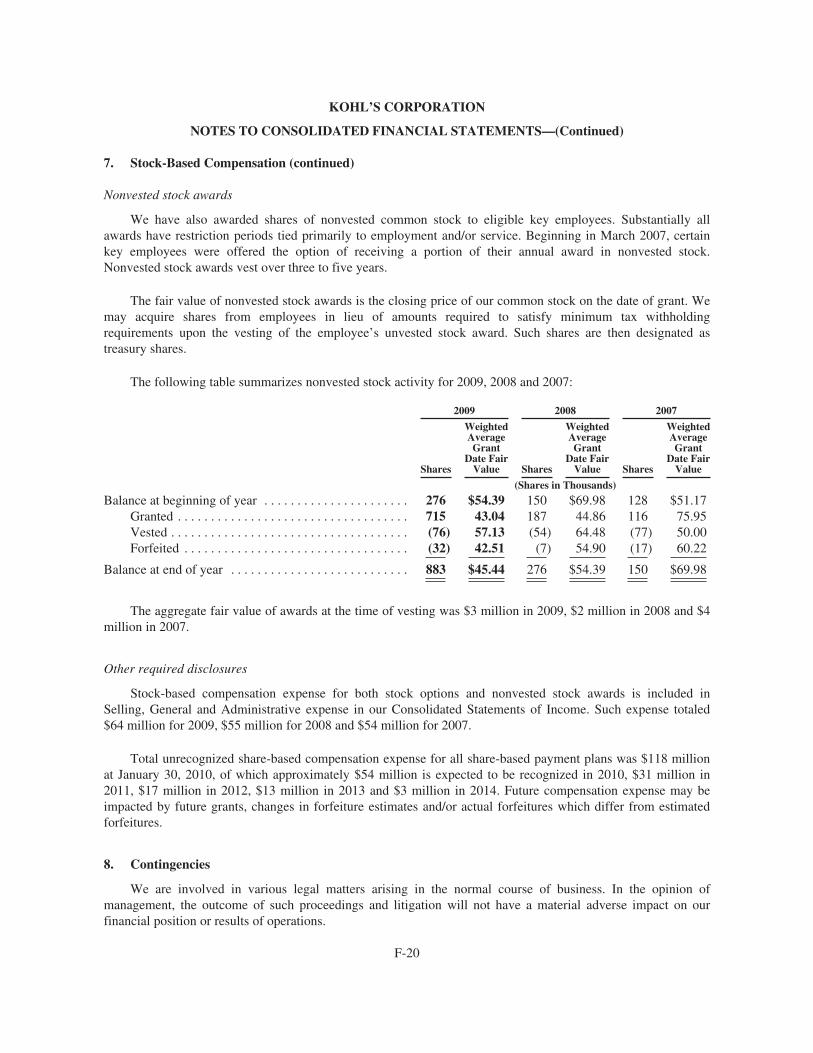
KOHL’S CORPORATION
NOTES TO CONSOLIDATED FINANCIAL STATEMENTS—(Continued)
7. Stock-Based Compensation (continued)
Nonvested stock awards
We have also awarded shares of nonvested common stock to eligible key employees. Substantially allawards have restriction periods tied primarily to employment and/or service. Beginning in March 2007, certainkey employees were offered the option of receiving a portion of their annual award in nonvested stock.Nonvested stock awards vest over three to five years.
The fair value of nonvested stock awards is the closing price of our common stock on the date of grant. Wemay acquire shares from employees in lieu of amounts required to satisfy minimum tax withholdingrequirements upon the vesting of the employee’s unvested stock award. Such shares are then designated astreasury shares.
The following table summarizes nonvested stock activity for 2009, 2008 and 2007:
2009 2008 2007
Shares
WeightedAverageGrant
Date FairValue Shares
WeightedAverageGrant
Date FairValue Shares
WeightedAverageGrant
Date FairValue
(Shares in Thousands)
Balance at beginning of year . . . . . . . . . . . . . . . . . . . . . . 276 $54.39 150 $69.98 128 $51.17Granted . . . . . . . . . . . . . . . . . . . . . . . . . . . . . . . . . . . 715 43.04 187 44.86 116 75.95Vested . . . . . . . . . . . . . . . . . . . . . . . . . . . . . . . . . . . . (76) 57.13 (54) 64.48 (77) 50.00Forfeited . . . . . . . . . . . . . . . . . . . . . . . . . . . . . . . . . . (32) 42.51 (7) 54.90 (17) 60.22
Balance at end of year . . . . . . . . . . . . . . . . . . . . . . . . . . . 883 $45.44 276 $54.39 150 $69.98
The aggregate fair value of awards at the time of vesting was $3 million in 2009, $2 million in 2008 and $4million in 2007.
Other required disclosures
Stock-based compensation expense for both stock options and nonvested stock awards is included inSelling, General and Administrative expense in our Consolidated Statements of Income. Such expense totaled$64 million for 2009, $55 million for 2008 and $54 million for 2007.
Total unrecognized share-based compensation expense for all share-based payment plans was $118 millionat January 30, 2010, of which approximately $54 million is expected to be recognized in 2010, $31 million in2011, $17 million in 2012, $13 million in 2013 and $3 million in 2014. Future compensation expense may beimpacted by future grants, changes in forfeiture estimates and/or actual forfeitures which differ from estimatedforfeitures.
8. Contingencies
We are involved in various legal matters arising in the normal course of business. In the opinion ofmanagement, the outcome of such proceedings and litigation will not have a material adverse impact on ourfinancial position or results of operations.
F-20
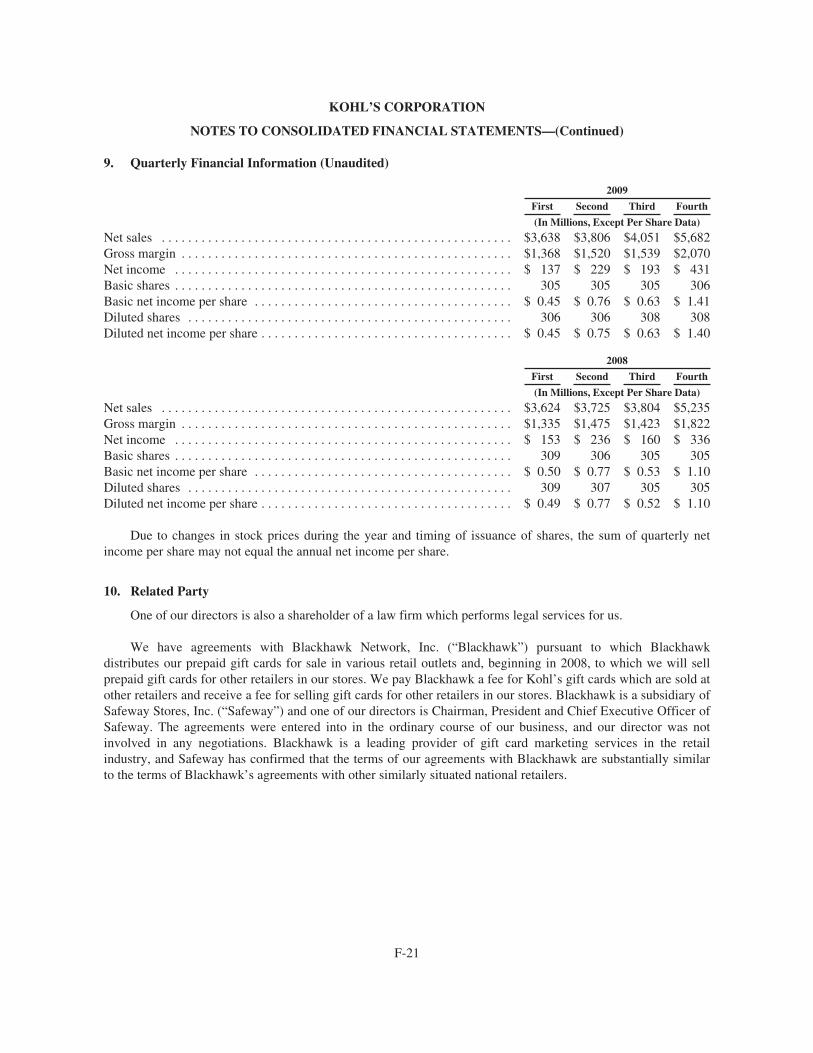
KOHL’S CORPORATION
NOTES TO CONSOLIDATED FINANCIAL STATEMENTS—(Continued)
9. Quarterly Financial Information (Unaudited)
2009
First Second Third Fourth
(In Millions, Except Per Share Data)
Net sales . . . . . . . . . . . . . . . . . . . . . . . . . . . . . . . . . . . . . . . . . . . . . . . . . . . . . $3,638 $3,806 $4,051 $5,682Gross margin . . . . . . . . . . . . . . . . . . . . . . . . . . . . . . . . . . . . . . . . . . . . . . . . . . $1,368 $1,520 $1,539 $2,070Net income . . . . . . . . . . . . . . . . . . . . . . . . . . . . . . . . . . . . . . . . . . . . . . . . . . . $ 137 $ 229 $ 193 $ 431Basic shares . . . . . . . . . . . . . . . . . . . . . . . . . . . . . . . . . . . . . . . . . . . . . . . . . . . 305 305 305 306Basic net income per share . . . . . . . . . . . . . . . . . . . . . . . . . . . . . . . . . . . . . . . $ 0.45 $ 0.76 $ 0.63 $ 1.41Diluted shares . . . . . . . . . . . . . . . . . . . . . . . . . . . . . . . . . . . . . . . . . . . . . . . . . 306 306 308 308Diluted net income per share . . . . . . . . . . . . . . . . . . . . . . . . . . . . . . . . . . . . . . $ 0.45 $ 0.75 $ 0.63 $ 1.40
2008
First Second Third Fourth
(In Millions, Except Per Share Data)
Net sales . . . . . . . . . . . . . . . . . . . . . . . . . . . . . . . . . . . . . . . . . . . . . . . . . . . . . $3,624 $3,725 $3,804 $5,235Gross margin . . . . . . . . . . . . . . . . . . . . . . . . . . . . . . . . . . . . . . . . . . . . . . . . . . $1,335 $1,475 $1,423 $1,822Net income . . . . . . . . . . . . . . . . . . . . . . . . . . . . . . . . . . . . . . . . . . . . . . . . . . . $ 153 $ 236 $ 160 $ 336Basic shares . . . . . . . . . . . . . . . . . . . . . . . . . . . . . . . . . . . . . . . . . . . . . . . . . . . 309 306 305 305Basic net income per share . . . . . . . . . . . . . . . . . . . . . . . . . . . . . . . . . . . . . . . $ 0.50 $ 0.77 $ 0.53 $ 1.10Diluted shares . . . . . . . . . . . . . . . . . . . . . . . . . . . . . . . . . . . . . . . . . . . . . . . . . 309 307 305 305Diluted net income per share . . . . . . . . . . . . . . . . . . . . . . . . . . . . . . . . . . . . . . $ 0.49 $ 0.77 $ 0.52 $ 1.10
Due to changes in stock prices during the year and timing of issuance of shares, the sum of quarterly netincome per share may not equal the annual net income per share.
10. Related Party
One of our directors is also a shareholder of a law firm which performs legal services for us.
We have agreements with Blackhawk Network, Inc. (“Blackhawk”) pursuant to which Blackhawkdistributes our prepaid gift cards for sale in various retail outlets and, beginning in 2008, to which we will sellprepaid gift cards for other retailers in our stores. We pay Blackhawk a fee for Kohl’s gift cards which are sold atother retailers and receive a fee for selling gift cards for other retailers in our stores. Blackhawk is a subsidiary ofSafeway Stores, Inc. (“Safeway”) and one of our directors is Chairman, President and Chief Executive Officer ofSafeway. The agreements were entered into in the ordinary course of our business, and our director was notinvolved in any negotiations. Blackhawk is a leading provider of gift card marketing services in the retailindustry, and Safeway has confirmed that the terms of our agreements with Blackhawk are substantially similarto the terms of Blackhawk’s agreements with other similarly situated national retailers.
F-21
EXHIBIT 10.14
Outside Director Compensation
Directors who are not employees of the Company or its subsidiaries receive an annual retainer fee of $100,000. The Lead Director receives an additional retainer fee of $15,000. Chairpersons of the Compensation Committee and the Audit Committee receive an additional $20,000 retainer fee, and the Chairperson of the Governance & Nominating Committee receives an additional $10,000 retainer fee. Non-employee directors also receive retainer fees for membership on the Compensation, Audit and Executive Committees. Committee member retainers are $10,000 for Compensation Committee members and $15,000 for Audit Committee and Executive Committee members. All retainers are paid in arrears in quarterly installments.
Stock options are granted to non-employee directors from time to time. These grants are typically made at the time the director joins the Board and each time the director is re-elected by the shareholders to serve a new one-year term. These options have a term of ten years and typically vest on the first anniversary of the date of grant. The ‘grant date fair value’ of each director’s annual option award is intended to be approximately $100,000, calculated in accordance with Financial Accounting Standards No. 123R. Directors are also reimbursed for travel and other expenses related to attendance at Board of Directors and committee meetings and educational seminars approved in advance by the Governance and Nominating Committee.
EXHIBIT 10.25
Strategic Action Committee Incentive Program Summary
Purpose The purpose of the Strategic Action Committee Incentive Program (the “Program”) is to provide eligible executives with a financial incentive, encouraging them to perform in a manner which will enable the Company’s Strategic Action Committees to meet or exceed their performance objectives each fiscal year.
Administration The Program is administered by the Kohl’s Board of Directors Compensation Committee (the “Compensation Committee”).
Eligibility and Participation Executive Committee members designated by the Compensation Committee are eligible to participate in the Program, and will receive an incentive award upon the achievement of certain performance targets tied to the officers’ work on one of Kohl’s corporate strategic action committees.
Eligible executives who serve on a designated strategic action committee for the full fiscal year are eligible to participate in the Program. An executive newly hired or promoted into an eligible position during a fiscal year for which an incentive payment is made will have his/her award prorated from the date of hire or promotion to the close of the fiscal year.
Except as otherwise determined by the Compensation Committee, a Program participant shall receive no award with respect to the fiscal year in which the participant’s employment with Kohl’s terminates for any reason prior to the last day of the fiscal year. A participant shall not forfeit a Program award if the participant’s employment terminates after the end of the applicable fiscal year but prior to the distribution of the award for such year.
Performance Requirements and Awards In order for awards to be made to any Program participant, the strategic action committee on which the participant serves must have achieved one or more performance targets established by the Committee at the beginning of the year. The Compensation Committee may establish various levels of performance targets with corresponding payouts. The Compensation Committee may also require any one or more corporate performance objectives that must be met before any awards are paid pursuant to the Program. Corporate and specific committee performance targets will be determined by the Compensation Committee at the beginning of each fiscal year and communicated to participants as soon as practicable.
At the end of each fiscal year, the Compensation Committee shall review the actual performance of each strategic action committee and certify whether the various performance targets have been achieved. Awards are payable to Program participants following this certification. The amount of each award shall be determined based upon the level of the performance targets achieved, and is calculated based upon a percentage of each participant’s base pay, as determined by the Compensation Committee at the beginning of the year.
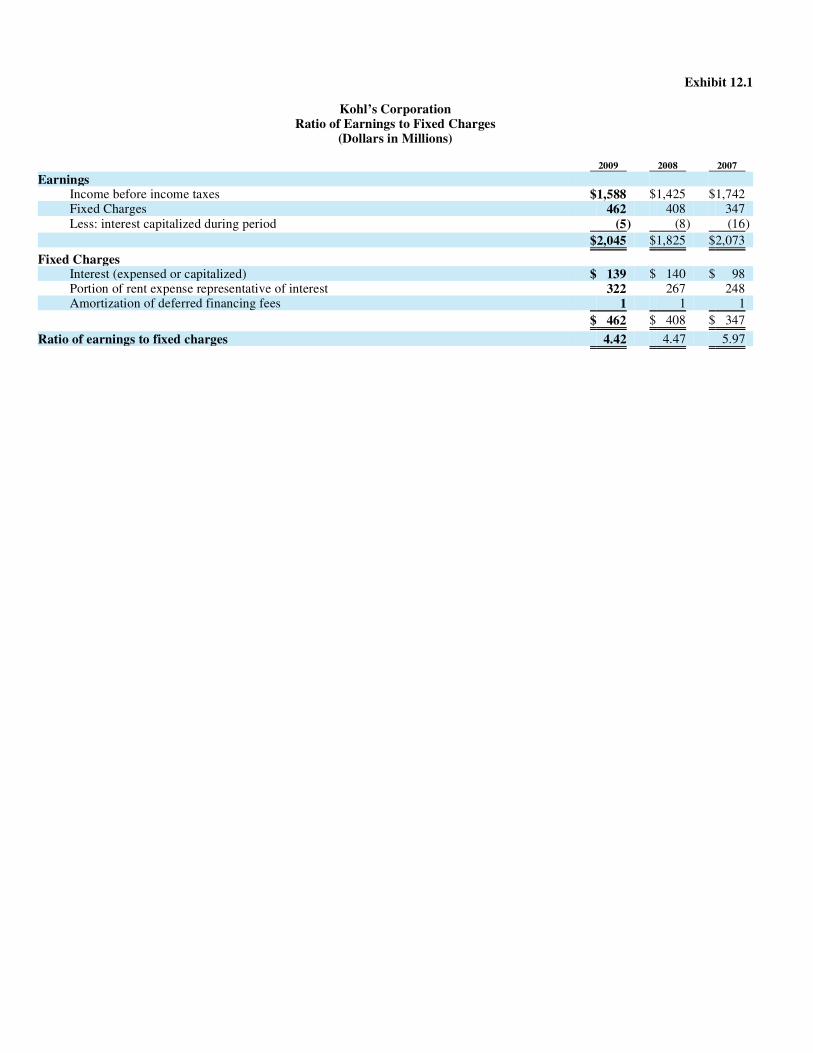
Exhibit 12.1
Kohl’s Corporation Ratio of Earnings to Fixed Charges
(Dollars in Millions) 2009 2008 2007
Earnings
Income before income taxes $1,588 $1,425 $1,742 Fixed Charges 462 408 347 Less: interest capitalized during period (5) (8) (16)
$2,045 $1,825 $2,073
Fixed Charges
Interest (expensed or capitalized) $ 139 $ 140 $ 98 Portion of rent expense representative of interest 322 267 248 Amortization of deferred financing fees 1 1 1
$ 462 $ 408 $ 347
Ratio of earnings to fixed charges 4.42 4.47 5.97

Exhibit 21.1
Subsidiaries
Name State of Incorporation or Formation
Kohl’s Department Stores, Inc. Delaware Kohl’s Illinois, Inc.* Nevada Kohl’s Indiana, Inc.* Delaware Kohl’s Indiana, L.P. Delaware Kohl’s Michigan, L.P. Delaware Kohl’s Value Services, Inc.* Virginia Kohl’s Cares, LLC* Wisconsin KWAL, LLC Wisconsin
* These subsidiaries are wholly owned subsidiaries of Kohl’s Department Stores, Inc
Exhibit 23.1
Consent of Independent Registered Public Accounting Firm
We consent to the incorporation by reference in the Registration Statements (Form S-8 #33-49886, Form S-8 #333-26409, Form S-8 #33-84558, Form S-8 #333-105264, Form S-8 #333-143086, and Form S-3 #333-146279) of Kohl’s Corporation and in the related prospectuses, of our reports dated March 19, 2010, with respect to the consolidated financial statements of Kohl’s Corporation, and the effectiveness of internal control over financial reporting of Kohl’s Corporation, included in this Annual Report (Form 10-K) for the year ended January 30, 2010.
/s/ ERNST & YOUNG LLP
Milwaukee, Wisconsin March 19, 2010
Exhibit 31.1
Certification of the Chief Executive Officer Pursuant to Section 302 of the Sarbanes-Oxley Act of 2002
I, Kevin Mansell, certify that:
1. I have reviewed this Annual Report on Form 10-K of Kohl’s Corporation;
2. Based on my knowledge, this report does not contain any untrue statement of a material fact or omit to state a material fact necessary to make the statements made, in light of the circumstances under which such statements were made, not misleading with respect to the period covered by this report;
3. Based on my knowledge, the financial statements, and other financial information included in this report, fairly present in all material respects the financial condition, results of operations and cash flows of the registrant as of, and for, the periods presented in this report;
4. The registrant’s other certifying officer and I are responsible for establishing and maintaining disclosure controls and procedures (as defined in Exchange Act Rules 13a-15(e) and 15d-15(e)) and internal control over financial reporting (as defined in Exchange Act Rules 13a-15(f) and 15d-15(f)) for the registrant and have:
(a) Designed such disclosure controls and procedures, or caused such disclosure controls and procedures to be designed under
our supervision, to ensure that material information relating to the registrant, including its consolidated subsidiaries, is made known to us by others within those entities, particularly during the period in which this report is being prepared;
(b) Designed such internal control over financial reporting, or caused such internal control over financial reporting to be
designed under our supervision, to provide reasonable assurance regarding the reliability of financial reporting and the preparation of financial statements for external purposes in accordance with generally accepted accounting principles;
(c) Evaluated the effectiveness of the registrant’s disclosure controls and procedures and presented in this report our
conclusions about the effectiveness of the disclosure controls and procedures, as of the end of the period covered by this report based on such evaluation; and
(d) Disclosed in this report any change in the registrant’s internal control over financial reporting that occurred during the
registrant’s most recent fiscal quarter (the registrant’s fourth fiscal quarter in the case of an annual report) that has materially affected, or is reasonably likely to materially affect, the registrant’s internal control over financial reporting; and
5. The registrant’s other certifying officer and I have disclosed, based on our most recent evaluation of internal control over financial reporting, to the registrant’s auditors and the audit committee of the registrant’s board of directors (or persons performing the equivalent functions):
(a) All significant deficiencies and material weaknesses in the design or operation of internal control over financial reporting
which are reasonably likely to adversely affect the registrant’s ability to record, process, summarize and report financial information; and
(b) Any fraud, whether or not material, that involves management or other employees who have a significant role in the
registrant’s internal control over financial reporting.
Date: March 18, 2010
/s/ Kevin MansellKevin Mansell Chairman, President and Chief Executive Officer (Principal Executive Officer)
Exhibit 31.2
Certification of the Chief Financial Officer Pursuant to Section 302 of the Sarbanes-Oxley Act of 2002
I, Wesley S. McDonald, certify that:
1. I have reviewed this Annual Report on Form 10-K of Kohl’s Corporation;
2. Based on my knowledge, this report does not contain any untrue statement of a material fact or omit to state a material fact necessary to make the statements made, in light of the circumstances under which such statements were made, not misleading with respect to the period covered by this report;
3. Based on my knowledge, the financial statements, and other financial information included in this report, fairly present in all material respects the financial condition, results of operations and cash flows of the registrant as of, and for, the periods presented in this report;
4. The registrant’s other certifying officer and I are responsible for establishing and maintaining disclosure controls and procedures (as defined in Exchange Act Rules 13a-15(e) and 15d-15(e)) and internal control over financial reporting (as defined in Exchange Act Rules 13a-15(f) and 15d-15(f)) for the registrant and have:
(a) Designed such disclosure controls and procedures, or caused such disclosure controls and procedures to be designed under
our supervision, to ensure that material information relating to the registrant, including its consolidated subsidiaries, is made known to us by others within those entities, particularly during the period in which this report is being prepared;
(b) Designed such internal control over financial reporting, or caused such internal control over financial reporting to be
designed under our supervision, to provide reasonable assurance regarding the reliability of financial reporting and the preparation of financial statements for external purposes in accordance with generally accepted accounting principles;
(c) Evaluated the effectiveness of the registrant’s disclosure controls and procedures and presented in this report our
conclusions about the effectiveness of the disclosure controls and procedures, as of the end of the period covered by this report based on such evaluation; and
(d) Disclosed in this report any change in the registrant’s internal control over financial reporting that occurred during the
registrant’s most recent fiscal quarter (the registrant’s fourth fiscal quarter in the case of an annual report) that has materially affected, or is reasonably likely to materially affect, the registrant’s internal control over financial reporting; and
5. The registrant’s other certifying officer and I have disclosed, based on our most recent evaluation of internal control over financial reporting, to the registrant’s auditors and the audit committee of the registrant’s board of directors (or persons performing the equivalent functions):
(a) All significant deficiencies and material weaknesses in the design or operation of internal control over financial reporting
which are reasonably likely to adversely affect the registrant’s ability to record, process, summarize and report financial information; and
(b) Any fraud, whether or not material, that involves management or other employees who have a significant role in the
registrant’s internal control over financial reporting.
Date: March 18, 2010
/s/ Wesley S. McDonaldWesley S. McDonald Chief Financial Officer
Exhibit 32.1
Certification by the Chief Executive Officer Pursuant to 18 U. S. C. Section 1350, as Adopted Pursuant to Section 906 of the Sarbanes-Oxley Act of 2002
I, Kevin Mansell, Chairman, President and Chief Executive Officer of Kohl’s Corporation (the “Company”), certify, pursuant to Section 906 of the Sarbanes-Oxley Act of 2002, 18 U.S.C. Section 1350, that, to my knowledge, on the date of this Certification:
1. This Annual Report on Form 10-K of the Company for the annual period ended January 30, 2010 (the “Report”) fully complies with the requirements of Section 13(a) or 15(d) of the Securities Exchange Act of 1934, and
2. That the information contained in the Report fairly presents, in all material respects, the financial condition and results of operations of the Company.
Dated: March 18, 2010
/s/ Kevin MansellKevin Mansell Chairman, President and Chief Executive Officer (Principal Executive Officer)
Exhibit 32.2
Certification of the Chief Financial Officer Pursuant to 18 U. S. C. Section 1350, as Adopted Pursuant to Section 906 of the Sarbanes-Oxley Act of 2002
I, Wesley S. McDonald, Chief Financial Officer of Kohl’s Corporation (the “Company”), certify, pursuant to Section 906 of the Sarbanes-Oxley Act of 2002, 18 U.S.C. Section 1350, that, to my knowledge, on the date of this Certification:
1. This Annual Report on Form 10-K of the Company for the annual period ended January 30, 2010 (the “Report”) fully complies with the requirements of Section 13(a) or 15(d) of the Securities Exchange Act of 1934, and
2. That the information contained in the Report fairly presents, in all material respects, the financial condition and results of operations of the Company.
Dated: March 18, 2010
/s/ Wesley S. McDonaldWesley S. McDonald Chief Financial Officer