Embed Size (px)
Citation preview

KOBE STRATEGY MATRIX FOR YELLOWFIN and BIGEYE
in the Eastern Pacific Ocean in 2012

Introduction The joint meetings of the tuna regional fisheries management organizations (tRFMOs) recommended standardization of the stock assessment results for management advice: • Kobe plots: four quadrants, red-yellow-green format
• Kobe II strategy matrix: alternative options for meeting management targets

Kobe II strategy matrix
• The matrix was computed with FMSY because the IATTC staff recommendations have treated FMSY as a target reference point
• The informal harvest rule used to manage tunas in the EPO has been reducing fishing mortality to FMSY if it exceeds FMSY.

Methods
• Kobe II strategy matrix: – Compute the fraction of the current fishing
mortality (Fcur) that is required to ensure a given probability P that it will be at or below fishing mortality target reference point
– Normal approximation for computing the probabilities
• Decision table for biomass reference points

Proposed reference
point
State of nature
steepness Variability
Fraction of the current (2010-2012) fishing mortality required to ensure the following
probability of being below the target or limit
95% 90% 80% 50%
Target F = FMSY
Base case Low 0.972 0.980 0.991 1.010 High 0.906 0.929 0.957 1.010
h = 0.75 Low 0.604 0.613 0.624 0.644 High 0.578 0.592 0.610 0.644
Limit
F = 1.4 FMSY
Base case Low 1.361 1.372 1.381 1.415 High 1.269 1.301 1.323 1.415
h = 0.75 Low 0.809 0.829 0.854 0.902 High 0.846 0.858 0.873 0.902
Kobe II strategy matrix for yellowfin in the EPO in 2012
Table 1

Proposed reference
point
State of nature
steepness
Fraction of the current (2010-2012) fishing
mortality required to ensure the following probability of being below the
target or limit
95% 90% 80% 50% Target
F = FMSY
Base case 0.899 0.933 0.974 1.053 h = 0.75 0.713 0.738 0.767 0.825
Limit F = 1.3 FMSY
Base case 1.168 1.213 1.266 1.369 h = 0.75 0.927 0.959 0.998 1.072
Kobe II strategy matrix for bigeye in the EPO in 2012
Table 2

Risk curves for yellowfin
Probability that the fishing
mortality (F) is below the level
corresponding to MSY (FMSY)
fractions (δ = F scale) of the current fishing mortality (2010-2012).
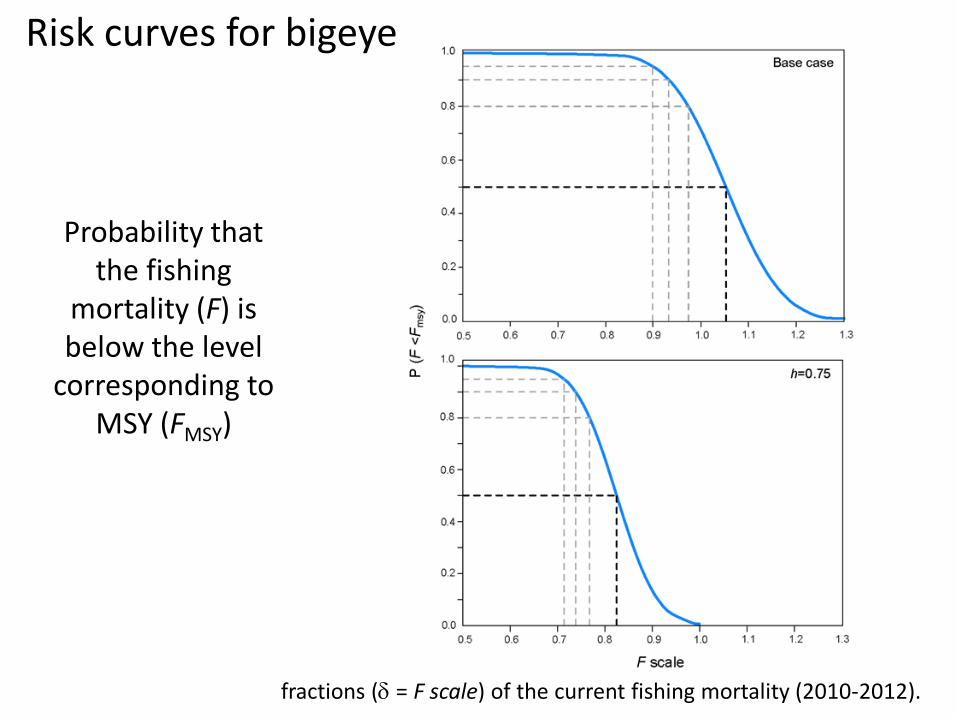
Risk curves for bigeye
Probability that the fishing
mortality (F) is below the level
corresponding to MSY (FMSY)
fractions (δ = F scale) of the current fishing mortality (2010-2012).
Proposed reference
point
State of nature
steepness
Time frame (years)
Probability of being above the target or limit by
fishing at Fcur FMSY
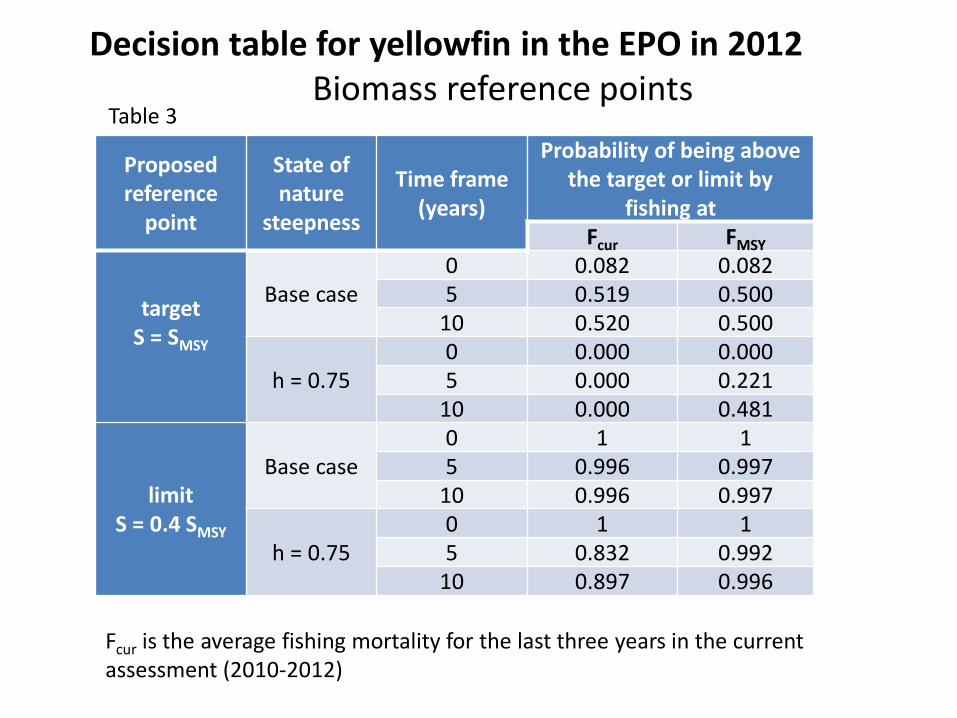
target S = SMSY
Base case 0 0.082 0.082 5 0.519 0.500
10 0.520 0.500
h = 0.75 0 0.000 0.000 5 0.000 0.221
10 0.000 0.481
limit S = 0.4 SMSY
Base case 0 1 1 5 0.996 0.997
10 0.996 0.997
h = 0.75 0 1 1 5 0.832 0.992
10 0.897 0.996
Decision table for yellowfin in the EPO in 2012 Biomass reference points
Fcur is the average fishing mortality for the last three years in the current assessment (2010-2012)
Table 3

Proposed reference point
State of nature
steepness Variability
Probability of being below the target or limit by fishing
at Fcur
Target F = FMSY
Base case low 0.671 high 0.565
h = 0.75 low 0 high 0
Limit F = 1.4 FMSY
Base case low 1 high 1
h = 0.75 low 0.002 high 0.041
Decision table for yellowfin in the EPO in 2012 Fishing mortality reference points
Table 4
Proposed reference
point
State of nature
steepness
Time frame
(years)
Probability of being above the target or limit by fishing
at Fcur FMSY
target S = SMSY
Base case 0 0.794 0.794 5 0.485 0.349
10 0.579 0.488
h = 0.75 0 0.259 0.259 5 0.125 0.124
10 0.179 0.333
limit S = 0.5 SMSY
Base case 0 0.998 0.998 5 0.904 0.995
10 0.931 1
h = 0.75 0 0.997 0.997 5 0.808 0.981
10 0.796 1
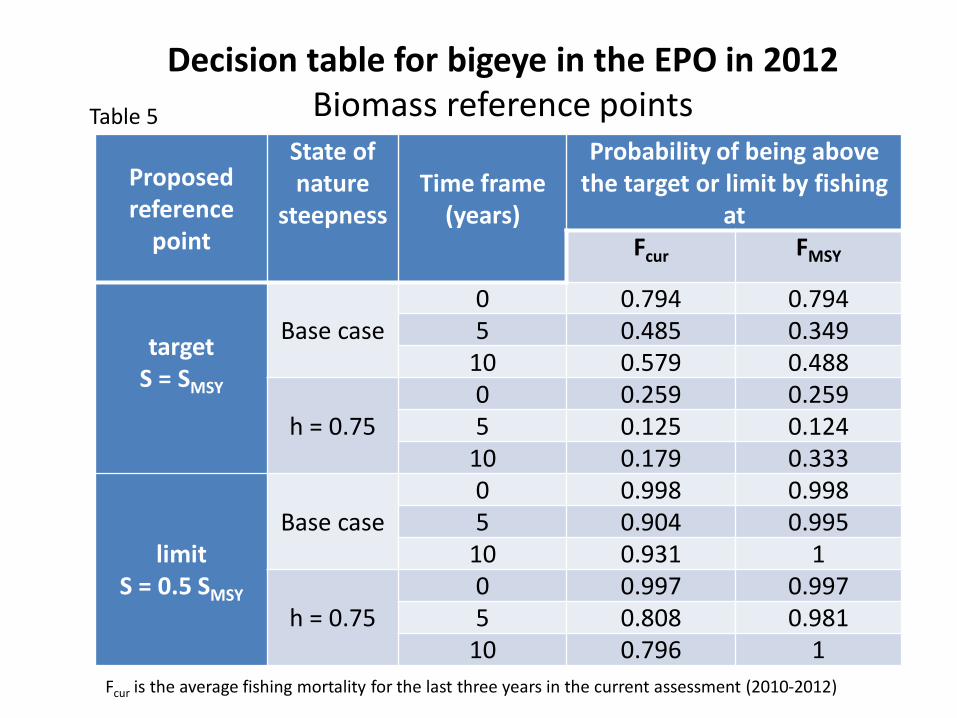
Decision table for bigeye in the EPO in 2012 Biomass reference points
Fcur is the average fishing mortality for the last three years in the current assessment (2010-2012)
Table 5

Decision table for bigeye in the EPO in 2012 Fishing mortality reference points
Proposed reference point
State of nature steepness
Probability of being below the target or limit
by fishing at Fcur Target
F = FMSY Base case 0.714 h = 0.75 0.005
Limit F = 1.3 FMSY
Base case 0.999 h = 0.75 0.793
Fcur is the average fishing mortality for the last three years in the current assessment (2010-2012)
Table 6

Steepness Proposed reference
point
Probability of being above the reference point in
0 years 5 years 10 years True state of nature
Assessment assumption
h = 0.75 h = 1
(Fmult = 1.01)
target S = SMSY
0 0 0 limit
S = 0.4 SMSY 1 0.838 0.905
Base case h = 0.75 (Fmult = 0.64)
target S = SMSY
0.082 0.952 0.952 limit
S = 0.4 SMSY 1 1 1
Misspecification cases: yellowfin
Steepness Variability
Probability of being below
target F = FMSY
Limit F = 1.4 FMSY
True state of nature Assessment assumption
h = 0.75
h = 1 (Fmult = 1.01)
low 0 0.007 high 0 0.027
Base case h = 0.75 (Fmult = 0.64)
low 1 1 high 1 1
Biom
ass
refe
renc
e po
ints
Fi
shin
g m
orta
lity
RP
Table 7
Table 8
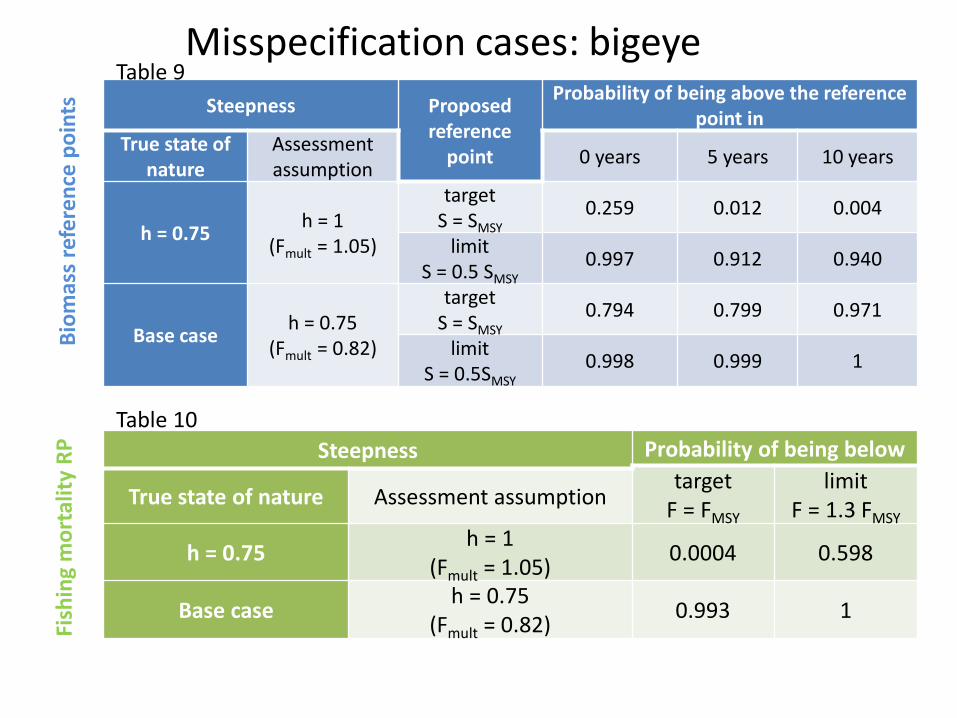
Misspecification cases: bigeye Steepness Proposed
reference point
Probability of being above the reference point in
True state of nature
Assessment assumption 0 years 5 years 10 years
h = 0.75 h = 1 (Fmult = 1.05)
target S = SMSY
0.259 0.012 0.004
limit S = 0.5 SMSY
0.997 0.912 0.940
Base case h = 0.75 (Fmult = 0.82)
target S = SMSY
0.794 0.799 0.971
limit S = 0.5SMSY
0.998 0.999 1
Steepness Probability of being below target
F = FMSY limit
F = 1.3 FMSY True state of nature Assessment assumption
h = 0.75 h = 1 (Fmult = 1.05) 0.0004 0.598
Base case h = 0.75 (Fmult = 0.82) 0.993 1
Biom
ass
refe
renc
e po
ints
Fi
shin
g m
orta
lity
RP
Table 9
Table 10

Conclusions Biomass limit reference points: • For both stocks there is a high probability of being above the
proposed biomass limit reference points Fishing mortality limit reference points: • Bigeye: Reduce Fcur by 4% to have a P(Fcur< 1.3 FMSY) =90% • Yellowfin: Reduce Fcur by 14% top 17% to have a P(Fcur< 1.4 FMSY) =90% Target Reference points: • Bigeye – if the steepness in 0.75 and F=FMSY the population will
not rebuild to SMSY within 10 years. Mispecification: • Our results indicates that there may be an inconsistency
between these fishing mortality and biomass limit reference points
Conclusions Computation of the the Kobe II Strategy Matrix:
– Calculations for fishing mortality reference points are less computationally demanding than those for biomass reference points, which is convenient since the informal decision rule used to manage tuna in the EPO is based on fishing mortality.
– Other model structure uncertainty and mispecification (e.g. natural mortality and the average length of old individuals) should also be included in the evaluation of the Kobe II Strategy Matrix and limit reference points.
A form of management strategy evaluation (MSE) – The analyses presented in this report evaluates the current informal harvest control
rule used for managing tunas in the EPO (i.e. set the fishing mortality at FMSY). – We evaluated the harvest control rule under different states of nature through two
assumptions about the steepness of the stock-recruitment relationship. – This MSE should be extended to include additional states of nature. Other harvest
control rules could also be evaluated.

Thank you!


![Kansai Airports Kobe: Strategy and Vision...Kansai Airports Kobe: Strategy and Vision U For Integrated Operation of Three Airports in Kansai Region ]d September 26. 2017 Kansai Airports](https://img.pdfslide.us/doc/110x75/5f8641fa32e2c85376466493/kansai-airports-kobe-strategy-and-vision-kansai-airports-kobe-strategy-and.jpg)