Embed Size (px)
Citation preview
KNX 3Q20 Earnings Presentation
Exhibit 99.2

2
Disclosure
This presentation, including documents incorporated herein by reference, will contain forward-looking statements within the meaning of Section 27A of the Securities Act of 1933, as amended and Section 21E of the Securities Exchange Act of 1934, as amended. Such forward-looking statements are made pursuant to the safe harbor provisions of the Private Securities Litigation Reform Act of 1995. Forward-looking statements are subject to risks and uncertainties that could cause actual results to differ materially from those contemplated by the forward-looking statements. Please review our disclosures in filings with the United States Securities and Exchange Commission.
Non-GAAP Financial Data
This presentation includes the use of adjusted operating income, operating ratio, adjusted operating ratio, net income, adjusted earnings per share, adjusted pre-tax income, return on net tangible assets, adjusted leverage ratio, available liquidity, and free cash flow, which are financial measures that are not in accordance with United States generally accepted accounting principles (“GAAP”). Each such measure is a supplemental non-GAAP financial measure that is used by management and external users of our financial statements, such as industry analysts, investors and lenders. While management believes such measures are useful for investors, they should not be used as a replacement for financial measures that are in accordance with GAAP. In addition, our use of these non-GAAP measures should not be interpreted as indicating that these or similar items could not occur in future periods. In addition, adjusted operating ratio excludes trucking segment fuel surcharges from revenue and nets these surcharges against fuel expense.
3
Disclosure
On September 8, 2017, pursuant to the Agreement and Plan of Merger, dated as of April 9, 2017, by Swift Transportation Company (“Swift”), Bishop Merger Sub, Inc., a direct wholly owned subsidiary of Swift, (“Merger Sub”), and Knight Transportation, Inc. (“Knight”), Merger Sub merged with and into Knight, with Knight surviving as a direct wholly owned subsidiary of Swift (the “2017 Merger”). Knight was the accounting acquirer and Swift was the legal acquirer in the 2017 Merger. In accordance with the accounting treatment applicable to the 2017 Merger, throughout this presentation, the reported results do not include the results of operations of Swift and its subsidiaries on and prior to the 2017 Merger date of September 8, 2017 (the “2017 Merger Date”). However, where indicated, certain historical information of Swift and its subsidiaries on and prior to the 2017 Merger Date, including their results of operations and certain operational statistics (collectively, the “Swift Historical Information”), has been provided. Management believes that presentation of the Swift Historical Information will be useful to investors. The Swift Historical Information has not been prepared in accordance with the rules of the Securities and Exchange Commission, including Article 11 of Regulation S-X, and it therefore does not reflect any of the pro forma adjustments that would be required by Article 11 of Regulation S-X. The Swift Historical Information does not purport to indicate the results that would have been obtained had the Swift and Knight businesses been operated together during the periods presented, or which may be realized in the future.

4
KNX Overview
Trucking
Q3 '20 YTD 2020Revenue (ex. fuel surcharge and intersegment transactions) $ 902.6 M $ 2,539.7 MAdjusted Operating Ratio 1 81.3 % 84.3 %
• 13,446 irregular route tractors, 5,018 dedicated tractors, and 58,310 combined trailers• Dry Van, Refrigerated, Dedicated, Flatbed, Drayage, and Expedited service offerings
IntermodalQ3 '20 YTD 2020
Revenue (ex intersegment transactions) $ 98.8 M $ 276.1 MAdjusted Operating Ratio 1 99.7 % 102.5 %
• 548 tractors and 10,852 containers
LogisticsQ3 '20 YTD 2020
Revenue (ex intersegment transactions) $ 96.2 M $ 240.1 MAdjusted Operating Ratio 1 97.4 % 96.2 %
Shareholder Value
YTD 2020• Free Cash Flow of $379M 2 3
• TTM Return on Net Tangible Assets of 12.8% 1
• Leverage Ratio of 0.65 1
• Repurchased $35M of our common stock in Q1• $41M paid out in Dividends
1 See GAAP to non-GAAP reconciliation in the schedules following this presentation2 Free Cash Flow is a non-GAAP measure defined as net cash provided by operating
activities, less net capital expenditures. 3 Includes $93M for a legal settlement during the first quarter associated with pre-2017 Merger
legal matters that were previously accrued and disclosed by Swift
5
Third Quarter 2020 Comparative Results
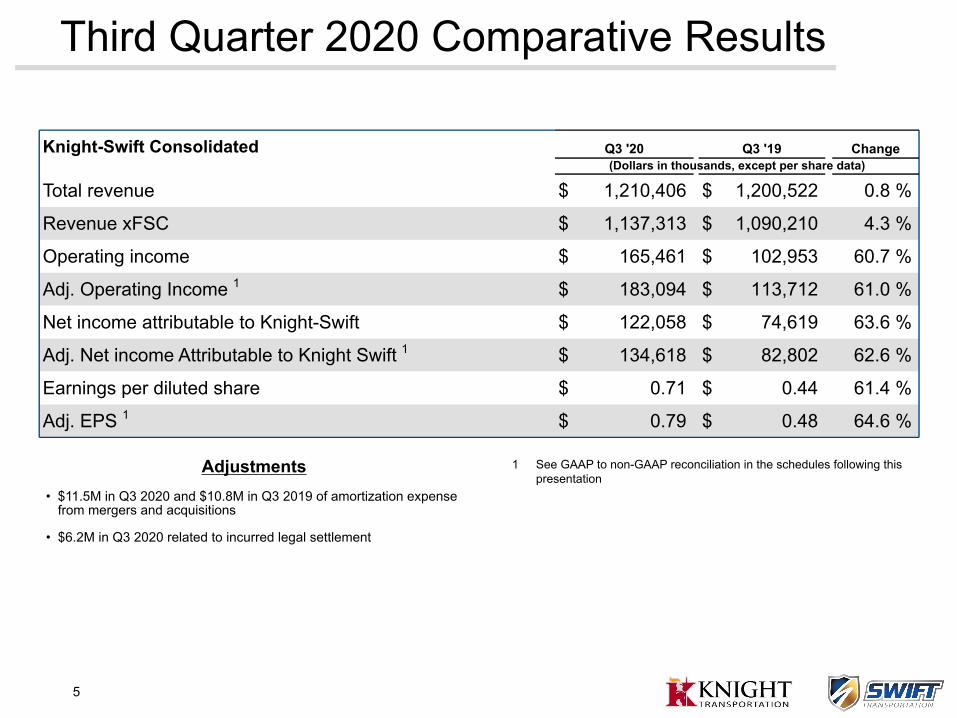
Adjustments• $11.5M in Q3 2020 and $10.8M in Q3 2019 of amortization expense
from mergers and acquisitions
• $6.2M in Q3 2020 related to incurred legal settlement
1 See GAAP to non-GAAP reconciliation in the schedules following this presentation
Knight-Swift Consolidated Q3 '20 Q3 '19 Change(Dollars in thousands, except per share data)
Total revenue $ 1,210,406 $ 1,200,522 0.8 %
Revenue xFSC $ 1,137,313 $ 1,090,210 4.3 %
Operating income $ 165,461 $ 102,953 60.7 %
Adj. Operating Income 1 $ 183,094 $ 113,712 61.0 %
Net income attributable to Knight-Swift $ 122,058 $ 74,619 63.6 %
Adj. Net income Attributable to Knight Swift 1 $ 134,618 $ 82,802 62.6 %
Earnings per diluted share $ 0.71 $ 0.44 61.4 %
Adj. EPS 1 $ 0.79 $ 0.48 64.6 %

6
Operating Performance – Trucking
• 81.3% Adjusted Operating Ratio in Q3 2020 compared to 87.5% the previous year
• 54.3% year-over-year improvement in Operating Income
• 77.9% Swift Truckload Adj. Operating Ratio
• 80.1% Knight Trucking Adj. Operating Ratio
• 5.1% improvement in revenue excluding fsc per loaded mile from Q3 2019
1 See GAAP to non-GAAP reconciliation in the schedules following this presentation.
Trucking Operating Statistics
Q3 '20 Q3 '19 Change
Average revenue per tractor $48,884 $46,372 5.4 %
Average tractors 18,464 18,899 (2.3 %)
Average trailers 58,310 57,889 0.7 %
Miles per tractor 23,422 23,397 0.1 %
Trucking Financial Metrics
Q3 '20 Q3 '19 Change
(Dollars in thousands)
Revenue xFSC $902,592 $876,385 3.0 %
Operating income $168,781 $109,409 54.3 %
Adjusted Operating Income 1 $169,105 $109,758 54.1 %
Operating ratio 82.7% 88.9% (620 bps)
Adjusted Operating Ratio 1 81.3% 87.5% (620 bps)

7
Adjusted Operating Ratio Parity Achieved
Rolling 4 Qtr Total
% D
iffer
ence
= S
wift
Adj
OR
- K
nigh
t Adj
OR
Rolling 4 Qtr Difference in Knight Trucking and Swift TruckloadAdjusted Operating Ratios
4Q15 1Q16 2Q16 3Q16 4Q16 1Q17 2Q17 3Q17 4Q17 1Q18 2Q18 3Q18 4Q18 1Q19 2Q19 3Q19 4Q19 1Q20 2Q20 3Q20(2.0)%
—%
2.0%
4.0%
6.0%
8.0%
10.0%
Historical information prior to the Swift merger in September 2017 has not been prepared in accordance with the rules of the United States Securities and Exchange Commission, including Article 11 of Regulation S-X, and it therefore does not reflect any of the pro forma adjustments that would be required by Article 11 of Regulation S-X. The Swift Historical Information does not purport to indicate the results that would have been obtained had the Swift and Knight businesses been operated together during the period presented, or which may be realized in the future.
Swift Truckload Adjusted Operating Ratio is now on par with Knight moving from 700 bps higher pre-merger to 30 bps lower in total over the past 4 quarters
1
1
8
Operating Performance – Logistics
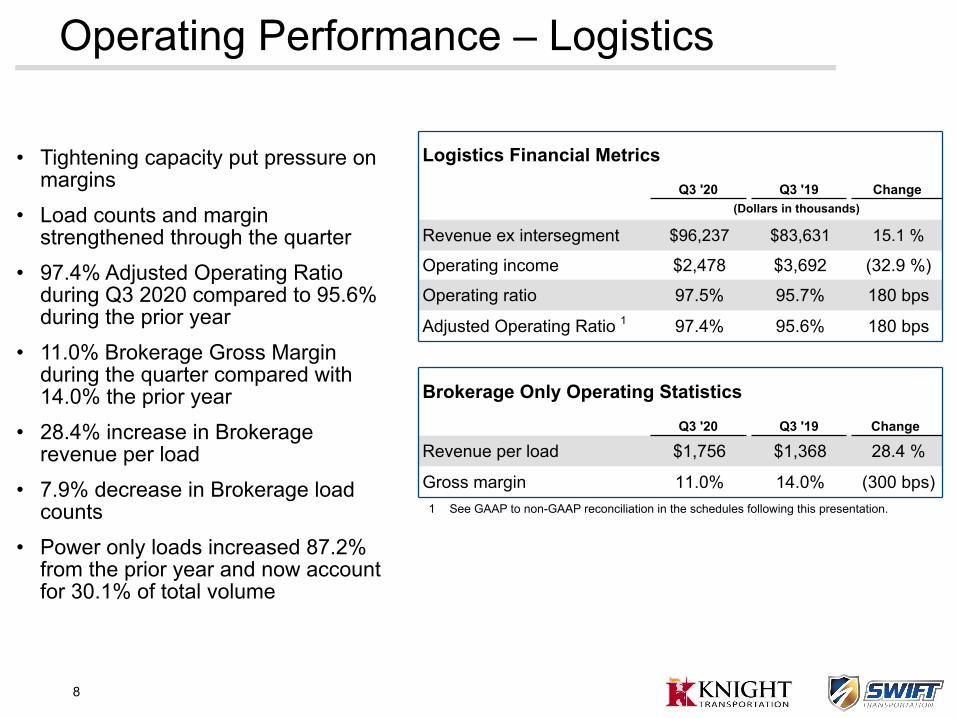
• Tightening capacity put pressure on margins
• Load counts and margin strengthened through the quarter
• 97.4% Adjusted Operating Ratio during Q3 2020 compared to 95.6% during the prior year
• 11.0% Brokerage Gross Margin during the quarter compared with 14.0% the prior year
• 28.4% increase in Brokerage revenue per load
• 7.9% decrease in Brokerage load counts
• Power only loads increased 87.2% from the prior year and now account for 30.1% of total volume
1 See GAAP to non-GAAP reconciliation in the schedules following this presentation.
Brokerage Only Operating Statistics
Q3 '20 Q3 '19 Change
Revenue per load $1,756 $1,368 28.4 %
Gross margin 11.0% 14.0% (300 bps)
Logistics Financial Metrics
Q3 '20 Q3 '19 Change(Dollars in thousands)
Revenue ex intersegment $96,237 $83,631 15.1 %
Operating income $2,478 $3,692 (32.9 %)
Operating ratio 97.5% 95.7% 180 bps
Adjusted Operating Ratio 1 97.4% 95.6% 180 bps
9
Operating Performance – Intermodal
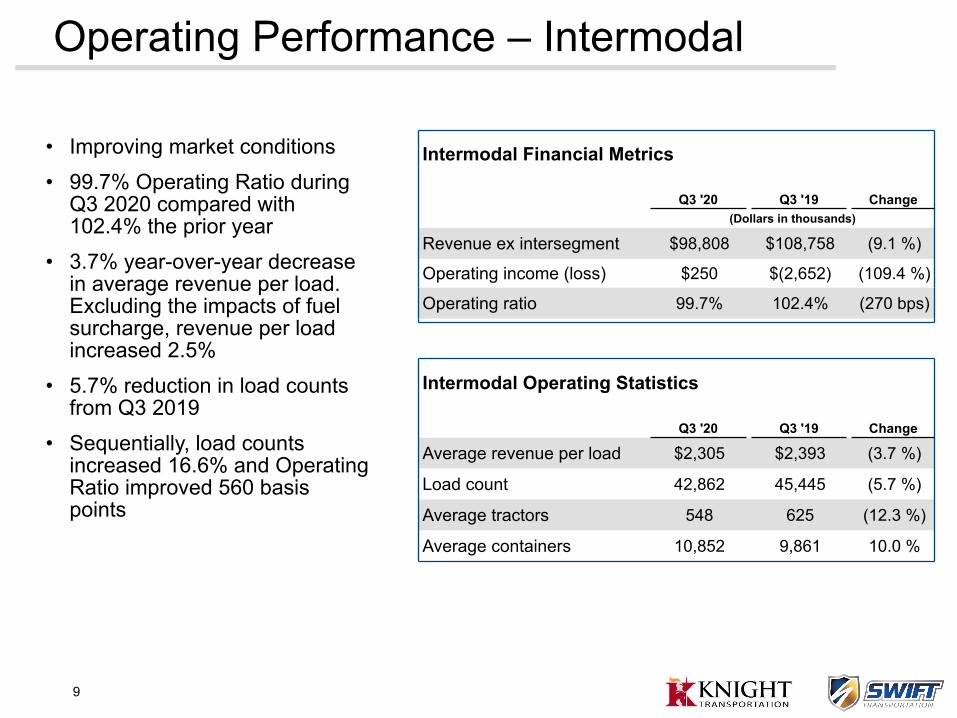
• Improving market conditions
• 99.7% Operating Ratio during Q3 2020 compared with 102.4% the prior year
• 3.7% year-over-year decrease in average revenue per load. Excluding the impacts of fuel surcharge, revenue per load increased 2.5%
• 5.7% reduction in load counts from Q3 2019
• Sequentially, load counts increased 16.6% and Operating Ratio improved 560 basis points
Intermodal Operating Statistics
Q3 '20 Q3 '19 Change
Average revenue per load $2,305 $2,393 (3.7 %)
Load count 42,862 45,445 (5.7 %)
Average tractors 548 625 (12.3 %)
Average containers 10,852 9,861 10.0 %
Intermodal Financial Metrics
Q3 '20 Q3 '19 Change
(Dollars in thousands)
Revenue ex intersegment $98,808 $108,758 (9.1 %)
Operating income (loss) $250 $(2,652) (109.4 %)
Operating ratio 99.7% 102.4% (270 bps)
10
Market Outlook Q4 2020 and FY 2021
• We expect the strong freight conditions to continue• Inventory restocking and strong demand will support a favorable
environment into 2021• Low double digit contract rate increases in 2021• The challenge of sourcing and retaining drivers will continue and
lead to additional driver wage inflation• Strong project business in the fourth quarter of 2020

11
2020 Guidance
Expected Adjusted EPS for the full year 2020 of $2.68 - $2.72Expected Adjusted EPS for the full year 2021 of $3.20 - $3.40
Guidance Assumptions• Contract rate improvements in the low double digits in 2021• Miles per truck will be flat to slightly positive year-over-year• Modest tractor growth• Margin improvement in Logistics and Intermodal• Inflationary pressure on driver wages, recruiting and hiring expenses• Tax rate of 25.5% - 27.0% before discrete items for 2020 and 2021• Net Capex for the full year 2020 expected range of $380M - $405M
and 2021 expected range of $430M - $480M◦ Expect to utilize finance leases for equipment purchases of
approximately $120M in both 2020 and 2021 to take advantage of low fixed interest rates and to maintain our leverage ratio

12
Appendix

13
Non-GAAP ReconciliationNon-GAAP Reconciliation (Unaudited):Adjusted Operating Income and Adjusted Operating Ratio 1
Quarter-to-Date September 30, Year-to-Date September 30,2020 2019 2020 2019
GAAP Presentation (Dollars in thousands)
Total revenue $ 1,210,406 $ 1,200,522 $ 3,395,902 $ 3,647,140 Total operating expenses (1,044,945) (1,097,569) (3,026,155) (3,319,295)
Operating income $ 165,461 $ 102,953 $ 369,747 $ 327,845 Operating ratio 86.3 % 91.4 % 89.1 % 91.0 %
Non-GAAP PresentationTotal revenue $ 1,210,406 $ 1,200,522 $ 3,395,902 $ 3,647,140 Trucking fuel surcharge (73,093) (110,312) (233,897) (337,220)
Revenue, excluding trucking fuel surcharge 1,137,313 1,090,210 3,162,005 3,309,920
Total operating expenses 1,044,945 1,097,569 3,026,155 3,319,295 Adjusted for:Trucking fuel surcharge (73,093) (110,312) (233,897) (337,220) Amortization of intangibles 2 (11,473) (10,759) (34,421) (32,144) Impairments 3 — — (1,255) (2,182) Legal Accruals 4 (6,160) — (6,160) (15,500) COVID-19 incremental costs 5 — — (12,259) —
Adjusted Operating Expenses 954,219 976,498 2,738,163 2,932,249 Adjusted Operating Income $ 183,094 $ 113,712 $ 423,842 $ 377,671 Adjusted Operating Ratio 83.9 % 89.6 % 86.6 % 88.6 %
1 Pursuant to the requirements of Regulation G, this table reconciles consolidated GAAP operating ratio to consolidated non-GAAP Adjusted Operating Ratio.2 "Amortization of intangibles" reflects the non-cash amortization expense relating to intangible assets identified in the 2017 Merger and other acquisitions.3 "Impairments" reflects the non-cash impairment of certain tractors (within the Trucking segment) and certain legacy trailers (within the non-reportable segments) as a result of a softer
used equipment market during the second quarter of 2020, as well as impairment charges of trailer tracking equipment (within the Trucking segment) during the first quarter of 2020. In the second quarter of 2019, we incurred a non-cash impairment of leasehold improvements (within the Trucking segment) which were incurred during the early termination of a lease related to one of our operating properties.
4 "Legal accruals" reflects costs incurred in the third quarter of 2020 related to certain class action lawsuits involving certain pre-merger employment-related claims that were previously disclosed by Swift, and in the second quarter of 2019 costs incurred with an issued jury verdict. These costs are included in "Miscellaneous operating expenses" in the condensed consolidated statements of comprehensive income.
5 "COVID-19 incremental costs" reflects costs incurred during 2020 that were directly attributable to the pandemic and were incremental to those incurred prior to the outbreak. These include payroll premiums paid to our drivers and shop mechanics, additional disinfectants and cleaning supplies, and various other pandemic-specific items. The costs are clearly separable from our normal business operations and are not expected to recur once the pandemic subsides.
14
Non-GAAP Reconciliation
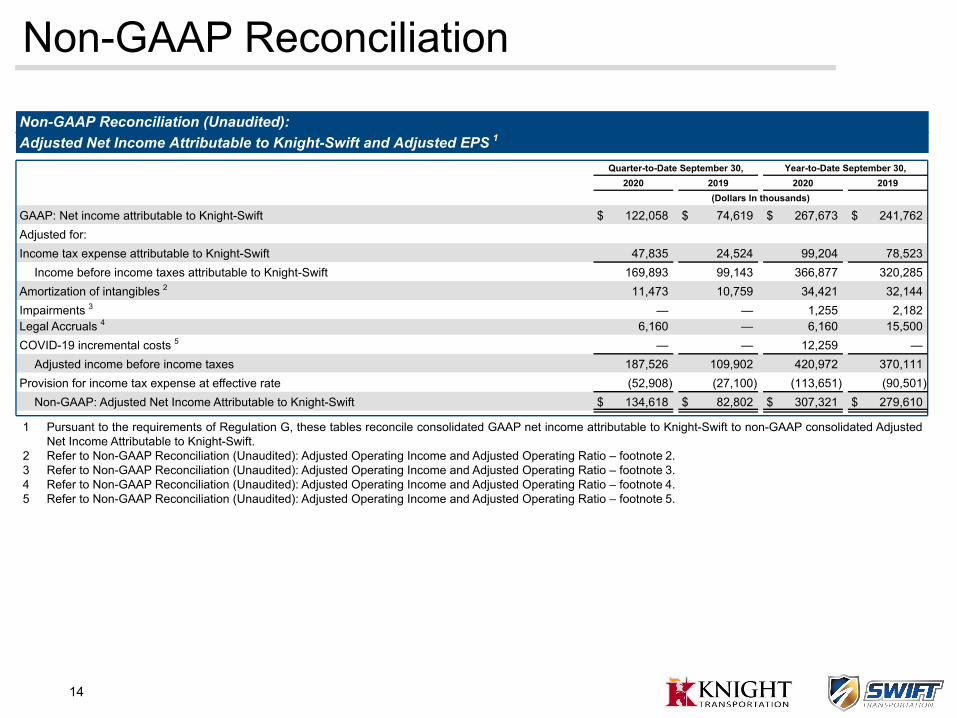
Non-GAAP Reconciliation (Unaudited):Adjusted Net Income Attributable to Knight-Swift and Adjusted EPS 1
Quarter-to-Date September 30, Year-to-Date September 30,2020 2019 2020 2019
(Dollars In thousands)
GAAP: Net income attributable to Knight-Swift $ 122,058 $ 74,619 $ 267,673 $ 241,762 Adjusted for:Income tax expense attributable to Knight-Swift 47,835 24,524 99,204 78,523
Income before income taxes attributable to Knight-Swift 169,893 99,143 366,877 320,285 Amortization of intangibles 2 11,473 10,759 34,421 32,144 Impairments 3 — — 1,255 2,182 Legal Accruals 4 6,160 — 6,160 15,500 COVID-19 incremental costs 5 — — 12,259 —
Adjusted income before income taxes 187,526 109,902 420,972 370,111 Provision for income tax expense at effective rate (52,908) (27,100) (113,651) (90,501)
Non-GAAP: Adjusted Net Income Attributable to Knight-Swift $ 134,618 $ 82,802 $ 307,321 $ 279,610
1 Pursuant to the requirements of Regulation G, these tables reconcile consolidated GAAP net income attributable to Knight-Swift to non-GAAP consolidated Adjusted Net Income Attributable to Knight-Swift.
2 Refer to Non-GAAP Reconciliation (Unaudited): Adjusted Operating Income and Adjusted Operating Ratio – footnote 2.3 Refer to Non-GAAP Reconciliation (Unaudited): Adjusted Operating Income and Adjusted Operating Ratio – footnote 3.4 Refer to Non-GAAP Reconciliation (Unaudited): Adjusted Operating Income and Adjusted Operating Ratio – footnote 4.5 Refer to Non-GAAP Reconciliation (Unaudited): Adjusted Operating Income and Adjusted Operating Ratio – footnote 5.

15
Non-GAAP Reconciliation
Non-GAAP Reconciliation (Unaudited):Adjusted Net Income Attributable to Knight-Swift and Adjusted EPS 1
Quarter-to-Date September 30, Year-to-Date September 30,2020 2019 2020 2019
GAAP: Earnings per diluted share $ 0.71 $ 0.44 $ 1.57 $ 1.40 Adjusted for:Income tax expense attributable to Knight-Swift 0.28 0.14 0.58 0.46
Income before income taxes attributable to Knight-Swift 0.99 0.58 2.15 1.86 Amortization of intangibles 2 0.07 0.06 0.20 0.19 Impairments 3 — — 0.01 0.01 Legal Accruals 4 0.04 — 0.04 0.09 COVID-19 incremental costs 5 — — 0.07 —
Adjusted income before income taxes 1.10 0.64 2.46 2.15 Provision for income tax expense at effective rate (0.31) (0.16) (0.66) (0.52)
Non-GAAP: Adjusted EPS $ 0.79 $ 0.48 $ 1.80 $ 1.62
Note: Because the numbers reflected in the table above are calculated on a per share basis, they may not foot due to rounding.
1 Pursuant to the requirements of Regulation G, these tables reconcile consolidated GAAP diluted earnings per share to non-GAAP consolidated Adjusted EPS.2 Refer to Non-GAAP Reconciliation (Unaudited): Adjusted Operating Income and Adjusted Operating Ratio – footnote 2.3 Refer to Non-GAAP Reconciliation (Unaudited): Adjusted Operating Income and Adjusted Operating Ratio – footnote 3.4 Refer to Non-GAAP Reconciliation (Unaudited): Adjusted Operating Income and Adjusted Operating Ratio – footnote 4.5 Refer to Non-GAAP Reconciliation (Unaudited): Adjusted Operating Income and Adjusted Operating Ratio – footnote 5.
16
Non-GAAP Reconciliation
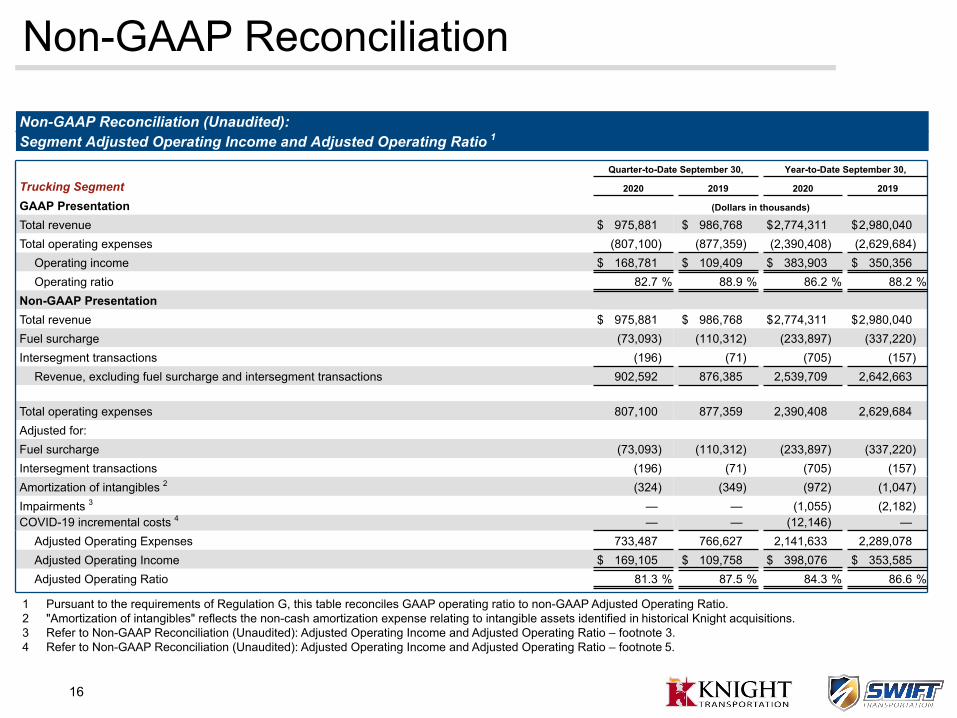
Non-GAAP Reconciliation (Unaudited):Segment Adjusted Operating Income and Adjusted Operating Ratio 1
Quarter-to-Date September 30, Year-to-Date September 30,
Trucking Segment 2020 2019 2020 2019
GAAP Presentation (Dollars in thousands)
Total revenue $ 975,881 $ 986,768 $ 2,774,311 $ 2,980,040 Total operating expenses (807,100) (877,359) (2,390,408) (2,629,684)
Operating income $ 168,781 $ 109,409 $ 383,903 $ 350,356 Operating ratio 82.7 % 88.9 % 86.2 % 88.2 %
Non-GAAP PresentationTotal revenue $ 975,881 $ 986,768 $ 2,774,311 $ 2,980,040 Fuel surcharge (73,093) (110,312) (233,897) (337,220) Intersegment transactions (196) (71) (705) (157)
Revenue, excluding fuel surcharge and intersegment transactions 902,592 876,385 2,539,709 2,642,663
Total operating expenses 807,100 877,359 2,390,408 2,629,684 Adjusted for:Fuel surcharge (73,093) (110,312) (233,897) (337,220) Intersegment transactions (196) (71) (705) (157) Amortization of intangibles 2 (324) (349) (972) (1,047) Impairments 3 — — (1,055) (2,182) COVID-19 incremental costs 4 — — (12,146) —
Adjusted Operating Expenses 733,487 766,627 2,141,633 2,289,078 Adjusted Operating Income $ 169,105 $ 109,758 $ 398,076 $ 353,585 Adjusted Operating Ratio 81.3 % 87.5 % 84.3 % 86.6 %
1 Pursuant to the requirements of Regulation G, this table reconciles GAAP operating ratio to non-GAAP Adjusted Operating Ratio.2 "Amortization of intangibles" reflects the non-cash amortization expense relating to intangible assets identified in historical Knight acquisitions.3 Refer to Non-GAAP Reconciliation (Unaudited): Adjusted Operating Income and Adjusted Operating Ratio – footnote 3.4 Refer to Non-GAAP Reconciliation (Unaudited): Adjusted Operating Income and Adjusted Operating Ratio – footnote 5.
17
Non-GAAP Reconciliation
Quarter-to-Date September 30, Year-to-Date September 30,
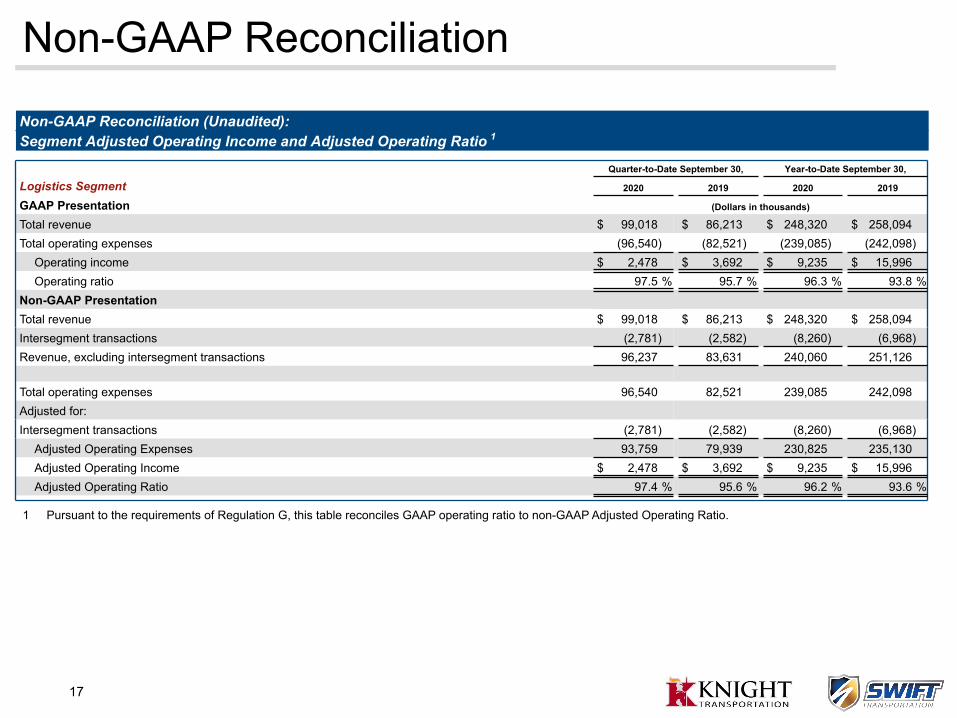
Logistics Segment 2020 2019 2020 2019
GAAP Presentation (Dollars in thousands)
Total revenue $ 99,018 $ 86,213 $ 248,320 $ 258,094 Total operating expenses (96,540) (82,521) (239,085) (242,098)
Operating income $ 2,478 $ 3,692 $ 9,235 $ 15,996 Operating ratio 97.5 % 95.7 % 96.3 % 93.8 %
Non-GAAP PresentationTotal revenue $ 99,018 $ 86,213 $ 248,320 $ 258,094 Intersegment transactions (2,781) (2,582) (8,260) (6,968) Revenue, excluding intersegment transactions 96,237 83,631 240,060 251,126
Total operating expenses 96,540 82,521 239,085 242,098 Adjusted for:Intersegment transactions (2,781) (2,582) (8,260) (6,968)
Adjusted Operating Expenses 93,759 79,939 230,825 235,130 Adjusted Operating Income $ 2,478 $ 3,692 $ 9,235 $ 15,996 Adjusted Operating Ratio 97.4 % 95.6 % 96.2 % 93.6 %
Non-GAAP Reconciliation (Unaudited):Segment Adjusted Operating Income and Adjusted Operating Ratio 1
1 Pursuant to the requirements of Regulation G, this table reconciles GAAP operating ratio to non-GAAP Adjusted Operating Ratio.
18
Non-GAAP Reconciliation
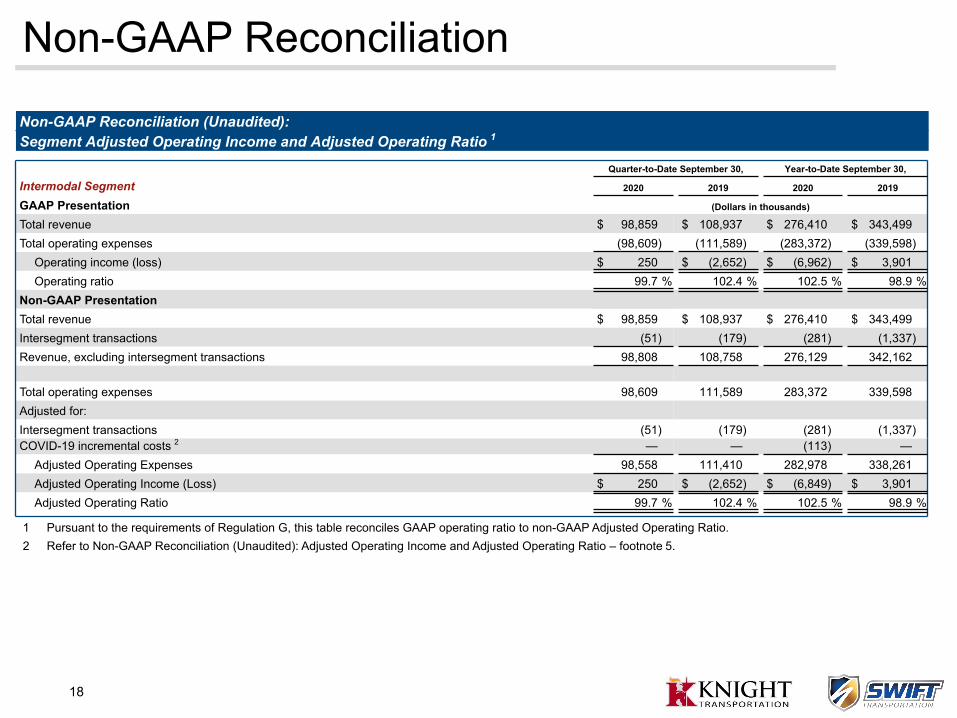
Non-GAAP Reconciliation (Unaudited):Segment Adjusted Operating Income and Adjusted Operating Ratio 1
Quarter-to-Date September 30, Year-to-Date September 30,
Intermodal Segment 2020 2019 2020 2019
GAAP Presentation (Dollars in thousands)
Total revenue $ 98,859 $ 108,937 $ 276,410 $ 343,499 Total operating expenses (98,609) (111,589) (283,372) (339,598)
Operating income (loss) $ 250 $ (2,652) $ (6,962) $ 3,901 Operating ratio 99.7 % 102.4 % 102.5 % 98.9 %
Non-GAAP PresentationTotal revenue $ 98,859 $ 108,937 $ 276,410 $ 343,499 Intersegment transactions (51) (179) (281) (1,337) Revenue, excluding intersegment transactions 98,808 108,758 276,129 342,162
Total operating expenses 98,609 111,589 283,372 339,598 Adjusted for:Intersegment transactions (51) (179) (281) (1,337) COVID-19 incremental costs 2 — — (113) —
Adjusted Operating Expenses 98,558 111,410 282,978 338,261 Adjusted Operating Income (Loss) $ 250 $ (2,652) $ (6,849) $ 3,901 Adjusted Operating Ratio 99.7 % 102.4 % 102.5 % 98.9 %
1 Pursuant to the requirements of Regulation G, this table reconciles GAAP operating ratio to non-GAAP Adjusted Operating Ratio.2 Refer to Non-GAAP Reconciliation (Unaudited): Adjusted Operating Income and Adjusted Operating Ratio – footnote 5.

19
Non-GAAP Reconciliation
Non-GAAP Reconciliation (Unaudited):Return on Net Tangible Assets 1
September 30,2020 2019(Dollars in thousands)
Total assets $ 8,501,361 $ 8,322,225
Adjusted for:Intangible assets, net (1,400,719) (1,391,157) Goodwill (2,922,967) (2,918,995)
Tangible Assets $ 4,177,675 $ 4,012,073
Total liabilities $ 2,620,113 $ 2,716,932 Adjusted for:
Revolving line of credit, finance lease obligations, and long-term debt (679,908) (750,533) Accounts receivable securitization (201,878) (204,723) Deferred income tax liabilities (802,292) (774,683)
Non-Interest Bearing Liabilities, excluding deferred income tax liabilities $ 936,035 $ 986,993
Net Tangible Assets $ 3,241,640 $ 3,025,080 Average Net Tangible Assets $ 3,133,360 Adjusted Net Income TTM September 30, 2020 $ 400,793 Return on Net Tangible Assets 12.8 %
1 Pursuant to the requirements of Regulation G, this table reconciles Total Assets and Total Liabilities to Average Net Tangible Assets.
20
Non-GAAP Reconciliation
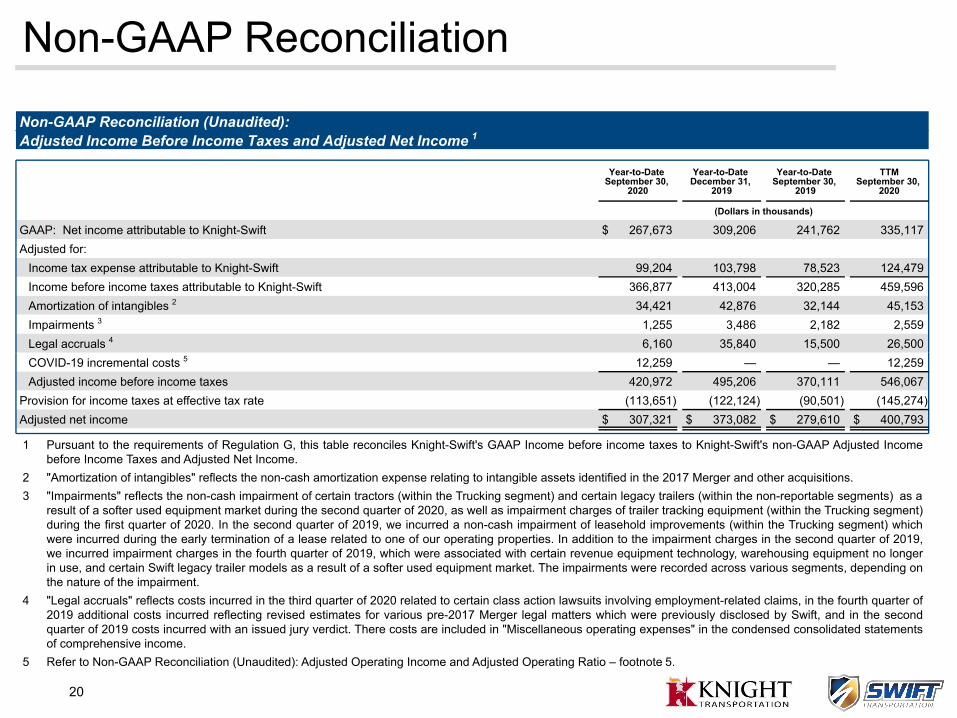
Non-GAAP Reconciliation (Unaudited):Adjusted Income Before Income Taxes and Adjusted Net Income 1
Year-to-Date September 30,
2020
Year-to-Date December 31,
2019
Year-to-Date September 30,
2019
TTMSeptember 30,
2020
(Dollars in thousands)
GAAP: Net income attributable to Knight-Swift $ 267,673 309,206 241,762 335,117 Adjusted for:
Income tax expense attributable to Knight-Swift 99,204 103,798 78,523 124,479 Income before income taxes attributable to Knight-Swift 366,877 413,004 320,285 459,596 Amortization of intangibles 2 34,421 42,876 32,144 45,153 Impairments 3 1,255 3,486 2,182 2,559 Legal accruals 4 6,160 35,840 15,500 26,500 COVID-19 incremental costs 5 12,259 — — 12,259 Adjusted income before income taxes 420,972 495,206 370,111 546,067
Provision for income taxes at effective tax rate (113,651) (122,124) (90,501) (145,274) Adjusted net income $ 307,321 $ 373,082 $ 279,610 $ 400,793
1 Pursuant to the requirements of Regulation G, this table reconciles Knight-Swift's GAAP Income before income taxes to Knight-Swift's non-GAAP Adjusted Income before Income Taxes and Adjusted Net Income.
2 "Amortization of intangibles" reflects the non-cash amortization expense relating to intangible assets identified in the 2017 Merger and other acquisitions.3 "Impairments" reflects the non-cash impairment of certain tractors (within the Trucking segment) and certain legacy trailers (within the non-reportable segments) as a
result of a softer used equipment market during the second quarter of 2020, as well as impairment charges of trailer tracking equipment (within the Trucking segment) during the first quarter of 2020. In the second quarter of 2019, we incurred a non-cash impairment of leasehold improvements (within the Trucking segment) which were incurred during the early termination of a lease related to one of our operating properties. In addition to the impairment charges in the second quarter of 2019, we incurred impairment charges in the fourth quarter of 2019, which were associated with certain revenue equipment technology, warehousing equipment no longer in use, and certain Swift legacy trailer models as a result of a softer used equipment market. The impairments were recorded across various segments, depending on the nature of the impairment.
4 "Legal accruals" reflects costs incurred in the third quarter of 2020 related to certain class action lawsuits involving employment-related claims, in the fourth quarter of 2019 additional costs incurred reflecting revised estimates for various pre-2017 Merger legal matters which were previously disclosed by Swift, and in the second quarter of 2019 costs incurred with an issued jury verdict. There costs are included in "Miscellaneous operating expenses" in the condensed consolidated statements of comprehensive income.
5 Refer to Non-GAAP Reconciliation (Unaudited): Adjusted Operating Income and Adjusted Operating Ratio – footnote 5.

21
Non-GAAP Reconciliation (Unaudited):Net Leverage and Leverage Ratio 1 2
Non-GAAP Reconciliation
September 30, 2020(Dollars in
thousands)Term loan $ 365,000 Revolving line of credit 170,000 Accounts receivable securitization 202,000 Other secured debt and finance leases 144,908
Total face value of debt 881,908 Unrestricted cash and cash equivalents (240,236)
Non-GAAP: Net Leverage $ 641,672
Non-GAAP: Adjusted EBITDA TTM September 30, 2020 $ 987,388
Non-GAAP: Leverage Ratio 0.65
1 Pursuant to the requirements of Regulation G, these tables reconcile consolidated GAAP net income attributable to Knight-Swift to non-GAAP consolidated EBITDA, Adjusted EBITDA, Net Leverage, and Leverage Ratio
2 Leverage Ratio is calculated in accordance with the provisions of Knight-Swift's senior credit facility.
22
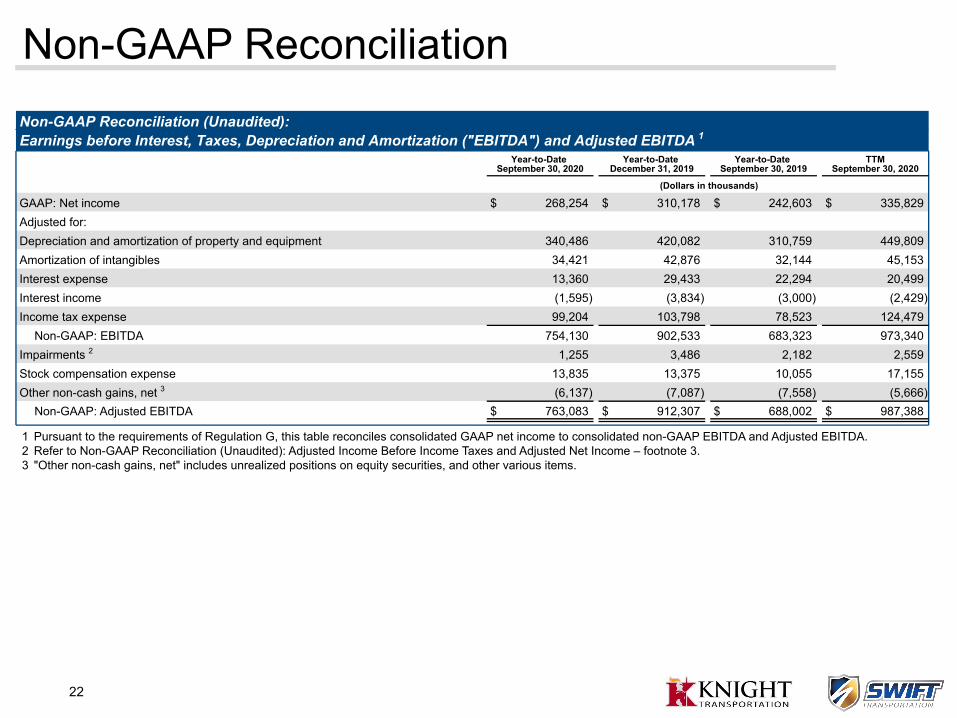
1 Pursuant to the requirements of Regulation G, this table reconciles consolidated GAAP net income to consolidated non-GAAP EBITDA and Adjusted EBITDA. 2 Refer to Non-GAAP Reconciliation (Unaudited): Adjusted Income Before Income Taxes and Adjusted Net Income – footnote 3.3 "Other non-cash gains, net" includes unrealized positions on equity securities, and other various items.
Non-GAAP Reconciliation (Unaudited):Earnings before Interest, Taxes, Depreciation and Amortization ("EBITDA") and Adjusted EBITDA 1
Non-GAAP Reconciliation
Year-to-Date September 30, 2020
Year-to-Date December 31, 2019
Year-to-Date September 30, 2019
TTMSeptember 30, 2020
(Dollars in thousands)
GAAP: Net income $ 268,254 $ 310,178 $ 242,603 $ 335,829 Adjusted for:Depreciation and amortization of property and equipment 340,486 420,082 310,759 449,809 Amortization of intangibles 34,421 42,876 32,144 45,153 Interest expense 13,360 29,433 22,294 20,499 Interest income (1,595) (3,834) (3,000) (2,429) Income tax expense 99,204 103,798 78,523 124,479
Non-GAAP: EBITDA 754,130 902,533 683,323 973,340 Impairments 2 1,255 3,486 2,182 2,559 Stock compensation expense 13,835 13,375 10,055 17,155 Other non-cash gains, net 3 (6,137) (7,087) (7,558) (5,666)
Non-GAAP: Adjusted EBITDA $ 763,083 $ 912,307 $ 688,002 $ 987,388