Embed Size (px)
Citation preview
Infrastructure September 03, 2014
KNR Construction
Bloomberg: KNRC IN Reuters: KNRL.BO
BUY
Institutional Equities
India Research
COMPANY UPDATE
Recommendation
CMP: Rs243
Target Price: Rs325
Previous Target Price: Rs140
Upside (%) 34%
Stock Information Market Cap. (Rs bn / US$ mn) 07/113
52-week High/Low (Rs) 265/46
3m ADV (Rs mn /US$ mn) 38/0.6
Beta 1.0
Sensex/ Nifty 27,019/8,083
Share outstanding (mn) 28
Stock Performance (%) 1M 3M 12M YTD
Absolute 5.3 85.0 117.3 207.1
Rel. to Sensex (0.7) 69.0 51.9 140.6
Performance
Source: Bloomberg , Karvy Institutional Research
Click here to enter text.
Earnings Revision
(%) FY15E FY16E
Sales 5.6% 0%
EBITDA 17.2% 0%
PAT 24.7% 0%
Source: Karvy Institutional Research
Analysts Contact Parikshit Kandpal
022 6184 4311
40 90 140 190 240 290
15,000 17,000 19,000 21,000 23,000 25,000 27,000 29,000
Sep
-13
Oct
-13
No
v-1
3
Jan
-14
Feb
-14
Mar
-14
May
-14
Jun
-14
Jul-
14
Au
g-1
4
Sensex (LHS) KNR Const. (RHS)
High on execution, high on upside
KNR Constructions has come out relatively unscathed from the last two
down cycles which saw bigger competitors taking a deep dive into
bankruptcy bed. Whilst the infra sector is waking to brighter days, KNRC
continues to rely on past learning’s of being patient. The focus remains on
(i) execution (ii) taking higher margins projects & (iii) avoid excessive
investment largesse on diversification. Although part of re-rating is
already in price, going into the cyclical recovery later next year, we expect
re-rating tailwinds to further continue on back of superior execution, low
debt/equity and minimal incremental project equity requirement. We
maintain BUY stance with increased target price of Rs325/share.
Cyclical rebound, Ordering - to result in 56% FY15-17E EPS CAGR KNRC has Rs13bn of order backlog which is 1.4x FY15E revenues and hence
future growth is contingent on new order intake. We expect Road ordering
activity to pick up from 2HFY15E and owing to strong execution capability
KNRC stands to benefit from own/third party wins as EPC contract may get
outsourced to it. We have modeled for 56% EPS CAGR for FY15-17E.
Strong Balance sheet; free cash flows positive; D/E lowest Strong cash flow generation and high promoter holding give comfort on
future growth. Low D/E levels (0.1x) in comparison to its peer group, strong
customer advances and high margins have resulted in strong cash flows.
EPC main focus, cautious approach to BOTs bidding KNRC owns 40% stake in two annuity BOTs viz. KNT-1 & AP-7. These
projects have been already securitized and proceeds invested in Kerala BOT
project (Rs1,360mn equity share). Going into FY15E, we expect KNRC to win
road BOTs worth ~Rs15bn.
Strong competitive positioning – leader in the EPC pack KNRC stands out as a leader on the competitive mapping of the EPC players.
Superior execution, low debt/equity, positive cash flows along with the low
infra asset exposure are the contributing factors.
Maintain “BUY” stance: Increase Target price to Rs325/share We maintain our “BUY” recommendation on KNRC with an SOTP target
price of Rs325/share, valuing the Company’s standalone business at Rs259
/share based on 8x average FY16-17E earnings, Kerala BOT at Rs48/share (at
1x P/BV) and land bank at Rs18/share (book value). While new order wins
would be near-term catalysts, rate hike and slowdown are the inherent risks.
Exhibit 1: Key Financials
Y/E Mar (Rs mn) FY13 FY14 FY15E FY16E FY17E
Operating income 7,073 8,398 8,521 11,828 16,521
EBITDA 1,316 1,308 1,263 1,760 2,410
Net profit 521 610 446 730 1,088
EPS (Rs) 18.5 21.7 15.9 26.0 38.7
P/E (x) 13.1 11.2 15.3 9.4 6.3
RoE (%) 12.1 12.6 8.4 12.4 16.1
Source: Company, Karvy Institutional Research
2
September 03, 2014
KNR Construction
Outlook & Valuation
Target Price of Rs325 implies 34% upside Valuation Methodology: We have valued KNRC on P/E basis at 20% discount to
our construction coverage universe P/E and in line with its mid-cycle one year
forward P/E of 8x. At CMP, trades at one year forward P/BV of 1x, a 33% premium
to long-term average forward P/BV.
Investments in roads sector would continue to drive stock performance and,
KNRC with strong credentials will likely to benefit, from pick up in ordering
activity. We arrive at a target price of Rs325/share (valuing standalone business at
8x average FY16-17E EPS), Kerala BOT at Rs48/share (at 1x P/BV of equity
invested) & Real estate at Rs18/share (at 1x P/BV of amount invested). We have not
valued AP-07 & KNT-1, as these have already been securitized.
Exhibit 2: SOTP Valuation
Particulars Segments Value (Rsmn) Value per share(Rs) Rationale
KNR Standalone Core construction business 7,273 259 At 8x average FY16-17E Earnings
Kerala BOT Roads Toll 1,360 48 At 1x P/BV(x) of invested equity
Land Cost Real estate 510 18 At book value
Total 9,143 325
Source: Karvy Institutional Research
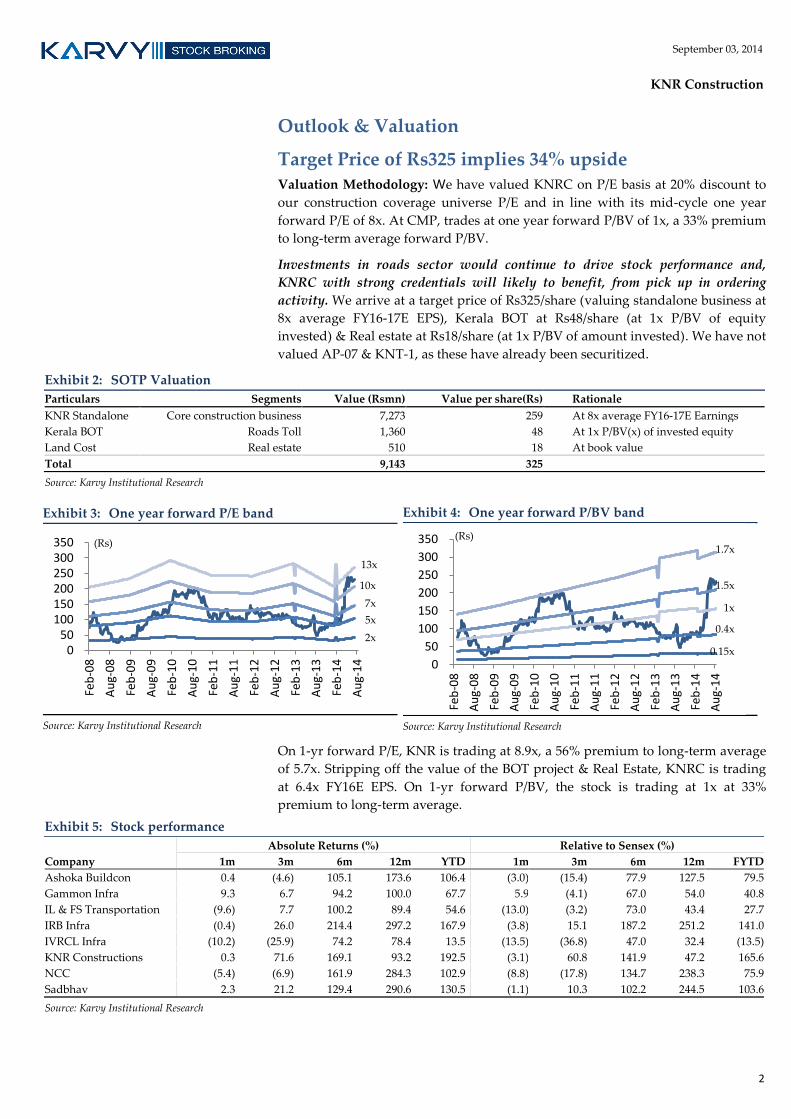
Exhibit 3: One year forward P/E band
Source: Karvy Institutional Research
Exhibit 4: One year forward P/BV band
Source: Karvy Institutional Research
On 1-yr forward P/E, KNR is trading at 8.9x, a 56% premium to long-term average
of 5.7x. Stripping off the value of the BOT project & Real Estate, KNRC is trading
at 6.4x FY16E EPS. On 1-yr forward P/BV, the stock is trading at 1x at 33%
premium to long-term average.
Exhibit 5: Stock performance
Absolute Returns (%) Relative to Sensex (%)
Company 1m 3m 6m 12m YTD 1m 3m 6m 12m FYTD
Ashoka Buildcon 0.4 (4.6) 105.1 173.6 106.4 (3.0) (15.4) 77.9 127.5 79.5
Gammon Infra 9.3 6.7 94.2 100.0 67.7 5.9 (4.1) 67.0 54.0 40.8
IL & FS Transportation (9.6) 7.7 100.2 89.4 54.6 (13.0) (3.2) 73.0 43.4 27.7
IRB Infra (0.4) 26.0 214.4 297.2 167.9 (3.8) 15.1 187.2 251.2 141.0
IVRCL Infra (10.2) (25.9) 74.2 78.4 13.5 (13.5) (36.8) 47.0 32.4 (13.5)
KNR Constructions 0.3 71.6 169.1 93.2 192.5 (3.1) 60.8 141.9 47.2 165.6
NCC (5.4) (6.9) 161.9 284.3 102.9 (8.8) (17.8) 134.7 238.3 75.9
Sadbhav 2.3 21.2 129.4 290.6 130.5 (1.1) 10.3 102.2 244.5 103.6
Source: Karvy Institutional Research
0 50
100 150 200 250 300 350
Feb
-08
Au
g-0
8
Feb
-09
Au
g-0
9
Feb
-10
Au
g-1
0
Feb
-11
Au
g-1
1
Feb
-12
Au
g-1
2
Feb
-13
Au
g-1
3
Feb
-14
Au
g-1
4
(Rs)
2x
5x
7x
10x
13x
0
50
100
150
200
250
300
350
Feb
-08
Au
g-0
8
Feb
-09
Au
g-0
9
Feb
-10
Au
g-1
0
Feb
-11
Au
g-1
1
Feb
-12
Au
g-1
2
Feb
-13
Au
g-1
3
Feb
-14
Au
g-1
4
(Rs)
0.15x
0.4x
1x
1.5x
1.7x
3
September 03, 2014
KNR Construction
Investment Rationale
Our investment thesis is based on following premises:
Strong EPC positioning – leader in the pack
Cyclical recovery – to result in 56% FY15-17E EPS CAGR
Strong balance sheet lending visibility to growth
Competitive positioning – stands out vs peers
Strong EPC positioning – leader in the pack KNRC in the past has demonstrated strong credentials in road construction
segment. Holding on to maintain margin strategy, KNRC has been slow and
steady in order book growth, which has remained flat over last three years. The
current order book of Rs12.9bn is 95% roads and 5% irrigation. With Rs400bn of
Road EPC awards expected during 2HFY15E we expect KNRC to book Rs15bn of
new order (4% market share). New order wins shall move the needle on key
financial matrix, replicating the remarkable past with expectation of a strong
future. Cyclical recovery will be the key driver of the growth re-rating.
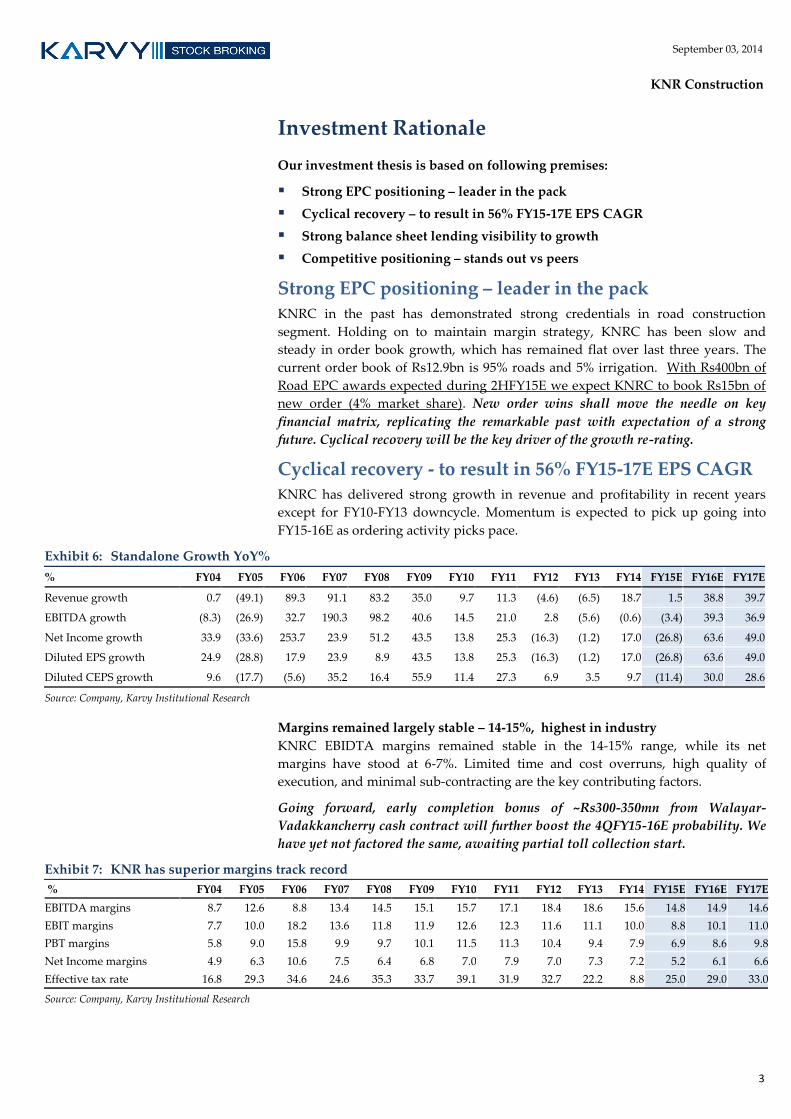
Cyclical recovery - to result in 56% FY15-17E EPS CAGR KNRC has delivered strong growth in revenue and profitability in recent years
except for FY10-FY13 downcycle. Momentum is expected to pick up going into
FY15-16E as ordering activity picks pace.
Exhibit 6: Standalone Growth YoY%
% FY04 FY05 FY06 FY07 FY08 FY09 FY10 FY11 FY12 FY13 FY14 FY15E FY16E FY17E
Revenue growth 0.7 (49.1) 89.3 91.1 83.2 35.0 9.7 11.3 (4.6) (6.5) 18.7 1.5 38.8 39.7
EBITDA growth (8.3) (26.9) 32.7 190.3 98.2 40.6 14.5 21.0 2.8 (5.6) (0.6) (3.4) 39.3 36.9
Net Income growth 33.9 (33.6) 253.7 23.9 51.2 43.5 13.8 25.3 (16.3) (1.2) 17.0 (26.8) 63.6 49.0
Diluted EPS growth 24.9 (28.8) 17.9 23.9 8.9 43.5 13.8 25.3 (16.3) (1.2) 17.0 (26.8) 63.6 49.0
Diluted CEPS growth 9.6 (17.7) (5.6) 35.2 16.4 55.9 11.4 27.3 6.9 3.5 9.7 (11.4) 30.0 28.6
Source: Company, Karvy Institutional Research
Margins remained largely stable – 14-15%, highest in industry
KNRC EBIDTA margins remained stable in the 14-15% range, while its net
margins have stood at 6-7%. Limited time and cost overruns, high quality of
execution, and minimal sub-contracting are the key contributing factors.
Going forward, early completion bonus of ~Rs300-350mn from Walayar-
Vadakkancherry cash contract will further boost the 4QFY15-16E probability. We
have yet not factored the same, awaiting partial toll collection start.
Exhibit 7: KNR has superior margins track record
% FY04 FY05 FY06 FY07 FY08 FY09 FY10 FY11 FY12 FY13 FY14 FY15E FY16E FY17E
EBITDA margins 8.7 12.6 8.8 13.4 14.5 15.1 15.7 17.1 18.4 18.6 15.6 14.8 14.9 14.6
EBIT margins 7.7 10.0 18.2 13.6 11.8 11.9 12.6 12.3 11.6 11.1 10.0 8.8 10.1 11.0
PBT margins 5.8 9.0 15.8 9.9 9.7 10.1 11.5 11.3 10.4 9.4 7.9 6.9 8.6 9.8
Net Income margins 4.9 6.3 10.6 7.5 6.4 6.8 7.0 7.9 7.0 7.3 7.2 5.2 6.1 6.6
Effective tax rate 16.8 29.3 34.6 24.6 35.3 33.7 39.1 31.9 32.7 22.2 8.8 25.0 29.0 33.0
Source: Company, Karvy Institutional Research
4
September 03, 2014
KNR Construction
Strong balance sheet – provides visibility to growth
Leverage analysis
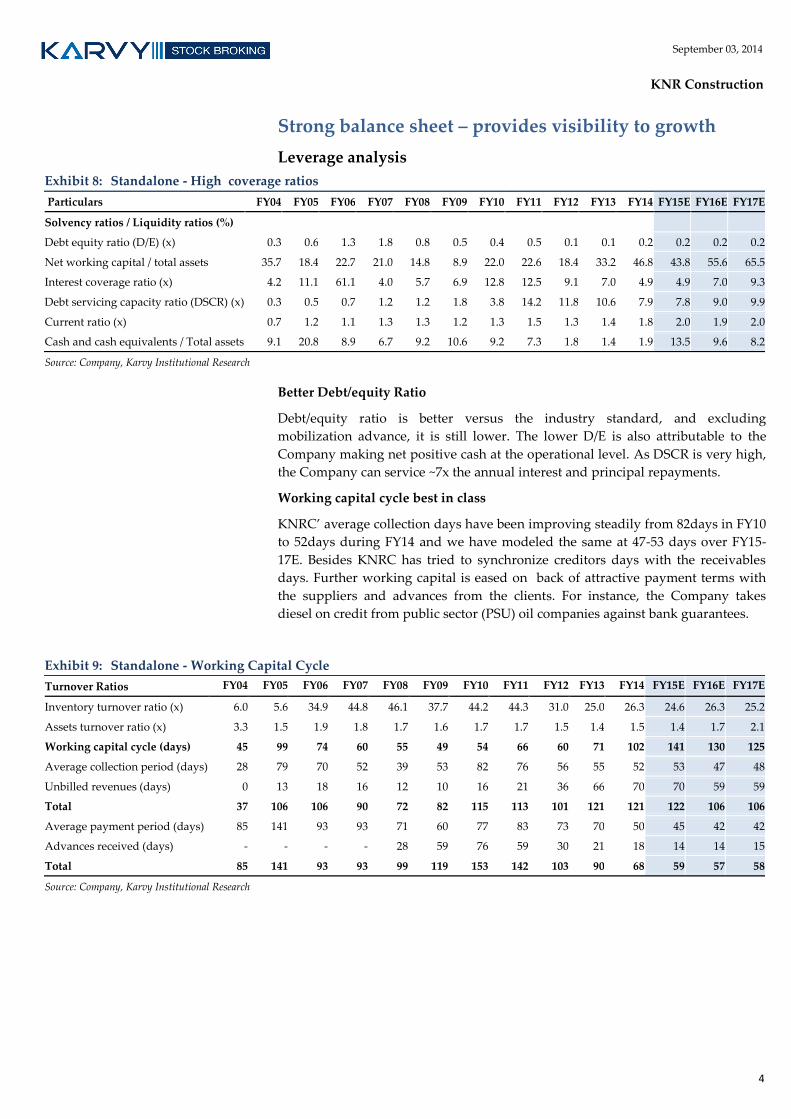
Exhibit 8: Standalone - High coverage ratios
Particulars FY04 FY05 FY06 FY07 FY08 FY09 FY10 FY11 FY12 FY13 FY14 FY15E FY16E FY17E
Solvency ratios / Liquidity ratios (%)
Debt equity ratio (D/E) (x) 0.3 0.6 1.3 1.8 0.8 0.5 0.4 0.5 0.1 0.1 0.2 0.2 0.2 0.2
Net working capital / total assets 35.7 18.4 22.7 21.0 14.8 8.9 22.0 22.6 18.4 33.2 46.8 43.8 55.6 65.5
Interest coverage ratio (x) 4.2 11.1 61.1 4.0 5.7 6.9 12.8 12.5 9.1 7.0 4.9 4.9 7.0 9.3
Debt servicing capacity ratio (DSCR) (x) 0.3 0.5 0.7 1.2 1.2 1.8 3.8 14.2 11.8 10.6 7.9 7.8 9.0 9.9
Current ratio (x) 0.7 1.2 1.1 1.3 1.3 1.2 1.3 1.5 1.3 1.4 1.8 2.0 1.9 2.0
Cash and cash equivalents / Total assets 9.1 20.8 8.9 6.7 9.2 10.6 9.2 7.3 1.8 1.4 1.9 13.5 9.6 8.2
Source: Company, Karvy Institutional Research
Better Debt/equity Ratio
Debt/equity ratio is better versus the industry standard, and excluding
mobilization advance, it is still lower. The lower D/E is also attributable to the
Company making net positive cash at the operational level. As DSCR is very high,
the Company can service ~7x the annual interest and principal repayments.
Working capital cycle best in class
KNRC’ average collection days have been improving steadily from 82days in FY10
to 52days during FY14 and we have modeled the same at 47-53 days over FY15-
17E. Besides KNRC has tried to synchronize creditors days with the receivables
days. Further working capital is eased on back of attractive payment terms with
the suppliers and advances from the clients. For instance, the Company takes
diesel on credit from public sector (PSU) oil companies against bank guarantees.
Exhibit 9: Standalone - Working Capital Cycle
Turnover Ratios FY04 FY05 FY06 FY07 FY08 FY09 FY10 FY11 FY12 FY13 FY14 FY15E FY16E FY17E
Inventory turnover ratio (x) 6.0 5.6 34.9 44.8 46.1 37.7 44.2 44.3 31.0 25.0 26.3 24.6 26.3 25.2
Assets turnover ratio (x) 3.3 1.5 1.9 1.8 1.7 1.6 1.7 1.7 1.5 1.4 1.5 1.4 1.7 2.1
Working capital cycle (days) 45 99 74 60 55 49 54 66 60 71 102 141 130 125
Average collection period (days) 28 79 70 52 39 53 82 76 56 55 52 53 47 48
Unbilled revenues (days) 0 13 18 16 12 10 16 21 36 66 70 70 59 59
Total 37 106 106 90 72 82 115 113 101 121 121 122 106 106
Average payment period (days) 85 141 93 93 71 60 77 83 73 70 50 45 42 42
Advances received (days) - - - - 28 59 76 59 30 21 18 14 14 15
Total 85 141 93 93 99 119 153 142 103 90 68 59 57 58
Source: Company, Karvy Institutional Research
5
September 03, 2014
KNR Construction
Balance sheet - return ratios
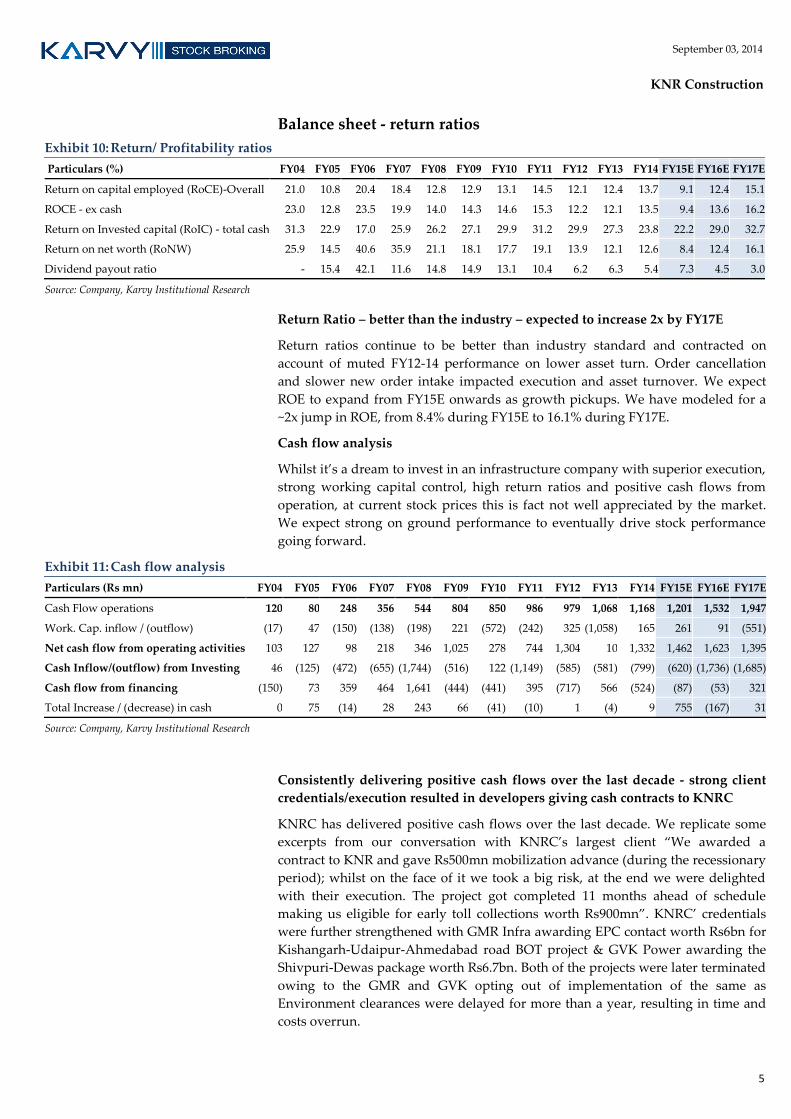
Exhibit 10: Return/ Profitability ratios
Particulars (%) FY04 FY05 FY06 FY07 FY08 FY09 FY10 FY11 FY12 FY13 FY14 FY15E FY16E FY17E
Return on capital employed (RoCE)-Overall 21.0 10.8 20.4 18.4 12.8 12.9 13.1 14.5 12.1 12.4 13.7 9.1 12.4 15.1
ROCE - ex cash 23.0 12.8 23.5 19.9 14.0 14.3 14.6 15.3 12.2 12.1 13.5 9.4 13.6 16.2
Return on Invested capital (RoIC) - total cash 31.3 22.9 17.0 25.9 26.2 27.1 29.9 31.2 29.9 27.3 23.8 22.2 29.0 32.7
Return on net worth (RoNW) 25.9 14.5 40.6 35.9 21.1 18.1 17.7 19.1 13.9 12.1 12.6 8.4 12.4 16.1
Dividend payout ratio - 15.4 42.1 11.6 14.8 14.9 13.1 10.4 6.2 6.3 5.4 7.3 4.5 3.0
Source: Company, Karvy Institutional Research
Return Ratio – better than the industry – expected to increase 2x by FY17E
Return ratios continue to be better than industry standard and contracted on
account of muted FY12-14 performance on lower asset turn. Order cancellation
and slower new order intake impacted execution and asset turnover. We expect
ROE to expand from FY15E onwards as growth pickups. We have modeled for a
~2x jump in ROE, from 8.4% during FY15E to 16.1% during FY17E.
Cash flow analysis
Whilst it’s a dream to invest in an infrastructure company with superior execution,
strong working capital control, high return ratios and positive cash flows from
operation, at current stock prices this is fact not well appreciated by the market.
We expect strong on ground performance to eventually drive stock performance
going forward.
Exhibit 11: Cash flow analysis
Particulars (Rs mn) FY04 FY05 FY06 FY07 FY08 FY09 FY10 FY11 FY12 FY13 FY14 FY15E FY16E FY17E
Cash Flow operations 120 80 248 356 544 804 850 986 979 1,068 1,168 1,201 1,532 1,947
Work. Cap. inflow / (outflow) (17) 47 (150) (138) (198) 221 (572) (242) 325 (1,058) 165 261 91 (551)
Net cash flow from operating activities 103 127 98 218 346 1,025 278 744 1,304 10 1,332 1,462 1,623 1,395
Cash Inflow/(outflow) from Investing 46 (125) (472) (655) (1,744) (516) 122 (1,149) (585) (581) (799) (620) (1,736) (1,685)
Cash flow from financing (150) 73 359 464 1,641 (444) (441) 395 (717) 566 (524) (87) (53) 321
Total Increase / (decrease) in cash 0 75 (14) 28 243 66 (41) (10) 1 (4) 9 755 (167) 31
Source: Company, Karvy Institutional Research
Consistently delivering positive cash flows over the last decade - strong client
credentials/execution resulted in developers giving cash contracts to KNRC
KNRC has delivered positive cash flows over the last decade. We replicate some
excerpts from our conversation with KNRC’s largest client “We awarded a
contract to KNR and gave Rs500mn mobilization advance (during the recessionary
period); whilst on the face of it we took a big risk, at the end we were delighted
with their execution. The project got completed 11 months ahead of schedule
making us eligible for early toll collections worth Rs900mn”. KNRC’ credentials
were further strengthened with GMR Infra awarding EPC contact worth Rs6bn for
Kishangarh-Udaipur-Ahmedabad road BOT project & GVK Power awarding the
Shivpuri-Dewas package worth Rs6.7bn. Both of the projects were later terminated
owing to the GMR and GVK opting out of implementation of the same as
Environment clearances were delayed for more than a year, resulting in time and
costs overrun.
6
September 03, 2014
KNR Construction
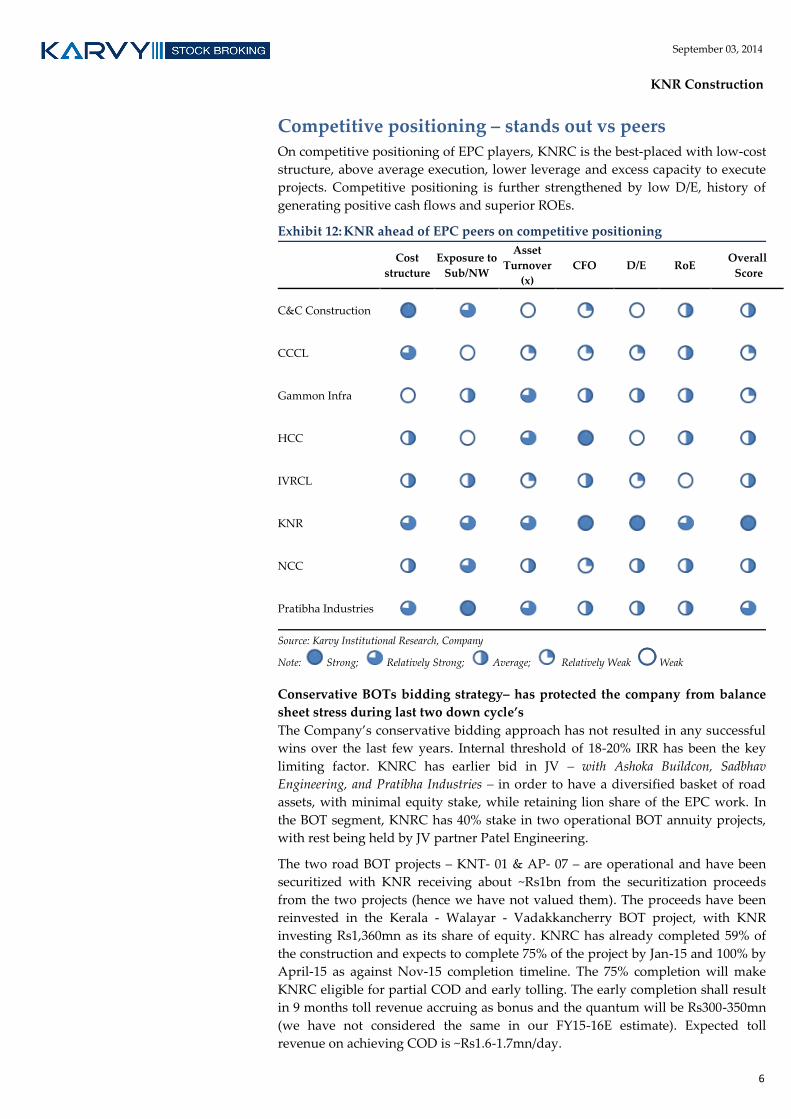
Competitive positioning – stands out vs peers
On competitive positioning of EPC players, KNRC is the best-placed with low-cost
structure, above average execution, lower leverage and excess capacity to execute
projects. Competitive positioning is further strengthened by low D/E, history of
generating positive cash flows and superior ROEs.
Exhibit 12: KNR ahead of EPC peers on competitive positioning
Cost
structure
Exposure to
Sub/NW
Asset
Turnover
(x)
CFO D/E RoE Overall
Score
C&C Construction
CCCL
Gammon Infra
HCC
IVRCL
KNR
NCC
Pratibha Industries
Source: Karvy Institutional Research, Company
Note: Strong; Relatively Strong; Average; Relatively Weak Weak
Conservative BOTs bidding strategy– has protected the company from balance
sheet stress during last two down cycle’s
The Company’s conservative bidding approach has not resulted in any successful
wins over the last few years. Internal threshold of 18-20% IRR has been the key
limiting factor. KNRC has earlier bid in JV – with Ashoka Buildcon, Sadbhav
Engineering, and Pratibha Industries – in order to have a diversified basket of road
assets, with minimal equity stake, while retaining lion share of the EPC work. In
the BOT segment, KNRC has 40% stake in two operational BOT annuity projects,
with rest being held by JV partner Patel Engineering.
The two road BOT projects – KNT- 01 & AP- 07 – are operational and have been
securitized with KNR receiving about ~Rs1bn from the securitization proceeds
from the two projects (hence we have not valued them). The proceeds have been
reinvested in the Kerala - Walayar - Vadakkancherry BOT project, with KNR
investing Rs1,360mn as its share of equity. KNRC has already completed 59% of
the construction and expects to complete 75% of the project by Jan-15 and 100% by
April-15 as against Nov-15 completion timeline. The 75% completion will make
KNRC eligible for partial COD and early tolling. The early completion shall result
in 9 months toll revenue accruing as bonus and the quantum will be Rs300-350mn
(we have not considered the same in our FY15-16E estimate). Expected toll
revenue on achieving COD is ~Rs1.6-1.7mn/day.
7
September 03, 2014
KNR Construction
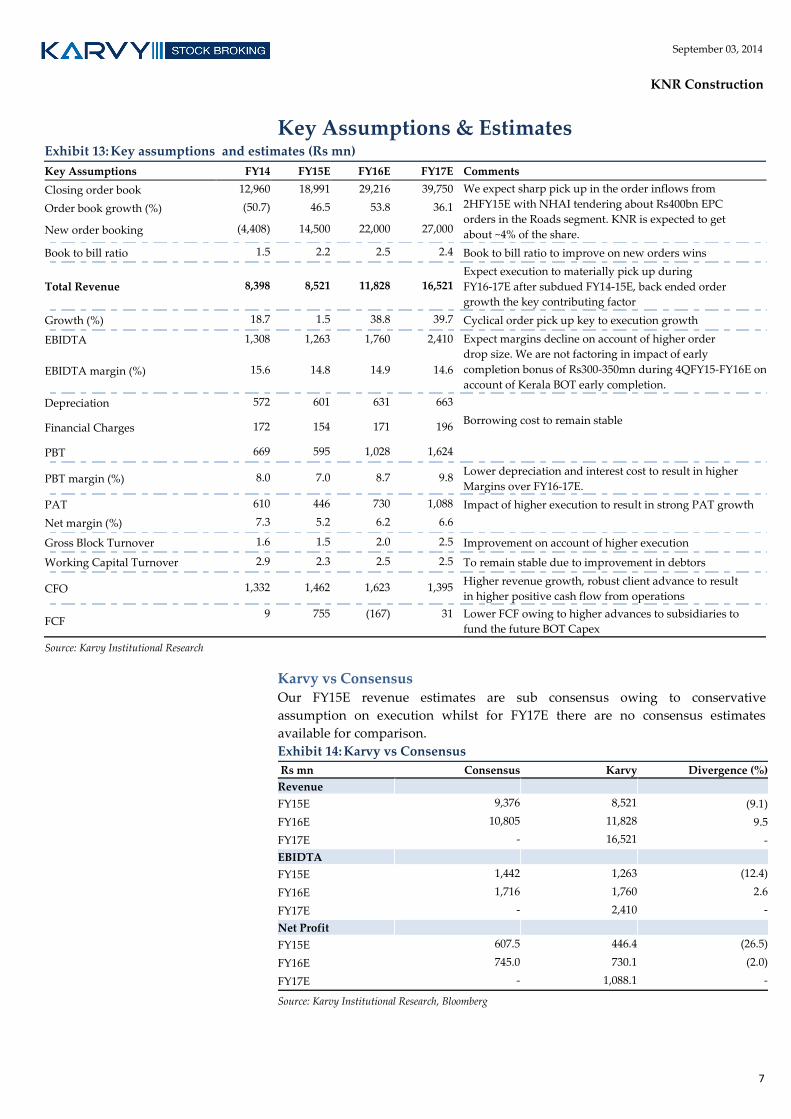
Key Assumptions & Estimates Exhibit 13: Key assumptions and estimates (Rs mn)
Key Assumptions FY14 FY15E FY16E FY17E Comments
Closing order book 12,960 18,991 29,216 39,750 We expect sharp pick up in the order inflows from
2HFY15E with NHAI tendering about Rs400bn EPC
orders in the Roads segment. KNR is expected to get
about ~4% of the share.
Order book growth (%) (50.7) 46.5 53.8 36.1
New order booking (4,408) 14,500 22,000 27,000
Book to bill ratio 1.5 2.2 2.5 2.4 Book to bill ratio to improve on new orders wins
Total Revenue 8,398 8,521 11,828 16,521 Expect execution to materially pick up during
FY16-17E after subdued FY14-15E, back ended order
growth the key contributing factor
Growth (%) 18.7 1.5 38.8 39.7 Cyclical order pick up key to execution growth
EBIDTA 1,308 1,263 1,760 2,410 Expect margins decline on account of higher order
drop size. We are not factoring in impact of early
completion bonus of Rs300-350mn during 4QFY15-FY16E on
account of Kerala BOT early completion. EBIDTA margin (%) 15.6 14.8 14.9 14.6
Depreciation 572 601 631 663
Financial Charges 172 154 171 196 Borrowing cost to remain stable
PBT 669 595 1,028 1,624
PBT margin (%) 8.0 7.0 8.7 9.8 Lower depreciation and interest cost to result in higher
Margins over FY16-17E.
PAT 610 446 730 1,088 Impact of higher execution to result in strong PAT growth
Net margin (%) 7.3 5.2 6.2 6.6
Gross Block Turnover 1.6 1.5 2.0 2.5 Improvement on account of higher execution
Working Capital Turnover 2.9 2.3 2.5 2.5 To remain stable due to improvement in debtors
CFO 1,332 1,462 1,623 1,395 Higher revenue growth, robust client advance to result
in higher positive cash flow from operations
FCF 9 755 (167) 31 Lower FCF owing to higher advances to subsidiaries to
fund the future BOT Capex
Source: Karvy Institutional Research
Karvy vs Consensus Our FY15E revenue estimates are sub consensus owing to conservative
assumption on execution whilst for FY17E there are no consensus estimates
available for comparison.
Exhibit 14: Karvy vs Consensus
Rs mn Consensus Karvy Divergence (%)
Revenue
FY15E 9,376 8,521 (9.1)
FY16E 10,805 11,828 9.5
FY17E - 16,521 -
EBIDTA
FY15E 1,442 1,263 (12.4)
FY16E 1,716 1,760 2.6
FY17E - 2,410 -
Net Profit
FY15E 607.5 446.4 (26.5)
FY16E 745.0 730.1 (2.0)
FY17E - 1,088.1 -
Source: Karvy Institutional Research, Bloomberg
8
September 03, 2014
KNR Construction
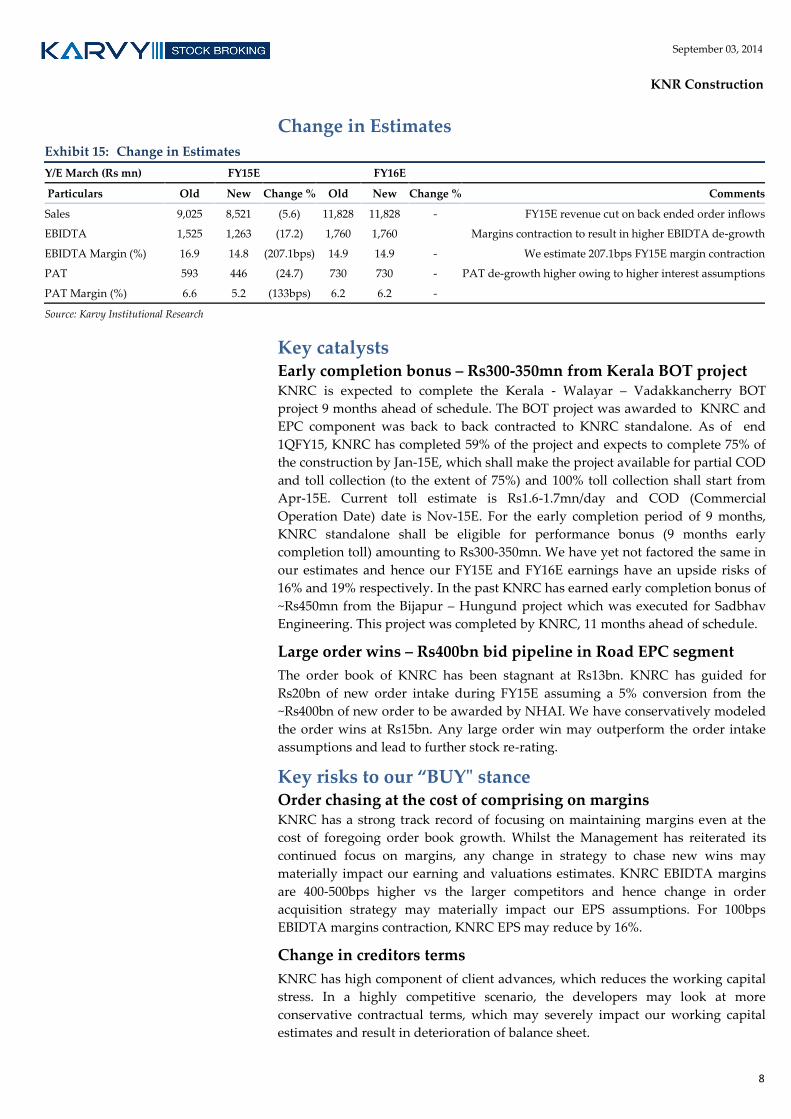
Change in Estimates
Exhibit 15: Change in Estimates
Y/E March (Rs mn)
FY15E FY16E
Particulars Old New Change % Old New Change % Comments
Sales 9,025 8,521 (5.6) 11,828 11,828 - FY15E revenue cut on back ended order inflows
EBIDTA 1,525 1,263 (17.2) 1,760 1,760
Margins contraction to result in higher EBIDTA de-growth
EBIDTA Margin (%) 16.9 14.8 (207.1bps) 14.9 14.9 - We estimate 207.1bps FY15E margin contraction
PAT 593 446 (24.7) 730 730 - PAT de-growth higher owing to higher interest assumptions
PAT Margin (%) 6.6 5.2 (133bps) 6.2 6.2 -
Source: Karvy Institutional Research
Key catalysts Early completion bonus – Rs300-350mn from Kerala BOT project KNRC is expected to complete the Kerala - Walayar – Vadakkancherry BOT
project 9 months ahead of schedule. The BOT project was awarded to KNRC and
EPC component was back to back contracted to KNRC standalone. As of end
1QFY15, KNRC has completed 59% of the project and expects to complete 75% of
the construction by Jan-15E, which shall make the project available for partial COD
and toll collection (to the extent of 75%) and 100% toll collection shall start from
Apr-15E. Current toll estimate is Rs1.6-1.7mn/day and COD (Commercial
Operation Date) date is Nov-15E. For the early completion period of 9 months,
KNRC standalone shall be eligible for performance bonus (9 months early
completion toll) amounting to Rs300-350mn. We have yet not factored the same in
our estimates and hence our FY15E and FY16E earnings have an upside risks of
16% and 19% respectively. In the past KNRC has earned early completion bonus of
~Rs450mn from the Bijapur – Hungund project which was executed for Sadbhav
Engineering. This project was completed by KNRC, 11 months ahead of schedule.
Large order wins – Rs400bn bid pipeline in Road EPC segment
The order book of KNRC has been stagnant at Rs13bn. KNRC has guided for
Rs20bn of new order intake during FY15E assuming a 5% conversion from the
~Rs400bn of new order to be awarded by NHAI. We have conservatively modeled
the order wins at Rs15bn. Any large order win may outperform the order intake
assumptions and lead to further stock re-rating.
Key risks to our “BUY" stance Order chasing at the cost of comprising on margins KNRC has a strong track record of focusing on maintaining margins even at the
cost of foregoing order book growth. Whilst the Management has reiterated its
continued focus on margins, any change in strategy to chase new wins may
materially impact our earning and valuations estimates. KNRC EBIDTA margins
are 400-500bps higher vs the larger competitors and hence change in order
acquisition strategy may materially impact our EPS assumptions. For 100bps
EBIDTA margins contraction, KNRC EPS may reduce by 16%.
Change in creditors terms
KNRC has high component of client advances, which reduces the working capital
stress. In a highly competitive scenario, the developers may look at more
conservative contractual terms, which may severely impact our working capital
estimates and result in deterioration of balance sheet.
9
September 03, 2014
KNR Construction
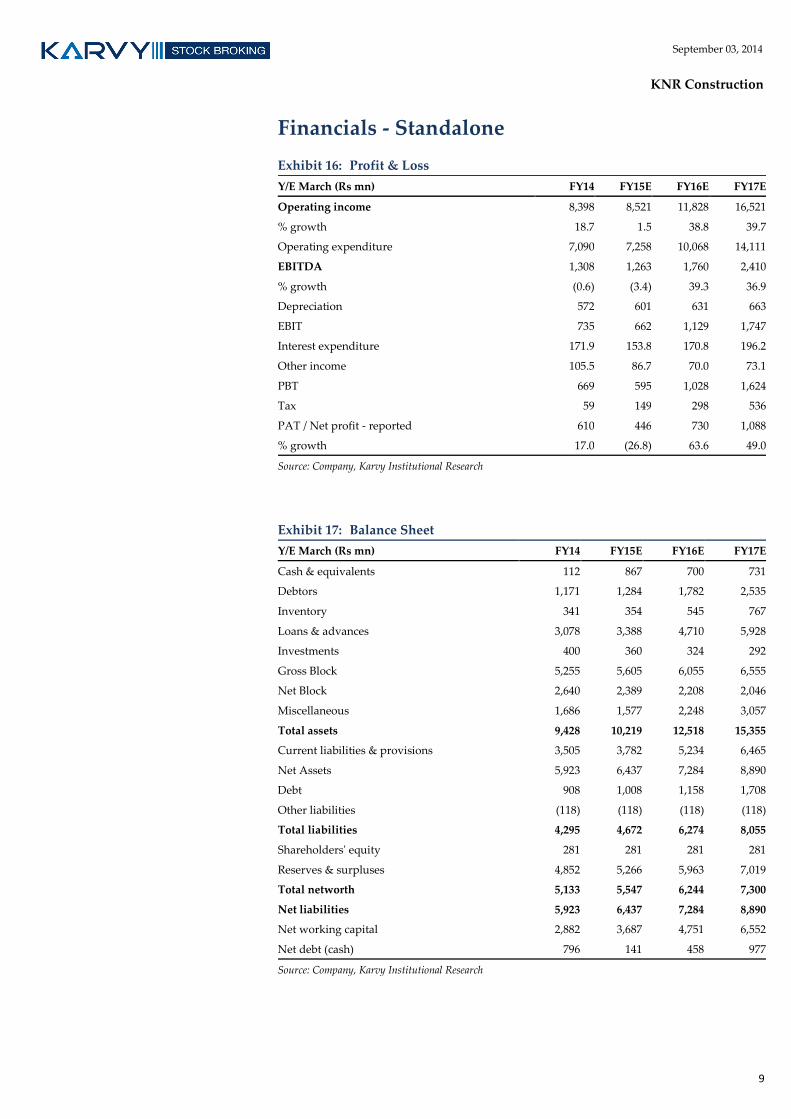
Financials - Standalone
Exhibit 16: Profit & Loss
Y/E March (Rs mn) FY14 FY15E FY16E FY17E
Operating income 8,398 8,521 11,828 16,521
% growth 18.7 1.5 38.8 39.7
Operating expenditure 7,090 7,258 10,068 14,111
EBITDA 1,308 1,263 1,760 2,410
% growth (0.6) (3.4) 39.3 36.9
Depreciation 572 601 631 663
EBIT 735 662 1,129 1,747
Interest expenditure 171.9 153.8 170.8 196.2
Other income 105.5 86.7 70.0 73.1
PBT 669 595 1,028 1,624
Tax 59 149 298 536
PAT / Net profit - reported 610 446 730 1,088
% growth 17.0 (26.8) 63.6 49.0
Source: Company, Karvy Institutional Research
Exhibit 17: Balance Sheet
Y/E March (Rs mn) FY14 FY15E FY16E FY17E
Cash & equivalents 112 867 700 731
Debtors 1,171 1,284 1,782 2,535
Inventory 341 354 545 767
Loans & advances 3,078 3,388 4,710 5,928
Investments 400 360 324 292
Gross Block 5,255 5,605 6,055 6,555
Net Block 2,640 2,389 2,208 2,046
Miscellaneous 1,686 1,577 2,248 3,057
Total assets 9,428 10,219 12,518 15,355
Current liabilities & provisions 3,505 3,782 5,234 6,465
Net Assets 5,923 6,437 7,284 8,890
Debt 908 1,008 1,158 1,708
Other liabilities (118) (118) (118) (118)
Total liabilities 4,295 4,672 6,274 8,055
Shareholders' equity 281 281 281 281
Reserves & surpluses 4,852 5,266 5,963 7,019
Total networth 5,133 5,547 6,244 7,300
Net liabilities 5,923 6,437 7,284 8,890
Net working capital 2,882 3,687 4,751 6,552
Net debt (cash) 796 141 458 977
Source: Company, Karvy Institutional Research
10
September 03, 2014
KNR Construction
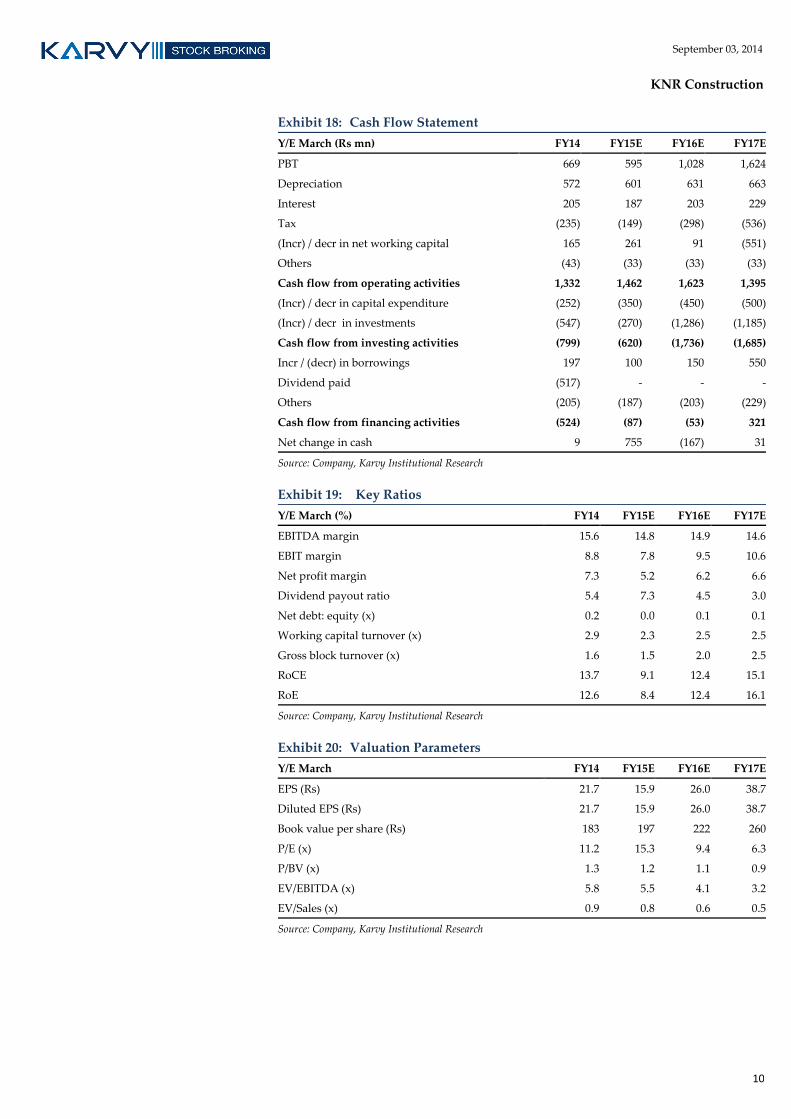
Exhibit 18: Cash Flow Statement
Y/E March (Rs mn) FY14 FY15E FY16E FY17E
PBT 669 595 1,028 1,624
Depreciation 572 601 631 663
Interest 205 187 203 229
Tax (235) (149) (298) (536)
(Incr) / decr in net working capital 165 261 91 (551)
Others (43) (33) (33) (33)
Cash flow from operating activities 1,332 1,462 1,623 1,395
(Incr) / decr in capital expenditure (252) (350) (450) (500)
(Incr) / decr in investments (547) (270) (1,286) (1,185)
Cash flow from investing activities (799) (620) (1,736) (1,685)
Incr / (decr) in borrowings 197 100 150 550
Dividend paid (517) - - -
Others (205) (187) (203) (229)
Cash flow from financing activities (524) (87) (53) 321
Net change in cash 9 755 (167) 31
Source: Company, Karvy Institutional Research
Exhibit 19: Key Ratios
Y/E March (%) FY14 FY15E FY16E FY17E
EBITDA margin 15.6 14.8 14.9 14.6
EBIT margin 8.8 7.8 9.5 10.6
Net profit margin 7.3 5.2 6.2 6.6
Dividend payout ratio 5.4 7.3 4.5 3.0
Net debt: equity (x) 0.2 0.0 0.1 0.1
Working capital turnover (x) 2.9 2.3 2.5 2.5
Gross block turnover (x) 1.6 1.5 2.0 2.5
RoCE 13.7 9.1 12.4 15.1
RoE 12.6 8.4 12.4 16.1
Source: Company, Karvy Institutional Research
Exhibit 20: Valuation Parameters
Y/E March FY14 FY15E FY16E FY17E
EPS (Rs) 21.7 15.9 26.0 38.7
Diluted EPS (Rs) 21.7 15.9 26.0 38.7
Book value per share (Rs) 183 197 222 260
P/E (x) 11.2 15.3 9.4 6.3
P/BV (x) 1.3 1.2 1.1 0.9
EV/EBITDA (x) 5.8 5.5 4.1 3.2
EV/Sales (x) 0.9 0.8 0.6 0.5
Source: Company, Karvy Institutional Research
11
September 03, 2014
KNR Construction
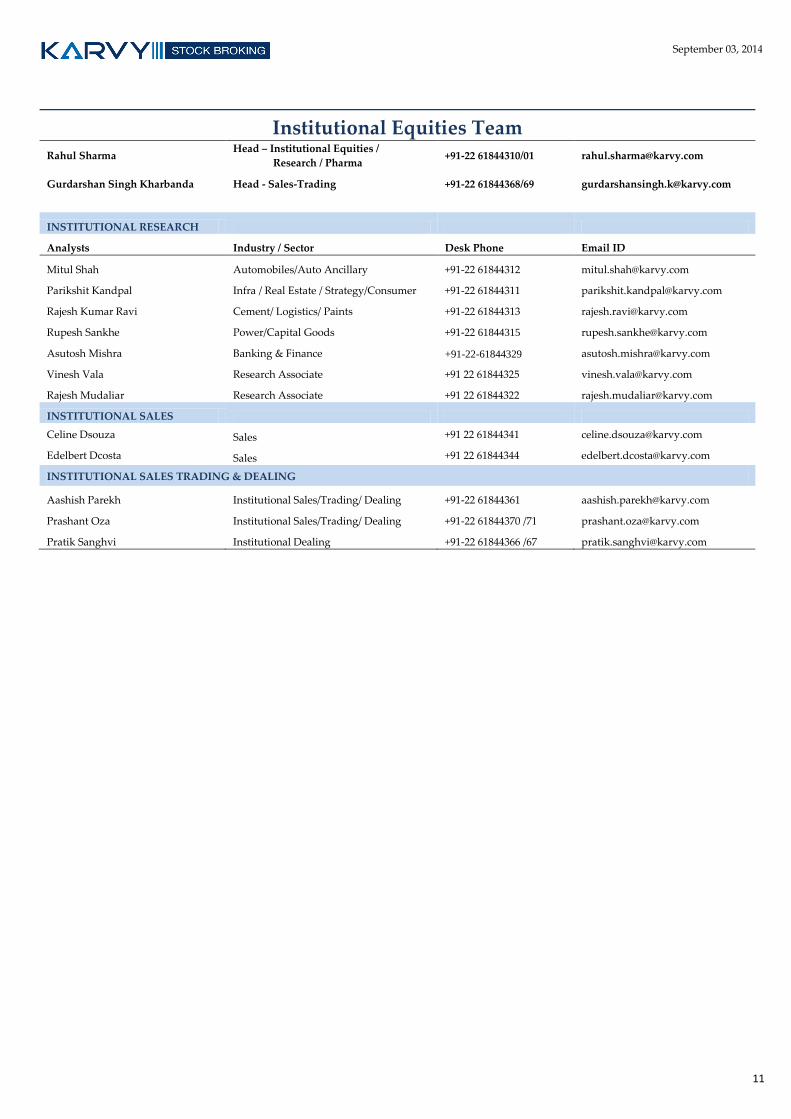
Institutional Equities Team Rahul Sharma
Head – Institutional Equities /
Research / Pharma +91-22 61844310/01 [email protected]
Gurdarshan Singh Kharbanda Head - Sales-Trading +91-22 61844368/69 [email protected]
INSTITUTIONAL RESEARCH
Analysts Industry / Sector Desk Phone Email ID
Mitul Shah Automobiles/Auto Ancillary +91-22 61844312 [email protected]
Parikshit Kandpal Infra / Real Estate / Strategy/Consumer +91-22 61844311 [email protected]
Rajesh Kumar Ravi Cement/ Logistics/ Paints +91-22 61844313 [email protected]
Rupesh Sankhe Power/Capital Goods +91-22 61844315 [email protected]
Asutosh Mishra Banking & Finance +91-22-61844329 [email protected]
Vinesh Vala Research Associate +91 22 61844325 [email protected]
Rajesh Mudaliar Research Associate +91 22 61844322 [email protected]
INSTITUTIONAL SALES
Celine Dsouza Sales +91 22 61844341 [email protected]
Edelbert Dcosta Sales +91 22 61844344 [email protected]
INSTITUTIONAL SALES TRADING & DEALING
Aashish Parekh Institutional Sales/Trading/ Dealing +91-22 61844361 [email protected]
Prashant Oza Institutional Sales/Trading/ Dealing +91-22 61844370 /71 [email protected]
Pratik Sanghvi Institutional Dealing +91-22 61844366 /67 [email protected]
12
September 03, 2014
KNR Construction
For further enquiries please contact:
Tel: +91-22-6184 4300
Disclosures Appendix
Analyst certification
The following analyst(s), who is (are) primarily responsible for this report, certify (ies) that the views expressed herein accurately reflect
his (their) personal view(s) about the subject security (ies) and issuer(s) and that no part of his (their) compensation was, is or will be
directly or indirectly related to the specific recommendation(s) or views contained in this research report.
Disclaimer
The information and views presented in this report are prepared by Karvy Stock Broking Limited. The information contained herein is
based on our analysis and upon sources that we consider reliable. We, however, do not vouch for the accuracy or the completeness
thereof. This material is for personal information and we are not responsible for any loss incurred based upon it. The investments
discussed or recommended in this report may not be suitable for all investors. Investors must make their own investment decisions
based on their specific investment objectives and financial position and using such independent advice, as they believe necessary.
While acting upon any information or analysis mentioned in this report, investors may please note that neither Karvy nor Karvy Stock
Broking nor any person connected with any associate companies of Karvy accepts any liability arising from the use of this information
and views mentioned in this document.
The author, directors and other employees of Karvy and its affiliates may hold long or short positions in the above mentioned
companies from time to time. Every employee of Karvy and its associate companies are required to disclose their individual stock
holdings and details of trades, if any, that they undertake. The team rendering corporate analysis and investment recommendations are
restricted in purchasing/selling of shares or other securities till such a time this recommendation has either been displayed or has been
forwarded to clients of Karvy. All employees are further restricted to place orders only through Karvy Stock Broking Ltd. This report is
intended for a restricted audience and we are not soliciting any action based on it. Neither the information nor any opinion expressed
herein constitutes an offer or an invitation to make an offer, to buy or sell any securities, or any options, futures nor other derivatives
related to such securities.
Karvy Stock Broking Limited Institutional Equities
Office No. 701, 7th Floor, Hallmark Business Plaza, Opp.-Gurunanak Hospital, Mumbai 400 051 Regd Off : 46, Road No 4, Street No 1, Banjara Hills, Hyderabad – 500 034.
Karvy Stock Broking Research is also available on: Bloomberg - KRVY <GO>, Thomson Publisher & Reuters.
Stock Ratings Absolute Returns Buy : > 15% Hold : 5 - 15% Sell : < 5%