Embed Size (px)
Citation preview
Knowledge Return On Investment © 2002 Timothy W. Powell. All rights reserved.
www.knowledgeagency.com
Knowledge Return on Investment By Timothy W. Powell Managing Director, TW Powell Co. The Knowledge Agency® Chapter 9 from the book KNOWLEDGE MANAGEMENT: LESSONS LEARNED: What Works and Doesn’t, Koenig and Srikantaiah, eds. (Information Today), 2004. Includes corrections to the published version.
Introduction to ROI
ROI (pronounced “are-oh-eye,” and typically written without periods) is an acronym for return
on investment. Herein we define ROI as a metric of the net payouts from a financial outlay over time.
While discussing other ROI measures, we focus on discounted cash flow (DCF), also known as
internal rate of return (IRR) and net present value (NPV). This technique is taught in most MBA
programs, and is a standard way of projecting and measuring the results of capital projects in
the modern enterprise.
The goals of this chapter are to explain these terms and, in so doing, give you some ways to
think about the value of knowledge.
The word investment herein typically includes both capitalized and expense items.1 All kinds of
organizational projects—including Information Technology and Knowledge Management
projects—are typically subjected to ROI analysis.
The ROI measurement usually has three uses: selecting among projects being considered;
comparing alternative potential solutions; and evaluating projects already undertaken.
1. Selecting among projects. Any enterprise (whether business, government, or not-for-
profit) has capital constraints, and therefore, project proposals must “compete” with
each other for their share of expenditure. ROI analysis is used to allocate capital
Knowledge Return On Investment © 2002 Timothy W. Powell. All rights reserved.
www.knowledgeagency.com Page 2 of 20
resources among competing projects by providing a common framework for their
evaluation.
In this usage, ROI is essentially a pro forma estimate of what is deemed most likely to
occur in the future. Because it is a forecast, it is subject to a good deal of uncertainty.
Consequently, the supporting estimates often must be arrived at by negotiation and
consensus, rather than by scientific proof.
2. Comparing potential solutions. Once a particular kind of project is decided on (e.g.,
“Let’s install an expertise profiling system”), then it remains to select among solutions
offered by competing vendors. In those rare cases where vendors offer exactly the same
feature sets (“apples-to-apples”), the benefits can be presumed to be the same and costs
become the key feature of differentiation. In most complex projects, however, the
solution sets offered by various vendors differ somewhat, or even substantially. ROI
analysis offers a way to compensate for these differences.
Just as when selecting among projects, comparing solutions suffers from the future
estimation problems mentioned above. Moreover, these ROI estimates often are
supplied by the respective vendors themselves and therefore may contain biases of
various kinds.
3. Evaluating projects after the fact. After a project has been running, it is typical to
compare the actual results with the estimates prepared, as above. This can be useful in
determining whether to continue to fund the investment and in evaluating similar
future investment opportunities. Here, the challenge is to measure what already has
happened, rather than estimating what probably will happen.
Alas, however, the effort often is no less problematic. The key measurement problem is
attribution—that is, how can we tell whether a certain positive benefit resulted from our
project, or was the result of some other factors (e.g., general business conditions)? In fact,
in any complex system—of which the modern enterprise is a textbook example—one can
Knowledge Return On Investment © 2002 Timothy W. Powell. All rights reserved.
www.knowledgeagency.com Page 3 of 20
only rarely truthfully isolate the effects of various “causative” forces. As a result, in
practice, post facto measurements of the results of a project, as do forecasts, become
subject to negotiation and consensus building.
Though few ROI analyses are precisely scientific, the process of developing such an analysis has
inherent benefits. The discipline of thinking through the specific costs and benefits expected to
result from a project typically results in both greater cost control and greater expansion of
potential applications than would otherwise have been the case.
The Value of Knowledge Management
The value of better KM is intuitively obvious to some (especially those on the knowledge
supply side) but often less obvious to others (including those who control the purse strings of
the organization). Several studies on the perceived benefits of better KM point to areas of
benefits that could be exploited in a KM initiative. A study conducted by Ernst and Young
(Information Week, 1997) among 431 U.S. and European companies found the following reported
benefits from having organized KM programs:
Increased innovativeness
Enhanced efficiency
Better decision-making
Faster responsiveness
Enhanced flexibility
Improved quality
Reduced duplication of effort
Greater employee empowerment
A similar study conducted by KPMG (PC Week, 1999) among 43 companies found similar
results—and included the numbers of companies reporting such benefits as

Knowledge Return On Investment © 2002 Timothy W. Powell. All rights reserved.
www.knowledgeagency.com Page 4 of 20
Better decision making, 86 percent
Reduced costs, 70 percent
Improved productivity, 68 percent
Faster response time to key issues, 68 percent
Shared best practices, 60 percent
Created new/additional business activity, 58 percent
Increased profit, 53 percent
Better staff attraction/retention, 42 percent
Increased market share, 42 percent
Increased share price, 23 percent
What is interesting is the trend in the 1999 study toward drawing direct correlations between
KM initiatives and enterprise value in the form of reduced costs; new business activity; and
increases in profit, market share, and share price. The movement toward more rigorous
financial justification for KM projects was already under way.2
KM ROI
In a large organization, ROI analysis typically is used to determine whether a complex project
lives or dies. At this writing (Summer 2002), most KM projects are competing for IT budgets
that are growing much more slowly than previously, or even shrinking. Projects related to data
security now appear to claim the top spot on organizational IT wish lists, and more strategic
projects such as KM seem to be undertaken more reluctantly than previously.
Knowledge management projects are especially vulnerable to “death by ROI” because KM is an
overhead function; it is viewed as expendable; and its benefits are often subtle.

Knowledge Return On Investment © 2002 Timothy W. Powell. All rights reserved.
www.knowledgeagency.com Page 5 of 20
1. Knowledge management is overhead. Alone, KM rarely generates revenues nor is that
typically its primary mission. It is an overhead, or staff, function the benefits of which
are necessarily indirect. Therefore its benefits, even its financial ones, are subject to
estimation and biases as describe above.
2. Knowledge management is expendable. Knowledge management is a leading-edge
practice and is not assumed to be necessary by all enterprises. This is not only because it
is an overhead function. A typical enterprise does not subject other overhead functions
(e.g., Human Resources) to continual ROI analyses, because HR is assumed to be a
necessary and valuable function. In contrast, KM is relatively unproved and is not
assumed to “work” in all enterprises. (In fact, it has not “worked” in many instances,
though the reasons for this are beyond the scope of this chapter.)
3. Knowledge management benefits are both far-reaching and hard to measure. The
benefits of KM are much more uncertain and subject to volatility than are other
enterprise initiatives. We will discuss this further in looking at the details of a KM ROI
model.
A confounding issue is that KM as a discipline is evolving so rapidly that even its name has
become relatively meaningless at this writing. It is more accurate to think of KM as a portfolio of
specific projects and larger initiatives.
Seen from this perspective, KM projects typically fall into one of the following categories:
Document management. Systems that index, catalog, locate, and make available
documents across the enterprise
Expertise profiling. Systems that index, catalog, and locate human expertise across the
enterprise
Knowledge Return On Investment © 2002 Timothy W. Powell. All rights reserved.
www.knowledgeagency.com Page 6 of 20
Best-practices repositories. Databases that contain optimized procedures and solutions
to common problems
Data warehousing and data mining (“business intelligence”). Software that analyzes
large transactions databases for patterns and trends
Intellectual property management. Cataloging and subsequent licensing of trademarks,
copyrights, patents, and trade secrets
Collaboration. Software that facilitates project-oriented work groups, typically across
organizational and geographic boundaries
Each project type is quite different in several respects, including the costs and benefits profiles.
The generalized model described subsequently will fit all of these types of projects. In the
specific example that follows, we choose one of these categories to illustrate the application of
this generalized model.
Generalized ROI Model
The general ROI model3 can be diagrammed as shown in Figure 1. Neither project costs nor
benefits are likely to be one-shot events; they are likely to be recurring. That is, there are costs
associated with the initial investment (Cost0) and both costs and benefits associated with each
time period for which the investment is to be evaluated. Capital investments are typically
evaluated by year, though more or less frequent units of measurement are also possible.
Calculations are usually made on constant currency terms, such that no adjustments for
inflation need be made.
Knowledge Return On Investment © 2002 Timothy W. Powell. All rights reserved.
www.knowledgeagency.com Page 7 of 20
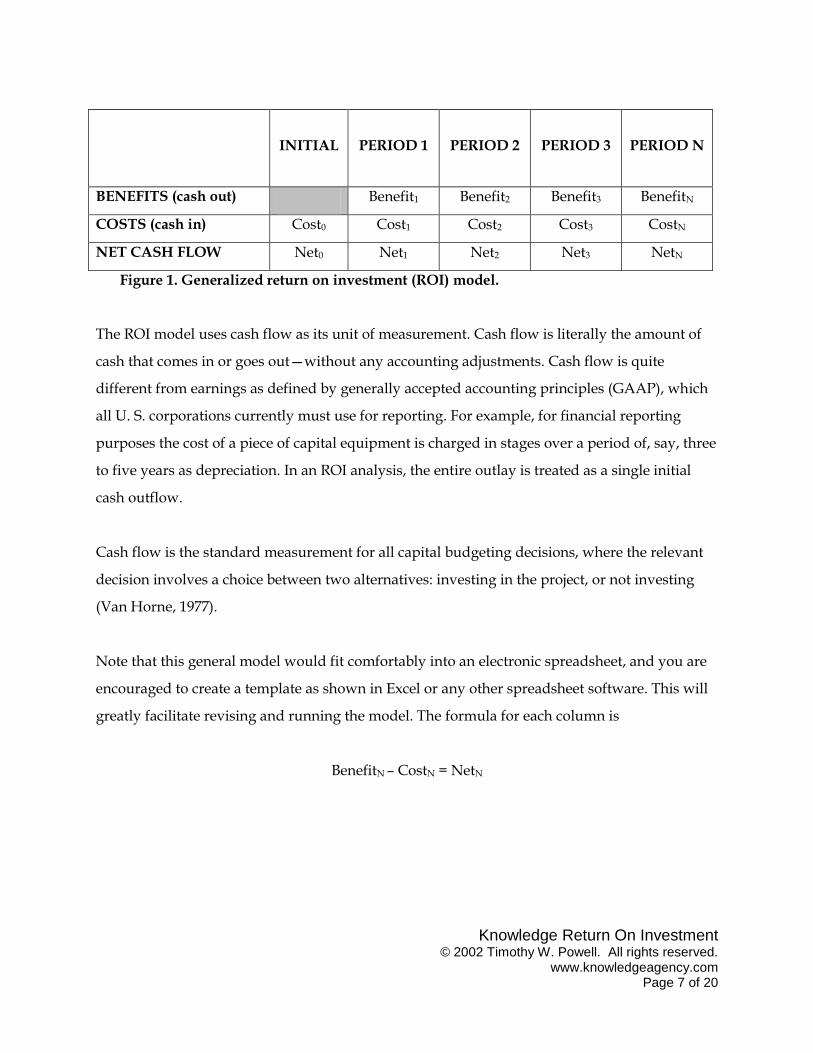
Figure 1. Generalized return on investment (ROI) model.
The ROI model uses cash flow as its unit of measurement. Cash flow is literally the amount of
cash that comes in or goes out—without any accounting adjustments. Cash flow is quite
different from earnings as defined by generally accepted accounting principles (GAAP), which
all U. S. corporations currently must use for reporting. For example, for financial reporting
purposes the cost of a piece of capital equipment is charged in stages over a period of, say, three
to five years as depreciation. In an ROI analysis, the entire outlay is treated as a single initial
cash outflow.
Cash flow is the standard measurement for all capital budgeting decisions, where the relevant
decision involves a choice between two alternatives: investing in the project, or not investing
(Van Horne, 1977).
Note that this general model would fit comfortably into an electronic spreadsheet, and you are
encouraged to create a template as shown in Excel or any other spreadsheet software. This will
greatly facilitate revising and running the model. The formula for each column is
BenefitN – CostN = NetN
INITIAL
PERIOD 1
PERIOD 2
PERIOD 3
PERIOD N
BENEFITS (cash out) Benefit1 Benefit2 Benefit3 BenefitN
COSTS (cash in) Cost0 Cost1 Cost2 Cost3 CostN
NET CASH FLOW Net0 Net1 Net2 Net3 NetN
Knowledge Return On Investment © 2002 Timothy W. Powell. All rights reserved.
www.knowledgeagency.com Page 8 of 20
Costs
Costs for a KM-related project typically include hardware, software, labor, and other related
outlays. Some costs are obvious (such as software licenses), because they appear on invoices
from vendors. Others are hidden costs, for example, the time of people to learn, use, and
maintain an application.
Hardware includes servers, storage, routers and wiring, and telecommunications
equipment. Costs include purchase or lease costs and maintenance costs.
Software includes the software for KM applications operating systems, network
management, and so on. Software is typically licensed, rather than purchased. There
may be an initial fee and a periodic license fee. License fees for many applications are
charged on a “per seat” basis, that is, how many people are using the application at any
given time. License fees often cover technical support and applications maintenance and
upgrades; however, to the extent they do not, these costs must be factored in separately.
Labor includes, for example, user time for training in the KM application, the costs of
internal support staff, and the costs of data input to the system. The cost of staff salaries
is a “sunk cost”; nevertheless, it should be included in a rigorous project analysis.
Other can include related contracted costs, such as consulting support and internal
marketing support for the application.
Costs are typically easier to estimate than are benefits because, by definition, costs usually are
financial and often are contractually specified (where an outside vendor is involved).
Knowledge Return On Investment © 2002 Timothy W. Powell. All rights reserved.
www.knowledgeagency.com Page 9 of 20
Benefits
Benefits consist of the incremental (in the sense that they would not have occurred without the
project) cash flows generated by the investment. These can be financial; nonfinancial but
measurable; and qualitative, or nonmeasurable.
Financial metrics can be top line or bottom line. Top-line financial benefits include
revenue enhancements, which typically are incremental sales that would not have
occurred without the project. Bottom-line improvements include cost reductions, which
are outlays that can be reduced or eliminated by the project. The ROI measurement only
takes financial metrics into consideration.
Nonfinancial metrics are the subject of various kinds of business scorecards now in
place in many enterprises. Examples include
Percentage of revenues from new products
Employee turnover
Market share
Average number of times the phone rings before being answered
Percentage of a sample of customers saying they are satisfied with the product
Number of new patents filed
Though nonfinancial metrics are worth noting, they cannot be directly incorporated into
an ROI analysis. Sometimes, however, it is possible to arrive at a financial equivalent for
a nonfinancial metric.
Qualitative benefits are assumed to exist, yet in practice typically are not measured
because either they cannot be measured reliably (e.g., better decision making) or because
economically it is not worth the cost of doing so (e.g., percentage of all satisfied
customers).
Knowledge Return On Investment © 2002 Timothy W. Powell. All rights reserved.
www.knowledgeagency.com Page 10 of 20
Benefits are relatively difficult to estimate, and may be highly uncertain, especially in “out
years” farther away from the date of implementation.
Note that, strictly speaking, benefits should be outcome measures; that is, they should reflect
measurable bottom-line results. Too often, KM proponents present output measures (e.g., page
hits on an intranet site) as benefits. Outputs are interim goals or metrics and should not be
confused with outcome measures.
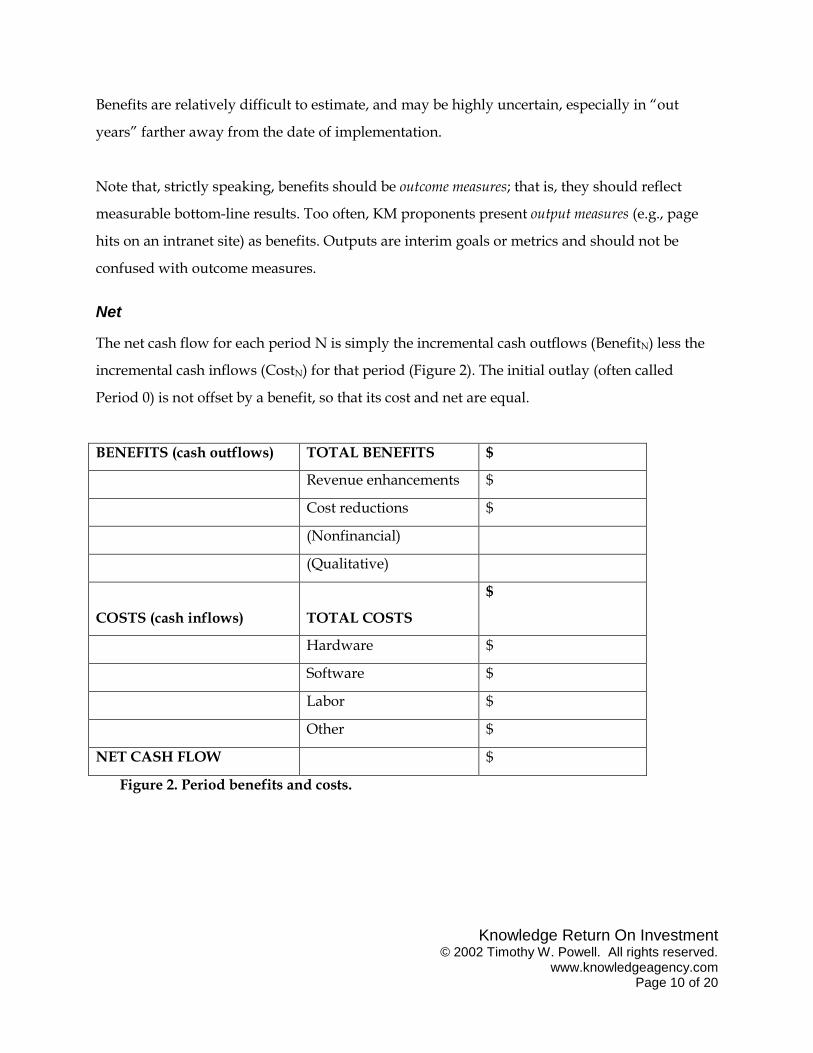
Net
The net cash flow for each period N is simply the incremental cash outflows (BenefitN) less the
incremental cash inflows (CostN) for that period (Figure 2). The initial outlay (often called
Period 0) is not offset by a benefit, so that its cost and net are equal.
BENEFITS (cash outflows) TOTAL BENEFITS $
Revenue enhancements $
Cost reductions $
(Nonfinancial)
(Qualitative)
COSTS (cash inflows)
TOTAL COSTS
$
Hardware $
Software $
Labor $
Other $
NET CASH FLOW $
Figure 2. Period benefits and costs.
Knowledge Return On Investment © 2002 Timothy W. Powell. All rights reserved.
www.knowledgeagency.com Page 11 of 20
Each “column” of our model, then, looks like those in Figure 2. Cash flows should be estimated
for all future periods for some reasonable planning horizon. Five to seven years is a typical
horizon for estimating project costs and benefits.
Cash flows for each period should be estimated independently; however, in many cases, they
are based on the same value formulas. For example, benefits may “ramp up” over several
periods before maturing to their full potential. Certain costs (e.g., vendor charges) tend to
increase over time, whereas others (e.g., training) may actually decrease based on an experience
curve that makes things more efficient.
Cash flows, both positive and negative, should be estimated as conservatively as possible.
Wildly optimist assumptions will usually be detected in the reviews of the project proposal, and
the chance to go back with a revised model may be limited. It is better to run the model
conservatively (estimating costs on the high side and benefits on the low side). If the model
“works,” then it is robust and can be expected to provide a margin for error.
Estimates of future benefits and costs are most credible when expressed as ranges of values.
Often it is useful to run three versions or your model: one optimistic (costs low, benefits high),
one most likely (midpoints of the ranges), and one conservative (as above).
Where an ROI calculation is being used to evaluate an existing project, it is possible to measure
the actual financial impact of the project. In the real world, however, such measurement is time-
consuming, expensive, and often not “worth it” in terms of its own value (the ROI of ROI
analysis).
Time Value of Money
Once the cash flows are estimated for each period, we must account for the time value of money.
Put simply, a dollar (or any other unit of currency) to be received in the future is worth less
Knowledge Return On Investment © 2002 Timothy W. Powell. All rights reserved.
www.knowledgeagency.com Page 12 of 20
today than that same amount received today. The difference is the amount of income that could
be earned in the interim if the sum were invested. (The uncertainty of future returns is also
greater but, ideally, is already factored into the rate of return. Therefore we need not consider it
separately.)
Each of our future cash flows must then be “discounted” by the discount rate, that is, the amount
that the alternatives to this potential investment could be assumed to earn in that time. The
discount rate for any given organization depends on a variety of factors, and is usually
available from the office of the chief financial officer. If you cannot find this number, we suggest
you run your model using 10 percent and make adjustments from there.
There are two related types of DCF calculations: IRR and NPV. These are different ways of
expressing the same basic idea.4 The IRR is the compounded percentage return the project is
expected to yield over the planning time frame. Mathematically, it represents the discount rate
at which the total cash inflows and outflows of the project are exactly equal. The project IRR is
compared to a hurdle rate, that is, the rate defined as the cutoff for capital projects. If the project
IRR is greater than the hurdle rate, the project should be a “go.” The NPV is the present-value
financial equivalent of a stream of future cash flows. The NPV formula builds in the hurdle rate,
such that any project with a positive NPV should be accepted.
Formulas for calculating both NPV and IRR from a series of net cash flows are available in most
PC spreadsheets’ formula libraries, in moderately priced financial hand-held calculators, and in
financial software for hand-held personal digital assistants.
We have said that, ideally, any project proposal with an IRR above the enterprise hurdle rate or
a positive NPV should be accepted. In the real world, however, such proposals are typically
further evaluated along with other “NPV-positive” proposals in order to arrive at final budget
Knowledge Return On Investment © 2002 Timothy W. Powell. All rights reserved.
www.knowledgeagency.com Page 13 of 20
allocations. In this capital-constrained world, these methods usually just get you to the
discussion table; they do not guarantee you the funding you are seeking.
Populating the Model
So far, we have the structural outline of the model. Now we need to determine the value of each
cell in Figure 2 by defining and calculating one (or more) value formulas for each cell. We will
use as an example an ROI model for an expertise profiling system, one aspect of KM. (The entire
model is shown in the Appendix to this chapter.)
For example, one of the labor costs associated with such a system is the training involved.
Training might involve the cost to engage an outside trainer, as well as the training opportunity
cost (the time spent by employees who could have been doing other things). The model also
may need to account for employee turnover in that a new group of employees would need to be
trained periodically.
The labor cost cells of our model might look something like this:
Trainer cost = $25,000 first year; half that each succeeding year.
Employee turnover = 15 percent per year.
Employee costs = 10,000 employees x 60 minutes of online training each x $33/hour =
average wage rate of $330,000 first year; $49,500 each succeeding year (or 15 percent of
the annual total).
Of course, you will need to get actual figures or “best guesstimates” from your own
organization.
Here is another example, this time from the benefits side. To stay with our example of expertise
profiling, cost reductions could result from reducing the outside purchase of expertise, reducing
hiring costs by reducing turnover, or reducing downtime by solving problems faster. Therefore,
our cells might look like this:
Knowledge Return On Investment © 2002 Timothy W. Powell. All rights reserved.
www.knowledgeagency.com Page 14 of 20
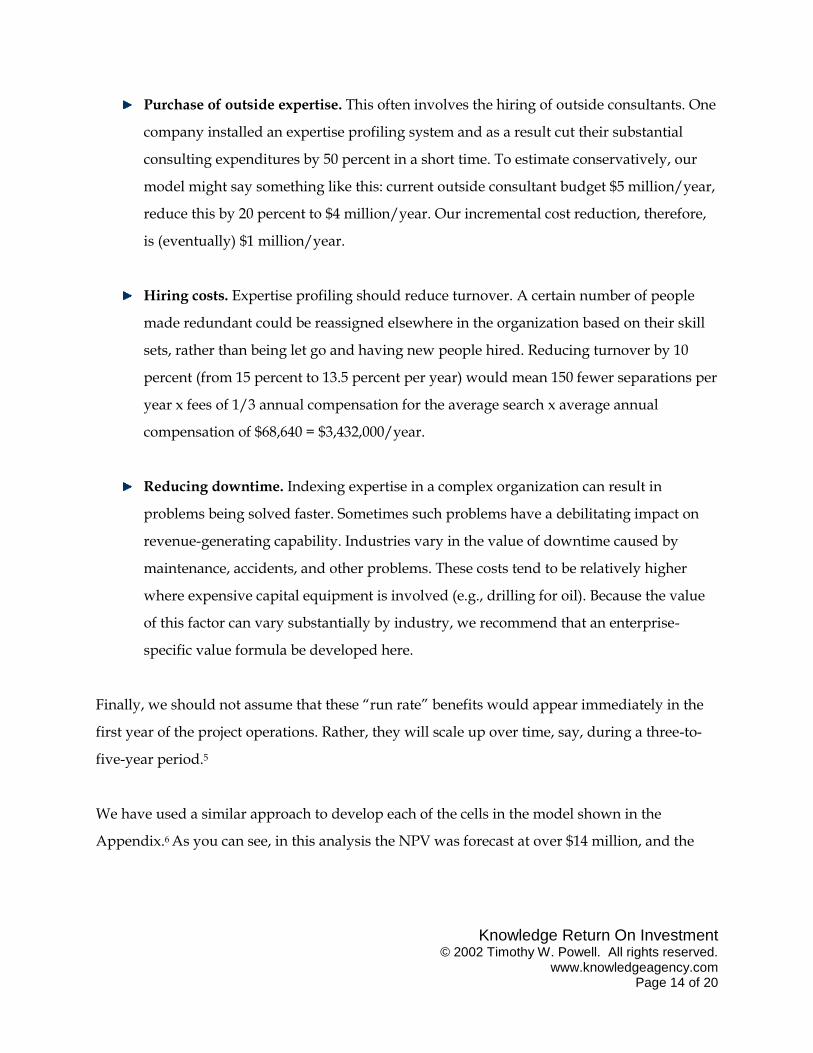
Purchase of outside expertise. This often involves the hiring of outside consultants. One
company installed an expertise profiling system and as a result cut their substantial
consulting expenditures by 50 percent in a short time. To estimate conservatively, our
model might say something like this: current outside consultant budget $5 million/year,
reduce this by 20 percent to $4 million/year. Our incremental cost reduction, therefore,
is (eventually) $1 million/year.
Hiring costs. Expertise profiling should reduce turnover. A certain number of people
made redundant could be reassigned elsewhere in the organization based on their skill
sets, rather than being let go and having new people hired. Reducing turnover by 10
percent (from 15 percent to 13.5 percent per year) would mean 150 fewer separations per
year x fees of 1/3 annual compensation for the average search x average annual
compensation of $68,640 = $3,432,000/year.
Reducing downtime. Indexing expertise in a complex organization can result in
problems being solved faster. Sometimes such problems have a debilitating impact on
revenue-generating capability. Industries vary in the value of downtime caused by
maintenance, accidents, and other problems. These costs tend to be relatively higher
where expensive capital equipment is involved (e.g., drilling for oil). Because the value
of this factor can vary substantially by industry, we recommend that an enterprise-
specific value formula be developed here.
Finally, we should not assume that these “run rate” benefits would appear immediately in the
first year of the project operations. Rather, they will scale up over time, say, during a three-to-
five-year period.5
We have used a similar approach to develop each of the cells in the model shown in the
Appendix.6 As you can see, in this analysis the NPV was forecast at over $14 million, and the
Knowledge Return On Investment © 2002 Timothy W. Powell. All rights reserved.
www.knowledgeagency.com Page 15 of 20
IRR was nearly 69 percent. These numbers would be sufficient to earn such a project serious
consideration in most organizations.
Note that although “reduced time in seeking information” (or similar) is often cited as a benefit
of KM, we have not included it here. The reason is that empirical studies have shown that “time
seeking information” is a relatively constant 20 percent to 25 percent of time for most
knowledge workers, regardless of the kinds of knowledge support processes or systems at their
disposal. This surprising finding is apparently due to the need to satisfice and move on with the
task at hand, regardless of whether the best information has been located (Koenig, 2002).
Benefits and Limitations of ROI Analysis
The benefits of ROI analysis include the following:
Rationality. Decisions should not be based on what vendors represent and not
(necessarily) on what the competition is doing. The criterion should be “what creates
value for stakeholders,” such as customers, shareholders, and employees.7
Comparability. Competing capital projects of differing types can be evaluated on an
equivalent basis.
We have referred throughout to some of the limits of ROI analysis. To review, they include the
following:
Uncertainty. Cash flows may be difficult to estimate, especially in the far future.
Moreover, they may be subject to substantial variability.
Nonmetric nature of some benefits. Some benefits cannot be measured, and for others it
is not worth the effort it would take to measure them.
Attribution. Model organizations are truly complex, and it is difficult (if not foolish) to
attribute certain benefits to specific management initiatives.
Knowledge Return On Investment © 2002 Timothy W. Powell. All rights reserved.
www.knowledgeagency.com Page 16 of 20
Nevertheless, we work in an economic environment in which ROI analysis of KM- and IT-
related projects is regularly a requirement. It is imperative to know these techniques in order to
discuss capital projects of any kind intelligently and persuasively.
Other Ways of Looking at Knowledge Value
In the appendix to his seminal book entitled Intellectual Capital, Thomas Stewart (1997) describes
several “tools for measuring and managing intellectual capital.” He characterizes these as
follows: measures of the whole; human capital measures; structural capital measures; and
customer capital measures.
Measures of the whole. These are measures of the overall enterprise, including market-
to-book ratios, Tobin’s q (a similar measure that considers the replacement cost of
assets), and calculated intangible value (a way of measuring the relative value of
intangible assets at the enterprise level).
Human capital measures. These include measures of innovation; employee attitudes,
experience, and turnover; and the overall value of the accumulated “bank” of
knowledge.
Structural capital measures. These include intellectual property portfolio valuations,
working capital turnover, measures of the amount of “bureaucratic drag,” and measures
of back-office productivity.
Customer capital measures. These include customer satisfaction, the value of
relationships and alliances, and the value of a customer over time.
Stewart provides a fascinating and well-informed discussion of each technique, including
examples of how and where it has been applied. However, it is likely that the knowledge
professional “competing for capital” will find these useful mostly by way of background, rather
than in the executive summary of a KM project proposal. These metrics apply mostly at the
enterprise or business unit level, rather than at the project level.
Knowledge Return On Investment © 2002 Timothy W. Powell. All rights reserved.
www.knowledgeagency.com Page 17 of 20
However, it is possible that some of the metrics described by Stewart will be useful as inputs to
the kind of DCF capital projects analysis we have discussed herein. They may be among the
value formulas that determine each cell of the model.
Much of Stewart’s work derives from a comprehensive intellectual capital scorecard developed
by Skandia, the Swedish insurance company (Edvinsson and Malone, 1997).This includes
dozens of intangibles measures that are ultimately used to provide a single financial index for
the efficiency of knowledge capital. Again, while this approach may provide useful ideas for
some metrics, it is very “macro” in its outlook and scope.
Conclusion
All capital projects must be cost-justified in advance. No matter how great its promise, KM is no
exception. In fact, the failure of some early KM initiatives to create value speaks to the need to
manage such initiatives aggressively—before, during, and after implementation. KM is still
evolving rapidly, with new success stories, technologies, and management approaches always
on the horizon.
The use of rigorous business thinking and analytical tools, such as those presented herein, will
ensure that KM remains at the forefront of enterprise competitiveness—and does not end in the
dustbin of management fads whose time has passed.
Knowledge Return On Investment © 2002 Timothy W. Powell. All rights reserved.
www.knowledgeagency.com Page 18 of 20
Endnotes
1. Capitalized items are those that must be depreciated for financial reporting purposes, such as
a new plant. Expense items flow directly to the current income statement, such as salaries and
other operating expenses.
2. These studies share two significant flaws: (1) they do not strictly control for what constitutes a
KM initiative in each implementing organization; and (2) they were produced by vendors
offering services in the KM “space,” and therefore, may dwell more on upside potential than on
potential pitfalls.
3. This model is actually the discounted cash flow ROI model, the most common form of ROI
analysis used in the modern enterprise.
4. Non–discounted cash flow kinds of capital projects analysis also are available, including the
payback method and the profitability method. In order to be most effective, you will need to
find out what kind of analysis is favored in the organization whose resources this project will
consume.
5. For a more complete discussion of the model as applied here, see Herzberg, R., and Virzi, A.
M. (2002). “Turning knowledge intro a collective asset.” Baseline. April:99.
6. These data were based on a composite model company with the following characteristics:
sales, $10 billion/year; 10,000 employees; employee turnover, 15 percent per year; net margin, 8
percent; hurdle rate, 10 percent; other assumptions as listed. Cost estimates were developed
with input from Cadenza, Inc., an expertise-profiling firm in New York City. They are intended
to be illustrative only and are not quotations for services.
7. For an extended discussion of the relationship between knowledge and value, see Powell, T.
(2001). “The Knowledge Value Chain: How to fix it when it breaks.” In: Proceedings of the 22nd
National Online Meeting, Williams, M. E., ed.
Knowledge Return On Investment © 2002 Timothy W. Powell. All rights reserved.
www.knowledgeagency.com Page 19 of 20
References
Information Week, 20 October, 1997.
PC Week, 31 May, 1999.
Van Horne, J. C. (1974). Financial Management and Policy, 4th ed., New York: Prentice-Hall.
Koenig, M. (2002). Time saved: A misleading justification for KM. KM World. 11(3):22.
Stewart, T. A. (1997). Intellectual Capital: The New Wealth of Organizations, New York:
Doubleday/Currency.
Edvinsson, L., and Malone, M. S. (1997). Intellectual Capital: Realizing Your Company’s True Value
by Finding Its Hidden Brainpower. New York: Harper Business/HarperCollins.
Knowledge Return On Investment © 2002 Timothy W. Powell. All rights reserved.
www.knowledgeagency.com Page 20 of 20
Appendix: A Return on Investment Model
for Expertise Profiling
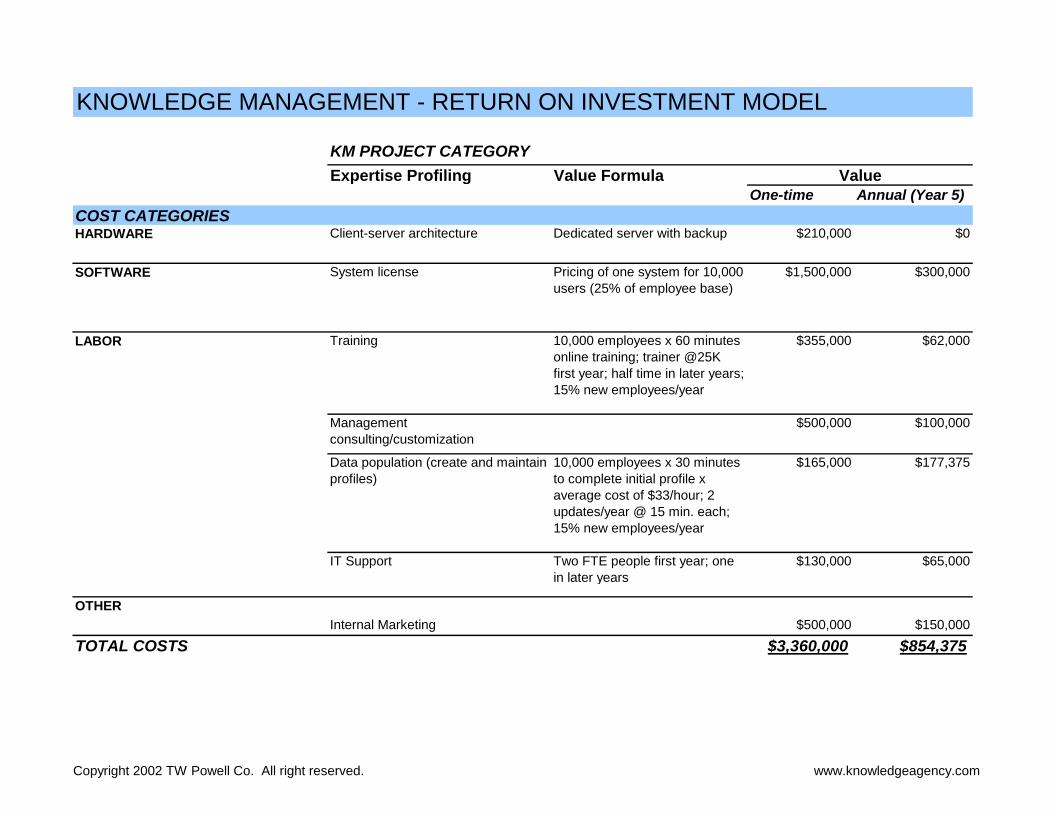
KNOWLEDGE MANAGEMENT - RETURN ON INVESTMENT MODEL
KM PROJECT CATEGORY
Expertise Profiling Value Formula
One-time Annual (Year 5)
COST CATEGORIESHARDWARE Client-server architecture Dedicated server with backup $210,000 $0
SOFTWARE System license Pricing of one system for 10,000
users (25% of employee base)
$1,500,000 $300,000
LABOR Training 10,000 employees x 60 minutes
online training; trainer @25K
first year; half time in later years;
15% new employees/year
$355,000 $62,000
Management
consulting/customization
$500,000 $100,000
Data population (create and maintain
profiles)
10,000 employees x 30 minutes
to complete initial profile x
average cost of $33/hour; 2
updates/year @ 15 min. each;
15% new employees/year
$165,000 $177,375
IT Support Two FTE people first year; one
in later years
$130,000 $65,000
OTHER
Internal Marketing $500,000 $150,000
TOTAL COSTS $3,360,000 $854,375
Value
Copyright 2002 TW Powell Co. All right reserved. www.knowledgeagency.com
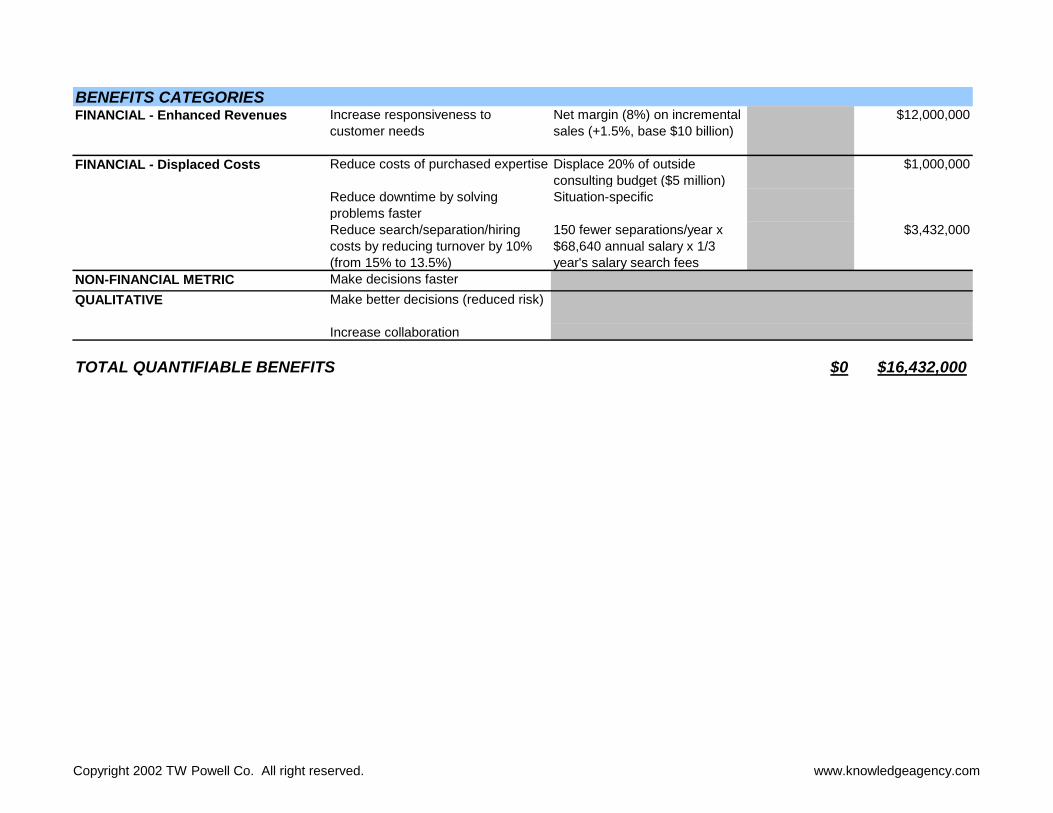
BENEFITS CATEGORIESFINANCIAL - Enhanced Revenues Increase responsiveness to
customer needs
Net margin (8%) on incremental
sales (+1.5%, base $10 billion)
$12,000,000
FINANCIAL - Displaced Costs Reduce costs of purchased expertise Displace 20% of outside
consulting budget ($5 million)
$1,000,000
Reduce downtime by solving
problems faster
Situation-specific
Reduce search/separation/hiring
costs by reducing turnover by 10%
(from 15% to 13.5%)
150 fewer separations/year x
$68,640 annual salary x 1/3
year's salary search fees
$3,432,000
NON-FINANCIAL METRIC Make decisions faster
QUALITATIVE Make better decisions (reduced risk)
Increase collaboration
TOTAL QUANTIFIABLE BENEFITS $0 $16,432,000
Copyright 2002 TW Powell Co. All right reserved. www.knowledgeagency.com
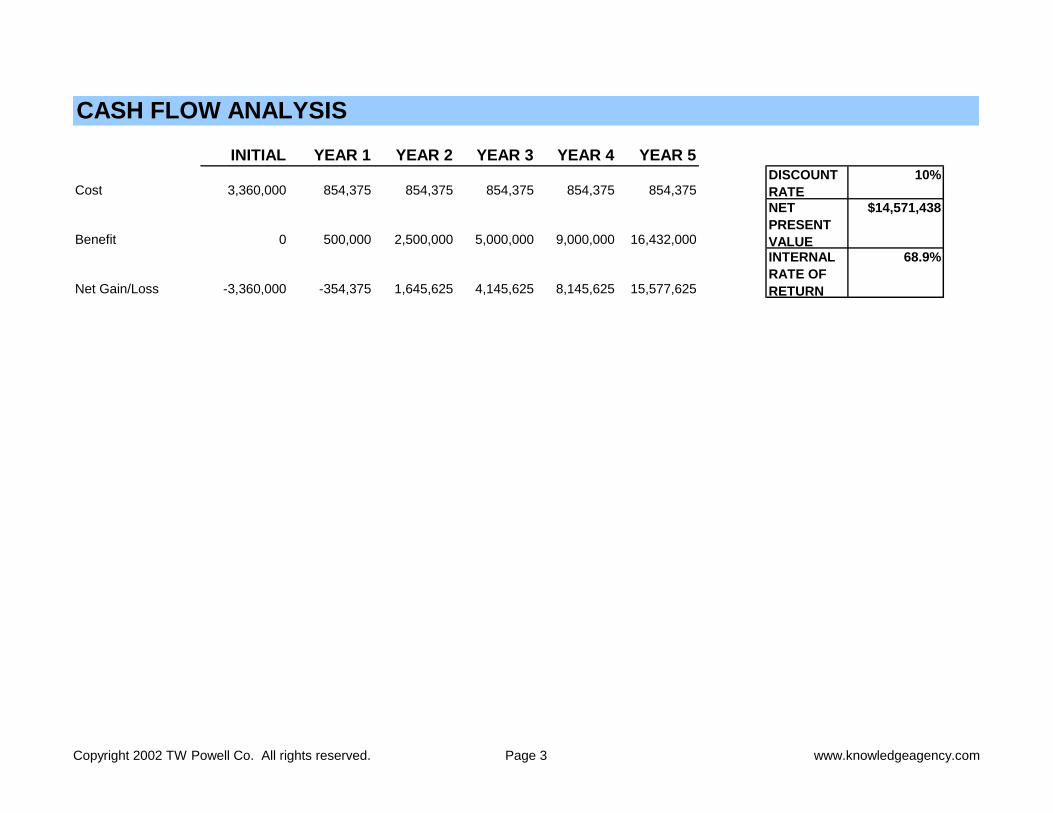
CASH FLOW ANALYSIS
INITIAL YEAR 1 YEAR 2 YEAR 3 YEAR 4 YEAR 5
Cost 3,360,000 854,375 854,375 854,375 854,375 854,375DISCOUNT
RATE
10%
Benefit 0 500,000 2,500,000 5,000,000 9,000,000 16,432,000
NET
PRESENT
VALUE
$14,571,438
Net Gain/Loss -3,360,000 -354,375 1,645,625 4,145,625 8,145,625 15,577,625
INTERNAL
RATE OF
RETURN
68.9%
Copyright 2002 TW Powell Co. All rights reserved. Page 3 www.knowledgeagency.com