Embed Size (px)
Citation preview

Knowledge Discovery in Databases
MIS 637Professor Mahmoud Daneshmand
Fall 2012Final Project: Red Wine Recipe Data Mining
By Jorge Madrazo

Profound Questions
• What basic properties are the formula for a good wine?– Wine making is believed to be an art. But is there
a formula for a quality wine?– There was a paper on “Modeling wine preferences
by Data Mining” submitted by the provider of the data set. How do my results compare with the paper’s?

Procedure
• Follow a data mining process • Use SAS and SAS Enterprise Miner to execute
the process• SAS Enterprise Miner tool is modeled on the
SAS Institute defined data mining process of SEMMA – Sample, Explore, Modify, Model, Assess
• SEMMA is similar to the CRISP DM process

Sample
• 1,599 records• Set up a data partition– Training 40%– Validation 30%– Test 30%

Explore: Data Background• Data source
– UCI Machine Learning Repository.• Wine Quality Data Set.
– There are a red and white wine data set. I focused on the red wine set only.– There are 11 input variables and one target variable.
» fixed acidity » volatile acidity » citric acid » residual sugar » chlorides » free sulfur dioxide » total sulfur dioxide » density » pH » sulphates » alcohol » Output variable (based on sensory data): quality (score between 0 and 10)

Explore: Target=Quality
• Quality– People gave a quality assessment of different
wines on a scale of 0-10. Actual range 3-8.– An ordinal target

Explore: Inputs
• Correlation Analysis– Some correlation, but not enough to discard
inputs• ods graphics on;• ods select MatrixPlot;• proc corr data=wino.red PLOTS(MAXPOINTS=100000 )• plots=matrix(histogram nvar=all);• var quality alcohol ph fixed_acidity density volatile_acidity sulphates
citric_acid;• run;

Explore: Correlation Graphs

Explore: Chi2 Statistics of Inputs

Explore: Worth of Inputs

Explore: Worth Graph
• The Worth Tracks closely with the Chi Statistic

Modify
• At this stage, no modifications are done

Model: Selection
• Because I want to list the important elements in what is considered a quality wine, I choose a Decision Tree
• Configuration– The Splitting Rule is Entropy– Maximum Branch is set to 5• Therefore a C4.5 type of algorithm is being
implemented

Assess: Initial Results
• A Bushy Tree using. The Resulting tree is too intricate for simple recommendation.– Over 20 Leaf nodes.

Modify: Target
• Change the target so that it becomes a binary.• New variable in the model called isGood. Any rating over 6
is categorized as isGood.– SAS Code:
data wino.xx;set wino.red;if (quality>6) then
isgood=1;else isgood = 0;
run;proc print data = wino.xx;
title 'xx';run;

Explore: Target = isGood

Model Strategy for isGood
• Model with Decision Tree to hope for more descriptive results.
• Also model with Neural Network to aid in assessment and do comparison

Model: Decision Tree
• ProbF splitting criteria at Significance Level .2• Maximum Branch size = 5

Assess: Decision Tree Results
• Much simpler Tree

Assess: Decision Tree Results 2
• Leaf Statistics

Assess: Variable Importance
Variable Name Label
Number of Splitting
Rules
Number of Surrogate
Rules ImportanceValidation
Importance
Ratio of Validation to Training Importance
alcohol 1 0 1 1 1density 0 1 0.77055175 0.77055175 1volatile_acidity 0 1 0.728868987 0.728868987 1sulphates 1 0 0.671675628 0.477710505 0.711222032fixed_acidity 0 1 0.553719729 0.393817671 0.711222032citric_acid 0 1 0.549750361 0.390994569 0.711222032free_sulfur_dioxide 0 0 0 0 NaNpH 0 0 0 0 NaNchlorides 0 0 0 0 NaNtotal_sulfur_dioxide 0 0 0 0 NaNresidual_sugar 0 0 0 0 NaN
Event Classification Table Data Role=TRAIN Target=isgood
False Negative True Negative
False Positive
True Positive
53 539 14 34 Data Role=VALIDATE Target=isgood
False Negative True Negative
False Positive
True Positive
43 403 12 21

Model: Neural Network
• Positive – better at predicting• Negative – hard to interpret the model• Configured with 3 Hidden Nodes

Modify: Input Variables to NN
• Because of the complexity of the NN, it is recommended to prune variables prior to running the network.
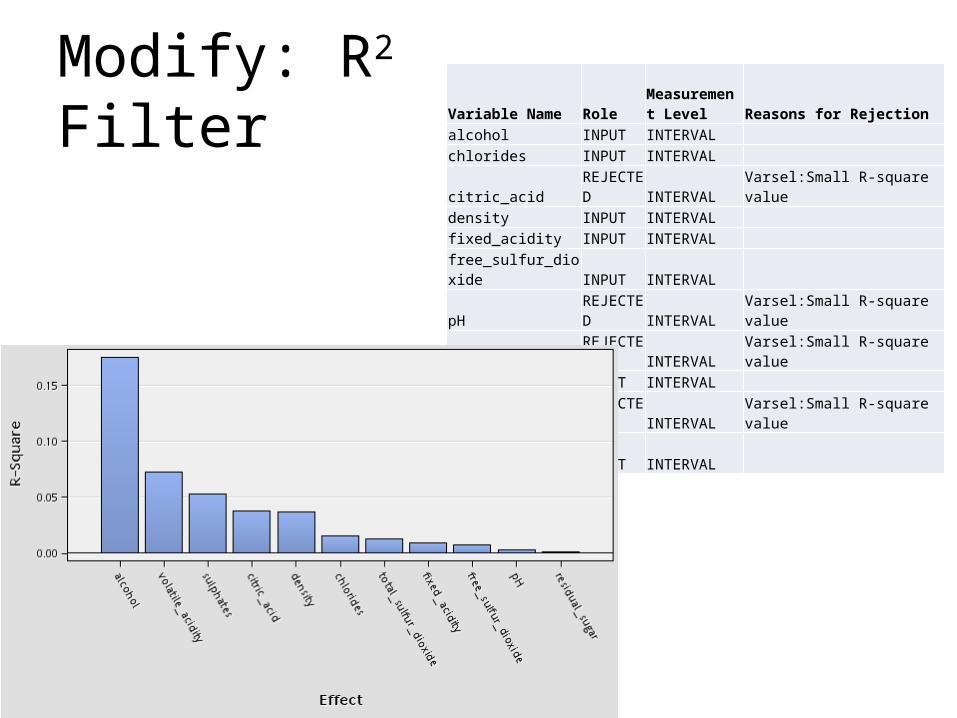
Modify: R2 Filter Variable Name RoleMeasurement Level Reasons for Rejection
alcohol INPUT INTERVALchlorides INPUT INTERVALcitric_acid REJECTED INTERVAL Varsel:Small R-square valuedensity INPUT INTERVALfixed_acidity INPUT INTERVALfree_sulfur_dioxide INPUT INTERVALpH REJECTED INTERVAL Varsel:Small R-square valueresidual_sugar REJECTED INTERVAL Varsel:Small R-square valuesulphates INPUT INTERVALtotal_sulfur_dioxide REJECTED INTERVAL Varsel:Small R-square valuevolatile_acidity INPUT INTERVAL

Model: NN
• Specify 3 Hidden Units in the Hidden Layer

Assess: NN Results• Hard to interpret results to formulate a recipe
The NEURAL Procedure Optimization Results Parameter Estimates Gradient Objective N Parameter Estimate Function 1 alcohol_H11 3.679818 -0.001411 2 chlorides_H11 0.520190 -0.000479 3 density_H11 -2.171623 0.000883 4 fixed_acidity_H11 -0.055929 0.000179 5 free_sulfur_dioxide_H11 0.403412 0.000139 6 sulphates_H11 -4.954290 -0.000224 7 volatile_acidity_H11 2.686209 0.000205 8 alcohol_H12 -0.313005 0.001209 9 chlorides_H12 0.200973 0.000759

Assess: Comparative Results• Receiver Operating Characteristics (ROC) Chart for NN vs Decision Tree

Assess: Comparative Results• Cumulative Lift for NN vs Decision Tree

Assess: Comparison with Reference Paper
• Used R-Miner• Support Vector Machine (SVM) and Neural Network
used• He applied techniques to extract relative importance
of variables• He attempted to predict every quality level• He noted the importance of alcohol and sulphates.
“An increase in sulphates might be related to the fermenting nutrition, which is very important to improve the wine aroma.”

Assess: Paper Variable Importance

Overall Project in SAS EM

References
• UCI Machine Learning Repository http://archive.ics.uci.edu/ml/datasets/Wine
• P. Cortez, A. Cerdeira, F. Almeida, T. Matos and J. Reis. Modeling wine preferences by data mining from physicochemical properties.In Decision Support Systems, Elsevier, 47(4):547-553, 2009.
• Modeling wine preferences by data mining from physicochemical properties, Paulo Cortez et. al http://www3.dsi.uminho.pt/pcortez/wine5.pdf