Embed Size (px)
Citation preview

CSI CommunicationsKnowledge Digest for IT Community
52 pages including coverw
ww
.csi
-indi
a.or
gIS
SN 0
970-
647X
Volume No. 40 | Issue No. 8 | November 2016 ` 50/-
TECHNICAL TRENDSBig Data Processing Techniques & Applications: A Technical Review 32
PRACTITIONER WORKBENCHAn Insight of Big Data Analytics Using Hadoop 37
COVER STORYData Management –Backbone of Digital Economy 7
ARTICLEPrognosis on Wheels : Administrative Effort and Scope for Data Science for Cancer Treatment 28
SENSOR
RESEARCH
TARGET
CITATIONCOST
CONNECTOMICS
OPPORTUNITIES
RECO
NSID
ER
CONTINUES
DEFINITIONPROCESS
WITHINTOOLS SE
T
RECORDS
NETWORKS
HUNDREDS
PERFO
RMAN
CE
GENO
MICS
SYSTEMSINCLUDESHARED TIME
DISK
BIOLOGICALMASSIVELYGARTNER
ALSO
SEARCHINFORMATIONTERABYTES
SETS
EVERY CASE
MAYUSED
BURI
EDQUALITIES
SOLIDWIRELESS
COMPLEXITY
UBIQUITOUS
SINCE
ORGA
NIZAT
IONS
REQUIRING RADIO-FREQUENCY
DISTRIBUTED
INTERNET
PARA
LLEL
SOFTWARE
NEEDED
SAN
STOR
EST
ORE
STOR
EST
ORE
STOR
EDE
FININ
G GROWMANAGE
SOCIAL
COMPLEX DATABASESABILITY
INDEXING
ARCHIVESAMOUNT DESCRIBING
THOUGHTCURRENT
STORAGEDATABIG
APPLIEDEXAMPLES
MRP
PRAC
TITIO
NERS
CAPA
CITY
CAPTURE
LOGS
TOLERABLEMOVIN
GBU
SINES
S
USEONE
PROC
ESSIN
G
PETABYTESSIZE
LARGEMANAGEMENT
TECHNOLOGIESANAL
YTICS
WORL
D’S
FC
PRES
ENTA
TIONS
NOW
FORMS
DESKTOP
SIGNIFICANT
COMPUTING
COMBAT
ZETTABYTES
TYPES
BIOGEOCHEMICAL
CURR
ENTLY
CREA
TED
RELATED
TENS
WORK
ING

www.csi-india.orgu 2 u
C S I C O M M U N I C A T I O N S | N O V E M B E R 2 0 1 6
Know Your CSIExecutive Committee (2016-17/18) »
PresidentDr. Anirban Basu309, Ansal Forte, 16/2A,Rupena Agrahara, BangaloreEmail : [email protected]
ChairmanMr. Ved Parkash GoelDRDO, Delhi
Region-IMr. Shiv KumarNational Informatics Centre Ministry of Comm. & IT, New Delhi Email : [email protected]
Division-I : HardwareProf. M. N. HodaDirector, BVICAM, Rohtak Road New Delhi Email : [email protected]
Region-IVMr. Hari Shankar MishraDoranda, Ranchi, Jharkhand Email : [email protected]
Division-IV : CommunicationsDr. Durgesh Kumar MishraProf. (CSE) & Director-MIC, SAITIndore Email : [email protected]
Region-VIIDr. K. GovindaVIT University, Vellore Email : [email protected]
Hon. TreasurerMr. R. K. Vyas70, Sanskrit Nagar Society,Plot No. 3, Sector -14, Rohini, Delhi Email : [email protected]
Vice-PresidentMr. Sanjay MohapatraD/204, Kanan Tower, Patia Square, Bhubaneswar Email : [email protected]
Dr. Santosh Kumar YadavNew Delhi
Region-IIMr. Devaprasanna Sinha73B, Ekdalia Road,Kolkata Email : [email protected]
Division-II : SoftwareProf. P. KalyanaramanVIT University, Vellore Email : [email protected]
Region-VMr. Raju L. KanchibhotlaShramik Nagar, Moulali,Hyderabad, IndiaEmail : [email protected]
Division-V : Education and ResearchDr. Suresh C. SatapathyANITS, VishakhapatnamEmail : [email protected]
Hon. SecretaryProf. A. K. NayakDirector, Indian Institute of Business Management, Budh Marg, Patna Email : [email protected]
Mr. Sushant RathSAIL, Ranchi
Region-IIIProf. Vipin TyagiJaypee University of Engineering and Technology, Guna - MPEmail : [email protected]
Division-III : ApplicationsMr. Ravikiran MankikarJer Villa, 3rd Road, TPS 3, Santacruz (East), Mumbai Email : [email protected]
Region-VIDr. Shirish S. SaneVice-Principal, K K Wagh Institute of Engg Education & Research,Nashik,Email : [email protected]
Nomination Committee (2016-2017)
Regional Vice-Presidents
Division Chairpersons
an individual.2 are friends.
3 is company.
more than 3 makes a society. The arrangement of these elements makes the letter ‘C’ connoting ‘Computer Society of India’.the space inside the letter ‘C’ connotes an arrow - the feeding-in of information or receiving information from a computer.
CSI Headquarter :Samruddhi Venture Park, Unit No. 3, 4th Floor, MIDC, Andheri (E), Mumbai-400093, Maharashtra, IndiaPhone : 91-22-29261700Fax : 91-22-28302133Email : [email protected]
CSI Education Directorate : CSI Registered Office :CIT Campus, 4th Cross Road, Taramani, 302, Archana Arcade, 10-3-190,Chennai-600 113, Tamilnadu, India St. Johns Road, Phone : 91-44-22541102 Secunderabad-500025,Fax : 91-44-22541103 : 91-44-22542874 Telengana, IndiaEmail : [email protected] Phone : 91-40-27821998
ChairmanPublications CommitteeProf. A. K. SainiGGS Indraprastha UniversityNew DelhiEmail : [email protected]

u 3 uC S I C O M M U N I C A T I O N S | N O V E M B E R 2 0 1 6
CSI COMMUNICATIONS
Please note:CSI Communications is published by Computer Society of India, a non-profit organization. Views and opinions expressed in the CSI Communications are those of individual authors, contributors and advertisers and they may differ from policies and official statements of CSI. These should not be construed as legal or professional advice. The CSI, the publisher, the editors and the contributors are not responsible for any decisions taken by readers on the basis of these views and opinions.Although every care is being taken to ensure genuineness of the writings in this publication, CSI Communications does not attest to the originality of the respective authors’ content. © 2012 CSI. All rights reserved.Instructors are permitted to photocopy isolated articles for non-commercial classroom use without fee. For any other copying, reprint or republication, permission must be obtained in writing from the Society. Copying for other than personal use or internal reference, or of articles or columns not owned by the Society without explicit permission of the Society or the copyright owner is strictly prohibited.
P L U SCSI Special Interest Group on Big Data Analytics: Chronicling the onset of a journey 31Brain Teaser 40CSI Reports 41Student Branches News 45CSI Adhyayan: Call for Articles 50
ContentsCover StoryData Management – Backbone of Digital EconomyVivek Bhartiya, G. Hari Kishore, Anant Kulkarni and Sitarama Brahmam Gunturi
7
Big Data – Aligning Corporates Systems to Support Business BetterSanjay Bhatia
14
The Changing Face of Journalism and Mass Communications in the Big Data EraSamiya Khan and Mansaf Alam
16
Trends in Big DataKashyap Barua and Bhabani Shankar Prasad Mishra
18
Big Data – Challenges and Opportunities in Digital ForensicSapna Saxena and Neha Kishore
20
ArticlesArchitecting Business Intelligence Reporting Systems and Applications for PerformanceK.V.N. Rajesh and K.V.N. Ramesh
21
Prognosis on Wheels : Administrative Effort and Scope for Data Science for Cancer TreatmentSmita Jhajharia, Seema Verma and Rajesh Kumar
28
Technical TrendsBig Data Processing Techniques & Applications: A Technical ReviewSwati Harinkhere, Nishchol Mishra, Yogendra P S Maravi and Varsha Sharma
32
Practitioner WorkbenchAn Insight of Big Data Analytics Using HadoopS. Rama Sree and K. Devi Priya
37
Printed and Published by Mr. Sanjay Mohapatra on Behalf of Computer Society of India, Printed at G.P. Offset Pvt. Ltd. Unit-81, Plot-14, Marol Co-Op. Industrial Estate, off Andheri Kurla Road, Andheri (East), Mumbai 400059 and Published from Computer Society of India, Samruddhi Venture Park, Unit-3, 4th Floor, Marol Industrial Area, Andheri (East), Mumbai 400 093. Tel. : 022-2926 1700 • Fax : 022-2830 2133 • Email : [email protected] Chief Editor: Prof. A. K. Nayak
Chief EditorPROF. A. K. NAYAK
EditorPROF. VIPIN TYAGI
Published byMR. SANJAY MOHAPATRAFor Computer Society of India
Design, Print and Dispatch byGP OFFSET PVT. LTD.
VOLUME NO. 40 • ISSUE NO. 8 • NOVEMBER 2016

Prof. Vipin Tyagi, Jaypee University of Engineering and Technology, Guna - MP, [email protected]
u 4 uC S I C O M M U N I C A T I O N S | N O V E M B E R 2 0 1 6
Editorial
Dear Fellow CSI Members,Data is being generated by everyone at every moment. Data is produced by every
digital process. Big data is generating from multiple sources at an alarming velocity, volume and variety. Big data is changing the culture in which business and IT leaders realize value from all data. Insights from big data can enable organizations to make better decisions, optimizing operations, preventing threats and fraud, and capitalizing on new sources of revenue.
Keeping in mind the importance of Big Data in today’s context, the publication committee of Computer Society of India, selected the theme of CSI Communications (The Knowledge Digest for IT Community) November 2016 issue as “Big Data”.
In this issue, Cover Story contains an article “Data Management – Backbone of Digital Economy” by V. Bhartiya, G. H. Kishore, A. Kulkarni and S. B. Gunturi that highlights the impact and challenges of digital economy using practical use cases and explains how an integrated data management can provide effective solution tackling issues arising out Interoperability, security and trustworthiness of data during its acquisition, preparation and distribution. Next Cover Story “Big Data – Aligning Corporates Systems to Support Business Better” by S. Bhatia explains importance of data processing in business applications. Another article in this category, “The Changing Face of Journalism and Mass Communications in the Big Data Era” by S. Khan and M. Alam describes an interesting application of big data in journalism and mass communications. In Cover Story “Trends in Big Data”, K. Barua and B. S. P. Mishra look into some of the emerging technical trends in the Big Data industry. S. Saxena and N. Kishore in article, “Big Data – Challenges and Opportunities in Digital Forensic” give some significant challenges and opportunities of Big Data for Forensic Investigators.
In Article Category, we have included “Architecting Business Intelligence Reporting Systems and Applications for Performance” by K.V.N. Rajesh and K.V.N. Ramesh that discusses various techniques, methods and best practices which should be followed and implemented at various layers of BIDW system for providing high performance BI reporting applications to the users. Next Article “Prognosis on Wheels : Administrative Effort and Scope for Data Science for Cancer Treatment” by S. Jhajharia, S. Verma and R. Kumar describes use of predictive analytics and machine learning to predict the stage of cancer and estimate survivability.
Technical Trends contains “Big Data Processing Techniques & Applications: A Technical Review” by S. Harinkhere, N. Mishra, Y. P. S. Maravi and V. Sharma that gives the suggestions of the most efficient and suitable processing techniques to process different types of datasets generated by various application areas, along with the challenges in storing and processing and advantages of analyzing it.
This issue also contains Practitioner Workbench, Crossword, CSI activity reports from chapters, student branches and Calendar of events.
I am thankful to Prof. A. K. Saini, Chair-Publication Committee and entire ExecCom, in particular to Prof. A. K. Nayak and Prof. M. N. Hoda for their continuous support in bringing this issue successfully.
On behalf of publication committee, I wish to express my sincere gratitude to all authors and reviewers for their contributions and support to this issue. We received a large number of articles for this issue, we could not include many good articles due to space constraints. We will be including some of these articles in future issues.
I hope this issue will be successful in providing various dimensions of Big Data to our readers. The next issue of CSI Communications will be on the theme “Remote Sensing and GIS”. We invite the contributions from CSI members who are working in the area of Remote Sensing and GIS.
Finally, we look forward to receive the feedback, contribution, criticism, suggestions from our esteemed members and readers at [email protected] kind regards,
Prof. Vipin TyagiEditor

President’s Message
Dr. Anirban Basu, Bangalore, [email protected]
u 5 uC S I C O M M U N I C A T I O N S | N O V E M B E R 2 0 1 6
01 Noveber 2016
Dear CSI members,Greetings of the festive season!The ExecCom met in Mumbai on September 30 and October 1 and took some important decisions. The office of CSI headquarters at Mumbai has been renovated and refurnished. In the evening of September 30, we had a brainstorming session on roadmap for CSI. It was attended by a number of our Fellows and Senior Members residing in Mumbai. Padma Sri Prof. D B Phatak shared his ideas and gave very valuable suggestions. The guests were taken around the premises. We performed puja on October 1 in presence of ExecCom members. We have set growth of CSI Membership as an important objective. With this in mind, we are offering 15% discount on Life membership fees in the month of November 2016. We look forward to help from our members to achieve a 10% growth in our Membership in 2016-17.On October 15, I visited CSI Nagpur Chapter and spent some time interacting with the Members of Nagpur Chapter in presence of their Chairman, Prof. N. S. Choudhari, Director VNIT, Nagpur. Revenue generation is a challenge for all chapters and I shared my views on how to meet the financial challenges. We are taking a number of steps to extend various benefits to our members. We will soon announce fresh norms for opening and running the SIGs.We hope to have a sizeable participation in ICANN 57 being held in Hyderabad during November 3-9, 2016. MEIT (Ministry of Electronics and Information Technology) is involved in organizing ICANN 57 and we have been requested by the Secretary, MEIT to take part in this important event. India with a large number of Internet users need to play a role in policy formulation on use of internet. I have been inviting members to participate in ICANN57 with no registration fees.CSI members are entitled to avail of a special discounted price to attend the PMI India Project Management National Conference, 2016 to be held in Mumbai during Nov 17-19, 2016. Thanks to Mr. Vishal Mehrotra, Global Head - Open Source Platform, ATU, Tata Consultancy Services, we are planning different technical events at some selected colleges with CSI Student Branch.Like every year, SIG-eGov is on the process of selecting the best projects in e-governance. CSI Nihilent e-Governance awards “Finalists Presentations” are scheduled on November 11-12, 2016 at IIIT, Hyderabad Selection for CSI-IEEE Joint Education Award for recognizing the contributions of academician with excellent track record is going on in full swing. The selection committee comprises of eminent educationists nominated by CSI as well as by IEEE. The award will be presented during CSI 2016.Preparations for the Annual Convention of CSI (CSI 2016) to be held in Coimbatore during December 8-10, 2016 is going on in full swing. The organizers have planned an excellent program with international speakers and leading industry practitioners. We are inviting all our members to participate in this event. Accommodation at reasonable cost is available in different categories close to the conference venue. We are expecting a good turnout in CSI 2016.With best wishes,
Dr. Anirban BasuPresident, CSI

Dear CSI’ns,Greetings !!Belated Happy Diwali !!As mentioned by our Hon’ble President Dr. Anirban Basu, the membership figures are ascending. All the Office Bearers and Student Branch coordinators are putting their best efforts for the membership growth of CSI. We again request all the SB’s to initiate student oriented/driven programs at various levels to include more number of student members and Student branches. A special discount has been announced on Life membership upto 30th November 2016 on the eve of 51st Annual Convention. We request all the members to communicate this among all the peer groups to avail the offer and become a member of CSI. Preparations are in progress for the upcoming 51st Annual convention at Coimbatore on Dec 8-10th. The theme of the Convention is “DIGITAL CONNECTIVITY-SOCIAL IMPACT” at the Hotel Le Meridien, Coimbatore. Coimbatore chapter has been working in planning for an outstanding program with eminent speakers and industry leaders. We request all the members to join the event and make the event a huge success. CSI as per the Digital initiative and Government of India guidelines to Go Green, is planning to stop the CSI Communications hardcopy printing for individual members and restrict the copies only to Authors, Institutional members and Student branches for their library. Looking forward to your support and feedback in this regard. CSI organised a seminar on Role of CSI @ 2030 on the eve of inauguration of CSI Head quarters premises, Mumbai (renovated around 3000 sq.ft. and HQ is having ownership of 5500 sq.ft. area) on 30th September 2016 at 5.30 p.m.. President Dr. Anirban Basu & members of ExecCom, veteran leaders of CSI, Managing Committee members of CSI Mumbai Chapter participated in this event. CSI @ 2030 aimed at ensuring holistic development of of CSI by 2030. The discussion led by Fellow & Padmashri D. B. Pathak, Fellow Dr. S. A. Kelkar, Fellow & Past Hon Treasurer Sri V. L. Mehta, Executive Director of CONVRGD and Sr. Life Member of CSI Sri R. M. Rath, Imm Past Chairman of Mumbai Chapter Prof. Suresh C. Gupta, Chairman of Mumbai Chapter Sri Uttam Mane, Members of CSI Mumbai Chapter Sri Ajit Joshi, Sri Rajiv Garela, Dr. R. B. Desai, Mr. Dumasia, Prof. S. Sadasivam participated in the discussions and spoke on sustainable development goal of CSI. Prof. D. B. Pathak opined that, CSI must take leadership role on research & try to achieve the goal set by CSI’s founders. He felt that along with concentrating on growth of membership, CSI ExecCom must devote time for growth of Research & Development as is the need of the hour.Annual Convention 2016 at Coimbatore during December 8-10 is definitely going to be the melting pot of all IT professionals and hope to see our members and their families in large numbers.
With regards
Sanjay MohapatraVice President, CSI
Appeal to all CSI MembersAll members of CSI are requested to update their personal details such as mobile number, latest email address, address for communication and other details in the CSI membership database, if there is any change. This will help CSI to serve its members better. The change request must be supported by valid supporting proof for the change requested.The members must provide the following details along with the request:1. Member’s Name2. Membership No.3. Old Communication Address with registered email-id
(with CSI) and Mobile no.4. New Communication Address with email-id and Mobile
no.Please send the request with any one of the following document/s duly signed by the member for updating database at CSI HQ either by registered post at CSI HQ OR
through email to CSI HQ with copy to concerned RVP for necessary correction / change in details at : [email protected] following documents would be accepted for change request:Voter ID Card / Aadhaar Card / Passport / Bank (Nationalised) Pass Book with photo / Credit Card with Photo / Driving Licence
Prof . A . K . NayakHony. Secretary
www.csi-india.orgu 6 u
C S I C O M M U N I C A T I O N S | N O V E M B E R 2 0 1 6
Vice President’s desk

Data Management – Backbone of Digital Economy
Vivek Bhartiya, G. Hari Kishore, Anant Kulkarni and Sitarama Brahmam Gunturi IP and Engineering Group, Tata Consultancy Services, India. [{vivek.bhartiya, gh.kishore, anant.kulkarni, sitaramabrahmam.gunturi}@tcs.com]
In the increasingly digitized and connected world, advantages also bring equally important challenges that often require new thinking and approach. One of the primary challenges is “data” that is being generated in huge volumes, at enormous pace and in variety of forms. In this hyper-connected world, each and every action of an individual, such as, communication, net browsing, purchasing, sharing information (texts, images, videos etc.) and searching, creates huge digital trails of data. Digital data is now everywhere; in every organization, in every sector and in every economy. In particular, digital economy which is continuously evolving and is fuelled by increasing use of personal computing devices, such as, desktop, laptop computers and smart phones and ubiquitous presence easy access to internet to common man. Data is coming in variety of forms like structured, semi-structured, unstructured and sensor data. This increasing data complexity needs to be handled innovatively using effective data management which forms the back bone of the digital economy. In this paper, we highlight the impact and challenges of digital economy using practical use cases and explain how an integrated data management can provide effective solution tackling issues arising out Interoperability, security and trustworthiness of data during its acquisition, preparation and distribution.
1. IntroductionIncreasing digitization and data
complexities are continuously posing new challenges to enterprises in terms of managing it to derive business advantages over their competitors. The onset of mobile communications, social media and Internet of Things or Internet of Everything has added new dimension to the velocity, variety and volume of data. Data originates from many new sources and in variety of forms which is easy to capture but poses very tough challenges in its management and analysis. According to Meglena Kuneva, European Consumer Commissioner, Brussels, “Personal data is the new oil of the internet and the new currency of the digital world” and is predicted that data is going to control / dictate economy in the same way oil is dictating the world economy [1]. The growing importance of data as a resource implies a growing significance of data management.
It has been widely reported that volume of data generated in the last two years is more than that generated in the last two decades [2]. Between now and 2020, the global volume of digital data
is expected to multiply another 10 times or more [3, 4]. In a recent report from Forbes, it is reported that there will be over 6.1 billion smart phone users by 2020 globally, and majority of them are embedded will many sensors that can collect various kinds of data. [3]. In a recent statistics released by Facebook, there are over 1.65 billion monthly active Facebook users worldwide which is a 15 percent increase over previous year. (Source: Facebook as of 4/27/16). Similarly, according to a recent report by Gartner, “approximately 6.4 billion connected things will be in use worldwide in 2016, and will reach 20.8 billion by 2020” [5]. Some internet reports predict the growth of connected devices to reach 50 billion by 2020. All these reports indicate the unprecedented growth in the number of connected devices/networks resulting to sudden and huge surge in the generation and availability of data that needs to be collected, treated/analyzed and shared. This sudden data deluge is catching the organizations off-guard to handle the volume, variety, velocity
and veracity of data. These forces, namely, the social media / connected devices / hand held devices form a very formidable base for a new economic model - Digital Economy, coined by Don Tapscott [6].
“Effective use of data could increase world income by $3 trillion each year in seven industries alone, these seven industries are education, transportation, consumer products, electricity, oil and gas, health care, and consumer finance” [7].
Organizations are realizing that for strategic decision making, merely in-house data will not be adequate, they also need to blend it Social media data and their competitor’s data as well which is being collated by Data aggregators. We also see emergence of a number of data aggregators who collect and consolidate data for a certain context/purpose. Enterprises will subscribe/pay to data aggregators for the context specific data and have a legal contract to use it.
Digital economy is not just transformation of face-to-face
COVER STORY
u 7 uC S I C O M M U N I C A T I O N S | N O V E M B E R 2 0 1 6

COVER STORY
transactions to online, but it also has many other facets of interactions, transactions. Digital economy carries risks, such as, unauthorized access of information (personal, corporate, transactional etc.). There have been numerous instances of data breaches in the recent past and the number is only growing. In view of i) data growing in volume, velocity, variety and veracity ii) increasing threats of security breaches on data and iii) increasing influence of data in the digital economy, it is extremely important to have an effective data management system that can acquire, process, enrich and distribute data ensuring security and privacy throughout the data life cycle.
In the following sections, we explain i) Digital economy ii) Challenges of digital economy iii) Data Management solution to the problems of digital economy and iv) Potential benefits of data management.2. Digital Economy
The digital economy is developing rapidly worldwide and is one of the most important driver of innovation, competitiveness and growth, and it holds huge potential. New digital trends such as cloud computing, mobile web services, smart grids, and social media, are radically changing the business landscape, reshaping the nature of work erasing the boundaries of nations and redefining the responsibilities of business leaders.
Definition: Digital economy refers to an economy based on digital computing technologies. Digital economy is also called the Internet Economy, the New Economy, or Web Economy [8].
Purpose
Audit-ability
Trace-ability
Confi-dentiality
Digital Economy
Fig. 1 : Definition
Principles: � Three main components of the
‘Digital Economy’ concept can be identified as [8] - » Supporting infrastructure
(hardware, software, telecoms, networks, etc.),
» E-business (how business is conducted, any process that an organization conducts over computer-mediated networks)
» E-commerce (transfer of goods, for example when a book is sold online).
Driving Forces: � Systems of Insights –We are
moving towards the age of System of Insights, where we need ensure real-time delivery of context sensitive accurate information to the individuals on platform of their choice.
� Net neutrality - The principle that Internet service providers and governments should treat all data on the Internet the same, not discriminating or charging differentially by user, content, site, platform, application, type of attached equipment, or mode of communication [9].
Advantages: � All involved parties benefit from
new products, services and increased economic growth.
� Defining and setting the context for the innovation will play important role in enabling profitable growth. Technology will be the main enabler of innovation across various industry domains.
� Data across boundaries can be easily understood and better leveraged by Industries and Government bodies by defining common definitions, standards, terminology as part of Digital Policy.
Challenges:Internet fragmentation due to lack
of Standards and Governance: Internet fragmentation is happening along multiple lines due to developments
in the technical, governmental and commercial realms. There are mainly three forms of fragmentation, which are mentioned below: � Technical Fragmentation:
conditions in the underlying infrastructure that impede the ability of systems to fully interoperate and exchange data packets and of the Internet to function consistently at all end points [10].
� Governmental Fragmentation: Government policies and jurisdiction that constrain or prevent certain uses of the Internet to create, distribute, or access information resources and free flow of information and data
� Commercial Fragmentation: Business practices that constrain or prevent certain uses of the Internet to create, distribute, or access information resources [10].
� Inconsistency and lack of interoperability in Internet of Things (IoT): While full interoperability across products and services is not always feasible or necessary, purchasers may be hesitant to buy IoT products and services if there is integration inflexibility, high ownership complexity, and concern over vendor lock-in [10]. In addition to increasing the costs of standards development, the absence of coordination across efforts could ultimately produce conflicting protocols, delay product deployment, and lead to fragmentation across IoT products, services, and industry verticals.A recent report [11] from Forbes
presented how digital economy is simplifying the business. It highlights the growing importance of data in deriving new business models and how the insights from data are influencing the business growth. 3. Key Challenges of Digital
EconomySurvival of an enterprise will
depend on how fit and rich it is data wise in terms of data coverage and its reliability. When the data is extracted from external sources, such as, social
www.csi-india.orgu 8 u
C S I C O M M U N I C A T I O N S | N O V E M B E R 2 0 1 6

COVER STORY
media, RSS fees, voice call, third party data providers, data aggregators and organizations need to address the challenges of Data Interoperability, Data Trustworthiness and Data Security. 3.1 Data Interoperability
Data interoperability is defined as the ability of two or more systems or components to exchange information and to use the information that has been exchanged (IEEE definition). Data interoperability throws up difficult challenges particularly when the data is originated at heterogeneous sources.
Business world is adapting new approaches and methodologies to create and share data across organizations. The biggest challenge being faced in Data Interoperability is lack of global standards on naming conventions and metadata
Data interoperability brings in uniqueness and reusability to the data and contributes significantly to the increased value of the data which can be easily exchanged and leveraged by other users. In a recent development, Open Group has taken over UDEF (Universal Data Element Framework) and released O-DEF- Open Data element Framework to enable data exchange between organizations. This is a first step towards achieving data interoperability and it is expected to play an important role in defining standards. Readers are encouraged to visit [12] for more details on the operation of UDEF, policies and standards.3.2 Data Trustworthiness
With the recent trends in the digital industrialization, organizations
have realized that data is not only an asset, it is also fast becoming the ‘new currency’ being exchanged amongst individuals, enterprises and nations. As organizations rely more on their data for critical business decisions, data trustworthiness is arguably the most important characteristic.
In general, trustworthiness of data can be characterized by: i) Traceability ii) Reporting iii) Utilization iv) Speed and v) Transparency and a data trustworthiness / reliability index can be linked to the data. This will also help end user to be aware of the reliability of the data which they are using for decision making and factor it in their decision making process. It is important to realize that data trustworthiness/ reliability index of data coming from varied sources will have different levels of reliability; e.g., internal data which organizations are capturing in-house will be more reliable as against the data from public sources or third party data providers.
In their seminal work, Elisa Bertino et al, [13] proposed a data trustworthy metrics and a framework to measure the data trustworthiness. According to the authors, “digital signatures are an important mechanism for ensuring and enhancing data trustworthiness via source authenticity, integrity, and source nonrepudiation”. 3.3 Data Security
Data security is the practice of protecting data from unauthorized access. As explained earlier, in the new age of digital industrialization, data is the new currency and needs to be protected from continuous threats by incorporating appropriate layers of defense regardless of the residence of the data: network, cloud, database or at the endpoint.
This also demands a fresh look at implementing security and privacy policies, governance of contractual obligations, taking into account industry and geography specific regulatory guidelines. Auditing and governance processes have to be put in place to ensure that the data is being used for the purpose for which it was acquired and violation should invoke severe penalty.
The main objective of data security is to ensure data is secure both at rest and in transit / motion. In order to achieve this, there needs to be continuous focus on each data item that is being created, transferred, processed and/or accessed by consumers, internal or external to an organization. It is important to have checks for regulatory compliances, like, payment card industry Data Security Standard (PCI DSS), Health Insurance Portability & Accountability Act (HIPAA),
Fig. 2 : Challenges in Managing Data in Different formats and from varied sources
Challenges
Data Interoperability
Data Trustworthiness
Data Security
Fig. 3 : Data Security and trustworthiness as horizontals across data management
Data Acquisition Data Preparation
Trustworthiness
Security
Data Distribution
u 9 uC S I C O M M U N I C A T I O N S | N O V E M B E R 2 0 1 6

COVER STORY
Sarbanes-Oxley (SOX), Gramm-Leach Bliley Act (GLBA), Family Educational Rights and Privacy Act (FERPA) etc. based on the business domain. value of IPR etc.
It is extremely challenging to keep the data secure throughout its lifecycle particularly, transactional data that traverses over secure and non-secure transportation channels can be exposed without proper security measures. It is expected that each stakeholder may have differing security needs, however it is important that all reasonable steps are followed to ensure that data is kept, secure, private and confidential at all times. 4. Data Management in Digital
EconomyThe new age of ‘digital
industrialization’ is already revolutionizing the way we live and is heading for future where it will play even a bigger role in our lives. The roots of the change lies in the way data about people, places, product and process is generated, shared and consumed. In this rapidly changing environment, it is extremely important for enterprises to realize potential benefits/threats of data, follow the principles of data and have effective mechanisms to handle the volume, variety, velocity and veracity of data. A seamless integration of new technologies, like, cloud computing, social media, mobile technology into the everyday lives will lead a shift from a data-centric world to a data-driven world.
Fig. 4 gives an overview of the various data sources which form the
core of Digital Industrialization. We know that Internet of Information (IOI- Internet of Information) is existing in the form of Enterprise application (ERP, CRM, EDW and other legacy applications), cloud service, mobile application and partner ecosystem, they are providing data about various services or product. With the advent of Social media (IOP- Internet of People) and Internet of Things (IOT- Internet of Things) or Machine to Machine (M2M) interaction, the new dimensions have been added in data ecosystem. In the current connected world, where everyone and everything is connected with Internet, the biggest challenges are to deal with volume, variety, velocity and veracity of the data. Effective data management addressing these challenges can turn data into asset that can become a real value in this digital ecosystem.
5. Data Management Platform – Capabilities, Business Functions & ServicesIn the previous sections we have
defined the key characteristics of data viz. Data Interoperability, Data Trustworthiness and Secured Sharing and in this section we are proposing the framework and structures which will enable Enterprises to achieve it. In the following sections, we will highlight the required capabilities to handle the challenges of dynamic data management.
A typical Data Management solution should aim at establishing data foundation for the Digital Journey of an enterprise. It essentially revisits data management capabilities of the enterprise within the context of diverse set of newer data sources, low cost computing and storage infrastructure, and on-demand delivery of data insights. It is architected to redefine three core functions of enterprise data management, namely, Data Acquisition, Data Preparation and Data Distribution (Fig. 5).
Data Acquisition: The primary focus of this function is to enable the acquisition of data from disparate sources by defining, sources of data, type of data, templates, configurations, governance (policies and processes), frequency of acquisition and mode of acquisition (batch or real). The disparate data types include, tables form RDBMS, texts, audio, video, image, documents, streaming data from devices etc.
Data Preparation: This is the
Social Network
Sensor Network
Enterprise Application
Cloud Service
Mobile Application
Partner Ecosystem
Peop
le
Proc
ess
Prod
uct
Plac
e
Internet of People
Preparation
� Data Quality Management � Data Profiling � Data Enrichment � Data Access � Data Storage
� Buy, Sell and Store crop output
� Crop data as money � Expert Advise and Services
� e-passports, e-residencies, e-visa
� Enhanced Threats Detection and Prevention
� Better Governance and Compliance
Smart: waste management, water management, energy management, urban mobility, health and education
Multi-channel customer sentiment analysis, Communication and Collaboration
Dat
a m
anag
emen
t Sol
utio
n
Acquisition
� Data Source templates � Data Acquisition Protocols � Data Format Templates � Configuration Console � Data privacy Rules
Distribution
� Data Exchange Tools � Data Distribution Templates � Authentication & Access � Control � Subscription Management
Internet of Things
Veracity
Volume
Vari
ety
Velo
city
Inte
rnet
of I
nfor
mat
ion
InputValue
Fig. 4 : Digital Industrialization, Data Management and Insights
Fig. 5 : Data Management – Emerging Landscape
IoT/Sensor
Data Security, Privacy & Governance
Cloud Deployment / Replication
Data Management
Data Harmonization
Data TransformationData
CleansingSpocial Media
POS
Application Data
Data Acquisition
Data Distribution
Data Consumption
Alerts
Dashboards
NotificationsData PreparationEmail, Logs
www.csi-india.orgu 10 u
C S I C O M M U N I C A T I O N S | N O V E M B E R 2 0 1 6

COVER STORY
core function covering ownership, storage, entitlement, profiling and enriching quality of data with primary focus on ensuring accountability and trustworthiness of the business data being managed. Quality of the data is considered to be the differentiator in assigning value to the data in the emerging scenario of “data is the new oil of digital industry”.
Data Distribution: This function deals with data flows as they relate to data replication and distribution. The primary focus here is on both sharing and protection of data – be it within the enterprise or outside and ensuring Data Privacy and Data security at each stage.Data Management Platform Functional Architecture:
In this section we propose a functional architecture of End -to- End Data Management solution. This architecture is technology independent and can be achieved with the help of industry standard products and Open Source technologies protecting and leveraging the investments by enterprise. 6. Use Cases6.1 Digital Sense to Sovereign
Security6.1.1 Problem Description
With increasing threats of terror strikes across the globe, it is extremely important to find answers to questions such as, when terrorists are most likely to attack next? Which weapon (chemical,
biological, radiological) are they going to use? Will they turn to sabotage? What locations and facilities will they target? Terrorism is manifested in different forms and Cyber – terrorism is one of the recent threats that countries are facing with increasing digitalization.
With increasing surveillances on the movement of terror suspects, their transactions and procurements, no country has experienced 9/11 type attack on its territory. But, there have been increasing activities in the cyber world which is still a soft target. In a cyber-attack, the terrorists can remain unknown, far away from the physical location. Moreover, in the new and digitally connected world, a cyber-attack can cause more damage to a country than conventional attack. Cyberspace
is already used by terrorists to spread propaganda, radicalize potential supporters, raise funds, communicate and plan.
One of the biggest challenges in countering terrorism and cyber-attack is to analyze the data which is mostly unstructured from sources such as, text documents, message traffic, sensor images, voice samples and then organize it in a way to provide conclusive insights / evidences to prevent potential terror attacks. Data about people (e.g. victims, witnesses, suspects), objects (e.g. weapons, vehicles, equipment), locations (e.g. crime scenes, critical infrastructures, exclusion areas), transactions (e.g. procuring material, equipment), network (e.g. social network, emails) and more needs to be managed effectively using state of the art technologies there by providing accurate information.6.1.2 Data Problems
With rapid changes in technologies and increase in their adoption, it is difficult to predict how the information available on the cyberspace will used in future. New threats can emerge posing new challenges in information protection. It was reported in WSJ in 2011 that Korean consumer finance firm, Hyundai Capital Service Inc., experienced a serious security breach where hackers stole confidential data and demanded ransom. There were some reported data breaches and more unreported ones. For example, in 2014, there were date breaches in
Fig. 6 : Functional View of Next Generation Data Management Platform
Functional Components
Platform Components
Meta Data Management
Components for Interoperability
Components for Interoperability
Security and Privacy
Data Rationalization
Reference Data
Process Assurance Data Quality Assurance
Enterprise Dictionary
Alerts
Roles and Responsibilities
Store
Standardization normalization Derivation Trends Inferences PatternsGuidelines Rules
and Policy
Backup Retrieve Archive Purge Matching Cleansing Profiling
Authorization Encryption Org Model Audit Trail Access Control Masking
KPIs Validation Reference Regulatory StandardsGovernance, Security
Privacy Assurance
Data Discovery Connect Repository Acquisition Models Distribution Models Standards
AcquisitionData Sources Data Types
Velocity (Batch/Real Time) Stewardship Data transformation
Profiling Enrichment Templates Subscription
Extraction Format Abstraction Dashboards Reports
Preparation Distribution
Fig. 7 : Data Flow & information sharing
Vehi
cles
W
eapo
ns
Tran
sact
ion
Plac
es
Peop
le
Agen
cy 4
Ag
ency
3
Agen
cy 2
Ag
ency
1
GovernmentPeople
Data about Through From Consumed by To whom
Administration
Law & Order
Disaster Management
u 11 uC S I C O M M U N I C A T I O N S | N O V E M B E R 2 0 1 6

Sony Pictures Entertainment JPMorgan Chase & Co. causing damage in their revenues. In one of the mega breaches, Cybercriminals from Eastern Europe have infiltrated at least 100 banks in 30 countries, raking in as much as $1 billion in fraudulent transfers and hijacked ATM machines over a two-year period. Interestingly, Kaspersky Lab, a Moscow based security vendor, reported infiltration in several of its internal systems and called it Duqu 2.0. One way to address this challenge is to develop and provide a protected environment to receive, process and distribute data.6.1.3 How Data Management can help?
In order to prevent terror, it is extremely important to have single and clear view of information about people, such as suspects, their movements, purchases or procurements, possible targets, transactions, etc.,. Considering the generic and wide variety of data sources, data management platform provides a solid foundation in gleaning the data and providing with meaningful and conclusive evidences helping the authorities to act and prevent potential terror threats. Some of the immediate benefits of a proper data management are: � Early Detection and Prevention of
Threats � Better National Security � Secure Information sharing � Better Governance and Compliance
In particular, the interactive visualization capabilities of the proposed data management solution
will help to quickly disseminate CDRs of suspects among millions of records thereby helping the authorities to track the links and networks and act swiftly. 6.2 Revitalize Food Production of a
Country6.2.1 Problem Description
To ensure a country is adequately protected from shortage of food grains, a well thought process and an information backed decision making process essential. There are several roadblocks and some of them are illustrated in the following figure:
Extinction of Barter System (Erstwhile Sharing Economy)
01
02
03
04
Land Development for commercial Purposes
Knowledge loss on farming procedures
Food Production Roadblocks
Lack of intelligent Irrigation Canal planning
Fig. 9 : Food Production Roadblocks
6.2.2 Data ProblemsIn the case of data driven farming,
the data problems can be typically of following types[1] Identification (Duplicate identities)
of crop names[2] Incomplete crop data(Climate data
missing)[3] Location correction (Pin code
missing)
[4] Irrigation canal route incorrect[5] Soil and fertilizers Data Incorrect
and so on.There are limited systems used
by Farmers community to cultivate the crops. The systems should be pervasive and suggest farmer community best decisions, given the context of the situation farmer is in (crop, soil type, irrigation facilities, weather conditions etc.).6.2.3 How Data Management Platform
can help?Data Management Platform can
help in two ways, namely -A) Strategic Level: Connecting and
consolidating data emanating from economic models and bringing visibility into the progressData Management solution
can discover and connect the varied systems such as farmers advisory systems, irrigation project management system, climate and weather forecast system, market information system, Trend analysis systems, urbanization monitoring systems, Smart City systems, Food produce Storage facilities management system, logistics and many more. Any Government having the business vision to improve food production will need the visualization of systemic forces and their influence on the business goals will need effective Data Management Platform as shown in Fig. 10.B) Operational Level: Handling Data
Related ProblemsData Management Platform
components such as preparation framework is capable of handling variety of data problems in general and specific to certain industry segments. Data profiling will identify all the data issues and configure the data quality engine to correct the problems. Data Enrichment capabilities, take care of missing data and augments data with additional information to ensure good quality data or decision making and insights.7. Conclusion
In summary, data management is essential and is extremely important in the new and evolving economic model and more so in Digital Economy
e-UniverseSocial Universe
Device Universe
Cyber Attack
Cyber Attack
Intercept to Defend
Intercept to Detect
Inte
rcep
t to
Dep
loy
Confidential Personal Data
Terror Outfit 1
Terror Outfit 2
Terror Outfit 3
Terror Outfit N
Non-Confidential Personal Data
Fig. 8 : Data Management Platform – Cyber Security
COVER STORY
www.csi-india.orgu 12 u
C S I C O M M U N I C A T I O N S | N O V E M B E R 2 0 1 6

wherein data is the driver and plays a very critical role. In particular, with majority of the data being generated by heterogeneous data sources, a new data management capability is the need of the hour in every industry. In this paper, we have highlighted the growing complexity of data handling and the need of effective and state-of-the-art data management solution. We have also presented the role and influence of data management in digital economy, provided data management landscape and functional architecture which can
be achieved by Industry standard and Open Source products.
Undoubtedly, data is the new ‘wealth’ of an organization and those who effectively and efficiently manage it will only emerge victorious in Digital Economy.8. References[1] http://europa.eu/rapid/press-release_
SPEECH-09-156_en.htm[2] Åse Dragland, Petter Bae
Brandtzæg,SINTEF, https://w w w . s c i e n c e d a i l y . c o m /releases/2013/05/130522085217.htm
[3] h t t p : / / w w w. f o r b e s . c o m / s i t e s /bernardmarr/2015/09/30/big-data-20-mind-boggling-facts-everyone-must-read/#2eacb1606c1d
[4] http://www.emc.com/leadership/digital-universe/2014iview/executive-summary.htm
[5] http://www.gartner.com/newsroom/id/3165317
[6] Tapscott, Don (1997). The digital economy: promise and peril in the age of networked intelligence. New York: McGraw-Hill. ISBN 0-07-063342-8.
[7] James Manyika et al., “Open Data: Unlocking and Performance with Liquid Information,” McKinsey Global Institute, Oct. 2013.
[8] https://en.wikipedia.org/wiki/Digital_economy
[9] https://en.wikipedia.org/wiki/Net_neutrality
[10] h t tp : //www3.weforum.org/docs/WEF_FII_Internet_Fragmentation_An_Overview_2016.pdf
[11] h t t p : / / w w w. f o r b e s . c o m / s i t e s /sap/2015/05/04/these-4-examples-reveal-how-the-digital-economy-simplifies-business/#53e5bc40284e
[12] http://www.opengroup.org/udef/[13] Assuring Data Trustworthiness –
Concepts and Research Challenges, Springer Verlag, 2010, Eds by W. Jonker and M. Petkowic.
n
Proprietary Data
Governments
Farmers
Data Insights
Data Management Platform on Cloud
Services Gateway or Portal
Get Processed DataCommercial Enterprises
Commercial Enterprises
Data Economy
Insights
Social Media
Sell/Buy Data
Sell Data
Sell Data
Fig. 10 : Strategic footprint of Data Management in Food Production
COVER STORY
REGISTRATION HELPLINE : +91-98651-66600 | [email protected]
Dr. N. Vineeth Balasubramanian
IIT, Hyderabad
Dr. R. RamanujamIMSc, Chennai
Mr. Abhishek SinghPrudential Financial
Mr. Karthik Ramasubramanian
Hike Messanger
DEEP LEARNING GAME THEORY DATA SCIENCE
07 Dec 2016 @ PSG College of Tehcnology, Ciombatore
FEES (inclusive of service tax @15%)TUTORIAL + CONVENTION: Rs.1250 + Applicable Convention FeeTUTORIAL ONLY: Rs.1750/- Terms & Conditions
1. Cancellation is not allowed after 15 November 20162. Refund of fee will be done only after the event completion3. A charge of Rs. 500 will be deducted towards cancellation4. The registration is transferrable upto 30 Nov 2016
u 13 uC S I C O M M U N I C A T I O N S | N O V E M B E R 2 0 1 6

Big Data – Aligning Corporates Systems to Support Business Better
Sanjay Bhatia SAP Solution Architect, Houston, USA
Google, one of the most successful IT companies in the world could probably be the biggest data processing company of modern times. Way back in April 2004, when Larry Page and Sergey Brin wrote their first and now famous “Founders letter” to its employees which said “Google is not a conventional company. We do not intend to become one”. 12 years down the line, with change in leadership and new CEO Sundar Pichai writing in his letter to employees in 2016 and concluding it with “Google is an information company. It was when it was founded, and it is today. And its what people do with that information that amazes and inspires me every day”.
I can’t agree more and can personally vouch for the super positive changes the IT/Data have brought in my professional and personal life. Big Data – Simple Use
I remember 12 years back in year 2004, when I first came to United States on a professional assignment, driving was only restricted to known routes as smart phones were not invented and GPS was too expensive to own then. Any driving beyond routine needed preparation of taking point to point addresses, printing out directional maps and strictly sticking to those map routes. Any wrong exit or diversion used to cause big loss of time and sometimes many miles of driving to get back to the route. The data availability was very limited and there was no moving processing capability at that time to guide us real time.
12 years and 8 countries in 4 continents later, last week when I flew to Sydney, Australia on an urgent and unexpected professional assignment, I did not even bother to write down my destination address….This was my first visit to Australia and without even being in the country before, I was confident to
find my directions as everything was in my cell phone…..I know I am not alone to feel and act this way but there are millions and billions are people now in the world who know they have the power to find directions and survive in any village/city/country….
Two things which have made this possible – 1. Availability of “Big Data” – In
this case, airports, taxis, public transport systems, hotels, shops, restaurants, tourist spots etc etc
2. Ability to access, process and use the data – Internet, Cell Phones, Tablets, Laptops, WIFI etc.
One week in a completely unknown place (Sydney), I have could attend to my client work locations, find hotels, book taxis, find restaurants offering all kind of cuisines and tourist spots, without asking anyone anything even once……
The internet offers so much of “Data Sets” without even you asking for it that you just need an average application of mind to logically process the data and take smart decisions. A very simple example – when I type “Indian Restaurant near me” in any maps application on my cell phone, it shows me a. The restaurants near me offering
Indian food,
b. Their distance from me (by car, train, bus, walk and even cycle),
c. How much time would each option take to reach to the destination,
d. Their star rating by people/customers who have dined there
e. Comments by diff previous customers
f. Their specialities etc.
It even goes one step further as when I choose any restaurant from the options and start navigating, it even
tells me the closing time and warns that I may not be able to make it.
The above example simply explains the complex definition of “Big Data” as per Wikipedia as follows
Big data is a term for data sets that are so large or complex that traditional data processing applications are inadequate to deal with them. Challenges include analysis, capture, data curation, search, sharing, storage, transfer, visualization, querying, updating and information privacy. The term “big data” often refers simply to the use of predictive analytics, user behaviour analytics, or certain other advanced data analytics methods that extract value from data, and seldom to a particular size of data set.Big Data – Aligning Corporate Systems –
While the personal life has been drastically changed on positive side, professional life has been equally benefited from the “Big Data” impact. Having been a ERP Professional for last 14 years, I have witnessed tremendous changes in the ERP system, implementation methodologies and leveraging of systems within corporate….all across the spectrum from small to big, local to global and private to non-profit organization. Each corporate has been investing heavily into upgrading their systems.
The aim – Capturing the maximum data, processing it faster and making it available to right employee so that he/she can take right decision.
In the early days of ERP (Enterprise Resource and Planning) system, corporates used to struggle a lot to implement even the basic core modules like Logistics, Sales and Finance etc. Using standard ERP system, which were built on best practices for few years were considered a big achievement for the corporate. However, the “Big
COVER STORY
www.csi-india.orgu 14 u
C S I C O M M U N I C A T I O N S | N O V E M B E R 2 0 1 6

About the Author:Mr. Sanjay Bhatia [CSI-I1510165] is a SAP Solution Architect working in Houston USA. He has worked in many countries (USA, Canada, Singapore, India, Malaysia, Hong Kong, Indonesia and Vietnam) for past 12 years and advised many global clients on ERP implementation for their Real Estate Portfolio. Sanjay has created 4 SAP Apps which facilitate huge data migration/ management and 2 Mobile apps. He has been granted 4 Copyrights in USA and have filed for a patent on data migration method which is under review in USA. He can be reached at [email protected].
Data” requirements have been so huge that meeting it thru conventional ERP modules Is very difficult. The ERP systems which are core to the corporate functioning and integrate various departments must play a key role in this transformation. Adding Width and Depth to ERP systems -
Many ERP’s have probably realised the importance of adding more width to their products to avoid this kind of situation. The system databases, processing and storing of data methods are also changing rapidly and become exponentially better and faster.
I worked on an implementation for an Oil & Gas client and they had a big spectrum of complex processes around Portfolio Management…. The downstream business unit not only had many gas station assets like Pumps/Convenience Stores/Car Wash but also Sales Based variable rents (on gasoline
gallons’ sales and accessory sales from convenience stores), Adjustable sensitive rents linked to Consumer Price Index (CPI) movements and Utility Bill Payments. The IT strategists were looking for a single software which can handle all this and at the same time was core to their ERP system also…. You may imagine how difficult it would be accommodating all the above processes in one software and do real time integration with their Accounting/Logistics etc.…. …. This in addition to all the data they collect about customer behaviour, spending and purchases at each gas station across thousands of locations. The data collection requirement was so intense that the system is expected to capture the record of a credit card transaction which was denied at the pump and how that transaction was finally executed using alternate method (cash or another credit card etc.).
Thankfully, ERP software companies have could predict this requirement from their software much ahead of time and started to align their software’s with changing corporate world. Many software extensions, support packs and newer functionalities have been introduced at frequent intervals. Ideally any extension of software should be seamlessly integrated with almost every module within ERP and is very easy to interface with external system. It should also supports the other surrounding processes like Facility Maintenance, Project Systems and Financials extremely well. The system should be able to be stretched with rich technical tools wherein adding screens and fields is not considered as Core Mod and are well supported as standard ERP.
Expanding the width and depth of ERP and every other relevant system for Big Data is a way to go…it’s a small Step for IT and a Giant Leap for corporate.
COVER STORY
Kind Attention: Prospective Contributors of CSI Communications
Please note that Cover Themes for forthcoming issues are planned as follows:
• December 2016 - Remote Sensing and GIS • January 2017 - Applications of IT• February 2017 - Operating Systems • March 2017 - Software Engineering
Articles may be submitted in the categories such as: Cover Story, Research Front, Technical Trends and Article. Please send your contributions before 20th November for December issue. The articles should be authored in as original text. Plagiarism is strictly prohibited.
Please note that CSI Communications is a magazine for members at large and not a research journal for publishing full-fledged research papers. Therefore, we expect articles written at the level of general audience of varied member categories. Equations and mathematical expressions within articles are not recommended and, if absolutely necessary, should be minimum. Include a brief biography of four to six lines, indicating CSI Membership no., for each author with high resolution author photograph.
Please send your article in MS-Word format to Prof. Vipin Tyagi, Editor, via email id : [email protected] with a copy to [email protected]. (Issued on the behalf of Editorial Board CSI Communications)
Prof. A. K. SainiChair - Publications Committee
u 15 uC S I C O M M U N I C A T I O N S | N O V E M B E R 2 0 1 6
The Changing Face of Journalism and Mass Communications in the Big Data Era
Samiya Khan and Mansaf Alam Dept. of Computer Science, Jamia Millia Islamia, Delhi
The advent of the digital age has given rise to a splurge of data. This event has been driven and catalyzed by digitization initiatives by organizations and the rising popularity of social media. The data available for analysis is so overwhelming that conventional systems cannot serve the storage and processing requirements of big data analytics. In view of this, many big data technologies and techniques have been developed.
Big Data Analytics has found applications in varied fields and domains. The beauty of the big data technology is the way this technology can touch human lives and evolve the way our established systems and workflows operate. While scientific research, bioinformatics applications, geospatial data analysis, social media analytics and healthcare analytics are some of the most popular applications of big data today, newer domains that can use the fundamentals to develop innovative applications have also come into existence.
Digital News and mass media, which also includes social media, form a major chunk of the data available on the Internet. Analysis of this data is capable of revolutionizing the way mass media organizations operate and plan their audience involvement strategy. Although, editorial analytics has found some research attention lately, using a synergistic approach that applies the fundamentals of social media analytics to different forms of mass media to present a cumulative analysis is the need of the hour. Editorial Analytics: Taking Big Data Analytics to Newsrooms and Editor Desks
One of the most obvious applications of big data analytics in mass communications is study of
audience behavior. This application requires a systematic analysis of data in such a manner that different facets of audience behavior are qualitatively studied. This analysis can further be used to streamline workflows in newsrooms and grow audiences, in addition to engaging existing audience to prevent them from losing interest in the content being presented to them.
For obvious reasons, big data analytics solutions for this sector make more sense for digital news organizations owing to the ever-increasing volumes of digital data available with them. In view of the varying goals of digital news organizations, distinct forms of editorial analytics have been developed. There is a striking difference between editorial analytics and analytical solutions developed using generic and rudimentary approaches.
Firstly, most of the editorial analytics solutions available today have been developed by specific digital news organizations keeping in view their organizational imperatives and editorial priorities. The objective of these solutions is to facilitate strategic development and operational decision-making for the organization. Lastly, it is important to understand that media is an ever-evolving environment and the developed solutions need to keep pace with these changing conditions.
The global trend for the use of editorial analytics shows that US and UK-based news organizations rule the roost as far as development and adoption of these solutions are concerned. With that said, editorial analytics solutions are tailor-made to suit the priorities and needs of specific digital news organizations. As a result of this approach, there is no approach or technological framework that can be considered generic enough to call it the ‘right’ way to do editorial analytics.
This gives rise to the need for an analytical framework that can support the fundamental requirements of this system. In order to develop editorial analytics solutions, organizations need to combine their organizational priorities with the right tools in a manner that newsroom decision-making can be facilitated.
The biggest challenge in analytics of audience behavior is that the audience teams must realize that no matter how sophisticated the analytics solution may be, the data cannot tell the whole story. Other forms of qualitative judgment and manual intervention by editorial experts need to supplement any analytics solution. Apart from this, the rapidly changing media environment and issues like data quality and data access remain major challenges that need to be mitigated.
Analytics appeals to journalists in more than one ways. Firstly, it helps them deal with their sole objective of drawing audience attention and getting competitive edge. Besides this, most journalists find analytics intriguing in view of how analytics can help them do better journalism and reach the target audience in the most effective manner. This is an encouraging aspect of editorial analytics considering that analytics solutions for mass communications and journalism need to reflect on the editorial requirements and priorities. A solution that does not incorporate the feedback and viewpoints of editorial experts will result in solutions that are commercially and technologically inclined.
Some off-the-shelf tools are available for editorial analytics, which include comScore DAX (Digital Analytics) and Omniture (Adobe Analytics). Besides these, generic solutions like Google Analytics, Facebook Insights and Twitter Analytics, and specific solutions
COVER STORY
www.csi-india.orgu 16 u
C S I C O M M U N I C A T I O N S | N O V E M B E R 2 0 1 6
designed and developed for specific organizations to meet their editorial analytics needs, are also being used. Newer additions to the bandwagon are Parse.ly, ChartBeat and NewsWhip. Big Data Analytics for Television and Mass Media
It is a well-known fact that big data technologies have been developed for Internet-based data. However, with the convergence of technologies and how television systems have been integrated with advanced systems to offer multi-faceted, Internet-enabled services, a direct application of these technologies in the television systems can also be realized.
Different layers of data available from federated sets of events can be collected and processed to provide useful information. Data is available at the content, network, control and application layers. Some of the evident applications of big data analytics to television and mass media are operational planning, user behavior prediction and affinity of users to channels and programs. State of the art technologies like machine learning techniques and recommender systems can be used to give a new meaning to conventionally generated insights. Big Social Data Analytics for Journalism and Mass Communications
Research undertaken in the field of mass communications commonly deals with questions on the impact of news media and other forms of mass communication on public opinion and how news media has been covering a campaign or issue. In order to answer such questions, an empirical analysis of public opinion and different forms of mass communications needs to be performed.
In the traditional ways of operation, data was restricted to transcripts from
broadcast and newspaper articles available in print. Manual analysis of this data was performed to enable detection of topics, frames and attributes that can be further used for analysis. Moreover, public opinion was taken from public surveys and interviews. These forms of text were analyzed to predict trends in public mindset and extract beliefs.
The ascent of social media and its immense popularity among people of all ages and nationalities has made public opinion data easily accessible in the form of Facebook posts/comments, tweets and YouTube content, in addition to a plethora of other communication channels that exist. This data is increasing on a minute-to-minute basis, with varying complexity and rate of data generation, which makes utilization of this data to extract public opinion a serious research challenge. Social Big Data Analytics for tracking audience behaviors is a direct application of big data analytics in journalism and mass communications.
Evidently, social media data is ‘big’. Data is available in huge volumes; is being generated in big magnitudes every second and entail audio/video/text forms of data. The complexity of data involved makes manual analysis impossible. In order to process this data and manage the complexities associated with the same, several computational approaches have been used.
Text analysis algorithms adapted for the big data context can be used to analyze textual data. However, the reliability and accuracy of results may be unpredictable, which makes the ‘value’ of analytics hence generated rather questionable. Another important aspect that needs to be considered is the commercial viability of these solutions, for unless these algorithms are cost-effective, the chances of the
commercial adoption are bleak. An example of how social media
data analytics can be put to use in journalism is election polls and results prediction. Tweets during an election can be collected and analyzed to assess trends and patterns. These tweets can be analyzed using dictionary-based text analysis or unsupervised topic modeling. Such analysis is impossible to attain using manual methods. The Road Ahead
Technical challenges specific to this field include data acquisition and improving the reliability of results to the extent that they can be deemed useful for organizations. Apart from the technical challenges presented by big data management, some non-technical challenges also need to be considered before a commercially viable and efficient analytics framework can be developed for mass media organizations and journalists.
The technological complexity of analytical solutions shall require skilled staff. Moreover, the evolving nature of analytics solutions, scaled to adjust to the growing complexity of big data, can make tools obsolete rather quickly. Therefore, regular staff training and technical expert knowledge will be required to make big data-enabled analytical framework for mass communication and journalism, functional.
Editorial and mass media analytics have gathered miniscule research attention in the recent past. However, the potential that this big data application has in transforming organizational formats and improving user experiences cannot be undervalued. This presents the need for a technologically empowered analytical framework that can adjust to the priorities and requirements of this ecosystem. n
About the Authors:Ms. Samiya Khan [CSI-1182569] is currently pursuing her doctoral studies in CS from Jamia Millia Islamia (A Central University). Her area of interest includes cloud-based big data analytics, virtualization and data-intensive computing. She can be reached at [email protected].
Dr. Mansaf Alam is currently working as an Asst. Prof. at the Dept. of CS, Jamia Millia Islamia. He has authored two books entitled as “Concepts of Multimedia” and “Digital Logic design”. His areas of research include Cloud database management system (CDBMS), Object Oriented Database System (OODBMS), Genetic Programming, Bioinformatics, Image Processing, Information Retrieval and Data Mining.
COVER STORY
u 17 uC S I C O M M U N I C A T I O N S | N O V E M B E R 2 0 1 6

Trends in Big Data Kashyap Barua and Bhabani Shankar Prasad Mishra
School of Computer Engineering, KIIT University, Bhubaneswar, Odisha
As we are coming to an end of 2016, we believe that 2017 is going to be even more up for the Big Data industry. Here, we look into some of the emerging technical trends in the Big Data industry.
SecurityData has been a limelight in the
industry as well as the media for quite a time now. It seems that the data hacks have become more and more common than many have anticipated for. It has shown up that the companies could do more to protect the data from these hackers.
One of the upcoming projects to tackle this issue is the Apache Sentry, a granular, role-based authorization module for Hadoop. What Sentry does is that it provides the ability to control establish precise levels of privileges on data for authenticated users and applications on a Hadoop cluster
There are components involved in the authorization process: � Sentry Server: The Sentry RPC
server manages the authorization metadata. It supports interface to securely retrieve and manipulate the metadata;
� Data Engine: This is a data processing application such as Hive or Impala that needs to authorize access to data or metadata resources. The data engine loads the Sentry plugin and all client requests for accessing resources are intercepted and routed to the Sentry plugin for validation;
� Sentry Plugin: The Sentry plugin runs in the data engine. It offers interfaces to manipulate authorization metadata stored in the Sentry server, and includes the authorization policy engine that evaluates access requests using the authorization metadata retrieved from the server.
Data WarehousingEarlier, during the 90’s, the
emergence of Data warehouse were in terabytes in size which was considered as a huge amount at that time. Today’s Data warehouse systems count up to thousand times larger data - measured in petabytes. This is the reason that a lot of business and industries are upgrading their data warehouse systems and technologies to cope up.
Google’s BigQuery and Snowflake are some of the best examples that can be used in the emerging trends of Data warehousing scenery.
Snowflake is a data warehouse system to safely store, transform and analyze business data, making it feasible to everyone to gain insight. They have a data warehouse system built on the cloud which could satisfy the modern needs of the customers. Snowflake provides powerful analytics at cloud scale. Analysts can get direct access to data, with compelling performance at any scale of workload and concurrency while at the same time, focusing on getting insight from the data.
Google’s very own BigQuery would be another good example of a ‘Fully managed, petabyte scale, low cost enterprise data warehouse for analytics’. BigQuery can scan Terabytes in seconds and Petabytes minutes. That’s the capacity of scaling that Google has with it’s database system. BigQuery also encrypts and replicates the data to ensure the security, availability and durability. NoSQL
The traditional databases that were used by the companies, have long been replaced by the NoSQL database systems. With the emergence of various NoSQL software applications, business executives and IT managers have more options on the deployment of the databases. Some of the reasons due to which the NoSQL system of databases strive forward in the market may be due to the following reasons : � NoSQL databases scale upward for
cloud computing. � NoSQL databases have disrupted
the relational database monopoly
COVER STORY
Sentry Plugin
Sentry Plugin
Sentry Plugin
Sentry Plugin Sentry
Plugin
Sentry Plugin
Sentry
Policy Metadata
Audit Trail
Hive Server2
Hive Metastore
Group Mapping
Cache
Cache Cache
Authentication
NameNode
HDFS
Admin App
Impala Catalog Impala
Sentry integration with the Hadoop Ecosystem (Image : https://cwiki.apache.org/confluence/display/SENTRY/Sentry+Tutorial)
www.csi-india.orgu 18 u
C S I C O M M U N I C A T I O N S | N O V E M B E R 2 0 1 6

COVER STORY
due to the wide array of option it carries along with it.There have been lots of NoSQL
systems coming up in the market over the course of years. Some of the most popular ones that could be mentioned here would be MongoDB, DataStax and Redis Labs.
MongoDB which has become quite popular in the NoSQL database scenery in the past few years is being adopted by various companies. Some of the companies include SAP, EA, Verizon, Square Enix, eHarmony and many others who have integrated the MongoDB system into their companies. A great aspect of MongoDB is that it is an open-source project. There are lots of free courses one could take on in order to have a sound knowledge about the theory and implementation behind this great database system. MongoDB University (https://university.mongodb.com/) is a great website to toughen up your skills in this area.
Another great example of a NoSQL database system provider would be the DataStax which is currently emerging in the industry regarding its usage. DataStax is a software company that provides commercial support for enterprise edition of Cassandra database, a NoSQL database. It supports the open projects such as Apache Cassandra with extensions for analytics and search using Apache Spark and Apache Solr respectively.Fast Data
With Hadoop gaining more traction in the enterprise, there will be a growing demand from end-users for the same fast data exploration capabilities they’ve come to expect from the traditional data warehouses. Some of the great examples in the same could be as follows.
Cloudera Impala which is an open-source massively parallel processing (MPP) SQL query engine for data stored in a computer cluster running Apache Hadoop. One key aspect of Impala is that all the leading Business Intelligence tools integrates with Impala for added compatibility. One can easily learn about its theory and implementation as a very definitive documentation and tutorial has been provided on their website (http://www.cloudera.com/training.html).
AtScale, a tool which users can query data as it lands in their Hadoop cluster, without data movement, is being used widely for Business Intelligence (BI) in the industry. The AtScale platform is based on the following 3 principles: � No Data Movement Rather than
moving data into expensive and proprietary database engines, with AtScale, data stays right where it first landed. Hence, the main motive behind this is to eliminate the cost of moving or gathering data into costly hardwares.
� BI tool of your choice According to the company, the client must have invested in his own Business Intelligence tool and hence should be free to use any BI tool he prefers.
� One Semantic Layer The Virtual Cubes by AtScale provides and delivers a single semantic layer for consistency, fast performance, and data governance regardless of the type of access.Jethro Data is a great analytics
tool which makes real time Business Intelligence work on Big Data. Some of the companies that have implemented this system includes Tata Consultancy Services (TCS), Fiat Chrysler Automobiles (FCA), Symphony Health Solutions and many others. The main
process in Jethro goes as follows : � A one-time process is used to
create a Jethro-indexed version of dataset which is then stored in Hadoop.
� As new data arrives, it is passed on to Jethro to perform incremental indexing, as frequently as every minute.It has been mentioned in the
official website for the same software as to when this system should be used. When to use Jethro � Need to run BI tool such as Tableau
over data in Hadoop. � Datasets typically range from 1B to
10B rows. � Dozens of internal as well as
external customers expecting < 10s response time.With the advent of Big Data in the
industry, there is an increase in the use of technology related to the same. The constant use of these technologies require an upgradation in the tools and techniques used too. Conclusion:
This article just covers up some of the most recent tools and software that the industry seems to have adopted in terms of handling Big Data and the proper analysis of the enormous data coming in.Reference : [1] https://cwiki.apache.org/confluence/
display/SENTRY/Sentry+Tutorial[2] https://cloud.google.com/bigquery/ [3] https://www.snowflake.net/[4] h t t p : / / s e a rc h d a ta m a n a g e m e n t .
techtarget.com/essentialguide/Guide-to-NoSQL-databases-How-they-can-help-users-meet-big-data-needs
[5] https://www.mongodb.com[6] www.datastax.com[7] http://www.cloudera.com/products/
apache-hadoop/impala.html[8] http://www.atscale.com/[9] https://jethro.io/
n
About the Authors:Mr. Kashyap Barua is continuing his studies in School of Computer Engineering at KIIT University. His research area includes Data Analysis and Big Data, Cloud Computing, IOT. He can be reached at [email protected].
Dr. Bhabani Shankar Prasad Mishra [CSI–N1258075] is currently working as Associate Professor in the School of Computer Engineering at KIIT University, Bhubaneswar, Odisha, India. His research area includes Machine Learning, Evolutionary Computing, Swarm Intelligence, Data Analytics. He can be reached at [email protected].
u 19 uC S I C O M M U N I C A T I O N S | N O V E M B E R 2 0 1 6

COVER STORY
Big Data – Challenges and Opportunities in Digital Forensic
Sapna Saxena and Neha Kishore Associate Professor, Chitkara University, HP
IntroductionNobody will disagree that the
contemporary world is going through the Big Data generation. Every person is engaged in various kinds of activities on Internet either by using social media or by online transactions, online shopping or by any other thousands of activities. Due to all these facts they are unintentionally generating massive amount of data every second by their active contribution on Internet [1]. Moreover, the data generated by various services such as facebook, whatsapp, online shopping websites, etc is also increasing the volume of Big Data to the larger extent.
The extreme dependency of people on Internet, consequently, increased the rate of cyber crimes to the greater extent. And, due to this fact the job of Digital Forensic investigators has become more challenging because they are supposed to dig out the potential evidences from the pool of Big Data. However, the Big Data presents challenges but it can also be utilized as the opportunities by the forensic investigators [2]. Challenge in terms of difficulties in identifying evidences from the pool of structured and unstructured data and the suspects behind the crime. For example, it is difficult to find phishing email IDs in some email server as there is not any specific filtered data present on the server. On the other hand Big Data also presents opportunities such as correlating distinct data sets to identify some criminals or criminal activities.
In this article some significant challenges and opportunities of Big Data for Forensic Investigators are discussed.Big Data
Big Data is so massive in volume that it cannot be measured in terms of gigabytes or terabytes instead it is as large as petabytes or zetabytes [3]. In addition to this the volume is still increasing on accelerated rate with every second. The Big Data is a blend of structured as well as unstructured data. Big Data is characterized by the five Vs which are variety, velocity, volume, veracity and value [4].Forensic Analysis
Digital Forensic is a branch of Applied Science which deals with the identification, collection, organization, preservation and presentation of evidence data which is
permissible in court room [5]. Recently Network forensics has been evolved from digital forensics, which deals with collection of evidences from Internet or local intranets [6]. Digital or Network Forensics helps the security and forensic investigators to analyze evidences collected from Internet. This type of forensic analysis also deals with the cloud and other distributed environments.
The process of Digital Forensic comprises of following main sub-processes [7]:� Identification � Collection � Organization � Preservation� PresentationBig Data as Challenges for Forensic Analysis
Big Data is massive data of diversified varieties generated on very high velocity. Traditional digital forensic tools are not proficient to handle big data in order to identify and analyze the evidences effortlessly [8]. Some potential challenges of Big Data Forensics are: � Identification: Finding accurate evidence
from the Big Data is a tough job. Because searching a meaningful piece of information from huge volume of data to reach some conclusion regarding certain incident is not easy and that too when data to be scrutinized is increasing at high velocity.
� Collection: The major challenge which may be faced during this step is the collection of erroneous or worthless data. For example if some errors were occurred during the identification phase then they will surely be transmitted in this phase. In addition to this the volume and velocity of the evidence data may always pose the problem of collection in front of the investigators.
� Organization: Organization of the Big Data evidences in legitimate manner is the biggest challenge faced by forensic investigators. Due to the inherent characteristics of Big Data i.e. variety, volume, velocity and veracity, it is not possible to review and organize evidences manually. In most of the cases effective data mining tools are required to organize the evidences. But the data mining tools capable of handling big data evidences are not available which sometimes worsen the
situation even more. � Preservation: Forensic investigators often
face the problem, while preserving the evi-dences to maintain their security and in-tegrity for the future use, due to the same fact - unavailability of appropriate tool.
� Presentation: In this step the investigators prepare the final reports on the basis of available evidences which may sometimes become very difficult while dealing with big data. In addition to this the limited knowledge of judges on big data may also deteriorate the situation. It may be difficult to explain the analysis of big data evidences in front of them.
Big Data as Opportunities for Forensic Analysis � To correlate distinct criminal data set.
All the criminal cases which are already solved by the investigators can be stored in big data tools along with their facts. These datasets can be mined in the future at any point of time to correlate distinct criminal data sets to identify either crime or criminal. Moreover, these datasets can also be filtered to decide upon the evidences for any criminal case.
� Identification of Cyber Criminals. Big data generated from various social websites, online transactions and other online services can be investigated to identify the cyber criminals. The modus operandi and criminal patterns of cyber criminals can be protected in some big data tools which can be mined or referred in future to identify or collect evidences in certain cases.
� To identify mental state of a criminal. The mental state and crime patters of different criminals can be stored in the big data tool which may be referred in the future to decide upon the mental case and severity of the crime.
� Identification of Phishing Email. The phishing emails which have already been identified by the cyber investigators can be made available on the cloud. Internet Service Providers, cyber investigators or general users can refer that list to identify and block those phishing emails to protect their very private and sensitive data. Moreover, an alarm system may also be incorporated with these lists which notify the users when they are accessing these illicit emails.
...Contd. on page 39
www.csi-india.orgu 20 u
C S I C O M M U N I C A T I O N S | N O V E M B E R 2 0 1 6

A R T I C L E
Architecting Business Intelligence Reporting Systems and Applications for Performance
K.V.N. Rajesh K.V.N. Ramesh Head, Dept. of IT Vignan’s Institute of IT, Project Manager, Tech Mahindra, Visakhapatnam Visakhapatnam
Business Intelligence (BI) reporting systems and Data warehouses (DW) are integral part of all modern organizations. They are essential for making sense and deriving value out of huge repositories of data which these organizations generate and possess. Just having the BI reporting systems in place is not enough to provide value to the organizations. The BI reporting systems should provide the ability for the users to access the right data within acceptable amount of time. That is why the performance of the BI reporting systems and applications is of paramount importance for their successful adoption.
The objective of this article is to discuss various techniques, methods and best practices which should be followed and implemented at various layers of BIDW system for providing high performance BI reporting applications to the users. It may be noted that the topic of discussion in this article is mainly the performance from the user experience point of view and not from the extract transform load (ETL) point of view since that is a separate topic in itself. Anyhow, some of the best practices and techniques mentioned here will help with the ETL performance too. In this article, the terms “BI report” and “BI dashboard” are used interchangeably for ease of discussion. Also, most of the BI reporting system deployments currently in the world consist of a BI reporting tool (like Business Objects, OBIEE, Tableau, Spotfire, Qlikview) as the front end and a relational database management system like Oracle or SQL server as the backend. So the subject of discussion in this article is these kinds of traditional BI reporting systems.Database layer
The data requested by a BI report
translates to a SQL SELECT query on the underlying database in most of the cases. So, one of the main criteria for a BI Report with good performance is a SQL SELECT query with very good performance. So for a great end user experience of a BI application, the BI reporting application, system and the database needs to be highly tuned for read operations.
A good data model is the first and the most important step in developing a high performance BI reporting system. Data model defines the relationships between various data objects. Various data model types are intended for various purposes. While the entity relationship model is the dominant technique for designing transactional systems, the dimensional modeling technique is mostly employed for BIDW systems. One of the main objectives of dimensional modeling is high performing SQL SELECT queries catering to the reporting requirements. The BI reports and analytics run by the users translate to SQL SELECT queries which hit the database. Most of the queries have to join multiple tables to get the data requested by the user. When the queries have to traverse shorter paths to get the requested data, the performance of the respective query would be good. That is the whole idea behind dimensional modeling. When we think of a dimensional model, the star schema comes to mind. The star schema consists of a fact table surrounded by and joined to dimension tables using surrogate keys. This model allows for high performance SQL SELECT queries since the fact table and dimension tables are directly connected and the path needed to fetch the required data is the shortest.
Denormalization is one technique that is used to improve the read
performance or data retrieval from a database. Normalization involves splitting large tables into smaller tables for improving data integrity and reducing data redundancy. This can lead to performance degradation in terms of time taken for data retrieval. To improve the query response times, redundant copies of data are added back or the data is grouped to support reporting performance needs. In the star schema mentioned earlier, the dimensional tables are highly denormalized.
In Data warehouses, the volume of data in tables keeps on increasing over period of time. Higher volume of data in the tables leads to degradation of SQL SELECT query performance since the query has to scan more and more to get the required data.
Having Summary tables which have data grouped by different dimensions is a technique used to solve performance issues for specific queries. The summary tables will have lesser number of rows of data when compared to detailed table since it has measures grouped by fewer dimensions. So when the data based on fewer dimensions is required, the query can be directed to the summary tables instead of the detailed tables to get faster response times. Some BI reporting tools have the ability to dynamically generate and direct the query to the required summary table or the detailed table at run time based on the dimensions chosen.
Database products like oracle allow for creation of materialized views. Materialized views are database objects which are precomputed results of queries. Long running and frequently used queries may be good candidates for creation of materialized views. Since the queries are already run and the corresponding results are stored in the materialized view, the data retrieval
u 21 uC S I C O M M U N I C A T I O N S | N O V E M B E R 2 0 1 6

A R T I C L E
from the materialized view will be very fast. Appropriate strategy and schedule for the refresh of the materialized views need to be designed based on the frequency of updates and data loads to the tables used in the query underlying the materialized view.
Appropriate archival strategy should be in place for tables with large number of rows. This is to prevent the tables from growing bigger and bigger. Big increase in number of rows in the tables drastically affects the performance of the queries on these tables. Based on the compliance requirements for maintaining history data, the older data needs to be moved to archival tables at specific intervals of time to keep the table size in check.
Good indexing strategy is an important technique for getting good performance for SQL SELECT queries. Various database products implement indexes in various ways. The key idea anyhow is creating an index on one or more key dimension columns of the table. Index allows for very fast retrieval of rows when SQL SELECT queries are run based on those key columns. These indexed columns act as pointers to the rows of data thus aiding in faster access and retrieval of the respective rows of data. Databases also provide the ability to create indexes on functions and expressions based on columns. B-tree index, hash index, clustered / non clustered index are some of the indexes provided by various database products.
One specific kind of index which is of special significance and is suitable in the data warehousing scenario is the Bitmap index. Databases like Oracle, PostgreSQL and MySQL provides the Bitmap index functionality. The theory is that this index is suited to work well and is efficient on columns with low cardinality in large tables in read-only systems like data warehouse. Low cardinality means columns with lesser number of distinct values. In the tables which have Bitmap index created on it, every row has a bitmap associated with it in the Bitmap index. The size or length of the bitmap is equal to the number of distinct values in the column on which the Bitmap index is built. Search and joins on the columns with Bitmap index is very efficient since the database can
rapidly scan for the matching values. Building a bit map index has overhead associated with it, since the entire Bitmap index needs to be rebuilt every time when rows with new distinct values are inserted. Hence these are more suited for read-only systems like data warehouses where data inserts are done only at sufficient intervals of time (like during the daily load or refresh of the data warehouse).
Partitioning the tables is another technique employed to improve performance. Large tables are divided into smaller parts as per the partitioning strategy employed. Partitioning is the divide and conquer approach to manage large tables and improve performance. In large tables with huge number of rows, the tables are partitioning by a key dimension. There are a number of partitioning criteria and methods like list partitioning, range partitioning and hash partitioning. More often than not, we see tables being partitioned by time dimension like month. Every month, a new partition is added and all the new data for that month goes into that new partition. So when the SQL SELECT query on the table has a where clause based on month, only the partition corresponding to the respective month is scanned for the required data. This greatly improves the performance since only a subset of data is queried upon. Also, the archival of old data becomes easy since just the old month partition can be archived and dropped.
Parallelism is another technique employed in improving performance of SQL SELECT queries in data warehouses. It again employs the divide and conquer approach where a big data intensive operation is broken down into multiple processes which can execute simultaneously. Certain queries are amenable to parallelism. For example, in the earlier example of a large table partitioned by month, when a query based on multiple months is run against the table, parallelism can be used to break down this task into multiple processes which can run simultaneously on the different month partitions. This can lead to great performance gains in systems which have adequate underlying hardware configuration which can support
parallelism. Data Compression is another
option that is provided by some database products which helps with improving SQL SELECT query performance. Due to data compression, there are big savings in data storage. Though there is an overhead in write operations due to data compression, benefits are seen in terms of read operations such as table scans of large tables. Lesser input/output operations are required to read compressed data and thus this can lead to improvement in performance of SQL SELECT queries.
Even after employing the mentioned techniques, there can still be SQL SELECT queries which take a long time to run. Following best practices, query tuning and query optimization techniques can help with improving SQL SELECT query performance. Various database products provide various tools to study query plan. Query plan is a set of steps which the relational databases will follow to access and retrieve the data requested by a query. It helps to understand in detail about how the query is going to use the indexes, partitions and other features and the costs associated with them. This is of great help in tuning the queries. In addition to general SQL best practices, the manuals of the respective database products can be referred to for the details of the specific tuning techniques which use the features specific to that database product.
The discussion till now was more about the usage of various database features which aid in performance improvement of a BI reporting system. The configuration of hardware and software underlying the database plays a very big role in performance of the data warehouse. The type and number of processors, the type and configuration of disk subsystems, the memory size and the choice of operating system have great impact on the database performance. This is specialized knowledge which comes under the domain of the database administrators of the respective databases.Business Intelligence layer
The next important layer which affects the performance of a BI reporting application is the BI reporting tool, its
www.csi-india.orgu 22 u
C S I C O M M U N I C A T I O N S | N O V E M B E R 2 0 1 6
A R T I C L E
configuration and setup and usage of its features. This is because the end users access the data through the BI tool.
Choice of the BI reporting tool needs to be done keeping in mind the BI reporting requirement which need to be catered to. Certain BI products like Business Objects are suitable for operational reporting while other BI products like Tableau are suitable for analytical reporting.
The hardware sizing and capacity planning of the BI server needs to be done taking factors like the number of concurrent users into consideration. The hardware sizing includes deciding the RAM size, number of CPUs, and Disk space. The choice of the disk type affects the performance. Solid State Drives (SSD) provides great performance when compared to the traditional Hard Disk Drives (HDD).
Now it is usual that the server machine, on which the BI reporting tool is installed, is on cloud. For getting the best performance, the comparison between having the BI reporting tool on a cloud server versus having it setup locally on physical machine needs to be done. There are cases where having a local setup of BI reporting tool on physical server is seen to give much better performance.
The BI reporting systems should be built for scalability. Once the business users see the value in the BI reporting system and application, it usage keeps on increasing. This could lead to performance degradation over period of time. Horizontal or vertical scaling strategy should in place. In simple terms, Horizontal scaling involves adding more nodes to the existing setup to cater to increased load on the BI Server. Vertical scaling involves adding more power to the existing server machine by increasing the CPU and RAM.
The production BI reporting systems should have multiple clustered servers so that the load and requests from the end users are spread across servers using load balancing software like Cisco IOS, F5 BIG-IP Local Traffic Manager (LTM), Radware AppDirector.
To manage the day-to-day performance of the BI reporting system and to prevent performance degradation,
monitoring systems should be in place. Server performance monitoring using automated tools should be done to continuously monitor parameters like usage of CPU, RAM and disk space. The server administrators should be alerted whenever the performance falls below the acceptable limits or crosses the set threshold levels. Product companies like HP, AppDynamics, New Relic, Compuware, CA offer tools related to monitor server performance.
In organizations spread across geographies, the end user experience of the BI reporting application can vary from location to location. There are automated scripts and robots which can be used to monitor the performance by logging into the BI portal as virtual users from different locations. The virtual users can navigate through the BI portal and run key BI reports and can measure and log the various performance parameters. Alerts and notifications can be sent out to administrators and concerned teams whenever performance degradation is observed by the script or the tool. The alerts can help in taking proactive and quick actions even before the end users themselves fully notice performance issues. Detailed geography wise dashboard view of the end user experience can be provided by these tools. This can help in taking appropriate remedial actions when frequent performance degradation is noticed at certain locations. Companies like CA, Dynatrace, HP offer tool and solutions for user experience management.
Various BI reporting tools provide various options, features and server parameters which can be used to improve the performance of the BI reporting system and applications.
Caching is one option provided by some BI reporting tools which can help improve performance of frequently used BI reports. When a particular BI report is run for the first time, it would follow the full process of the query hitting the database and fetching the result and the BI server then formatting the result and displaying it on the browser to the user. Caching helps in storing the result in BI server cache. When the same user or another user again runs the same BI report, it is directly fetched from
the server cache and thus the report gets retrieved very fast. This helps reduce load on BI server, network and database. The problem of fetching stale data does not happen since the data remains static in data warehouses till the next data load or refresh. After the next data load or refresh, the BI server needs to be bounced and the cache has to be cleared to make way for creation of fresh cache of the used reports with latest data. BI administrators need to enable cache and configure appropriate cache size on the BI server so as to make good use of this feature.
The BI reporting tool named OBIEE provides further improvised feature over caching known as Cache Seeding. The frequently used BI reports are scheduled to run and populate the cache after the data loads, so that the BI reports come up fast when users run them.
The BI tool named Tableau provides the functionality called Extracts. Tableau has the semantic layer called data sources which connect the front end dashboards to the backend database tables. The data sources have the database connection details and have metadata information like tables and joins. The data sources are modeled by architects so that they are generic and satisfy multiple reporting requirements. The data sources can be created as live connections or as extracts. When the data sources are created as live connections, the respective SQL SELECT query hits the underlying database every time when the dashboard created on the data source is executed. The tableau data extract option allows for running the SQL SELECT query corresponding to the data source and then stores the retrieved result on the Tableau Server. The data in tableau data extract is highly compressed and stored in columnar store format. Columnar stores give great performance for performing analytics where measures are aggregated by few dimensions. Also, the tableau data extracts are architecture aware which allows them to make best use of server resources like memory and hard disk. All the dashboards built using the tableau data extracts have good performance due to the mentioned points.
u 23 uC S I C O M M U N I C A T I O N S | N O V E M B E R 2 0 1 6

In–Memory technology is being used by the BI reporting tools now-a-days to provide great performance. With the earlier 32-bit processors, there was an upper limit of 4GB RAM which the processors could support. This limit is no more there with 64-bit processors which are available now. They can support much higher RAM depending on the respective operating system and version. The theoretical upper limit is 16.3 Exabytes. Therefore a number of BI tools which make use of In–Memory capabilities have become available in market. In In–Memory BI reporting tools, the data is loaded to server memory. The analytical operations and computations are carried on the data in the main memory. Since the data access from the main memory is much faster than the data access from the secondary storage, the performance is very good with the BI reporting tools which use the In–Memory technology. BI tools like Qlikview make use of the In–Memory technology. SAP HANA too uses In–Memory and columnar data storage technologies.
Most BI reporting tools log the usage metrics related to report and dashboards usage, into the respective database repositories. BI reporting tools usually provide standard BI reports to access usage information from the repository. These BI reports can be used to study the usage patterns of BI reports. Custom BI usage metrics reports too can be developed by directly accessing the BI repository. These BI usage metrics reports can be used to get details like maximum used BI reports and worst performing BI reports. The BI development or maintenance team can take up the respective BI reports for performance tuning.
After analyzing the usage metrics, the identified frequently run, badly performing and long running reports can be refreshed using the scheduled refresh functionality provided by most BI reporting tools. These refreshed BI reports can be made accessible to the required users by publishing them to public folders. Since these canned reports are saved with latest data, they come up quite fast when the users access them. This also helps in reducing load on BI server, network
and database since same BI report with saved data is used by multiple users. The refresh schedule of these reports can be kept in sync with the data loads of the backend tables corresponding to these BI reports.
For good performance of the BI applications, best practices needs to be followed by the BI development teams in the design and development of the BI semantic layers and BI reports. Business Objects reporting tool has a semantic layer called Universe. OBIEE has a semantic layer called RPD. Tableau has a semantic layer called Data source. Other BI tools could be having similar semantic layers. These semantic layers have the metadata information related to tables, joins, hierarchies. They also have the mappings between the Business names of various fields and the corresponding backend tables and columns. These semantic layers need to be modeled and designed well to make use of the performance improvement features of the underlying database and data model. They need to be designed to take advantage of the features like summary-detailed tables and indexes which aid in performance.
The semantic layers connect the front end BI reports to the backend tables in the database. They use drivers for this connection. For getting good performance, the semantic layers need to use Native drivers corresponding to the respective database instead of ODBC.
Best practices need to be followed in the creation of BI reports too, for getting good performance. Only the required amount of data needs to be brought to the BI report. The filters need to applied such that it gets applied in the SQL SELECT query which hits the database. No unnecessary fields should be pulled into the BI report. There should be no stray and unused formulas and calculations in the BI report. If there are some frequently used calculations, they should be created at the semantic layer level itself so that they can be reused in different BI reports. Wherever possible, the summary reports and detailed reports should be separately created. The option to drill from summary to detailed report should be made available. This
is because the summary reports can be created using the data from the summary tables. Since summary tables have lesser data, they can retrieve data faster. Only when detailed information is needed, the drill feature to get the data from the detailed report can be used.
The usage of specific BI reporting tool for the right purpose is another aspect which needs to be considered to get the required performance. Some BI tools are built for catering to operational reporting requirements where there are big tabular reports with large number of columns and rows. Some other BI tools are designed and built to cater to analytical requirements where few dimensions and measures are used for generating various types of graphs and visualizations. It is seen in many cases that the specific BI tool is not used by the users for the purpose for which it is intended. This leads to performance issues. Also, it is seen in many cases where the business users try to use the BI reporting tools as a front end for extracting huge amounts of data into spreadsheets. This is because the business users are usually comfortable playing with and analyzing data in spreadsheets. This also leads to performance issues since BI reporting tools are not designed to be used as ETL tools. In such cases, the users should be advised to request for ETL extracts of data. The end users need to be sensitized about the right way of using the BI reporting tools.
In cases where budget is not a constraint and high performance of the BI reporting systems is essential, Data warehouse appliances instead of the traditional BI setup can be used. Data warehouse appliances consist of bundled hardware and software which have been highly optimized and tuned and specifically built for data warehousing and analytical applications. Some of the Data warehouse appliance products available in the market are Oracle Exadata, Teradata, IBM Netezza and Pivotal Greenplum Database.Conclusion
The end user experience in terms of performance plays a big role in the adoption and success of the BI reporting system. The BI tool vendors have recognized the importance of
A R T I C L E
www.csi-india.orgu 24 u
C S I C O M M U N I C A T I O N S | N O V E M B E R 2 0 1 6

performance and are providing many features for improving performance. In fact, some of the BI tool vendors design and market their BI products with performance as the unique selling proposition. In addition to the choice of appropriate BI tool, there are other factors too which play an equally important role in the BI application performance. Those factors which we discussed in this article are : the data model design, the usage of the performance improvement features of the database, the BI server configuration and setup, the BI performance monitoring and the best practices usage in BI application development. Having performance as one of the main guiding principles at all the mentioned steps, layers and stages of BI life cycle is bound to result in highly performing and successful BI reporting system and
applications. References [1] https://developer.gooddata.com/
article/optimizing-data-models-for-better-performance
[2] h t t p : / / e r w i n . c o m / c o n t e n t /erworld/2015-presentations/ER05_Howard_Performance_Tuning_Data_Models_-_ERworld_2015.pdf
[3] https://msdn.microsoft.com/en-us/library/cc505841.aspx
[4] https://docs.oracle.com/cd/B10501_01/server.920/a96567/repmview.htm
[5] h t t p : / / w w w. d b a - o r a c l e . c o m / t _garmany_easysql_btree_index.htm
[6] https://en.wikipedia.org/wiki/Bitmap_index
[7] https://docs.oracle.com/cd/B28359_01/server.111/b32024/partition.htm
[8] http://go.sap.com/product/analytics/bi-platform.html
[9] http://www.oracle.com/us/solutions/b u s i n e s s - a n a l y t i c s / b u s i n e s s -inte l l igence/enterpr ise-ed i t ion/
overview/index.html[10] http://www.tableau.com/[11] https://www.qlik.com/us/[12] https://www.sisense.com/glossary/in-
memory-bi/[13] https://f5.com/glossary/load-balancer[14] http://www8.hp.com/in/en/software-
solut ions/sitescope-appl icat ion-monitoring/
[15] Rajesh K V N and Ramesh K V N (2015), “Planning, Deploying and Maintaining Business Intelligence (BI) Reporting Systems”, CSI Communications, Vol. 39, Issue 8, pp 21-24.
[16] Rajesh K V N and Ramesh K V N (2014), “A Brief History of BIDW (Business Intelligence and Data Warehousing)”, CSI Communications, Vol. 38, Issue 6, pp 26-28.
[17] Tableau Server Administrator Guide.[18] Mark Rittman (2013). Oracle Business
Intelligence 11g Developer’s Guide. Tata McGraw Hill Education Private Limited.
n
About the Authors:Mr. K.V.N. Rajesh [CSI-N1236945] is Head of the Department and Senior Assistant Professor in Department of information technology at Vignan’s Institute of Information Technology, Visakhapatnam since 2005. His research interests include Business Intelligence, Location Intelligence and Big Data and he has published papers in the respective areas. He can be reached at [email protected].
Mr. K.V.N. Ramesh is currently working as Project Manager at Tech Mahindra, Visakhapatnam. He has 15 years of experience in IT industry with expertise in the area of Data Warehousing and Business Intelligence. He has worked on UNIX, Oracle, Sybase, Business Objects, OBIEE and Tableau during these years. He can be reached at [email protected].
A R T I C L E
u 25 uC S I C O M M U N I C A T I O N S | N O V E M B E R 2 0 1 6
Important NoticeAs per the Digital India initiative and directives of the Government of India to Go Green, the Executive Committee of Computer Society of India in its last meeting held on July 9-10, 2016 at Chennai, has decided to stop the printing of Hard Copy of the CSI Communications, from January 2017, for all the individual members. The Green India Initiative, which saves both financial and environmental costs and helps save environment, requires that the CSI Communications be made available to the members through electronic means. This necessarily requires that members should ensure updating their latest email addresses immediately. Limited number of hard copies shall be published, for distribution to Authors, Institutional Members and Students’ Branches only, for their Library record. Members, desirous of still receiving the Hard Copies of CSI Communications, are requested to send their special request, for dispatch of Hard Copy of CSI Communications, to [email protected] indicating their CSI membership number.
Such members, who are not receiving the emails of CSI HQ, are also requested to kindly write to [email protected] and get their email ID updated, so as to get the CSI publications and other information regularly on their email-id. CSI will not accept any responsibility for non-receipt of CSI publications or any other information, due to their incorrect email IDs.
Thanking you and looking for your cooperation and support.
Prof. A. K. Nayak, Hony. Secretary

www.csi-india.orgu 26 u
C S I C O M M U N I C A T I O N S | N O V E M B E R 2 0 1 6

u 27 uC S I C O M M U N I C A T I O N S | N O V E M B E R 2 0 1 6

Prognosis on Wheels : Administrative Effort and Scope for Data Science for Cancer TreatmentTowards a better life
Smita Jhajharia*, Seema Verma* and Rajesh Kumar*** Banasthali University, Jaipur ** Malaviya National Institute of Technology, Jaipur
Timely and reliable prognosis of cancer is of utmost importance to control casualties. The rising trend of predictive analytics in healthcare and medical fields offers a promising solution to this problem. However equal cooperation form the administration, medical as well non-medical, is always necessary to augment joint efforts for eradication of an epidemic-like situation from the society. This article describes the efforts taken by the Indian railways to create a convenient channel for ferrying cancer-affected patients from the Southern belts of the state of Punjab and neighboring regions to the Government-run cancer research centre in Bikaner, North-Western Rajasthan. The article describes how the train has improved the lives of the patients by reducing their travel time and in a way helped them recover. The interactions with the patients in the hospital have been reported to summarize their experiences regarding the train journey, the care taken by the hospital staff and the convenience provided by this effort. Lastly, how predictive analytics and machine learning can be used to predict the stage of cancer and estimate survivability has been described. Some statistical analysis based on correlation studies has also been reported to give an idea of the potential of such techniques to empower predictive healthcare analytics.
Introduction Yes, the passenger train
from Abohar to Jodhpur carries approximately 60 to 80 cancer patients on a given night. Popularly christened as the ``Cancer train’’, this passenger express earned its name over the last decade as it has been carrying people affected with cancer daily from Bathinda in Punjab to the Rajasthani city of Bikaner for cheap treatment of the fatal disease. These patients are bound to AcharyaTulsi Regional Cancer Trust and Research Institute in Bikaner, one of India’s Regional Cancer Research Centres and the nearest place where treatment is free and medicines are cheap.
The cancer patients on this train are mainly small farmers from the Malwa Region of Punjab which consists of southern districts like Bathinda, Faridkot, Moga, Muktsar etc. Families here are tussling with life-threatening health problems. The government’s cancer registry programme for
recording the number of diagnosed cases found a cancer prevalence rate of 68 to 115 per 100,000 for males and 92 to 116.5 for females. Accordingly, in the whole Malwa region having a population of about 1.5 crore people, there ought to be 12,000 cancer patients which is a very high number. Surveys have revealed that women are more vulnerable to cancer and among which, the cancers of the uterine and breast are more prevalent. There is definitely an increased prevalence of cancer in the region. Farmers and people native to the region allege that the `modern’ farming practices adopted under the ‘Green revolution’ of the 1960’s and 70’s has affected the soil and consequently the well-being and health in the region [1]. The perception, found to be partly true by research and investigations undertaken, has brought forward an interesting observation that cancer, once thought to be the disease of the urban areas, is now spreading into the
rural landscapes of the country. The average farmer in this region of Punjab is now suffering from impairments in the bone, throat or is found to be diagnosed with Leukaemia or blood cancer. The patients take this train on a night, reach the hospital in the morning, go through the routine medical examinations and other activities and hop onto the train at the day-end to undertake an 8-hour long journey back home. This thus saves a lot of time as the whole day is effectively utilized.
Farmers in the villages of the Malwa region live in a cesspit of toxicity which is a result of excessive and unregulated use of pesticides and chemical fertilizers. Punjab farmers’ use of pesticide is 923 g/ha which is way above the national average of 570 g/ha (grams per hectare). The amount of fertilizers used here is also a sky touching figure of 380 kg/ha which is three times the national average of 131 kg/ha (kilograms per hectare).
A R T I C L E
www.csi-india.orgu 28 u
C S I C O M M U N I C A T I O N S | N O V E M B E R 2 0 1 6

Malwa region is Punjab’s cotton belt which further contributes to health problems as cotton crops are more prone to pests and hence attract more use of pesticides, deemed as part of the `modern farming’ practices. Furthermore, due to lack of skilled handling and proper training, the farmers use at least 13-15 different pesticide sprays out of which only seven are considered as `human-friendly’ by USA’s Environmental Protection Agency [2]. The frequency of spraying them is also not kept to the value recommended one. Although the crop-yield has increased and the lifestyle improved, one wonders whether thus has come at a big price. In fact, the increase in adoption of lifestyle related-habits like alcohol and smoking with improvement in quality of life was also evident and medical researchers are also trying to investigate this as a factor for contraction of cancer. Nevertheless, the journey on the train continues and patients, with whatever be the likely cause of their cancers, keep the faith in the administrative provisions associate with this passenger train and visit the regional centre with hopes of a quick recovery. The cancer train lurches to a stop in Bikaner at 6 A.M. The passengers silently step down the platforms, sleepwalking, as if they are striding forward as an army of de-energized bots and reach their destination, the Acharya Tulsi Regional Cancer Treatment And Research Institute on motorized rickshaws.
There is a huge crowd at one counter to get appointments for their treatment. At another counter, an employee fills out vouchers that will enable the patients to get a compensation with the payment made by the National Railway for taking the journey on the train. Patients along with their attendants are headed right back to station to ride home on THE CANCER TRAIN.
The administrative machinery at the regional cancer center is also well oiled to function at optimal levels. The doctors act as caretakers and properly examine the visiting patients. The medicines are available in the campus at subsidized rates considering the financial status of those diagnosed. The experiences recollected by some of
the patients convey a contrasting story of the other government-run cancer hospitals in the country. Wrongly done diagnosis, non-availability of critical medicines and lethargic attitude of the administrative staff were reported of in their narrations. However the data registry system of the regional centre in Bikaner is a component that can be further improvised. The manual data entry and record keeping can be efficiently augmented by the use of automated data registry system. Furthermore, here comes the interesting prospect for application of data science and engineering. The records of patients who visit the centre for regular treatment and their cycle of examination can be used to extract actionable knowledge. The knowledge will relate to the current stage of the patient and the likely state of health when the next check-up is scheduled. In short, for the cases of those diagnosed with cancer, machine learning algorithms can be used for prognosis of the cancer stages and suggest possible action. Apart from this predictive power capability, for those yet to be tested, the medical records can be used to predict the occurrence of cancer.
Predictive analytics holds immense potential for augmenting and supplementing initiatives like this. The number of trips of the patients can be reduced and the positive results of prognostic analysis can be used to estimate the likely course of treatment and plan the schedule of check-ups and post-surgery examinations. This can be achieved by the use of binomial or multi-class classification algorithms that can identify the likely `class’ or stage of the cancer for example `benign’ or `malignant’ [4]. Regression techniques can be used to predict or perform survival estimation among the diagnosed cases. Lot of research is being pursued at a war footing across the globe. Medical community has opened up and shared critical patient records and medical data, both in form of numeric and images, with the data engineers. Medical image processing is another very interesting and effective technique that can predict the occurrence of cancer or can be used for prognostic analysis.
Taking a leaf from the proposition mentioned above, details of 15 patients were collected and analyzed to find some statistical correlations between various parameters. Continuous parameter like age and various other parameters relating to food habits, family history, stage of cancer etc. that require categorical expressions were recorded. The possible correlations of one important parameter on the other were calculated. The correlation coefficient between age and stage of cancer came out to be -0.212 indicating that age is negatively correlated with the stage of cancer. Thus the stage of a cancer has got nothing to do with the age of a person. The impact of different types of lifestyle related habits with the stage of cancer is important to study and hence was also calculated. Accordingly, to perform this study, dummy categorical variables were assigned to indicate a person’s alcohol consumption, non-vegetarianism and smoking habits. The value 1 meant a `yes’ to all the habits while `0’ meant that a person does not possess all the three habits. The relation of stage of cancer versus alcoholism was indicated by a negative correlation coefficient of -0.8085. Thus this showed the minimal degree of association of alcohol consumption with the development of a cancerous stage and that too in the negative direction. Similar interpretations were made for non-vegetarian dietary habits and smoking versus cancer stages with correlation coefficients of -0.1085 and -0.0933 respectively. From the negative correlation of cancerous stage with alcohol consumption we can that people who do not drink have 0.0808 units less chance of getting this stage of cancer as compared to people who drink. Similarly for no non-vegetarian diet and no smoking, all are coming negatively related which was intuitively expected. Conclusively, data registry automation, record-keeping for feature selection, machine learning and analytics for cancer prediction are the thrust areas where data can lead to knowledge and power the corrective and timely prognosis of this chronic condition alongside the administrative efforts like this.
A R T I C L E
u 29 uC S I C O M M U N I C A T I O N S | N O V E M B E R 2 0 1 6

Acknowledgment The authors would like to
acknowledge the support provided by Dr. Shankar Lal Jakhar in facilitating access to the research centre. The authors also thank the hospital authorities and the patients who were interviewed.References[1] R. Kaur and A.Sinha, “Globalization and
health: a case study of punjab,” Human
Geographies, vol. 5, no. 1, P. 35, 2011.
[2] US-EPA. (2016) Pesticide programs- pesticides [online]. Available: www.epa.gov/ pesticides.
[3] Smita jhajharia, SeemaVerma, and Rajesh Kumar, “Predictive analytics for breast cancer survivability: A comparsion of five predictive models,” in Proceedings of ACM-ICPS the Second International Conference
on Information and Communication Technology for Competitive Strategies, 2016.
[4] Smita jhajharia, SeemaVerma, and Rajesh Kumar, “A cross- platform evaluation of various decision tree algorithms for prognostic analysis of breast cancer data,” in IEEE International Conference on Inventive Computation technologies Aug. 2016.
n
About the Authors:Ms. Smita Jhajharia is Research Scholar at Banasthali University, Jaipur. She is pursuing Ph.D. in Computer Science Engineering in Banasthali Jaipur. She has teaching experience in Academics in Delhi Technological University, Delhi and MBM Government Engineering College, Jodhpur, India. She was part of research projects from SAG, DRDO, Delhi. Her areas of interests are Data analytics, Machine Learning, Prediction Analysis and Data Mining. She can be reached at [email protected].
Dr. Seema Verma is currently working as Associate Professor in the Department of Electronics Engineering at Banasthali Vidyapith, Jaipur. She also serves as the head of the IBM Centre at the University and the accountability manager of the Aviations department of the University. Her research areas include Communication System, Wireless Communication, VLSI Design, MIMO - of DM, Cryptography & Networks Security, Turbo Codes and LDPC Codes.
Dr. Rajesh Kumar [CSI–L150211] is currently working as Associate Professor at Department of Electrical Engineering at MNIT Jaipur. He has been with National University of Singapore as Post Doctorate Research Fellow. He has published more than 300 research articles at peer reviewed International Journal and Conferences more than 60 talks, 9 patents and 2on-going research project. His area of interests includes bio-inspired algorithms, system prediction models, smart power networks, medical assistive systems and data analysis.
A R T I C L E
Glimpses of inauguration of Renovated CSI HQ premises, Seminar on
CSI@2030 on 30 Sept. - 1 Oct. 2016
www.csi-india.orgu 30 u
C S I C O M M U N I C A T I O N S | N O V E M B E R 2 0 1 6

CSI Special Interest Group on Big Data Analytics: Chronicling the onset of a journey
Saumyadipta Pyne Founder Convener and the first Chairman of CSI SIG BDA, IIPH, Hyderabad. Email: [email protected].
There is no doubt that currently the most talked about and intellectually stimulating topic in Computer Science (CS) - and probably across the spectrum of analytical sciences - is Big Data Analytics (BDA). While its potential is being gradually realized in diverse areas of scientific and economic pursuit, it is indeed rare that a complex, technical topic such as BDA could thus capture popular imagination. The aim of this article is primarily to raise awareness among the members of Computer Society of India (CSI) about the activities of CSI Special Interest Group (SIG) in BDA.
Background: The idea to establish a SIG to integrate and mobilize the diverse interests surrounding Big Data (BD) and Analytics occurred to me in 2012 when I was working at the CR Rao Advanced Institute of Mathematics, Statistics and Computer Science (AIMSCS) in Hyderabad. At AIMSCS, I had convened an international conference in December 2013 to celebrate the “International Year of Statistics” in which a special session on BDA featured, over multiple days, a sequence of lectures by global BD experts. Yet, as the 2014-2015 workshop Co-Chair of ‘IEEE Big Data’, the major international BD conference held in the USA, I had observed few high-quality submissions from the subcontinent. I shared my observation with Mr. H.R. Mohan, the then President of CSI, who visited AIMSCS as the Chief Guest of a National Workshop on BDA (BiDA 2014) that I had organized in August 2014. That led to the proposal and the subsequent formation in September 2014 of CSI SIG BDA.
SIG BDA is supported by an Executive Committee (EC) that consists of many distinguished members from the fields of CS and Statistics representing the academia, the industry and the government. The legendary statistician Prof. C.R. Rao graces the EC as its Honorary Chairman. Mr. Gautam Mahapatra of RCI is the Vice Chairman of the EC. It is indeed a privilege for me, as the founder Convener and Chairman of the EC, to note that its current members have, right from the onset, continued to make significant contributions to advances in the field of BDA with important publications and by organizing numerous workshops.
Publications: In 2015, Elsevier published the ‘Handbook of Statistics (vol. 33): Big Data Analytics’ edited by Prof. C.R. Rao, et al. In 2016, Springer published the title, ‘Big Data Analytics: Methods and Applications’, edited by myself along with Prof. B.L.S. Prakasa Rao and Prof. S.B. Rao, also members of the EC. Both volumes contain articles authored by internationally known experts and which describe state-of-the-art in a rapidly emerging field. Presently, under the editorial leadership of EC members Mr. Chandra Sekhar Dasaka (Chief Editor and Publisher) and Mr. Vishnu S. Pendyala (Editor), SIG BDA is about to launch a new digital periodic newsletter, suitably titled ‘Visleshana’, which stands for “analysis”. We strongly encourage the CS community to consider contributing timely and original articles for publication in this upcoming newsletter and help us take it forward.
Workshops: SIG BDA supports as well as organizes both national and international BDA workshops across the country. The first SIG BDA workshop for industry professionals was organized by the EC members Prof. C. Sudhakar and Dr. D.V. Ramana over 3 consecutive weekends in July 2015 at CRRao AIMSCS. Following that success, an impressive array of activities was conducted by the SIG EC members in the years 2014-2016; and likewise, a number of workshops and certificate courses have been planned for the current year. For example, the SIG members organized a BDA tutorial session for the students at the 49th Annual Convention of CSI held in Hyderabad in December 2014. The interested reader is encouraged to visit the SIG BDA homepage for browsing a detailed list of our past and upcoming events [1].
In addition, the SIG members have also provided partnership to BDA workshops held by the wider scientific community in different parts of India. It started with the National Workshop on Financial Data Analytics (FiDA) held in AIMSCS in December 2014. To cite another example, partnership with the Center for Large Scale Data Systems in University of California San Diego, Indian Institute of Public Health (IIPH) Hyderabad and Indian Statistical Institute led to the organization
of the 7th International Workshop on Big Data Benchmarking (WBDB 2015) in New Delhi last December. In his keynote address at WBDB, Prof. Michael Franklin, the Chair of Computer Science Division, University of California Berkeley, discussed the latest in BD software trends emerging from the renowned AMPLab directed by him.
Notably, such associations have continued to enrich our efforts. On December 19, 2016, we will partner with the International Workshop on Foundations of Big Data Computing (BigDF), which will be held in conjunction with IEEE HiPC 2016 conference in Hyderabad [2]. Prof. Geoffrey Fox, Distinguished Professor at Indiana University, will discuss in his keynote address at BigDF the increasingly popular idea of “convergence” of BD and high-performance computing. On December 23, 2016, in association with IIPH and the International Indian Statistical Association (IISA), the International Workshop on Clinical Data Analytics (WCDA) will be held in Hyderabad, in which plenary talks by some of the Presidents of IISA and the pharmaceutical industry leaders will cover cutting edge topics in the field of clinical analytics [3].
The future: Clearly, expansion - welcoming the flow of new people and ideas - is the natural way ahead for SIG BDA. To allow new members into SIG BDA, its membership options will be made available at both the individual as well as institutional levels. Membership criteria and other details will appear soon at the SIG homepage [1]. For the near future, programs focusing on industry requirements such as BDA benchmarking and certification of technical assessment are in the pipeline. While BDA emerges and evolves to be a key area of intellectual pursuit worldwide, the newsletter and webpages of SIG BDA will continue to serve as active forums for lively interaction among the interested members of the CS community while providing them with useful updates on the latest activities in the field.
Stay tuned.
Links:-[1] http://www.csi-sig-bda.org[2] https://sites.google.com/site/hipcbigdf[3] http://www.healthanalytics.co.in/WCDA
u 31 uC S I C O M M U N I C A T I O N S | N O V E M B E R 2 0 1 6

Big Data Processing Techniques & Applications: A Technical Review“You can have data without information, but you cannot have information without data.” – Daniel Keys Moran.
Swati Harinkhere Nishchol Mishra Yogendra P S Maravi Varsha Sharma Research Scholar Assistant Professor Assistant Professor Assistant Professor School of IT, Rajiv Gandhi Proudyogiki Vishwavidyalaya, Bhopal, MP
Big data is a term used for datasets that are very large or complex that customary data processing techniques are insufficient to deal with them. Big Data are datasets which are beyond the power of storage and processing capacity. The huge amount of data is generated from applications like the Internet, Social networks, Bio-informatics, Sensors, Weather forecasting etc. Processing of this huge dataset using database systems is impossible. To process these datasets, mainly two processing techniques are often used; Batch processing techniques and Non-Batch processing techniques. In Batch processing, huge amount of data is collected over a period of time, processed and produces output. Non-Batch processing involves continual input of data and processed in small period of time. With the presence of various documents, literatures and research papers in the field of Big Data, it was found that it is difficult to analyze Big Data generated by various application areas with prevalent processing techniques. In this paper, the suggestions of the most efficient and suitable processing techniques is given to process different types of datasets generated by various application areas, along with the challenges in storing and processing and advantages of analyzing it. Finally comparison is made to suggest the efficient techniques.
1. Introduction“Big Data is high-volume, high-
velocity and/or high-variety information assets that demand cost-effective, innovative forms of information processing that enable enhanced insight, decision making, and process automation [23]”. Big Data is a massive dataset; its size is beyond the power of storage and processing capacity. Data increases exponentially from various application areas. The definition of Big Data is based on the four properties, also termed as dimensions: Volume, Variety, Velocity and Veracity .Volume explains about the size or magnitude of data, variety explains about the number of types of data, velocity explains about the speed of processing of data and veracity explains quality of captured data which can vary significantly.
Big Data is a set of Structured (Meta Data, Tabular Databases etc.), Unstructured (Texts, videos, images, audio etc.) and Semi-Structured (XML,
JSON, Log Files etc.) datasets. It is not feasible to analyze this type of dataset using traditional database system because the challenges with the traditional database systems are: storage, processing, search, analysis, transfer, privacy etc. So, there is a need of some new techniques to be discovered and analyzed, to process this enormous amount of data.
Big Data is being generated by almost every technology around us all the time. It is produced by social and digital process, transmitted by mobile devices and system sensors.
Data increased by 90% in the last 2 to 3 years. Data is generated from various sources: Web, Social networking sites, Sensors, Geographic Information System (GIS), Weather Forecasting, Bio-Informatics, and Medical Science etc. A survey shows, in 2014, data generated every minute was : Facebook users share 2.5 million pieces of content,
3,00,000 tweets on Twitter, 2,20,000 new photos on Instagram, 72 hours of video content on you tube, 200 million messages over the Internet,50,000 apps download son Apple, $80,000 online sales on Amazon etc., these all data are unstructured[1].
Big Data has various applications in the field of Natural Language Processing, Human Behavior Monitoring, GIS, Bio-informatics, Medical Science, Traffic Data Monitoring, Weather Forecasting, Cloud control system, Multimedia, Body Sensor Network and many more. In all these areas, Big Data analysis plays an important role. Big Data can be processed by two processes: Batch processing and Non-Batch processing. 2. Big Data Application Areas
Big Data is generated from various application areas as discussed above. This section discusses about the application areas, how Big Data is generated from particular application,
TECHNICAL TRENDS
www.csi-india.orgu 32 u
C S I C O M M U N I C A T I O N S | N O V E M B E R 2 0 1 6

the benefit to handle Big Data and which processing technique is used to handle it.2.1 Natural Language Processing
(NLP)Natural Language Processing
is the study of designing machines or programs that can understand verbal and written communications. Extracting meaningful information from large volume of unstructured human language is a Big Data problem. The unstructured data like voice call, emails, text messages etc. is increasing exponentially and need to be analyzed accurately, which would lead to more insights and better predictive models.
Hadoop framework [2] is able to solve the NLP problems but Hadoop is a Batch processing technique, so it requires complete input set of each NLP module. It is very difficult or not practical to get complete input set of each NLP module at the starting stage of execution. Apache SPARK which is built on top of Hadoop and is also an extension of Hadoop. It is used to overcome this problem by executing interactive and streamed queries [3]. 2.2 Human Behavior Monitoring
Nowadays, human life is data centric. Emotions and sentiments, relationships and interactions, speech, offline and back-office activities, culture etc. generates huge set of data. By analyzing Big Data of human behavior, it can lead to a detailed insight and precise predictive models [4]. Big Data technology Apache Hadoop is used to process these huge set of data. For better result Stream based processing Storm can be used.2.3 Geographic Information System
(GIS)It is a powerful system, which is
designed for making better decision about location. It includes storing, manipulating, managing, collecting, selecting and sorting of geographical data [5]. Big Data will enable a number of transformative societal applications. Societal applications in the context of understanding climate change, next-generation routing services and disaster response.
Apache Hadoop is able to process this large amount of data using
MapReduce and HDFS. Apache Spark, which has less “Reduce” step, will need to be evaluated with iterative GIS Workloads [6].2.4 Bio-Informatics
Bio-informatics [7] is the study of understanding the molecular mechanism of life on earth by analyzing Genomic information. Genomic information includes genomic sequencing and expressed gene sequencing. Sequencing mechanism has improved these days, which leads the volume of sequence of data being produced to exceed the capabilities of traditional method of database model. Big Data possess a great impact on the bio-informatics field and a researcher in this field faces many difficulties in using biological Big Data to extract valuable information from the data easily thereby enhancing further advancement in the decision-making process related to diverse biological process, diseases and disorders.
A tool Hadoop MapReduce platform, such as BioPig [8] and Crossbow [9] has been developed for sequence analysis.2.5 Medical Science
Data is growing faster than medical science can consume it. The unstructured data generated by medical science is huge (around 80% of the total relevant medical data). From genetic to genomic, internal imaging to motion picture, treatment to life course assessment etc. are all Big Data. There is a need of Big Data technology to capture all the information of every patient. Big Data technique can be used to evaluate data generated from routine care of entire patient.
By statistically analyzing Big Data effectively, it will be beneficial for medical science to easily diagnose and effectively cure the ailments [10]. The easy and efficient analysis of Big Data benefits such as: (i) detection of diseases can be done earlier; (ii) identification of health care deception can be done more quickly. Open source platforms Hadoop, MapReduce is used for Big Data analytics in Medical Science [11].2.6 Traffic Data Monitoring
Traffic Data Monitoring analysis is significant for improving network
resources and user experience. Detecting, diagnosing, fixing network problem, route profiling and capacity planning, congestion management etc. are the applications areas that generate huge amount of data.
The analysis of this huge data will help in enhancing extensibility, easing-out programming, optimizing opportunities and efficiently process the data generated from routers, switches and from the website access logs at fixed interval [12].
Network traffic analysis is done by Apache Hadoop MapReduce framework and Hadoop Pig which is a platform for analyzing large datasets [13].2.7 Weather Forecasting
Human has tried to get a better understanding of weather and forecast. Nowadays, satellite sensors and other resources are used by weather forecasting system to help general people for accurate predictions of weather. The volume of environmental data is increasing exponentially. So, there are needs of efficient Big Data techniques to manage, store and process this data.
The main advantage of Big Data is that it compares separate datasets to obtain associated observations. It enables better risk management to improve performance in the organizations. Companies work with Big Data and predictive analysis parallely to focus on real time forecast using the growing data[14]. Apache Hadoop MapReduce framework is used to analyze huge dataset of weather forecasting [15].2.8 Cloud Control System
The cloud control system manages traffic hosting and delivery, video-streaming services, network traffic monitoring, router log sand alerts etc. It is used to enable small scale teams to set up test environment for development and experimental purpose. Big Data technology to deliver sufficient cost saving and scalability to business [16].
Big Data processing tool Apache Hadoop framework provides the high-performance computing to analyze power needed for huge amount of data efficiently and cost-effectively [17]. 2.9 Multimedia
TECHNICAL TRENDS
u 33 uC S I C O M M U N I C A T I O N S | N O V E M B E R 2 0 1 6

In today’s digital world social networking applications are being used everywhere. They have multiplied fast and their uses have grown exponentially. Multimedia has become one of the largest application area that produces enormous amount of data at faster rate. The multimedia data include audio, video, texts, images, graphic objects, animation sequence etc. The multimedia resources have grown so fast that it has brought the need for Big Data processing technique.
Multimedia Big Data is in-memory processing that is, the data is processed in the memory instead of on hard disks, significantly reducing the processing latency. So, Apache SPARK is used to process Big Data produced by multimedia [18].2.10 Body Sensor Networks
In order to monitor various purposes like vital signs, gait patterns, balance and fall, daily activities etc., or sensing, communicating and processing various physiological parameters, Body Sensor Networks are used. Billions of data stream comes from large scale sensor networks challenges the traditional approach of data management related content capturing techniques.
The benefits to analyze Big Data generated by body sensor networks are; in making energy-aware network protocol and energy gathering techniques. It is also beneficial in data compression, on- node processing, power transceiver etc [19].
Hadoop framework is able to solve the body sensor network problems but for interactive queries Apache SPARK [20] (an extension of Hadoop) is used to overcome this problem by executing interactive and streamed queries.3. Big Data Processing Techniques
The processing of Big Data can be done by two processes: (i) Batch processing, (ii) Non-Batch processing.3.1 Batch processing
In Batch processing, data is collected over a period of time, processed and then produces output. It uses MapReduce framework. MapReduce is a programming model which is used for distributed computing to process Big Data on a cluster of commodity hardware. The execution of
MapReduce is done by two computation stages: Map and Reduce. In Map stage, input is given in to mapper in key/value pair. Map stage produces output also as key/value pair. The intermediate result generated by shuffling and sorting the data is also key/value pair. Reduce stage takes this intermediate key/value pair as input and gives final key/value output [21].3.1.1 Apache Hadoop
Hadoop is an open source framework, used in distributed environment. It is used to process Big Data on a cluster of commodity hardware. It uses two components; MapReduce and HDFS, to store and process Big Data respectively. Its strengths are easy programming model, Non-linear speed-up, and fault-tolerance. 3.2 Non-Batch Processing
Non-Batch processing involves continual input of data and processed in small period of time. The problem with hadoop is that it is inefficient in executing iterative jobs. If the complete input is not available before starting of job execution, then execution with Hadoop becomes inefficient [21]. It can’t execute iterative and streaming input queries. Solutions to this problem is: (i) Real-time Big Data processing, and (ii) Stream-processing. 3.2.1Real-Time Big Data Processing
It is done by the two processes: (A) In-Memory computing, and (B) Real-time queries over Big Data. 3.2.1.1 In-Memory Computing
It is a technique which is used to minimize the computation time of MapReduce. It makes the computation faster and executes the jobs in less than seconds. To store and process Big Data, Distributed memory storage is used in In-Memory computing in two ways- (i) To execute iterative jobs which may have multiple iterations, caching layer for disk-based storages is used. (ii) To handle streaming data generated from independent input source which can totally fit in distributed memory. It can efficiently minimize execution time of jobs. Apache Spark, GridGain, XAP etc. are the frameworks used for in-memory computing.3.2.1.2 Real-Time Queries over Big
DataFor structured, semi-structured
and unstructured data, this new efficient and optimized technique is used for real-time input queries. To respond to queries in less than a second, Real-Time queries over Big Data use procedure storage layouts, aggregation and join techniques from parallel DBMS. Cloudera Impala, Apache Drill, are some solutions based on Real-Time queries over Big Data which are very efficient and faster techniques for real-time input queries.3.2.2 Stream Processing
Stream Processing uses two suitable and prominently used frameworks: (A) Storm, and (B) S4 [22]. Both of them are having unique programming model. They have their own strengths and weaknesses.3.2.2.1 Storm
Spouts and Bolts are the two abstractions by which a program can be defined in the Storm. Spout means a root of stream which can generate data by itself. It can also read data from an input queue. Bolt takes input from one or more input streams, processes them and generates output in the form of a number of output streams. The benefit of Storm is; Programmer gets more capability and freedom to declare the process. The problem to achieve optimum performance with Storm is; the programmers must keep in mind the constraints like load balancing, larger buffer sizes, and parallelism level. Storm is more popular than S4.3.2.2.2 S4
S4 is a basic and simpler programming model than Storm. In S4,Processing Element (PE) of a graph is used to describe a program. It determines a PE per key. It inhibits the programmer in declaring the process but provides clarity, easiness, simplicity and distributed execution more automated.4. Comparative Analysis of Big Data
ApplicationsTable I is a comparative analysis
of Big Data application areas in which for every application area, their corresponding challenges, processing techniques and the advantages are discussed. The challenges (store and
TECHNICAL TRENDS
www.csi-india.orgu 34 u
C S I C O M M U N I C A T I O N S | N O V E M B E R 2 0 1 6

process) let know about processing of data generated by these application areas. The processing technique informs about which technique is used to handle the challenges of that particular application. The advantage field describes the advantages of respective Big Data application.5. Conclusion:
This is the age of Big Data, and almost all applications requires data to
provide services quickly and efficiently. This paper is an effort to identify Big Data application areas and processing techniques in order to get insight on suitable application platforms. The efficient techniques to handle Big Data applications are described to obtain optimum results. Batch processing uses Apache Hadoop, Real-Time processing of Non-Batch processing uses Apache SPARK framework, GridGain, XAP etc.
for in-memory processing and Cloudera Impala, Apache Drill etc. for real-time queries of Big Data. STORM and S4 are the two popular frameworks that are frequently used to process Stream processing of Non-Batch processing. A comparative analysis on various Big Data application areas is presented in previous section, which shows the various application areas, challenges in handling the huge data generated
Table I : Comparative analysis of various Big Data Application areas.
Application Areas
Challenges: Handling the Big Data generated by these Applications
Processing Technique
Advantage
Natural Language Processing
Voice call, emails, text messages is increasing exponentially
Hadoop, Spark
More detailed insight and better predictive model
Human Behavior Monitoring
Emotions and sentiments, Relationships and interactions, Speech, Offline and back-office activities, Culture
Hadoop, Storm
More accurate insights into human behavior
Geographic Information System
Storing, manipulating, managing, collecting, sorting and selection of geographical data
Hadoop, Spark
Understanding climate change, next-generation routing services, and emergency and disaster response
Bio-Informatics Genomic sequencing and expressed gene sequencing
Hadoop Decision-making process related to diverse biological process, diseases and disorders
Medical Science
Genetic to genomic, internal imaging to motion picture, treatment to life course assessment
Hadoop Detection of diseases at earlier stage, quick identification of health care fraud
Traffic Data Monitoring
Detecting Diagnosing, fixing network problem, route profiling and capacity planning, congestion management
Hadoop Enhancing extensibility, easing-out programming, optimizing opportunities and efficiently process the data generated from routers, switches and from the website access logs at fixed interval
Weather Forecasting
Satellite sensors and other resources, volume of environmental data are increasing exponentially
Hadoop Enables better risk management to improve performance in the organizations, focus on real time forecast using the growing data
Cloud Control System
Traffic hosting and delivery, video-streaming services, network traffic monitoring, router log sand alerts
Hadoop Deliver sufficient cost saving and scalable to business
Multimedia Audio, video, texts, images, graphic objects, animation sequence
Spark Development of a whole host of new tools and technologies that can meet the challenge posed by three V’s of Big Data
Body Sensor Networks
Sensing and making communications between various physiological parameters, large scale sensor networks
Hadoop, Spark
Making of energy-aware network protocol, data compression, on- node processing, power transceiver, energy gathering techniques
TECHNICAL TRENDS
u 35 uC S I C O M M U N I C A T I O N S | N O V E M B E R 2 0 1 6

TECHNICAL TRENDS
by these applications, processing techniques to handle Big Data and the advantages of analyzing the data of these applications. Suggestions of most efficient techniques will help the researchers in the field of Big Data to opt better technique to handle data generated by a variety of applications and to achieve optimum results.6. References:[1] Cheikh Kacfah Emani, Nadine
Cullot and Christophe Nicolle “Understandable Big Data: A survey” in Computer Science Review, Volume 17, August 2015, Pages 70–81
[2] Rabkin and R. H. Katz, “How Hadoop Clusters Break,” IEEE Software, vol. 30, pp. 88-94, 2013
[3] Rodrigo Agerri,Xabier Artola, Zuhaitz Beloki, German Rigau, Aitor Soroa“Big Data for Natural Language Processing: A streaming approach“ in Knowledge-Based SystemsVolume 79, May 2015, Pages 36–42.
[4] h t t p : / / w w w. f o r b e s . c o m / s i t e s /martinzwilling/2015/03/24/what-can-big-data-ever-tell-us-about-human-behavior/#1580346f1bed
[5] M. R. Evans, D. Oliver, K. Yang, X. Zhou, S. Shekhar, “Enabling Spatial Big Data via CyberGIS: Challenges and Opportunities,” Ed. S. Wang, M. F. Goodchild, CyberGIS: Fostering a New Wave of Geospatial Innovation and Discovery. Springer, 2014
[6] https://en.wikipedia.org/wiki/Spatial_database
[7] Hirak Kashyap, Hasin Afzal Ahmed, Nazrul Hoque, Swarup Roy and Dhruba Kumar Bhattacharyya “Big Data Analytics in Bio-informatics: A Machine Learning Perspective” in Journal of
LATEX CLASS FILES, vol. 13, no. 9, September 2014
[8] H. Nordberg, K. Bhatia, K. Wang and Z. Wang, “BioPig: a Hadoop-based analytic toolkit for large-scale sequence data,” Bioinformatics, vol. 29, no. 23, pp. 3014–3019, 2013
[9] B. Langmead, M. C. Schatz, J. Lin, M. Pop, and S. L. Salzberg, “Searching for SNPs with cloud computing,” Genome Biol, vol. 10, no. 11, p. R134, 2009
[10] http://www-01.ibm.com/common/ssi/cgi-bin/ssialias?htmlfid=IML14338USEN&appname=skmwww
[11] Raghupathi W, Raghupathi V: Big Data analytics in healthcare: promise and potential. Health Inform Sci Syst. 2014, 2 (1): 3-10.1186/2047-2501-2-3
[12] Anjali P P and BinuA “A Comparative Survey Based on Processing Network Traffic Data Using Hadoop Pig and Typical MapReduce” in International Journal of Computer Science & Engineering Survey (IJCSES) Vol.5, No.1, February 2014.
[13] Y. Lee and Y. Lee, Toward scalable internet traffic measurement and analysis with Hadoop, ACM SIGCOMM Computer Communication Review, vol. 43, no. 1, pp. 5-13, 2012.
[14] Hossein Hassani and Emmanuel Sirimal Silva “Forecasting with Big Data: A Review “in Annals of Data Science March 2015, Volume 2, Issue 1, pp 5-19
[15] Veershetty Dagade, Mahesh Lagali, Supriya Avadhani and Priya Kalekar, Big Data Weather Analytics Using Hadoop, International Journal of Emerging Technology in Computer Science & Electronics (IJETCSE) ISSN: 0976-1353 Volume 14 Issue 2 –APRIL 2015
[16] http://www.intel.com/content/www/us/en/b ig-data /b ig-data-c loud-
technologies-brief.html.[17] D. Zhang, F. Sun, X. Cheng, and C. Liu,
(2011) “Research on hadoop-based enterprise file cloud storage system,” Proc. 3rd International Conference on Awareness Science and Technology (iCAST 11), IEEE Press, pp. 434-437
[18] H. Hu, Y. Wen, T.-S. Chua, and X. Li, ‘‘Towards scalable systems for Big Data analytics: A technology tutorial,’’ IEEE Access, vol. 2, pp. 652–687, 2014
[19] Carmen C. Y. Poon et al, “Body Sensor Networks: In the Era of Big Data and Beyond” in IEEE Reviews in Biomedical Engineering, VOL. 8, 2015
[20] T. Jiang, Q. Zhang, R. Hou, L. Chai, S. A. McKee, Z. Jia, and N. Sun,“Understanding the behavior of in-memory computing workloads,” in Workload Characterization (IISWC), IEEE International Symposium on,2014, pp. 22–30
[21] L. Neumeyer, B. Robbins, A. Nair, and A. Kesari, “S4: Distributed Stream Computing Platform,” in Proceedings of IEEE International Conference on Data Mining Workshops (ICDMW), 2010, pp. 170–177
[22] h t t p s : / / w w w . a t k e a r n e y . c o m /documents/10192/698536/FG-Big-Data-and-the-Creative-Destruction-o f -To d a y s - B u s i n e s s - M o d e l s - 1 .p n g / 0 c 5 1 9 4 6 8 - d e 8 2 - 4 5 c b - a fd e -5d7b431b00b5?t=1358296806758
[23] Gartner, http://www.gartner.com/it-glossary/big-data, accessed on 16-Oct-2016.
[24] http://www.smartinsights.com/social-media-market ing/soc ia l-media-strategy/new-global-social-media-research, accessed on 16-Oct-2016.
n
www.csi-india.orgu 36 u
C S I C O M M U N I C A T I O N S | N O V E M B E R 2 0 1 6
CSI State Convention @ National Institute of Science & Technology (NIST), BerhampurThe CSI student branch - National Institute of Science & Technology (NIST), Berhampur has organized a CSI State Convention on “Cloud and IOT” on 22nd October 2016, where eminent speaker spoke on various important topics currently trending in the industry. Personalities like Prof. Sangram Mudali, Director NIST Berhampur, Prof. Siba Udgata, Director- CMSD University of Hyderabad as chief guest, Mr. Bhawani Nayak, senior associate, CTS Bangalore was the guest of honour, Dr. Brojo Kishore Mishra, Associate Professor (IT), C. V. Raman College of Engineering Bhubaneswar – cum - CSI Regional Student Coordinator and Dr. Diptendu Sinha Roy, Associate Professor, NIT Meghalaya graced us with their presence on the Dias. The Inaugural ceremony meeting
ended with vote of thanks by Dr. K. Hemant Reddy, CSI Student branch counsellor, CSI student branch – NIST Berhampur. More than 130 students participated in the events (like Poster Presentation, ICT quiz & Coding Competition). The results were declared for 3 various categories and prizes were distributed along with participation certificates for every contestant. Finally event came to a glorious end with closing remark by delegates and Prof. Ajit Panda, Dean- NIST Berhampur.
An Insight of Big Data Analytics Using Hadoop
S. Rama Sree and K. Devi PriyaDepartment of CSE, Aditya Engineering College, Surampalem, Surampalem, Andhra Pradesh
The challenges of big data are analysis, storing, visualization etc... Hadoop is a popular tool for analyzing big data. Hadoop is an open source frame work which handles the big data in distributed storage and distributed processing environments. Storing of big data is done using Hadoop Distributed File System (HDFS). Handling of big data can be done using Hadoop’s MapReduce programming approach. However, writing and understanding java map reduce application is difficult and hard to maintain. Hive is a relatively simple tool for analyzing big data. The paper throws light on the concept of Hadoop for handling big data, analyzing of big data using Map reduce and Hive.
I. IntroductionIn the last two years, organizations
[1] created 2.5 Quintilian bytes of data which is 90% of the total data created in the world. This data is what organizations collect on a daily basis. The generated data is huge and in different formats. The term given for such huge data is Big Data.
BIG DATA is a collection of huge amount of data which is identified mainly by 3 characteristics - Volume, Velocity and Variety. Volume is referred as quantity of data generated by social webites, government organizations, industries .Velocity is the speed at which the data is generated. Variety is the format of the data where the data formats of big data may be structured, semi structured or unstructured. The important aspect is gathering of useful information from the generated huge data. Collecting and analyzing Big Data helps organizations for enhanced insight, decision making, and better process automation. Fig1 shows the characteristics of big data. Storing and analyzing big data is not possible using the traditional databases and programming languages. However, storing and analyzing big data effectively is possible using Hadoop.II. HADOOPA. Hadoop
Hadoop [2] is an open-source software framework for storing and processing large scale of data sets
on clusters of commodity machines. Hadoop provides Hadoop Distributed File System (HDFS) for storing huge amounts of data. HDFS, the storage component of Hadoop, is a distributed file system that stores huge data sets in multiple machines. MAP Reduce Processing Unit is used for distributed computation. Hadoop ecosystem contains other tools like Pig, Sqoop, Hive to address particular needs of users in an easy way. Pig is a tool which is used for analyzing data with high level scripting language. Pig enables data workers to write complex data transformations without knowing Java. Pig’s simple SQL-like scripting language is called Pig Latin. Sqoop is a tool intended for efficient transfer of huge data between Hadoop and relational databases. Hive is a tool which is used for analyzing data. The architecture of these tools can be viewed in Fig 1.Hive Sqoop Pig
Map Reduce ProcessingHandoopDistributed File System
Fig. 1: Hadoop and related technologies
The Map Reduce Processing component is a programming approach with a set of mapper and reducer classes to analyze big data. Writing MapReduce programs using Java in Hadoop is tough. Analysing big data is easier using Hive. Hive is a tool for analysing data using Hive Query Language (HiveQL).
B. Comparing traditional databases and HadoopThe following are[3] the main
differences between traditional databases and Hadoop 1. Hadoop uses Scale out instead of
scale up2. Hadoop uses Key/value Pairs
instead of Relational Tables3. Hadoop uses Map Reduce
programming instead of traditional programming.
4. Hadoop supports offline batch processing instead of online transactions
1. Scale up vs Scale outIn this context, Scaling is growing
in infrastructure. The feature of scaling decides how the resources are to be added to the existing infrastructure. Two features of scaling are available - Scale up and Scale out.
Scale up is to add resources to the single node available. Adding of nodes is not possible. The relational databases (RDBMS) is designed for scaling up. Scale out is adding more nodes to the existing system. Hadoop is designed to be a scale out architecture operating on a cluster of commodity machines. 2. Key/value Pairs vs relational
TablesIn a relational model, data is
stored as attributes in the tables. The data of relational model is structured. But modern application has data like text, pictures, videos etc., which is not structured and cannot be stored
PRACTITIONER WORKBENCH
u 37 uC S I C O M M U N I C A T I O N S | N O V E M B E R 2 0 1 6

in RDBMS. In Hadoop, data can be originated in any form but converted into key/value pairs for the processing purpose. Hadoop uses key/value pair format to store the unstructured data in the file system. 3. MapReduce vs traditional
programming The traditional programming
languages have sequential execution of analyzing data. MapReduce has parallel processing of data with a set of mapper, reducer, combiner, partitioner, etc., classes. Hadoop uses MapReduce approach to provide analysis of big data.4. Offline batch processing vs online
transactionsTraditional databases are used for
performing online transactions. The task of performing analysis is difficult using traditional databases. Traditional databases focus on frequent read & write operations. Hadoop is designed for offline processing via read transactions and hence analysis on large datasets is made easy.III. Understanding map reduce
Map Reduce[3-4] is a programming approach of Hadoop which is used for distributed computation. MapReducer splits the work submitted by client into small parallelized map and reduce tasks. The role of the user is to specify a map function which the Mapper Class processes as a key/value pair and generates a set of intermediate key/value output pairs. The Reducer Class then aggregates the intermediate key/value output pairs produced earlier and generates a final key/value output pairs. Hadoop provides a set of API’s (Application programming interfaces) to create Mapper and Reducer classes. Examples of Hadoop API’s are
org.apache.hadoop.ioorg.hadoop.apache.mapredorg.apache.hadoop.io.lib etc.,
A. Mapper classThe mapper class takes input as
a <key, value> pair and the output is <key, value> pair. The possible way of creating mapper class is by extending a predefined class called Mapper with specified input and output formats . The functionality of mapper is defined in the map function. The following program syntax shows how to create user defined
Mapper class in Hadoop environment.public class classname extends
Mapper<InputKeyDataType,InputValue DataType,OutputKeyDataType,OutputValueDatatype>{// starting of mapper class...protected void map (InputKeyDatatype argument,InputvalueDatatype argument)throws Exception{//starting of mapper function//map logic}//ending of mapper function}//ending of mapper classB. Reducer Class
The possible way of creating Reducer class is by extending a predefined class called Reducer with specified input and output formats. The functionality of reducer is defined in the reduce function. The following program shows how to create reducer class in Hadoop environment.
public class classname extends R e d u c e r < I n p u t K e y D a t a T y p e , I n p u t V a l u e D a t a T y p e , OutputKeyDataType,OutputValue Datatype>
{// starting of reducer class….Protected void reduce (InputKey
Datatype argument,Inputvalue Datatype argument) throws Exception
{//starting of reducer function//reduce logic}//ending of reducer function}//ending of reducer class
Table 1: Mapper and Reducer Input/ output Key/ values
Function Input OutputMap <key1,value1> List(<k2,v2>)
reduce <k2,list(v2)> List<k3,v3>
Table 1 indicates the input/output key/values for map and reduce functions. The input to an application is a set of keys and values processed by map function which generates a list of k2 and v2 values. The reducer takes the k2 and v2 values as input, processes them and generates a list of keys and values as an output. The word count application is a best example for understanding map reduce approach.IV. Hive
Hive manages large datasets
residing in distributed storage more easily. Hive is designed for simplifying big data analysis using Hive query language (HiveQL). Hive is similar to SQL but can process large amounts of datasets. The HiveQL provides the following commands that show how to interact with the Hive. � Create Database – A command
which is used for creating own database.
� Drop Database – A command which is used for removing database.
� Create table– A command which is used for creating tables
� Alter table– A command which is used for changing the schema of the tables.
� Drop table – A command which is used for removing table .
A. Examples Using HiveQL1. Creation of Book Rating Table
The following example describes creation of bookrating table with rating id and bookname as attributes with integer and string data types and delimiter between attributes is ‘,’ .create table bookrating (rid int, bookname string) row format delimited fields terminated by ‘,’ stored as textfile;
2. Loading of Data in to HiveThe following example shows how
to load data from rating.txt file in to book rating.Load data local
Inpath ‘rating.txt’ overwrite into table bookrating;3. Insertion of data in to Hive
The following example shows loading of data in to book rating table from book table, It is also possible to copy data from one hive to other hive table.
Insert overwrite table bookrating Select * from book where rid=1;
4. Displaying only first 10 records from bookratingThe following example shows
displaying of fisrt 10 records from book rating table.
Select * from bookrating LIMIT 10;B. JOINS in HIVE
To [5-6] retrieve data from more than one table, hive provides joins concept. The basic concept of joins is to
PRACTITIONER WORKBENCH
www.csi-india.orgu 38 u
C S I C O M M U N I C A T I O N S | N O V E M B E R 2 0 1 6
get the data from more than one table. The following are different types of joins available in the hive.1. Join –The Hive query language
returns only matched record from both table.
2. Left Outer Join—The Hive query language returns all the records from the left table and only matched records from the right table fill the null values for unmatched records of left table.
3. Right Outer Join --The Hive query language returns all the records from the right table and only matched records from the left table and fill the null values for unmatched records of right table.
4. Full Outer Join --The Hive query language returns all the records
from the left and right table and fills in NULL values for missing matches on either side.
V. ConclusionThis paper concentrates on the
use of Hadoop’s MapReduce and Hive tools for analyzing big data. The characteristics of big data are explained in depth. The concepts of Hadoop, HDFS, MapReduce Programming, Pig, Hive, Sqoop are discussed in more detail. The traditional databases are compared with Hadoop and ts advantages are highlighted. The syntax of creation of Mapper classes and Reducer classes is demonstrated. Reduce Programs with syntax is demonstrated. Basing on the disadvantages MapReduce has, Hive was introduced. The commands
for creation and managing tables and the types of Joins in Hive along with few examples are also described. Finally, it can be concluded that, Hive is a simple tool for analyzing compared to MapReduce.VI. References[1] http://www.zettaset.com/index.php/
info-center/what-is-big-data/[2] http://ercoppa.github.
io/HadoopInternals/HadoopArchitectureOverview.html
[3] Hadoop in Action by Chuck Lam dreamtech press
[4] https://hadoop.apache.org/docs/stable/hadoop-mapreduce-client/hadoop-mapreduce-cl ient-core/MapReduceTutorial.html
[5] Hadoop for Dummies by A Wiley Brand[6] https://cwiki.apache.org/confluence/
display/Hive/LanguageManual+Joins
PRACTITIONER WORKBENCH
� Alerts on accessing fake Social media accounts. Fake social media accounts may be made available online. This may help users protecting themselves from criminal minded people who can harm them by sharing or posting their very private data online. To protect general users from these accounts an alert system may be designed which notify them by displaying warning messages against such accounts.
� Using IoT devices in forensic investigation. There are a large number of active IoT devices which are being used for various services. These devices are equipped with sensors and intelligent programs and are trained to perform vital services. These devices may be utilized effectively by equipping them with intelligent programs to identify and criminal cases. Moreover,
these can be used to identify and collect evidences against certain criminal cases.
ConclusionsThe role of big data is presenting new
challenges and opportunities in front of the digital forensic investigators. It stresses upon the requirement of new tools that are well trained to identify, collect, preserve and analyze big data evidences in secured manner. In addition to this the tools should be capable of to prevent the data from tampering to maintain the integrity of the evidences for future use. The new procedures and training personnels are also required by the digital forensics investigators to deal with the challenges presented by big data.
References[1] B. Davis, “How much data we create daily”,
http://goo.gl/a0ImFT, 2013.
[2] Analytics, Big Data. “Big data analytics for security.” (2013).
[3] Zikopoulos, Paul, and Chris Eaton. Understanding big data: Analytics for
[4] enterprise class hadoop and streaming data. McGraw-Hill Osborne Media, 2011.
[5] B. Marr, “Why only one of the 5 vs of big data really matters”, http://goo.gl/azsnse, 2015.
[6] Casey, Eoghan. Digital evidence and computer crime: Forensic science, computers, and the internet. Academic press, 2011.
[7] Mukkamala, Srinivas, and Andrew H. Sung. “Identifying significant features for network forensic analysis using artificial intelligent techniques.” International Journal of digital evidence 1.4 (2003): 1-17.
[8] E. Casay, “Digital Evidences and Computer Crime”, Elsevier Inc., 2011.
[9] A. Guarino. “Digital forensics as a big data challenge.” ISSE 2013 Securing Electronic Business Processes. Springer Fachmedien Wiesbaden, 2013. 197-203. n
About the Authors:Dr. S. Rama Sree [CSI-F8000836] is a Professor in Department of CSE, Vice Principal & CSI Student Branch Counsellor at Aditya Engineering College, AP, India. Her research interests include Software Cost Estimation, Software Reusability & Reliability, Software Prioritization, Software Defect Prediction, and Soft Computing. She can be reached at [email protected].
Mrs. K. Devi Priya [CSI-F8000838] is currently working as Senior Assistant professor in the department of Computer Science and Engineering, Aditya Engineering College, Surampalem, AndhraPradesh. Her research interests include Big Data Analytics, Cloud Computing, Network Security. She can be reached at [email protected]
About the Authors:Dr. Sapna Saxena [CSI-N1270612] is currently working as Associate Professor in Dept. of CSE in Chitkara University, H.P. Her research areas are Parallel and Distributed Computing, Network security, Big Data and Artificial Intelligence. She can be reached at [email protected].
Dr. Neha Kishore is currently working as Associate Professor in Dept. of CSE in Chitkara University, H.P. Her area of research includes Parallel Computing and Information Security. She can be reached at [email protected].
...Contd. from page 20
u 39 uC S I C O M M U N I C A T I O N S | N O V E M B E R 2 0 1 6

www.csi-india.orgu 40 u
C S I C O M M U N I C A T I O N S | N O V E M B E R 2 0 1 6
CLUES
CrossWord Durgesh Kumar Mishra Chairman, CSI Division IV Communications Professor (CSE) and Director Microsoft Innovation Center, Sri Aurobindo Institute of Technology,
Indore.
Test your knowledge on Big DataSolution to the crossword with name of first all correct solution provider(s) will appear in the next issue. Send your answer to CSI Communications at email address [email protected] and cc to [email protected] with subject: Crossword Solution – CSIC November 2016 Issue.
ACROSS3. The Hadoop jobs scheduler6. The memory where Namenode is located7. The data is to be stored in this form in Hadoop9. The framework for job scheduling and cluster
resource management11. Stores actual data in the form of blocks12. It processes structured data into Hadoop14. Splits the data into independent chunks
DOWN1. Achieving coordination between Hadoop node2. It moves Structured data into Hadoop4. It uses 50070 as default port number5. Data intelligence component in hadoop8. It processes Unstructured data into Hadoop10. Enhancing the efficiency of MapReduce13. The default input format in MapReduce15. Supports Multiline commands
We are overwhelmed by the response and solutions received from our enthusiastic readers
Congratulations!All nearby Correct answers to October 2016 month’s crossword received from the
following reader:Bira Sudhakar, Assistant general manager, Vizag Steel Plant, Visakhapatnam
Surendra KR Khatri, Retired from Survey of IndiaDr. Sandhya Arora, Professor, Cummins College of Engineering for Women, Pune
1
2
3
4
5
6
7 8
9
10
11
12
13
14 15
1 U R A 2 C I L 3 A
L L4 C A R C I N O G E N L
N 5 G E N E6 M I 7 T O S I S L
R N 8 P 9 H A G E
I G A10A S P
11T N O L
E N 12M U T 13A T I O N
L O Y U I
O T T D
M A 14C O D O N
E T S
R I 15A P O P T O S I S
A O M16S Y N D R O M E
E
Solution for October 2016 Crossword
BRAIN TEASER
CSI Patna ChapterA one day workshop was organised by CSI Patna Chapter on 13th October 2016 at the Auditorium of Indian Institute of Business Management on the theme “Creativity & Innovation”. The workshop was inaugurated by Prof. A. K. Nayak, National Secretary of CSI and key-note address was presented by Mr. Rohit Singh, Transition Manager, Vodaphone Global services, Bangalore.In his Inaugural address Prof. Nayak pointed that the skills of the creativity & Innovation should be linked with entrepreneur devolvement for the optimal utilization of both the factors. He further said that the outcome of the creativity and innovation shall make somebody able to face the challenges & becomes a risk taker for
establishment of new enterprise which will ultimately contribute towards the great dream of our nation building projects like start up India & make in India. In his key- note Address Mr. Rohit Singh told that the creativity of a person decreases as there is growth in age. He further said that creativity originates the new Idea whereas innovation concerns with
the proper utilization of the Idea in an organisation.The workshop was presided by Prof. M. U. Bokhari, Chairman, Department of Computer & Science, Aligarh Muslim University, U.P. Prof. Ganesh Panday former CSI state student coordinator for Bihar welcomed the guests and Prof. Rajesh Ranjan, Chairman CSI - Patna chapter proposed the vote of thanks.

u 41 uC S I C O M M U N I C A T I O N S | N O V E M B E R 2 0 1 6
F R O M C H A P T E R S & D I V I S I O N S
AHMEDABAD CHAPTER
CSI Ahmedabad chapter organized a technical seminar in association with School of Computer Studies, Ahmedabad University on “Open Source – A powerhouse for Collaboration” on 15th October, 2016. Speaker of the session was Mr. Vishal Mehrotra, Open Source Global Head, TCS, Mumbai. He discussed the ecosystem of Open source, Development model, Cross fertilization between Industry and Academia, Need for such collaboration and various possible collaboration models with innovation at centre point. More than 30 faculty members and industry people attended this event. Dr. Sandeep Vasant, Vice Chairman cum Chairman Elect has coordinated this session. The session ended with the interesting Questions and Answers.
BHOPAL CHAPTER
A 15 days hands on Training Programme on Bioinformatics was organized during October 01st -17th, 2016 sponsored by M.P. Biotechnology Council, Bhopal & Special Interest Group on Bioinformatics of Computer Society of India & Computer Society of India Bhopal Chapter. There were 19 participants from various colleges of Madhya Pradesh. About 45 lectures and 45 labs were conducted during this 15 days training programme. The participants carried out small projects based on this training programme and presented on the last day.
CSI Bhopal chapter, in pursuance of promoting entrepreneurial culture in the university and its affiliated colleges, e-entrepreneurship cell of the university organized
a two-day workshop “Imprenditore” on 30-8-2016 and 01-09-2016. “Imprenditore” event consists of two skill based competitions worth of exciting prizes and entrepreneurs as expert talk cum interactive session with students and audience. This event received a mammoth response with over 800 entries in different categories and over 400 visitors from all across the state. The event was inaugurated by Hon’ble Minister, Technical Education & Skill Development, Shri Deepak Joshi, in the august presence of Organizing Secretary, Vigyan Bharti, Shri Jayant Rao Sahastrabuddhe; Hon’ble Vice Chancellor, RGPV, Prof. Piyush Trivedi; Co-founder and Managing Director, Foodpanda, Mr. Rohit Chadda; Founder and CEO of Internshala, Mr. Sarvesh Agrawal; Bestselling Author, Television Writer, Mr. Arpit Vageria; Founder e-Chai, Mr. Jatin Choudhary; Founder Vidooly, Mr. Subrat Kar; and Founder, Moushiks, Mr. Mohit Jain.On 14th Sept 2016, the e-Entrepreneurship Cell, RGPV and MPPOST, Bhopal jointly organized an enlightening talk on DIGITAL INDIA by Ms. Richa Singh Chitranshi, Languages Head, Asia Pacific Region, Google which was attended by more than 500 students at RGPV Bhopal. She interacted with the students and discussed about the Google Translate Community which has around 1 Billion translations every day. The event was supported by CSI Bhopal chapter and Dr. Shikha Agrawal, CSI State Student coordinator of Madhya Pradesh coordinated the program.
One Day Workshop on Android’ was organized by the Dept. of CS and Engg. Lakshmi Narain College of Technology-Excellence, Bhopal (M.P.) in association with Computer Society of India Bhopal Chapter. This workshop was conducted by Mr. Vijendra Singh Bhadauria, Chief Technology Officer, MI Digital Bhopal (M.P.). The purpose of this workshop was to provide a practical approach of the android so that students should be able to develop android applications software. More 150 students attended this workshop. The workshop was very much appreciated by the students. Dr Shiv Kumar Sahu, HoD of CSE was also present in the program.
CHENNAI CHAPTER
CSI Chennai Chapter organised a presentation on “Excellence through Innovation” on 6th Oct 2016. Mr. H.R. Mohan, Past President - CSI welcomed the gathering and briefed on the need to be creative and innovative to survive and excel in the competitive business environment. Mr. T.R. Vasudeva Rao,

www.csi-india.orgu 42 u
C S I C O M M U N I C A T I O N S | N O V E M B E R 2 0 1 6
F R O M C H A P T E R S & D I V I S I O N S
Vice Chairman, CSI Chennai formally introduced the speaker Dr. Rekha Shetty, MD of Farstar Distribution Network Ltd. Her presentation objectives included: Innovating happily and creating a profitable organization; new approach to create a higher Happiness Quotient; developing a written plan for happy, productive organization; learn the art and science of improving your Happiness Quotient and creating an epidemic of happiness in your organization by improving the Happiness Quotient in both personal and official life. This program was lively, interactive, effective and extremely enjoyed by over 65 participants who had attended the programme. Mr. Sakthivel, proposed the vote of thanks and Mr. H.R. Mohan, Chair presented a memento to the speaker.
Chennai Chapter of CSI organised a presentation on “Trends in retailing in the digital era” on 19th Sept. 2016. Mr. H. R. Mohan, Past President - CSI welcomed the gathering and briefed on the growth of online retail and how ICT is critical in the e-Commerce business. Mr. S. Sundaresh, Chairman, IEEE Technology and Engineering Management Society formally introduced the speaker Mr. V. Rajesh, Retail and Shopper Behaviour. Mr. Sakthivel, Chair, IEEE Computer Society proposed the vote of thanks and Mr. N. Ramanathan, Former Director (Education), CSI presented a memento to the speaker.
HARIDWAR CHAPTER
A workshop on IOT(Internet of Things) was held at FET, GKV on 20th Oct 2016, in collaboration of CSI, Haridwar Chapter. The event witnessed a huge gathering of more than 80 participants from FET and from COER, Roorkee. Invited guest Mr. Mani Madhukar, IBM India elaborated the concept of IOT with the help of audio visual aids and presented a live demo of the internetworking of the IOT enabled sensor with mobile app. The program was inaugurated in the presence of Prof. Vinod kumar, Registrar GKV, Prof. K. Bhatia, Head and Dean Faculty of Technology, Dr. Sunil Panwar, Dean, Faculty of Engineering and Technology, Dr. Mayank Aggarwal, Vice-Chairman, CSI Haridwar Chapter.
This program was co-ordinated and organized by Mr. Nishant Kumar, Secretary CSI Haridwar Chapter and Mr. Suyash Bhardwaj, Organizing secretary of the event.
KOLKATA CHAPTER
Sixth Lecture of Lecture Series was held on 03.09.2016 at 4.30 pm in the CSI Kolkata Chapter office. Mr. Kabin Basu Mallick, Vice President – SI, ATOS India delivered an expert lecture on “Automation and Robotics Implementation of IT Services”.
The members of CSI Kolkata are extending their efforts to increase the visibility of CSI. In line of this RVP Region II Mr. D. P. Sinha, and Chairman CSI Kolkata Chapter Prof. J. K. Mandal interacted with students of Techno India, Salt Lake and Mr. Subimal Kundu and RSC Dr. Somnath Mukhopadhyay interacted with the Faculty and students of B. Poddar Institute of Technology, Kolkata on 10th of September 2016.
On 26th September, 2016 an interactive session was organized where 128+ students and 5 teachers of Techno India College of Technology, Rajarhat, Kolkata attended the meet. The meet was organised at the initiative of Dr. R. T. Goswami, Ex-Chairman of CSI, Kolkata Chapter and presently Director of the college. The gathering was addressed by Mr. Subir Lahiri, Vice-Chairman, CSI-KC and Subimal Kundu.
MYSURU CHAPTER
On 24th Sept. 2016, one day workshop on “Bluemix” was

u 43 uC S I C O M M U N I C A T I O N S | N O V E M B E R 2 0 1 6
arranged by CS Division in association with Cloud Lab NIE, NCS Bangalore, IBM and CSI-Mysuru Chapter where more than 70 participants had assembled for an awareness program on Cloud Offerings by IBM and Services provided IBM Bluemix for fast application development on the cloud. UG,PG students and people from Industry attended the workshop and graced the occasion. All the sessions were handled by experts from IBM, Bangalore.
NASHIK CHAPTER
CSI Nashik Chapter organized a program on Salesforce - The no.1 Customer Success Platform on 30th September, 2016 powered by Aress Software and Education Technologies Pvt. Ltd at Express Inn, Nashik. Mr. Diwakar Yawalkar, Chairman CSI Nashik welcomed guest and participants.
Program started with presentation of Mr. Sarang Ohol, Account Director Small and Medium Market on ‘Age of Customer Success Platform’. Mr. Sumanta Mukherjee Sr. V. President Salesforce Practice Head Aress Software conducted session on ‘Power of Salesforce CRM Demo’. After this session Mrs.Vrushali Udayshankar, Director Operations Aress Software has delivered session on ‘Salesforce Capability’. Mr. Rahul Malhotra Founder and CEO Aress Software and Mr. Soumil Chitnis, Associate Director, Aress Software were present during program.
During Q & A session Aress Software and Salesforce team addressed participant’s questions. The program attended by CEO, IT/EUC individuals, C-level strategists, CIO, CISO and IT Heads from various organizations. This program was chaired by Mr. Milind Rakibe, Past Chairman, CSI Nashik and Co-ordinated by Prof. Bhakti Nandurdikar, Guru Gobind Singh Polytechnic College, Nashik.
UJJAIN CHAPTER
A meeting of CSI Ujjain chapter was held in School of Engg. and Technology, Vikram university, Ujjain on 30-09-2016. It was decided to organize a public awareness program on applications of IOT in society and its instrumental role in making city a ‘smart city’. It was planned to train the students of Schools and Engineering Colleges, faculty members and professionals in IOT as well as to conduct a national conference on IOT in Ujjain next year.
Prof. V. Saxena and Prof. Y. Kelkar gave an account of past and recent activities of Ujjain chapter. Dr. V. Bansod, Dr. U. K. Singh, Shri Aditya Vashistha, Dr. J. N. Vyas, Shri V. M. Shah, Shri Gola (Gail), Shri Vanwasi and Shri. Gangane also expressed their views and gave very fruitful suggestions. Dr. D. S. Yadav presented a copy of his recent book on “GIS in Simhastha” to CSI Ujjain chapter. Prof. D. Kelkar presented the vote of thanks.
VADODARA CHAPTER
The second Technical Lecture of the year 2016-2017 has been successfully completed by CSI Vadodara Chapter on the topic “Internet of Things” (IoT) by Dr. Vijay K. Shah, Vice President, ABB India on Friday, 14th October 2016, at 6.30 p.m. at Department of Computer Science and Engineering, The Maharaja Sayajirao University of Baroda. The topic was discussed at length by Dr. V. K. Shah beginning with very interesting examples like Blind men’s perception of an Elephant and compared it with Perception of IoT, explaining that it is a very diversified field. He then defined IoT, its purpose and significance. Topic of the Lecture was very well appreciated which was apparent from the Houseful auditorium and it was approved further by variety of large number of queries that the audience enquired with.
VELLORE CHAPTER
CSI Vellore Chapter in association with School of Information Technology organized a one day Workshop on “Software Craftsmanship” on 14/10/2016 at VIT University. Mr. Vinay Krishna, Technical/DevApp Consultant, Bengaluru, explained introduction to software engineering, coding style and testing and live demo with software tool kata. Dr. Aswini Kumar Cheruluri, Dean (SITE) inaugurated the workshop emphasizing on role of software in different verticals, around 120 members participated in the workshop. Event was organized by Prof. G. Jagaddesh, Prof. B. Valarmathi, Prof. J. Prabhu and Prof. K. Govinda, RVP VII.
F R O M C H A P T E R S & D I V I S I O N S

www.csi-india.orgu 44 u
C S I C O M M U N I C A T I O N S | N O V E M B E R 2 0 1 6
CSI Vellore Chapter in association with School of Information Technology organized a one day Guest Lecturer on “ICT Research Methodologies & Best Practices” on 20/10/2016 at VIT University. Dr. D. Janakiram, Professor-CSE of IIT Madras, explained introduction to research methodologies, importance of different phases of research and how student can do good research using ICT tools and techniques. Dr. Aswini Kumar Cheruluri, Dean (SITE) inaugurated the guest lecturer, around 60 members participated in the workshop. Event was organized by Prof. G.Jagaddesh, Prof. H .R. Viswakarma and Prof. K. Govinda, RVP VII.
CSI Vellore Chapter and School of Computing Science and Engineering (SCOPE) organized a one day Seminar on “How to Write Research Article ” on 20/10/2016 at VIT University. Mr. Aninda Bose, Senior Editor, Springer India Pvt. Ltd, New Delhi, gave introduction to Springer publishing company, ways to identify quality research, how to publish, publishing cycle and making network with research group, around 90 members participated in the seminar. Event was organized by Prof. R. Rajkumar, Prof. A. Nagaraja Rao and Prof. K. Govinda, RVP VII.
VISAKHAPATNAM CHAPTER
CSI, Visakhapatnam Chapter successfully organized a 2 days’ Workshop on Web Content Management using FOSS (Free and Open Source Software). The workshop was conducted in the state-of-the-art Computer Lab of College of Engg., Andhra University, Visakhapatnam on Sept. 24th & 25th, 2016.There was as overwhelming response to the workshop. Students and professors from various Engineering Institutes across Andhra Pradesh and professionals from various prominent industries attended the workshop. Prof. P S Avadhani, Principal, AU College of Engg, inaugurated the
program in the presence of Sri KVSS Rajeswara Rao, GM (IT & ERP), Vizag Steel and Vice-Chairman, CSI-Vizag and Sri Suman Das, HOD (IT), Vizag Steel. Prof Avadhani emphasized on the usage of Indian talent for shaping India’s tomorrow and the role of such workshop in honing the skills of the youth.Anindya Paul, Secretary, CSI, Vizag welcomed the participants and explained the primary objective of this event which was to provide an insight into how to develop a website and manage the web content using Free and Open Source Software like Drupal.Mr. S S Choudhary, AGM (IT), VSP, a highly experienced IT Professional, conducted the workshop. He was ably assisted by Sri Abhijeet, DM (IT), VSP and Mrs. Sriya, AM (IT), VSP. At the end of the workshop, the Certificates were handed over by Mr. KVSS Rajeswara Rao, Vice-Chairman, CS, Vizag and GM (IT & ERP), VSP to the participants.
DIVISON - 1
The two day “National Conference on Recent Trends and Technologies in Data Science and Artificial Intelligence” organized by the Dept. of CS&IT, Bhaderwah Campus, University of Jammu came to an end on 27th August with the conclusion of the Valedictory session held in the Lal Ded Auditorium. The Chief Guest, Prof. R. D. Sharma Vice Chancellor of the University of Jammu commended the efforts of the Rector, Prof G.M. Bhat and the Organising Secretary Jatinder Manhas in successfully organizing the conference which drew researchers from all over the country to Bhaderwah.The Keynote speaker was Prof Praveena Chaturvedi of Gurukul Kangri University, Hardwar who spoke on Mobile Agents. The Best Paper Awards of the three sessions were given to Ms. Anjana Sharma Asst. Prof. GGM Science College, Jammu, Dr. Lalit Goyal, DAV College Jalandhar and Mr Abid Sarwar, Research Scholar, Department of CS&IT, University of Jammu, The proceeding were conducted by Mr. Saurabh Shastri, Asst. Professor, Bhaderwah Campus, University of Jammu. Earlier during the day, the third session of the Conference held in the Kailash Conference Hall started with an invited talk delivered by Dr. Amit Verma, Panjab University Chandigarh on Artificial Intelligence and Facial recognition. This was followed by a series of paper presentations after which there was a question and answer session.Other faculty members present were Prof Vinod Sharma, Prof. Lalitsen Sharma, Prof Pawanesh Abrol, Dr. Jasbir Singh of Department of Computer Sciences and IT, Bhaderwah Campus, University of Jammu as well as Prof. Dipankar Sengupta of the Dept. of Economics, University of Jammu who coordinated the Conference.
F R O M C H A P T E R S & D I V I S I O N S

u 45 uC S I C O M M U N I C A T I O N S | N O V E M B E R 2 0 1 6
F R O M S T U D E N T B R A N C H E S
REGION-II T S Engineering College, Greater Noida Dronacharya Group of Institutions, Greater Noida
9-9-2016 - Mr. Devender Khari handling the Workshop on Android Application Development
24-9-2016 – Mr. Shiv Kumar, RVP during CSI State Student Convention (UP State) - The Guard of Today’s Digitalization
Region-IIIG H Patel College of Engg. & Tech., Vallabh Vidyanagar Mody University of Science & Technology, Lakshmangarh
4 & 5-10-2016 - National Conference on Recent Advances in Computer Science & Technology
29-9-2016 to 1-10-2016 - Three days workshop on C Language
The LNM Institute of Information Technology, Jaipur
4-10-2016 – Guest Lecture on Introduction to Linux 5 & 6-10-2016 - Workshop on R ProgrammingAcropolis Institute of Technology & Research, Indore
22-8-2016 to 9-9-2016 - Three weeks workshop on C Programming
15-9-2016 – One day workshop on Hardware & Networking

www.csi-india.orgu 46 u
C S I C O M M U N I C A T I O N S | N O V E M B E R 2 0 1 6
REGION-III REGION-IV
Jaypee University of Engineering & Technology, Guna Indira Gandhi Institute of Technology, Sarang
28-9-2016 to 30-9-2016 – Workshop on C Programming 27 & 28-9-2016 - Two days National Conference on Next Generation Computing and its Application in Sc. & Tech.(NGCAST-2016)
REGION-V
Anurag Group of Institutions, Hyderabad
28 & 29-9-2016 - Two days workshop on Internet of Things 10-10-2016 - One day workshop on Internet of Things
Vasavi College of Engineering (Autonomous), Hyderabad CVR College of Engineering, Hyderabad
26 & 27-9-2016 – Two days Android Workshop 9 & 10-9-2016 –Two days workshop on Ethical hacking
NBKR Institute of Science And Technology, Nellore
19-9-2016 – Distributing certificates to the winners during Technical Quiz
23-9-2016 - Motivation Session on What’s Next After B Tech
F R O M S T U D E N T B R A N C H E S
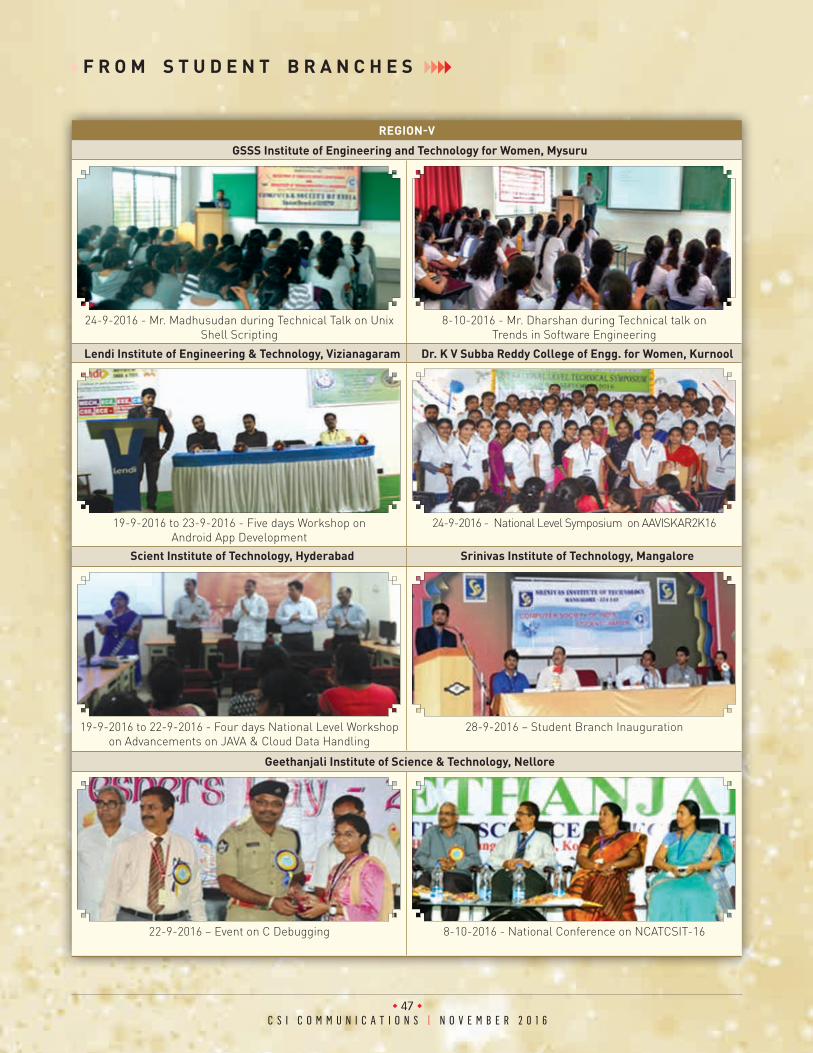
u 47 uC S I C O M M U N I C A T I O N S | N O V E M B E R 2 0 1 6
REGION-VGSSS Institute of Engineering and Technology for Women, Mysuru
24-9-2016 - Mr. Madhusudan during Technical Talk on Unix Shell Scripting
8-10-2016 - Mr. Dharshan during Technical talk on Trends in Software Engineering
Lendi Institute of Engineering & Technology, Vizianagaram Dr. K V Subba Reddy College of Engg. for Women, Kurnool
19-9-2016 to 23-9-2016 - Five days Workshop on Android App Development
24-9-2016 - National Level Symposium on AAVISKAR2K16
Scient Institute of Technology, Hyderabad Srinivas Institute of Technology, Mangalore
19-9-2016 to 22-9-2016 - Four days National Level Workshop on Advancements on JAVA & Cloud Data Handling
28-9-2016 – Student Branch Inauguration
Geethanjali Institute of Science & Technology, Nellore
22-9-2016 – Event on C Debugging 8-10-2016 - National Conference on NCATCSIT-16
F R O M S T U D E N T B R A N C H E S

www.csi-india.orgu 48 u
C S I C O M M U N I C A T I O N S | N O V E M B E R 2 0 1 6
REGION-VRISE Krishna Sai Prakasam Group of Institutions, Ongole ATME College of Engineering, Mysuru
23 & 24-9-2016 - Technical symposium and magazine inauguration
3-10-2016 - Quiz and Blind coding during Engineers day
Gudlavalleru Engineering College, Gudlavalleru
15-9-2016 - Paper Contest during Engineers Day 23 & 24-9-2016 - Two days Workshop on Internet of Things Chalapathi institute of Engg. and Tech., Guntur Bharat Institute of Engineering and Technology, Hyderabad
30-9-2016 & 1-10-2016 – Two days Faculty Development Program on Ubuntu Essentials
5-10-2016 – Student Branch Inauguration
REGION-V REGION-VIKKR & KSR Institute of Technology & Sciences, Guntur ATSS’s Institute of Industrial and Computer Management
and Research (IICMR), Nigdi
28-9-2016 – Prof. Thrimurthy, Fellow & Past President delivering the Guest Lecture on Employability Skills
24-9-2016 - Mr. Anup Thapliyal giving away the prizes to the winners during TechnoCase 2016
F R O M S T U D E N T B R A N C H E S

u 49 uC S I C O M M U N I C A T I O N S | N O V E M B E R 2 0 1 6
REGION-VIPillai HOC College of Engineering & Technology, Rasayani MKSSS’s Cummins College of Engineering, Pune
20-8-2016 – Inauguration of Student Branch and Seminar on Project Based Learning
7-9-2016 - Guest Lecture on: Cyber Security
REGION-VI REGION-VIIK K Wagh Institute of Engg. Education & Research, Nashik Adhiyamaan College of Engineering, Hosur
17-9-2016 - Mr. Chandrashekhar delivering Expert Talk on Storage System
22 & 23-9-2016 - National Workshop on Mobile Application Development
REGION-VIIEinstein College of Engineering, Tirunelveli Sathyabama University, Chennai
26-9-2016 – Dr. Velayutham, Prof. Ezhilvanan, Mr. Velmurugan & Dr. Ramar during Motivational talk
28-9-2016 – Mr. Kathiresan delivering Motivational talk to create awareness about CSI
SRM Valliammai Engineering College, Kattankulathur SRM Valliammai Engineering College, Kattankulathur
14-7-2016 to 2-8-2016 - 15 days Value Added Course on Java Programming Concepts
1-10-2016 - One day National Level Technical Symposium XploITs2K16 & Colosium’16
F R O M S T U D E N T B R A N C H E S

www.csi-india.orgu 50 u
C S I C O M M U N I C A T I O N S | N O V E M B E R 2 0 1 6
REGION-VIIKarunya University, Coimbatore National Engineering College, Kovilpatti
31-8-2016 – Dr. Xavier, Officiating Vice Chancellor is addressing the gathering during CSI event on Invenio
29-8-2016 to 31-8-2016 - Short term training program on After Effects
Jamal Mohamed College, Tiruchirappalli Report Submission
2 & 3-9-2016 - International Workshop on Image Restoration Techniques with MATLAB
F R O M S T U D E N T B R A N C H E S
Visit by Dr. Anirban Basu, President-CSI to CSI Mysore and CSI Nagpur Chapters
President Dr. Anirban Basu visited CSI Mysore Chapter of August 27 and had a fruitful interaction with the members. Mysore has lot of potential and Members were requested to use the resources available for organizing an International Conference and increase membership. Chairman Dr. Rampur Srinath, Hony. Secretary Ms. Aruna Devi, Past Chairmen Dr. A. M. Sudhakar, Dr. Virendra Kumar, SSC Ms. Suman and other were present.
On October 15, President Dr. Anirban Basu visited Nagpur and interacted with Members of Nagpur Chapter in the Computer Science Department of VNIT in presence of Prof. N. S. Chaudhari, Director, VNIT and Chairman, CSI Nagpur Chapter, Dr. Manali, Vice Chairman, Hony. Secretary Dr. Deepti and others and clarified some of their questions on how a Chapter can perform more effectively.
CSI Adhyayana tri-monthly publication for students
Articles are invited for Oct-Dec. 2016 issue of CSI Adhyayan from student members authored as original text. Plagiarism is strictly prohibited. Besides, the other contents of the magazine shall be Cross word, Brain Teaser, Programming Tips, News Items related to IT etc.Please note that CSI Adhyayan is a magazine for student members at large and not a research journal for publishing full-fl edged research papers. Therefore, we expect articles should be written for the Bachelor and Master level students of Computer Science and IT and other related areas. Include a brief biography of Four to Five lines, indicating CSI Membership no., and for each author a high resolution photograph.Please send your article to [email protected] any kind of information, contact may be made to Prof. Vipin Tyagi via email id [email protected] behalf of CSI Publication CommitteeProf. A. K. Nayak, Chief Editor
Student branches are requested to send their report to [email protected] with a copy to [email protected].
Chapters are requested to send their activity report to [email protected].
Kindly send high resolution photograph with the report.Contact Prof. Vipin Tyagi, Editor – CSI Communications at [email protected] for any query.

u 51 uC S I C O M M U N I C A T I O N S | N O V E M B E R 2 0 1 6
Sanjay Mohapatra, Vice President, CSI & Chairman, Conf. Committee, Email: [email protected]
Date Event Details & Contact Information
NOVEMBER17-19, 2016
Interntional Symposium on Acoustics for Engineering Applications : Acoustics for Quality Improvement in Life at KIIT, Gurgaon http://www.nsa2016india.org/ Contact: Prof. (Dr.) S. S. Agrawal, Chairman, OC – NSA-2016, Director General KIIT Group of Colleges, Gurgaon Formerly: Emeritus Scientist CEERI/CSIR,Advisor CDAC-Noida. Email: [email protected]
18-20, 2016 2nd International Conference on Communication Control and Intelligent Systems, at GLA University, Mathura . www.gla.ac.in/ccis2016 Contact: [email protected]
22-25, 2016 Special session on “Smart and Ubiquitous Computing for Vehicle Navigation Systems” at IEEE TENCON 2016, Marina Bay Sands, Singapore (http://site.tencon2016.focalevents.sg/)Contact : Dr. P.K. Gupta [email protected], Prof. Dr. S. K. Singh [email protected]
DECEMBER07-09, 2016
National Symposium on “Recent Advances in Remote Sensing and GIS with Special Emphasis on Mountain Ecosystems” and their Annual Conventions at Dehradun. www.isrs2016.iirs.gov.inContact: Dr. S. K. Srivastav, Organising Secretary & Group Head, RSGG, Indian Institute of Remote Sensing, Indian Space Research Organisation, Department of Space, Government of India, Dehradun, India - 248 001. email : [email protected]
08-10, 2016 CSI Annual Convention (CSI-2016): Theme: Digital Connectivity - Social Impact; Organized by CSI Coimbatore Chapter; Pre-Conference Tutorial on 7th Dec. 2016 Venue: Hotel Le Meridien, CoimbatoreContact : Dr. Ranga Rajagopal, Convener, 9442631004 [email protected]
CeBIT INDIA 2016 – Global Event for Digital Business in association with CSI Venue: BIEC, Bengaluru www.cebit-india.com Contact : Mohammed Farooq, [email protected], +91 9004691833
12-13, 2016 ICICT 2016 - Second International Congress on Information and Communication Technology in concurrent with APETA 2016 - Asia Pacific Education & Technology Summit and Awards. Supported by : CSI Division IV, VAt Bangkok, Thailand http://www.icict2016.org/ Contact: Dr. Aditya Patel, [email protected]
16-17, 2016 National Conference on Innovative Technologies in Big Data, Cloud, Mobile and Security (ITBCMS-2016) at Bharat Institute of Engineering and Technology (BIET), Hyderabad http://biet.ac.in/2016-08-19-03-54-51 Contact : [email protected] Cell Numbers: 9440793154, 9866628493
17-18, 2016 National Conference on Computer Security, Image Processing, Graphics, Mobility and Analytics , Organized by Department of CSE at CMR Technical Campus, Hyderabad in association with DIV – 5 Education & Research, CSI India, http://www.cmrtc.ac.in/nccsigma Contact : N. Bhaskar, 8464925680
JANUARY13-14, 2017
CSI MP State Level Student Convention, Venue : Gyan Ganga Institute of Technology And Sciences, JabalpurContact : Dr Santosh Vishwakarma, Email : [email protected]
20-21, 2017 CSI State Level Student Convention - Gujarat - Region 3, Theme : Digital India, www.aesics.ac.inContact : Dr. Aditya Patel, [email protected]
FEBRUARY11-12, 2017
Kovai Techathon 2017 by CSI Coimbatore Chapter along with TiE Coimbatore, GRDCS & KovaiTechstart,http://www.kovaitechstart.com/techathon/ Email : [email protected] • Phone : +91 96292-00022
15-16, 2017 WS4 - 2017 - World Conference on Smart Trends in Systems Security and Sustainability Supported by: CSI Division IV, V at London, United Kingdom http://www.worlds4.org/Contact : Amit Joshi, [email protected]
MARCH01-03, 2017
INDIACOM 2017, Organized by Bharati Vidyapeeth’s Institute of Computer Applications and Management (BVICAM), New Delhi http://bvicam.ac.in/indiacom/Contact : Prof. M. N. Hoda, [email protected], [email protected], Tel.: 011-25275055
24-25, 2017 First International Conference on “Computational Intelligence, Communications, and Business Analytics (CICBA - 2017)” at Calcutta Business School, Kolkata, India. Contact: [email protected]; (M) 94754 13463 / (O) 033 24205209
APRIL15-16, 2017
1st International Conference on Smart Systems, Innovations & Computing (SSIC-2017) at Manipal University Jaipur, Jaipur, Rajasthan. http://www.ssic2017.comContact : Mr. Ankit Mundra, Mob.: 9667604115, [email protected]
MAY08-10, 2017
ICSE 2017 - International Conference on Soft Computing in Engineering, Organized by : JECRC, Jaipur, www.icsc2017.com Contact : Prof. K. S. Raghuwanshi, [email protected], Mobile : 9166016670
OCTOBER28-29, 2017
International conference on Data Engineering and Applications-2017 (IDEA-17) at Bhopal (M.P.),http://www.ideaconference.in Contact : [email protected]
C S I C A L E N D A R 2 0 1 6 - 1 7

Registered with Registrar of News Papers for India - RNI 31668/1978 If undelivered return to : Regd. No. MCN/222/20l5-2017 Samruddhi Venture Park, Unit No.3, Posting Date: 10 & 11 every month. Posted at Patrika Channel Mumbai-I 4th floor, MIDC, Andheri (E). Mumbai-400 093 Date of Publication: 10th of every month