Embed Size (px)
Citation preview
Cancer & Metabolism
Brahimi-Horn et al. Cancer & Metabolism (2015) 3:8 DOI 10.1186/s40170-015-0133-5
RESEARCH Open Access
Knockout of Vdac1 activates hypoxia-inducible factor through reactive oxygen speciesgeneration and induces tumor growth by promotingmetabolic reprogramming and inflammationM. Christiane Brahimi-Horn1†, Sandy Giuliano1†, Estelle Saland2, Sandra Lacas-Gervais3, Tatiana Sheiko4,Joffrey Pelletier1, Isabelle Bourget5, Frédéric Bost6, Chloé Féral5, Etienne Boulter5, Michel Tauc7, Mircea Ivan8,Barbara Garmy-Susini9, Alexandra Popa10, Bernard Mari10, Jean-Emmanuel Sarry2, William J. Craigen4,Jacques Pouysségur1,11 and Nathalie M. Mazure1*
Abstract
Background: Mitochondria are more than just the powerhouse of cells; they dictate if a cell dies or survives.Mitochondria are dynamic organelles that constantly undergo fusion and fission in response to environmentalconditions. We showed previously that mitochondria of cells in a low oxygen environment (hypoxia) hyperfuse toform enlarged or highly interconnected networks with enhanced metabolic efficacy and resistance to apoptosis.Modifications to the appearance and metabolic capacity of mitochondria have been reported in cancer. However,the precise mechanisms regulating mitochondrial dynamics and metabolism in cancer are unknown. Since hypoxiaplays a role in the generation of these abnormal mitochondria, we questioned if it modulates mitochondrialfunction. The mitochondrial outer-membrane voltage-dependent anion channel 1 (VDAC1) is at center stage inregulating metabolism and apoptosis. We demonstrated previously that VDAC1 was post-translationally C-terminalcleaved not only in various hypoxic cancer cells but also in tumor tissues of patients with lung adenocarcinomas.Cells with enlarged mitochondria and cleaved VDAC1 were also more resistant to chemotherapy-stimulated celldeath than normoxic cancer cells.
Results: Transcriptome analysis of mouse embryonic fibroblasts (MEF) knocked out for Vdac1 highlighted alterationsin not only cancer and inflammatory pathways but also in the activation of the hypoxia-inducible factor-1 (HIF-1)signaling pathway in normoxia. HIF-1α was stable in normoxia due to accumulation of reactive oxygen species(ROS), which decreased respiration and glycolysis and maintained basal apoptosis. However, in hypoxia, activationof extracellular signal-regulated kinase (ERK) in combination with maintenance of respiration and increased glycolysiscounterbalanced the deleterious effects of enhanced ROS, thereby allowing Vdac1−/− MEF to proliferate betterthan wild-type MEF in hypoxia. Allografts of RAS-transformed Vdac1−/− MEF exhibited stabilization of both HIF-1αand HIF-2α, blood vessel destabilization, and a strong inflammatory response. Moreover, expression of Cdkn2a, aHIF-1-target and tumor suppressor gene, was markedly decreased. Consequently, RAS-transformed Vdac1−/− MEFtumors grew faster than wild-type MEF tumors.(Continued on next page)
* Correspondence: [email protected]†Equal contributors1Institute for Research on Cancer and Aging of Nice, CNRS-UMR 7284-InsermU1081, University of Nice Sophia-Antipolis, Centre Antoine Lacassagne, 33Ave de Valombrose, 06189 Nice, FranceFull list of author information is available at the end of the article
© 2015 Brahimi-Horn et al. Open Access This article is distributed under the terms of the Creative CommonsAttribution 4.0 International License (http://creativecommons.org/licenses/by/4.0/), which permits unrestricted use,distribution, and reproduction in any medium, provided you give appropriate credit to the original author(s) and thesource, provide a link to the Creative Commons license, and indicate if changes were made. The Creative CommonsPublic Domain Dedication waiver (http://creativecommons.org/publicdomain/zero/1.0/) applies to the data madeavailable in this article, unless otherwise stated.

Brahimi-Horn et al. Cancer & Metabolism (2015) 3:8 Page 2 of 18
(Continued from previous page)
Conclusions: Metabolic reprogramming in cancer cells may be regulated by VDAC1 through vascular destabilizationand inflammation. These findings provide new perspectives into the understanding of VDAC1 in the function ofmitochondria not only in cancer but also in inflammatory diseases.
BackgroundWhile the Warburg effect, or aerobic glycolysis, is consid-ered to be primarily responsible for the metabolic repro-gramming of cancer cells [1], mitochondrial respirationremains functional. However, it is not clear how mito-chondria impact on proliferation or transformation of can-cer cells, but as the «powerhouse» of cells, any change inmetabolism can strongly influence the survival of the can-cerous cell. Mitochondria are not only crucial in metabolicreprogramming; they also play an important role in deliv-ering the message of cell death i.e., apoptosis. When themitochondrial membrane potential (Δψm) is lost, mito-chondria lose the integrity of their outer membrane, ATPsynthesis is stopped, and proteins such as cytochrome Cactivate a cascade of caspases, ensuring certain death ofthe cell [2, 3].The voltage-dependent anion channel (VDAC) is a
major protein of the mitochondrial outer membrane thatfunctions at the intersection of metabolism and apop-tosis. The mammalian mitochondrial porin family in-cludes three isoforms: VDAC1, VDAC2, and VDAC3 [4].However, their expression levels differ according to thetype of tissue, as do their physiological function. Micelacking Vdac1 or Vdac3 are viable, whereas mice lackingVdac2 are not. While heterozygous Vdac1+/− mice ap-pear to have no obvious phenotype, when mated, theyshowed a reduced number of homozygous deficient micewhen compared to the expected Mendelian ratio [5].Only 40 % of the expected number of Vdac1−/− micesurvived, suggesting partial lethality, the reason forwhich has not yet been elucidated. VDAC1 is a pore thatregulates the passage of molecules, including NADH,ATP/ADP, citrate, succinate, glutamate, pyruvate, andeven glucose, as well as Mg2+, Ca2+, Cl−, K+, and Na+
ions [4]. It regulates the mitochondrial phenotype, apop-tosis, and glycolysis through binding to hexokinase I/II(HKI/II), the first enzyme of the glycolytic pathway.Binding of HK to VDAC is a crucial event that coordi-nates mitochondrial ATP generation, cytoplasmic glyco-lytic flux, and possibly cytochrome C release. Moreover,HKI/II are upregulated by hypoxia-inducible factors(HIFs), the key transcription factors that direct the cellresponse to hypoxia, a condition in which tumors are in-adequately oxygenated [6]. It is well known that the hyp-oxic nature of tumors is associated with poor clinicaloutcome, as hypoxia confers resistance to radio- andchemotherapy.
The role of VDAC1 in cancer has not been extensivelyinvestigated [7, 8, 4]. We recently reported the presencein tumor cells of a novel hypoxia-induced form ofVDAC1 lacking the C-terminus (VDAC1-ΔC) [7, 9].This new form was produced after long-term exposureto hypoxia. Cells expressing VDAC1-ΔC produced moreATP and were more resistant to stimulated apoptosisthan cells expressing only full length VDAC1. In hyp-oxia, the level of full length VDAC1 decreased by aboutat least 50 % while the level of VDAC1-ΔC conversly in-creased by about 50 %. We hypothesized that knockoutof VDAC1 in hypoxia would have a substantial impacton cell proliferation, oxidative and glycolytic metabol-ism, as well as apoptosis in hypoxic cells.Herein, we characterized the cellular and molecular
phenotype of Vdac1-deficient mouse embryonic fibro-blasts (MEF) in normoxia or hypoxia. We report thatVDAC1 participates in apoptosis and oxidative phosphor-ylation via reactive oxygen species (ROS) production,which modulates proliferation. We report connection tothe Raf/MEK/ERK signaling pathway that counterbalancesthe deleterious effects of ROS in hypoxia. Finally, we showthat knockout of Vdac1 in MEF expressing oncogenicRAS potentiates tumor development in mice by pro-moting metabolic reprogramming, accelerating vasculardestabilization and inflammation.
MethodsCell culture, transfection, and animalsMEF cells were grown in Dulbecco’s modified eagle’smedium (DMEM) (Gibco-BRL) supplemented with 10 %fetal bovine serum with penicillin G (50 U/ml) andstreptomycin sulfate (50 μg/ml). An INVIVO2 200 an-aerobic workstation (Ruskinn Technology Biotrace Inter-national Plc) set at 1 % oxygen, 94 % nitrogen, and 5 %carbon dioxide was used for hypoxic conditions. MEFwere transformed with the pBabe-RASV12 vector, andpuromycin-resistant cells were collected. Animal proce-dures were approved by the Animal Care and Use Com-mittee of the Unité Mixte de Service 006 of Toulouse(approval number 13-U1037-JES-08).
Electron microscopyCells were fixed in situ with 1.6 % glutaraldehyde in0.1 M phosphate buffer at room temperature (RT) andstored overnight at 4 °C. Samples were rinsed in the samebuffer and then postfixed with 1 % osmium tetroxide and
Brahimi-Horn et al. Cancer & Metabolism (2015) 3:8 Page 3 of 18
1 % potassium ferrocyanide in 0.1 M cacodylate buffer for1 h at RT to enhance the staining of cytoplasmic mem-branes. Cells were rinsed with distilled water, embedded inepoxy resin, sectioned, and examined with a Philips CM12transmission electron microscope equipped with anOlympus SIS CCD camera. The area of the mitochondriaof cells was calculated as an ellipse (0.785ab; n.2, 50 mito-chondria per experiment; mean ± SD).
ATP determinationMEF (Wt and Vdac1−/−) and RAS MEF (Wt and Vdac1−/−)were incubated in hypoxia for 72 h and then lysed. Quanti-fication of ATP was done using a luciferin/luciferase-basedassay (Cell Titer Glo kit, Promega) according to the manu-facturer’s instructions, and results are expressed as relativeluminescence units (RLU). Each condition was tested eighttimes, and the entire experiment was done twice.
Lactate measurementThe lactate concentration in the supernatant of cellsincubated either in normoxia or hypoxia for 48 h wasdetermined by an enzyme-based assay using 900 μM β-NAD (BioChemika) and 175 μg/ml L-lactate dehydro-genase (BioChemika), and 100 μg/ml glutamate-pyruvatetransaminase (Roche) were diluted in a sodium carbon-ate (620 mM)-L-gultamate (79 mM) buffer adjusted topH 10. Lithium lactate was used as a standard. Measure-ment was done with a microplate reader after incubationfor 30 min at 37 °C. For each condition, the protein con-centration was determined to express the lactate con-centration as mmole/μg protein.
Respirometry and extracellular acidificationThe cellular oxygen consumption rate (OCR) and extra-cellular acidification rate (ECAR) were obtained using aSeahorse XF96 extracellular flux analyzer from SeahorseBioscience (North Billerica, MA, USA). The final con-centrations of the agents are given in the legends. Experi-ments were performed according to the manufacturer’sinstructions. Protein standardization was performed aftereach experiment, with no noticeable differences in proteinconcentration and cell phenotype.
Determination of glutamate productionGlutamate concentrations were measured in media su-pernatants using a Ysi 2300 STAT Plus analyzer (YSI LifeSciences). Measurements were done in triplicate, andthe experiment was repeated two times.
Caspase activationQuantification of the caspase 3/7 activity was done usinga luciferin/luciferase-based assay (Caspase-Glo 3/7 kit,Promega) according to the manufacturer’s instructions.Each condition was performed eight times, and the
entire experiment was done three times. Significant dif-ferences are based on the Student’s t test (p < 0.005).STS was added 4 h prior to assay for caspase 3/7activity.
Flow cytometry and ROS measurementFor measuring intracellular cytosolic ROS levels, cellswere cultured in hypoxia or normoxia for 48 h. Cellswere then treated with oxidation sensitive DCF-DA (afinal concentration of 10 μM) in culture medium for30 min at 37 °C. After trypsination, the fluorescence ofDCF in cells was measured using a fluorescence-activated cell sorter (BD FACSCalibur, analyzer). Mito-chondrial H2O2 production was determined usingAmplex UltraRed as described [10] but with a XeniusXC Safas spectrofluorimeter (Monaco) at λexcitation =560 nm, λemision = 590 nm. Whole digitonin perme-abilized cells were used instead of isolated mitochondria,as described [11]. The assay was performed with 0.6 mgprotein/ml of each cell type suspended in KHEP bufferwithout BSA (120 mM KCl, 2.5 mM MgCl2, 1 mMEGTA, 5 mM HEPES pH 7.2 at 37 °C) together with5 U/ml horseradish peroxidase, 25 U/ml superoxide dis-mutase, and 50 μM Amplex UltraRed. The reaction wasmonitored and digitonin (final 10 μg/ml), then potassiumsuccinate (final 5 mM), and then antimycin A (final2 mM) were added successively. The results are expressedas the mean slope ratio of antimycin A/succinate.
ImmunoblottingCells were lysed in 1.5x SDS buffer and the protein con-centration determined using the BCA assay. 40 μg of pro-tein of whole cell extracts was resolved by SDS-PAGE andtransferred onto a PVDF membrane (Millipore). Mem-branes were blocked in 5 % non-fat milk in TN buffer(50 mM Tris–HCl pH 7.4, 150 mM NaCl) and incubatedin the presence of the primary and then secondary anti-bodies in 5 % non-fat milk in TN buffer.The Bak antibody was purchased from Abcam, Bid
and tBid from R&D Systems, Bax and Bcl-XL from SantaCruz, Bcl-2 from Novus, and Mcl-1 from Sigma. Ratanti-mouse CD31 (MEC 13.3) was from BD Bioscience(San Diego, CA). VDAC1 antibody (ab15895) was pur-chased from Abcam. Rabbit polyclonal anti-HIF-1α anti-body (antiserum 2087) was produced and characterizedin our laboratory [12]. ECL signals were normalized toeither β-tubulin or ARD1 [13]. After washing in TN buf-fer containing 1 % Triton-X100 and then in TN buffer,immunoreactive bands were visualized with the ECL sys-tem (Amersham Biosciences).
Microarray experimentsMEF were incubated in normoxia or hypoxia for 72 h(1 % O2) and then lysed prior to RNA isolation. RNA

Brahimi-Horn et al. Cancer & Metabolism (2015) 3:8 Page 4 of 18
was assessed for integrity by using an Agilent BioAnaly-ser 2100 (Agilent Technologies) (RIN above 9). RNAsamples were then labeled with Cy3 dye using the lowRNA input QuickAmp kit (Agilent) as recommended bythe supplier. Labeled cRNA probe (825 ng) was hybridizedon 8x60K high density SurePrint G3 gene expressionmouse microarrays. The experimental data are depositedon the NCBI Gene Expression Omnibus (GEO) under theseries record number GSE63247 (http://www.ncbi.nlm.nih.gov/geo/query/acc.cgi?acc=GSE63247). Normalization ofmicroarray data was performed using the Limma pack-age available from Bioconductor (http://www.bioconductor.org). Inter-slide normalization was performed using quan-tile methods. Means of ratios from all comparisons werecalculated and a B test analysis using paired analysis wasperformed. Differentially expressed genes were selectedbased on an adjusted p value below 0.01 and a log2 (foldchange) >1. Data were analyzed for enrichment in bio-logical themes (diseases and functions, canonical pathways,upstream analysis) using Ingenuity Pathway Analysis soft-ware (http://www.ingenuity.com/).
StatisticsAll values are the means ± SEM. Statistical analysis wereperformed using the Student’s t test as provided byMicrosoft Excel. The p values are indicated. All categor-ical data used numbers and percentages. Quantitativedata were presented using the median and range ormean. Differences between groups were evaluated usingthe chi-square test for categorical variables and the Stu-dent’s t test for continuous variables. Analyses wereperformed using SPSS 16.0 statistical software (SPSSInc., Chicago, Ill). All statistical tests were two-sided,and p values <0.05 indicated statistical significance,whereas p values between 0.05 and 0.10 indicated astatistical tendency (Additional file 1).
The online version of the article contains a data supplementAdditional file 2: Table S1, Additional file 3: Table S2,Additional file 4: Table S3, Additional file 5: Table S4,Additional file 6: Figure S1 and Additional file 7: FigureS2 show detailed data related to the microarray analysis.Additional file 8: Figure S3 shows expression of COX4-2. Additional file 9: Figure S4 shows the ROS status.Additional file 10: Figure S5 shows expression of GPX7and the effect of ebselen. Additional file 11: Figure S6shows changes in metabolic pathways. Additional file 12:Figure S7 shows data on glucose and glutamine catabolism.Additional file 13: Figure S8 shows the level of apoptosis.Additional file 14: Figure S9 shows electron micrographand immunoblotting data related to autophagy. Additionalfile 15: Figure S11 shows data on vascularization of theRAS-MEF tumor tissue. Additional file 16: Figure S12shows the immunohistochemistry to VEGF of tumor
sections. Additional file 17: Figure S13 shows an in silicoanalysis of the Vdac1 gene in cancer.
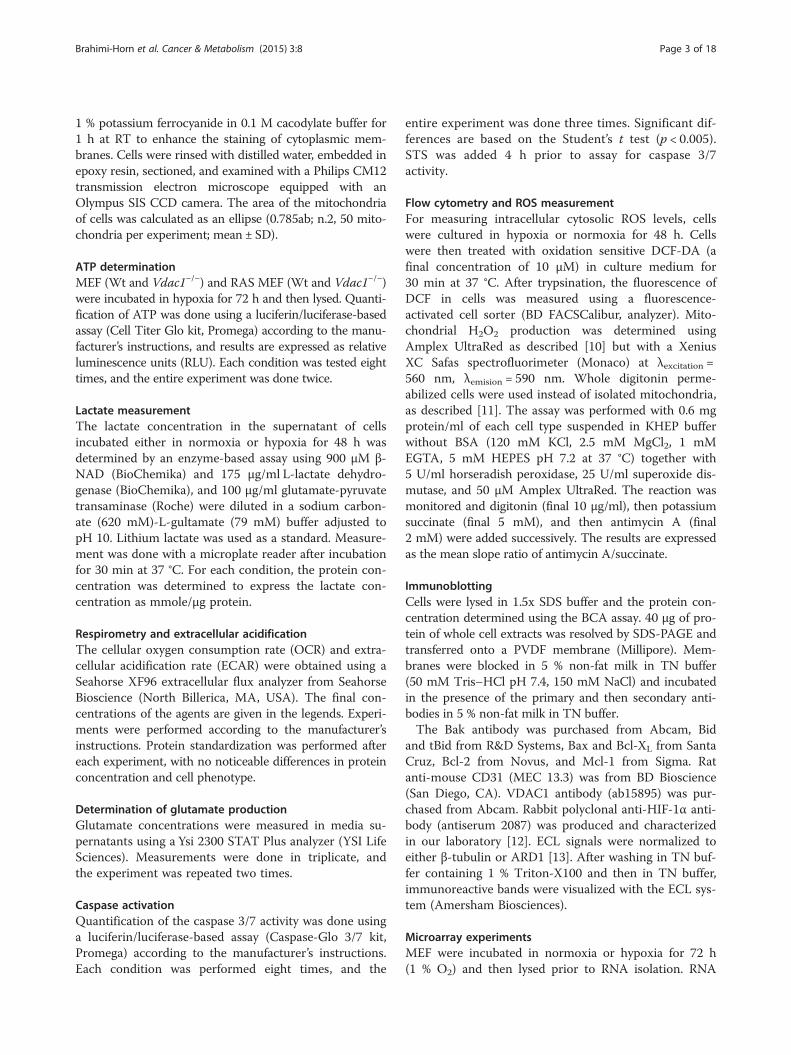
ResultsHigh-throughput gene expression profiling of wild-typeand Vdac1−/− mouse embryonic fibroblastsWe confirmed that VDAC-ΔC was produced in hypoxiain wild-type (Wt) MEF [14] and that the VDAC1 proteinwas not expressed in Vdac1−/− MEF [5] (Fig. 1a). Wethen analyzed the transcriptome of Wt and Vdac1−/−
MEF in normoxia or hypoxia using a mouse whole gen-ome microarray. Only RNA transcripts showing an ad-justed p value <0.01 and an absolute log2 (fold change) >1in at least one differential expression analysis were consid-ered. Figure 1b and c recapitulates the number of genesdifferentially expressed when comparing the RNA tran-script expression of Vdac1−/− vs Wt MEF and the re-sponse of both cells lines to hypoxia, respectively. Thedata showed alteration in the gene expression profile ofVdac1−/− MEF compared to Wt MEF in both normoxiaand hypoxia (Fig. 1d, e). Analysis of the hypoxic responseidentified changes between the two cell lines (Fig. 1c, d).To understand the functional relevance of differentiallyexpressed up- and down-regulated genes in Vdac1−/−
compared to Wt MEF, the microarray data were analyzedwith Ingenuity Pathway AnalysisTM (IPATM) softwareusing the same cut-offs for both cells lines. The Vdac1 de-ficiency, highlighted terms associated with «Diseases andfunctions» (Additional file 2: Table S1A), «Canonical path-ways» (Additional file 2: Table S1B), and «Upstream regu-lators» (Additional file 2: Table S1C) in both normoxiaand hypoxia. These results pointed to alterations in pro-grams controlling cancer through metabolic pathwaysmodulating HIF-1, cell death and survival, as well as cellproliferation and motility. Analysis revealed alterations inthe hypoxic response of Vdac1−/− MEF, including a lack ofinhibition of cell proliferation, an increased oxidativestress response, and p53 activation (Additional file 3: TableS2). The «HIF-1α» signaling pathway both in normoxia(Fig. 1f) and hypoxia (Additional file 2: Figure S1) and the«Upstream regulators» «HIF-1α» were highlighted inVdac1−/− MEF (Additional file 2: Tables S1B-C and Add-itional file 16: S2B-C). The HIF-1α protein was detectablein normoxia in Vdac1−/− MEF and increased in hypoxia toa level higher than that of Wt MEF in hypoxia, whenequivalent numbers of cells were seeded (Fig. 1g). HIF-2αwas also present at a higher level in Vdac1−/− MEF, butonly in hypoxia.
Vdac1−/− MEF proliferated faster than Wt MEF in hypoxiathrough activation of the ERK1/2 pathwayThe IPATM analysis highlighted cell proliferation and mi-gration in Vdac1−/− MEF in hypoxia with increased HIF-1 signaling (Additional file 3: Table S2A). Wt MEF
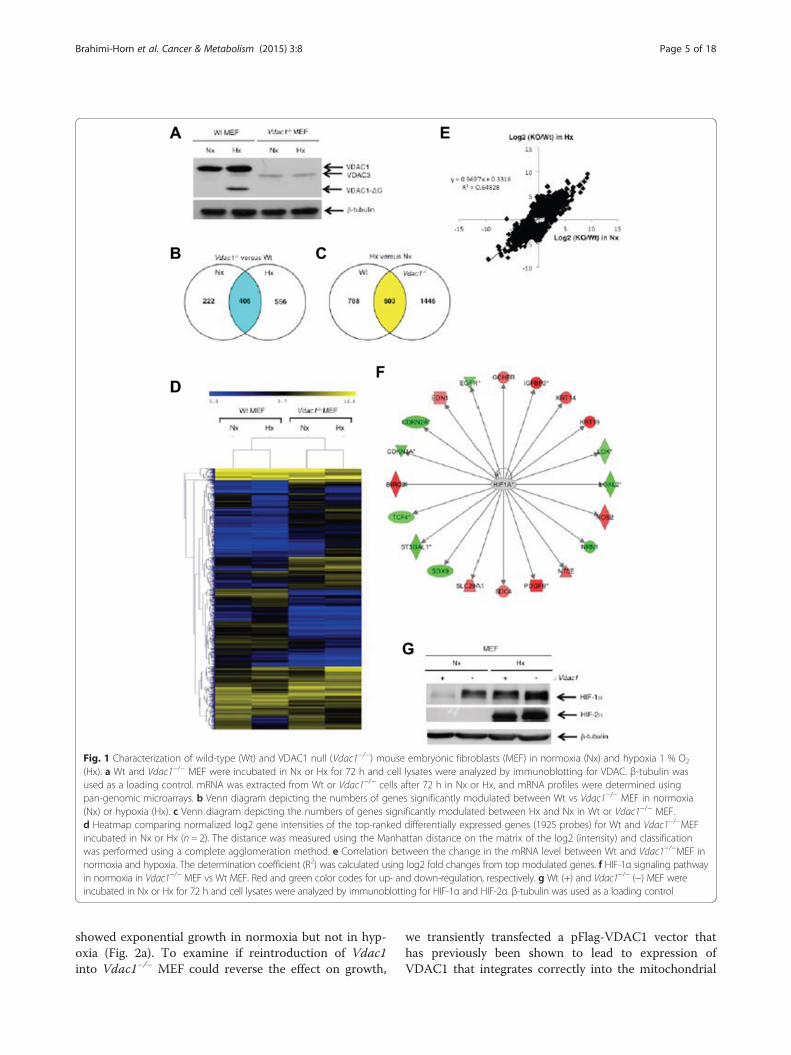
Fig. 1 Characterization of wild-type (Wt) and VDAC1 null (Vdac1−/−) mouse embryonic fibroblasts (MEF) in normoxia (Nx) and hypoxia 1 % O2
(Hx). a Wt and Vdac1−/− MEF were incubated in Nx or Hx for 72 h and cell lysates were analyzed by immunoblotting for VDAC. β-tubulin wasused as a loading control. mRNA was extracted from Wt or Vdac1−/− cells after 72 h in Nx or Hx, and mRNA profiles were determined usingpan-genomic microarrays. b Venn diagram depicting the numbers of genes significantly modulated between Wt vs Vdac1−/− MEF in normoxia(Nx) or hypoxia (Hx). c Venn diagram depicting the numbers of genes significantly modulated between Hx and Nx in Wt or Vdac1−/− MEF.d Heatmap comparing normalized log2 gene intensities of the top-ranked differentially expressed genes (1925 probes) for Wt and Vdac1−/−MEFincubated in Nx or Hx (n = 2). The distance was measured using the Manhattan distance on the matrix of the log2 (intensity) and classificationwas performed using a complete agglomeration method. e Correlation between the change in the mRNA level between Wt and Vdac1−/−MEF innormoxia and hypoxia. The determination coefficient (R2) was calculated using log2 fold changes from top modulated genes. f HIF-1α signaling pathwayin normoxia in Vdac1−/− MEF vs Wt MEF. Red and green color codes for up- and down-regulation, respectively. g Wt (+) and Vdac1−/− (−) MEF wereincubated in Nx or Hx for 72 h and cell lysates were analyzed by immunoblotting for HIF-1α and HIF-2α. β-tubulin was used as a loading control
Brahimi-Horn et al. Cancer & Metabolism (2015) 3:8 Page 5 of 18
showed exponential growth in normoxia but not in hyp-oxia (Fig. 2a). To examine if reintroduction of Vdac1into Vdac1−/− MEF could reverse the effect on growth,
we transiently transfected a pFlag-VDAC1 vector thathas previously been shown to lead to expression ofVDAC1 that integrates correctly into the mitochondrial
Fig. 2 Characterization of the growth of Wt and Vdac1−/− MEF. a Both cell lines were seeded at the same density and incubated in Nx or Hx forthe indicated number of days. The mean ± SEM is representative of four independent experiments carried out in duplicate. A p < 0.0002 showssignificant difference from normoxia for the Vdac1−/− MEF. b Immunoblotting of HeLa cells transfected with pFlag-VDAC1. c Immunoblotting andproliferation assay of MEF tranfected with pFlag-VDAC1 d Relative migration of Wt and Vdac1−/− MEF in Nx as evaluated with a xCELLigencesystem. The mean ± SEM is representative of two independent experiments carried out in quadruplicate. e Characterization of the growth of Wtand Vdac1−/− MEF incubated in Nx or in Hx for 3 days in the absence or presence of an inhibitor of MEK (U0126, 10 μM). The mean ± SEM isrepresentative of two independent experiments carried out in duplicate. f Wt (+) and Vdac1−/− (−) cells were incubated in Nx or Hx in theabsence or presence of an inhibitor of MEK (U0126). Cell lysates were analyzed by immunoblotting for phospho-ERK (P-ERK), total ERK (ERK) andβ-tubulin as a loading control. g Immunofluorescence of P-ERK in Wt and Vdac1−/− MEF in Hx. h Wt (+) and Vdac1−/− (−) MEF were incubated inNx or Hx for 72 h and cell lysates were analyzed by immunoblotting for DUSP6. ARD1 was used as a loading control. (i) Immunoblotting of WtMEF and Hif-1α−/− MEF for DUSP6
Brahimi-Horn et al. Cancer & Metabolism (2015) 3:8 Page 6 of 18
membrane [15]. However, since MEF do not transfect eas-ily, we first tested the vector on HeLa cells and confirmedboth expression of VDAC1 and its post-translationalcleavage in hypoxia (Fig. 2b), as we described [14, 9]. We
observed that Vdac1−/− MEF transfected with pFlag-VDAC1 proliferated slightly faster than empty vectortransfected Vdac1−/− MEF (Fig. 2c), suggesting that des-pite the low level of transfection, the absence of VDAC1
Brahimi-Horn et al. Cancer & Metabolism (2015) 3:8 Page 7 of 18
was responsible for the slow growth. Conversely,Vdac1−/−
MEF did not grow well in normoxia, but in hypoxia,showed similar growth to Wt MEF in normoxia. Vdac1−/−
MEF also migrated three times faster than Wt MEF innormoxia (Fig. 2d). To investigate whether the extracellu-lar signal-regulated kinases 1 and 2 (ERK1/2) signalingpathway was involved, we cultured the cells in normoxiaor hypoxia with or without U0126, a selective inhibitor ofthe intracellular Raf/MEK/ERK signaling pathway (Fig. 2e).In Vdac1−/− MEF, U0126 had no effect on proliferation innormoxia, whereas proliferation in hypoxia was abolishedwith U0126 suggesting that the ERK1/2 pathway restorednormal growth in hypoxia in Vdac1−/− MEF. Expressionof phospho-ERK1/2 was enhanced in hypoxia in Vdac1−/−
MEF compared to Wt MEF (Fig. 2e). P-ERK was predom-inantly localized in the cytoplasm of Wt MEF in hypoxia(Fig. 2g). However, active ERK targeted focal adhesioncomplexes in Vdac1−/− MEF in hypoxia (Fig. 2g). The dualspecificity phosphatase DUSP6, a mitogen-activated pro-tein kinase phosphatases that dephosphorylates ERK, washighlighted in the IPATM analysis (Additional file 4: TableS3). A decrease in DUPS6 was observed in Wt MEF ex-posed to hypoxia and Vdac1−/− MEF in normoxia (Fig. 2h).This decrease in expression was dependent on HIF-1 sincethe level of expression was the same in Hif-1−/− MEF innormoxia or hypoxia (Fig. 2i). These results suggest thatERK activation allows cells to proliferate better in hypoxiathrough inactivation of DUSP6, but only in cells lackingVdac1.
Vdac1−/− MEF showed alterations in mitochondrialrespirationAs the IPATM analysis identified in hypoxic Vdac1−/−
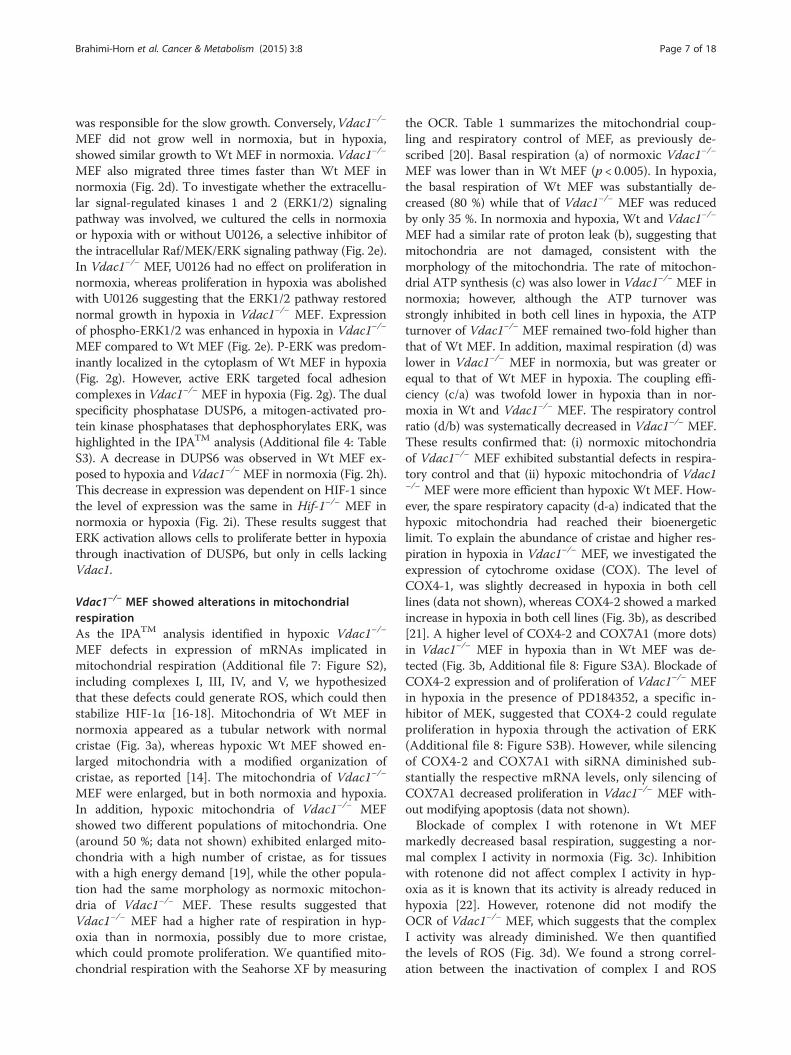
MEF defects in expression of mRNAs implicated inmitochondrial respiration (Additional file 7: Figure S2),including complexes I, III, IV, and V, we hypothesizedthat these defects could generate ROS, which could thenstabilize HIF-1α [16-18]. Mitochondria of Wt MEF innormoxia appeared as a tubular network with normalcristae (Fig. 3a), whereas hypoxic Wt MEF showed en-larged mitochondria with a modified organization ofcristae, as reported [14]. The mitochondria of Vdac1−/−
MEF were enlarged, but in both normoxia and hypoxia.In addition, hypoxic mitochondria of Vdac1−/− MEFshowed two different populations of mitochondria. One(around 50 %; data not shown) exhibited enlarged mito-chondria with a high number of cristae, as for tissueswith a high energy demand [19], while the other popula-tion had the same morphology as normoxic mitochon-dria of Vdac1−/− MEF. These results suggested thatVdac1−/− MEF had a higher rate of respiration in hyp-oxia than in normoxia, possibly due to more cristae,which could promote proliferation. We quantified mito-chondrial respiration with the Seahorse XF by measuring
the OCR. Table 1 summarizes the mitochondrial coup-ling and respiratory control of MEF, as previously de-scribed [20]. Basal respiration (a) of normoxic Vdac1−/−
MEF was lower than in Wt MEF (p < 0.005). In hypoxia,the basal respiration of Wt MEF was substantially de-creased (80 %) while that of Vdac1−/− MEF was reducedby only 35 %. In normoxia and hypoxia, Wt and Vdac1−/−
MEF had a similar rate of proton leak (b), suggesting thatmitochondria are not damaged, consistent with themorphology of the mitochondria. The rate of mitochon-drial ATP synthesis (c) was also lower in Vdac1−/− MEF innormoxia; however, although the ATP turnover wasstrongly inhibited in both cell lines in hypoxia, the ATPturnover of Vdac1−/− MEF remained two-fold higher thanthat of Wt MEF. In addition, maximal respiration (d) waslower in Vdac1−/− MEF in normoxia, but was greater orequal to that of Wt MEF in hypoxia. The coupling effi-ciency (c/a) was twofold lower in hypoxia than in nor-moxia in Wt and Vdac1−/− MEF. The respiratory controlratio (d/b) was systematically decreased in Vdac1−/− MEF.These results confirmed that: (i) normoxic mitochondriaof Vdac1−/− MEF exhibited substantial defects in respira-tory control and that (ii) hypoxic mitochondria of Vdac1−/− MEF were more efficient than hypoxic Wt MEF. How-ever, the spare respiratory capacity (d-a) indicated that thehypoxic mitochondria had reached their bioenergeticlimit. To explain the abundance of cristae and higher res-piration in hypoxia in Vdac1−/− MEF, we investigated theexpression of cytochrome oxidase (COX). The level ofCOX4-1, was slightly decreased in hypoxia in both celllines (data not shown), whereas COX4-2 showed a markedincrease in hypoxia in both cell lines (Fig. 3b), as described[21]. A higher level of COX4-2 and COX7A1 (more dots)in Vdac1−/− MEF in hypoxia than in Wt MEF was de-tected (Fig. 3b, Additional file 8: Figure S3A). Blockade ofCOX4-2 expression and of proliferation of Vdac1−/− MEFin hypoxia in the presence of PD184352, a specific in-hibitor of MEK, suggested that COX4-2 could regulateproliferation in hypoxia through the activation of ERK(Additional file 8: Figure S3B). However, while silencingof COX4-2 and COX7A1 with siRNA diminished sub-stantially the respective mRNA levels, only silencing ofCOX7A1 decreased proliferation in Vdac1−/− MEF with-out modifying apoptosis (data not shown).Blockade of complex I with rotenone in Wt MEF
markedly decreased basal respiration, suggesting a nor-mal complex I activity in normoxia (Fig. 3c). Inhibitionwith rotenone did not affect complex I activity in hyp-oxia as it is known that its activity is already reduced inhypoxia [22]. However, rotenone did not modify theOCR of Vdac1−/− MEF, which suggests that the complexI activity was already diminished. We then quantifiedthe levels of ROS (Fig. 3d). We found a strong correl-ation between the inactivation of complex I and ROS
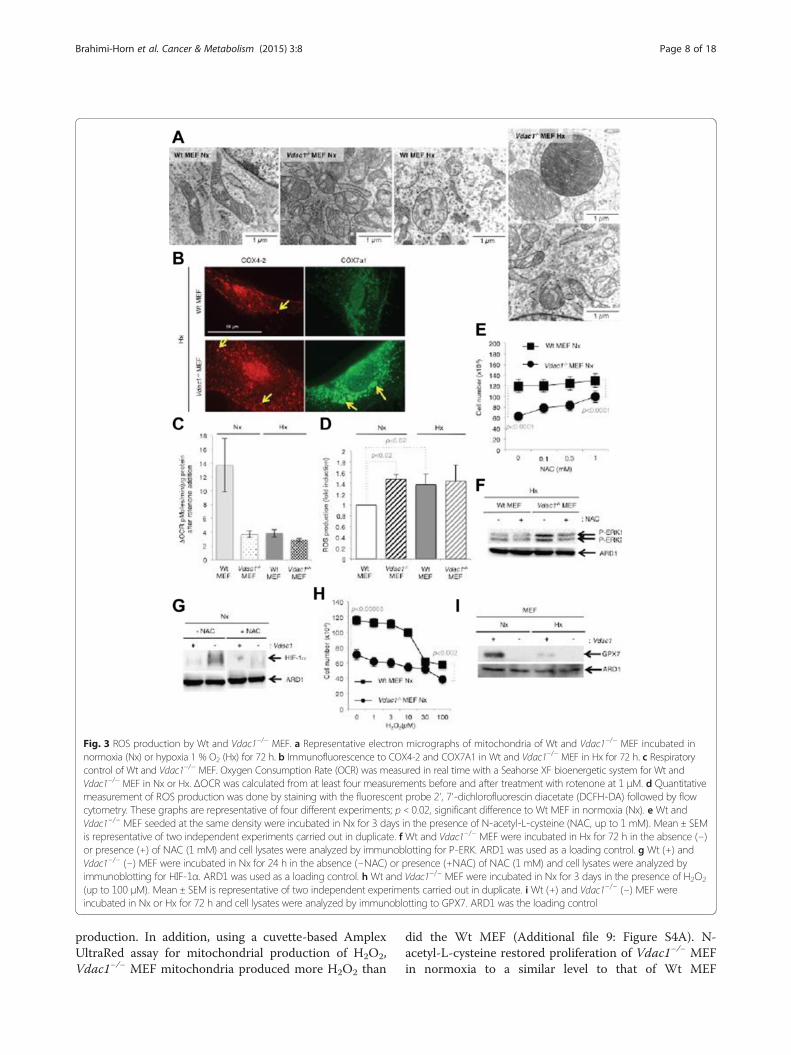
Fig. 3 ROS production by Wt and Vdac1−/− MEF. a Representative electron micrographs of mitochondria of Wt and Vdac1−/− MEF incubated innormoxia (Nx) or hypoxia 1 % O2 (Hx) for 72 h. b Immunofluorescence to COX4-2 and COX7A1 in Wt and Vdac1−/− MEF in Hx for 72 h. c Respiratorycontrol of Wt and Vdac1−/− MEF. Oxygen Consumption Rate (OCR) was measured in real time with a Seahorse XF bioenergetic system for Wt andVdac1−/− MEF in Nx or Hx. ΔOCR was calculated from at least four measurements before and after treatment with rotenone at 1 μM. d Quantitativemeasurement of ROS production was done by staining with the fluorescent probe 2', 7'-dichlorofluorescin diacetate (DCFH-DA) followed by flowcytometry. These graphs are representative of four different experiments; p< 0.02, significant difference to Wt MEF in normoxia (Nx). e Wt andVdac1−/− MEF seeded at the same density were incubated in Nx for 3 days in the presence of N-acetyl-L-cysteine (NAC, up to 1 mM). Mean ± SEMis representative of two independent experiments carried out in duplicate. f Wt and Vdac1−/− MEF were incubated in Hx for 72 h in the absence (−)or presence (+) of NAC (1 mM) and cell lysates were analyzed by immunoblotting for P-ERK. ARD1 was used as a loading control. g Wt (+) andVdac1−/− (−) MEF were incubated in Nx for 24 h in the absence (−NAC) or presence (+NAC) of NAC (1 mM) and cell lysates were analyzed byimmunoblotting for HIF-1α. ARD1 was used as a loading control. h Wt and Vdac1−/− MEF were incubated in Nx for 3 days in the presence of H2O2
(up to 100 μM). Mean ± SEM is representative of two independent experiments carried out in duplicate. i Wt (+) and Vdac1−/− (−) MEF wereincubated in Nx or Hx for 72 h and cell lysates were analyzed by immunoblotting to GPX7. ARD1 was the loading control
Brahimi-Horn et al. Cancer & Metabolism (2015) 3:8 Page 8 of 18
production. In addition, using a cuvette-based AmplexUltraRed assay for mitochondrial production of H2O2,Vdac1−/− MEF mitochondria produced more H2O2 than
did the Wt MEF (Additional file 9: Figure S4A). N-acetyl-L-cysteine restored proliferation of Vdac1−/− MEFin normoxia to a similar level to that of Wt MEF

Table 1 Respiratory control of Wt and Vdac1−/− MEF
Nx Hx
Wt MEF Vdac1−/− MEF Wt MEF Vdac1−/− MEF
(a) Basal respiration 20.52 ± 2.5 16.19 ± 1.8 4.5 ± 0.52 10.4 ± 2.41
(b) Oligomycin-insensitve respiration (leak) 5.96 ± 0.9 5.04 ± 0.9 2.4 ± 0.27 7.1 ± 2.73
(c) Oligomycin-sensitive (ATP turnover) respiration 14.56 ± 1.6 11.16 ± 0.8 1.8 ± 0.70 3.2 ± 0.95
(d) Maximal respiration in the presence of FCCP 29.21 ± 3.2 19.29 ± 1.7 5.4 ± 1.19 6.0 ± 0.29
(c/a) Coupling efficiency 0.71 ± 0.02 0.71 ± 0.01 0.4 ± 0.12 0.3 ± 0.13
(d/b) Respiratory control ratio 4.91 ± 0.2 3.95 ± 0.4 2.3 ± 0.71 0.8 ± 0.44
(d-a) Spare respiratory capacity 8.19 ± 1.2 3.10 ± 0.1 1.3 ± 0.50 −5.4 ± 2.83
The oxygen consumption rate (OCR) was measured in real time with a Seahorse XF bioenergetic system for Wt and Vdac1−/−MEF in Nx or Hx. The average OCRwas calculated from at least four measurements during treatment with each compound (oligomycin, FCCP, rotenone/antimycin A) at a 1 μM final concentration.(a) represents basal respiration, (b) oligomycin-insensitive respiration, (c) oligomycin-sensitive respiration, and (d) maximal respiration in the presence of FCCP. Thegraph shows how to define a, b, c, and d. The mean ± SEM is representative of six independent experiments carried out in quadruplicate
Brahimi-Horn et al. Cancer & Metabolism (2015) 3:8 Page 9 of 18
(Fig. 3e), decreased P-ERK in hypoxia (Fig. 3f ), and de-creased HIF-1α in normoxia (Fig. 3g). Addition ofhydrogen peroxide to Wt MEF decreased proliferationto a level similar to that of Vdac1−/− MEF (Fig. 3h).The expression of enzymes involved in upstream ordownstream transformation of H2O2 including superoxidedismutase 3 (Sod3) and glutathione peroxidase 7 (Gpx7)were tightly regulated in Vdac1−/− MEF (Additional file 5:Table S4). However, SOD1, SOD2, and SOD3 showed nodifference in expression in normoxia (Additional file 10:Figure S5B) or hypoxia (data not shown) in Wt MEF com-pared to Vdac1−/− MEF. GPX7, which detoxifies hydro-peroxide substrates, was absent in Vdac1−/− MEF in bothnormoxia and hypoxia (Fig. 3i, Additional file 10: FigureS5A). Moreover, ebselen, a mimetic of GPX [23], didnot modify HIF-1α stability (Additional file 10: FigureS5B). It decreased slightly the proliferation of Wt MEF,but not Vdac1−/− MEF (Additional file 10: Figure S5C)and increased slightly the viability of Vdac1−/− MEF(Additional file 10: Figure S5D), suggesting a putativeprotection against ROS in these cells.These results showed that the accumulation of ROS in
Vdac1−/− MEF, probably due to down-regulation ofGPX7 and the stabilization of HIF-1α, participate in theblockade of proliferation in normoxia. However, in
hypoxia, activation of P-ERK and induced expression ofCOX4-2 and COX7A1 compensated for the reducedmitochondrial complex I activity in Vdac1−/− MEF.
Vdac1−/− MEF were more glycolytic in hypoxiaIPATM analysis revealed that metabolism was minim-ally modified in Vdac1−/− MEF compared to Wt MEF(Additional file 11: Figure S6). Nonetheless, hypoxic in-duction of HKII was maintained in both cell lines, but thebasal amount of HKII in normoxia was lower in Vdac1−/−
MEF (Fig. 4a). We used the Seahorse XF to quantify gly-colysis by measuring the ECAR, which primarily reflectslactate. Addition of oligomycin, which blocks mitochon-drial ATP production, showed that the glycolytic capacityof Vdac1−/− MEF was more than twofold lower than thatof Wt MEF in normoxia (0.94 vs 2.34, respectively)(Fig. 4b). However, this ratio changed in hypoxia since (i)the basal level of glycolysis (1.75 vs 1.42) and (ii) the max-imum capacity (1.45 vs 1.3) of Vdac1−/− MEF was greaterthan that of Wt MEF (Fig. 4c). Relative to normoxia, bothlactate and ATP production were increased in Vdac1−/−
and Wt MEF in hypoxia (Fig. 4d, e). Vdac1−/− MEF wereless sensitive to blockade of respiration (oligomycin ormetformin) (Fig. 4f). As Wt MEF were extremely sensitiveto the absence of glutamine (almost 100 % cell death in

Fig. 4 Metabolic characteristics of Wt and Vdac1−/− MEF incubated in normoxia (Nx) or hypoxia 1 % O2 (Hx). a Wt (+) and Vdac1−/− (−) MEF wereincubated in Nx or Hx for 72 h and cell lysates were analyzed by immunoblotting for HIF-1α and HKII. β-tubulin was used as a loading control.The extracellular acidification rate (ECAR) in b Nx or c Hx of Wt and Vdac1−/− MEF was evaluated with a Seahorse XF bioenergetic system. Cellswere deprived of glucose for 1 h, then glucose (Glu 10 mM) and oligomycin (Oligo 1 μM) were injected at the indicated times. d After 3 days ofculture, cells were lysed in Assay Buffer with sonication. The amount of lactate was quantified in cell extracts. The mean ± SEM is representative ofthree independent experiments carried out in duplicate. A p < 0.001 and p < 0.005 show significant differences. e ATP production of Wt and Vdac1−/−
MEF in Nx or Hx for 72 h. The mean ± SEM is representative of three independent experiments carried out in duplicate. A p < 0.0005 andp < 0.00005 show significant differences. f Wt and Vdac1−/− MEF were cultured for 2 days in Nx or Hx in the presence of oligomycin (Oligo,1 μM), metformin (−Metf), and without glutamine (−Gluta), in the presence of dialyzed serum. The cell number was measured on a Beckman Coulterapparatus (squares). The percentage cell mortality was measured by trypan blue exclusion (black dots). The mean ± SEM is representative oftwo independent experiments carried out in duplicate. A p < 0.01, p < 0.001, and p < 0.005 show significant differences
Brahimi-Horn et al. Cancer & Metabolism (2015) 3:8 Page 10 of 18

Brahimi-Horn et al. Cancer & Metabolism (2015) 3:8 Page 11 of 18
normoxia and hypoxia), the cell death of Vdac1−/− MEFwas about 32.3 % in normoxia and 38.1 % in hypoxia, sug-gesting an important role of glutamine, which is metabo-lized to glutamate in mitochondria, in Vdac1−/− MEF. Inthe presence of 2-deoxy-D-glucose, a glucose analog thatinhibits glycolysis, or in the absence of glucose, Vdac1−/−
and Wt MEF showed similar survival (Additional file 12:Figure S7A). Finally, Vdac1−/− MEF produced little or noglutamate in both normoxia and hypoxia compared to WtMEF (Additional file 12: Figure S7B). These resultsconfirm that the Vdac1−/− MEF grew better in hypoxia, bymaintaining respiration and promoting glycolysis.
Vdac1−/− MEF showed a higher level of apoptosis than WtMEFSince “cell death of cancer cells” was highlighted inVdac1−/− MEF (Additional file 2: Table S1A) in the IPATM
analysis, we investigated whether the lack of Vdac1 trig-gered apoptosis. While Wt MEF exhibited little apoptosis,basal apoptosis was persistent in normoxia (15 %) andhypoxia (20 %) in Vdac1−/− MEF (Fig. 5a). The basal levelof apoptosis was evaluated as 10 % of the nuclei ofVdac1−/− MEF exhibiting blebbing in normoxia (Fig. 5b).Moreover, no cytochrome C release was observed for WtMEF in normoxia, whereas Vdac1−/− MEF showed releaseof cytochrome C in parallel to nuclear fragmentation(Additional file 13: Figure S8). The expression of Bak, Bax,and Mcl1 was similar in both cell lines and under both con-ditions (Fig. 5c). However, the expression of Bcl-XL and Bcl-2, two anti-apoptotic members of the Bcl-2 family, wasfound to be reduced in Vdac1−/− MEF, consistent with thebasal apoptosis of these cells. In addition, Wt MEF incubatedwith the apoptotic stimulus staurosporine (STS) remainedunaffected in both normoxia and hypoxia (Fig. 5d). However,Vdac1−/− MEF were sensitive to STS in both conditions. Wefurther confirmed that Vdac1−/− MEF were sensitive to stim-ulated apoptosis and were also more sensitive to chemother-apy with doxorubicin and bleomycin than Wt MEF (Fig. 5e).No differences were observed for cisplatin. We also con-firmed the protective effect of hypoxia in response to irradi-ation in Wt MEF (Fig. 5f) and found that Vdac1−/− MEF innormoxia exhibited a level of radioresistance similar to thatof Wt MEF in hypoxia. Moreover, Vdac1−/− MEF showedmore radioresistance in hypoxia than Wt MEF. Finally, asautophagy was also highlighted in Vdac1−/− MEF by IPATM
analysis (Additional file 3: Table S2A), we examined its in-duction in Vdac1−/− MEF. We observed a higher back-ground level of autophagy in Vdac1−/− MEF compared toWt MEF (Additional file 14: Figure S9A-B).
Vdac1−/− RASV12-transformed MEF form inflammatorytumors that grow faster than Wt tumorsWt and Vdac1−/− RAS-transformed MEF showed similarexpression of RAS (Fig. 6a), proliferation (Additional file
18: Figure S10A), type of morphology (Additional file 18:Figure S10B), rate of migration (Additional file 18:Figure S10C), level of glycolysis (Additional file 18:Figure S10D), and respiration (Additional file 18: FigureS10E) as non-transformed MEF. However, while the WtRAS and Vdac1−/− RAS MEF showed the same relativeresistance to irradiation as previously observed (Fig. 5f ),the basal level of resistance of transformed cells wasmuch higher than that of non-transformed cells(Additional file 18: Figure S10F). Both Wt RAS orVdac1−/− RAS MEF plated in soft agar acquired the abil-ity to grow under anchorage-independent conditions(Additional file 18: Figure S10G). Consistent with this,Vdac1−/− RAS MEF more rapidly formed tumors innod-scid mice than Wt RAS MEF (Fig. 6b). Most of thetumors derived from Vdac1−/− RAS MEF reached a sizeof 1 cm3 within 27 days of injection, whereas Wt RASMEF-derived tumors reached this size within 41–43 daysand the tumor weights were similar (Additional file 18:Figure S10H). No metastases were detected at necropsy(data not shown). We noted that Vdac1−/− RAS MEF-derived tumors showed bloody tumors with a soft tex-ture while Wt RAS MEF-derived tumors had a hardertexture (data not shown) (Additional file 15: FigureS11A). The level of HIF-1α and HIF-2α was higher inthe three tumors derived from Vdac1−/− RAS MEF thanin Wt RAS MEF (Fig. 6c). Compared to Wt RAS MEF-derived tumors, there was a significance increase in thenumber of CD31-positive vessels (Fig. 6d) and number ofvessels (Additional file 15: Figure S11B-C). Moreover, theimmunofluorescence to alpha-smooth muscle actin washigher for Wt than for Vdac1−/− RAS MEF tumors(Fig. 6e). Masson’s trichome staining showed a massiveleak of red blood cells from blood vessels into the tumortissue of the Vdac1−/− RAS MEF (Fig. 6f) and more hemo-globine in the tumor (Additional file 15: Figure S11D),suggesting that the leak came from partial vascular remod-eling, probably coupled with enhanced permeability.When comparing the non-transformed Vdac1−/− to WtMEF in the IPATM analysis for «Development of bloodvessels», three genes were highly induced, matrixmetalloproteinase-3 (Mmp3), platelet-derived growth fac-tor β (Pdgfβ), and collagen type XVIII alpha 1 (Col18A1),while one gene, thrombomodulin (Thbd), was highly re-pressed. Evaluation of the level of the mRNA confirmedthe IPATM results with the exception of Pdgfβ (Fig. 6g).From the IPATM analysis (Additional file 2: Table S1A-C,Additional file 3: Table S2A-C), the inflammatory responsewas central to loss of VDAC1. Moreover, as leakage maybe associated with ROS production, generating an inflam-matory response, we investigated the expression ofpro-inflammatory genes. Increased expression of thepro-inflammatory cytokines interleukine 8 (Il-8) and che-mokine (C-X-C motif) ligand 5 (CxCl5) were detected in

Fig. 5 Knockout of Vdac1 maintains a basal level of apoptosis. a Wt and Vdac1−/− MEF were cultured for 3 days in normoxia (Nx) or hypoxia 1 %O2 (Hx). The percentage cell mortality was measured by trypan blue exclusion. A p < 0.05 shows a tendency from the basal apoptosis of Wt MEF.b Cells were stained with DAPI (blue) to highlight the nucleus and its morphology. Quantification of the percentage of blebbing in Wt and Vdac1−/−
MEF. At least 200 nuclei were counted blindly. c Wt (+) and Vdac1−/− (−) MEF were incubated in Nx or Hx for 72 h and cell lysates were analyzed byimmunoblotting for Bak, Bax, Mcl-1, Bcl-XL, Bcl-2, VDAC, and HKII. β-actin was used as a loading control. d Wt and Vdac1−/− MEF were incubated in Nxor Hx for 72 h and challenged with staurosporin (STS) (1 μM) for 4 h. Apoptosis was evaluated from the level of caspase 3/7. A p < 0.001 and p < 0.0001show significant differences. e Wt and Vdac1−/− MEF were cultured for 2 days and then treated for 3 days with staurosporine (STS) (1 μM), cisplatin (CIS)(2 μg/ml), doxorubicin (DOXO) (4 μg/ml), or bleomycin (Bleo) (10 μg/ml). Cell viability was measured using an ADAM cell counter. A p < 0.02, p < 0.002,and p < 0.005 show significant differences. f Radioresistance of Wt and Vdac1−/− MEF cultured for 24 h in Nx or Hx and treated with the indicated doseof radiation. Cell growth was then evaluated with a clonogenic cell survival assay. X-axis: dose of X-radiation (Gy). Y-axis: surviving fraction. The mean ±SEM is representative of two independent experiments carried out in duplicate. A p < 0.01 and p < 0.005 show significant differences
Brahimi-Horn et al. Cancer & Metabolism (2015) 3:8 Page 12 of 18
Vdac1−/− RAS MEF-derived tumors (Fig. 6h). Finally, wenoted that cyclin-dependent kinase inhibitor 2A (Cdkn2A)(Fig. 1f, Additional file 6: Figure S1), a tumor suppressorgene, was markedly inhibited, likely via HIF-1α in nor-moxia and hypoxia in the absence of VDAC1. The
expression level of Cdkn2A (Fig. 6i) was decreased likelyfavoring the rapid growth of Vdac1−/− RAS MEF-derivedtumors. Wt RAS MEF-derived tumors showed a muchhigher level of staining for VEGFA than Vdac1−/− RASMEF tumors, which correlated with the decrease in CD31-

Fig. 6 In vivo allograft tumor growth of RASV12-transformed MEF expressing (Wt RAS MEF) or not (Vdac1−/− RAS MEF) VDAC1. a Wt RAS (+) andVdac1−/− RAS (−) MEF were incubated in Nx for 24 h and cell lysates were analyzed by immunoblotting for RAS and VDAC. β-tubulin was used asa control. b Allograft tumor growth of Wt RAS MEF and Vdac1−/− RAS MEF injected into one of the flanks of nod-scid mice. Five mice were studied percondition. A p < 0.0000001 shows significant differences. c Wt RAS (tumors 1, 2, and 3) and Vdac1−/− RAS MEF-derived tumors (tumors 4, 5, and 6) celllysates were analyzed by immunoblotting for HIF-1α, HIF-2α, and VDAC. β-tubulin was used as a loading control. d Immunofluorescence of CD31 todetect blood vessels in Wt RAS and Vdac1−/− RAS MEF-derived tumors. e Immunofluorescence of α-smooth muscle actin to visualize the structure ofblood vessels in Wt RAS and Vdac1−/− RAS MEF-derived tumors. f Representative images of Masson’s trichrome stained Wt RAS and Vdac1−/− RASMEF-derived tumors. Red staining indicates red blood cells. g Expression of the mRNA of Mmp3, Col18A1 (Endostatin) and Thbd in Wt RAS (Wt RASMEF) and Vdac1−/− RAS MEF-derived tumors (Vdac1−/− RAS MEF). h Expression of the pro-inflammatory cytokine mRNA of Il8 and Cxcl5 in Wt RAS (WtRAS MEF) and Vdac1−/− RAS MEF-derived tumors (Vdac1−/− RAS MEF). i Expression of the mRNA of Cdkn2a in Wt RAS (Wt RAS MEF) and Vdac1−/− RASMEF-derived tumors (Vdac1−/− RAS MEF)
Brahimi-Horn et al. Cancer & Metabolism (2015) 3:8 Page 13 of 18
positive blood vessels in Vdac1−/− RAS MEF tumors(Additional file 16: Figure S12). These results suggest astrong impact of VDAC1 on tumor development, probablythrough alterations in the inflammatory response as a resultof an abnormal vasculature due to HIF-1α stabilization andROS production.
DiscussionHerein, we characterized the gene expression profile andcellular phenotype of Vdac1-deficient MEF in normoxiaor hypoxia. Our results revealed important functions ofVDAC1, in cultured cells and in in vivo allograft tumors,which were primarily driven by ROS and HIF-1.
Brahimi-Horn et al. Cancer & Metabolism (2015) 3:8 Page 14 of 18
The gene expression profiles of Wt vs Vdac1−/− MEFin normoxia and hypoxia were compared keeping inmind that the other isoforms VDAC2 and VDAC3 maycompensate [24]. However, we did not detect theVDAC2 protein, and the expression of VDAC3 proteinremained constant. When comparing Vdac1−/− to WtMEF, the largest difference in expression was noted innormoxia, as HIF-1α and HIF-2α were already stabilizedby ROS in Vdac1−/− MEF. Therefore, the hypoxic effecton gene expression was diminished in Vdac1−/− MEF.The mRNAs affected by the loss of VDAC1 are involvedin cancer and metastasis, but also in fibrosis, neuromus-cular disease and finally in the inflammatory response.The role of VDAC1 in cancer has only just started to beinvestigated [7, 8, 4]. The results of the present study re-veal that the role of VDAC1 in cancer is connected tomodulation of energy and cell death, which are closelyinterconnected. We noted a decrease in glycolysis inVdac1−/− MEF possibly due to the decrease in HKII ex-pression. HKII has been shown to protect cancer cellsfrom entering apoptosis by blocking the interaction ofthe pro-apoptotic protein Bax with VDAC1 [25]. Twocritical anti-apoptotic factors, Bcl-XL and Bcl-2, wereexpressed in Vdac1−/− MEF. Bcl-XL has been shown tocritically regulate the opening of VDAC1 and to thus in-fluence apoptosis, possibly through the permeabilitytransition pore complex V [26-29]. Interestingly, inVdac1−/− MEF, neither Bcl-XL nor Bcl-2, two criticalanti-apoptotic factors, were expressed. As Bcl-XL mayinfluence metabolism [30], it is tempting to hypothesizethat the absence of Bcl-XL, like HKII, may play a role inthe reduced capacity to produce energy of Vdac1−/−
MEF in normoxia. A decrease in expression of HKIIand Bcl-XL would certainly affect apoptosis. Indeed,mitochondria-associated HKII has been shown to pro-tect cancer cells from entering apoptosis by blocking theinteraction of the pro-apoptotic protein Bax with VDAC1[25]. Moreover, a decrease in the pool of anti-apoptoticproteins such as Bcl-XL or Bcl-2 will inevitably destabilizethe balance of anti-apoptotic/pro-apoptotic factors. Weobserved a basal level of apoptosis (around 10 % celldeath), suggesting that VDAC1 is indispensable for mito-chondrial cell death. This contrasts with data of a previousstudy using the same MEF [31].In hypoxia in Vdac1−/− MEF, we observed both enlarged
mitochondria with abundant cristae and mitochondriasimilar to those in normoxia. The former may reflect theimproved proliferation, thus better bioenergetics of thecells, and the later of mitochondria that had not or couldnot adapt. However, one question remains: how do thesecells survive in normoxia with a low level of glycolysis andrespiration? Fatty acid alpha oxidation by Vdac1−/− MEFcould be a possible explanation. The deficiency in Vdac1in both MEF and RAS-transformed MEF resulted in a
reduction in proliferation in normoxia. Examination of theanalytic technique for assessment of RNAi by similarity(ATARiS) [32], a computational method to assess the ef-fects of gene suppression on cell survival/proliferation, inthe Project Achilles database [33] supported this result. Wespecifically focused on cell lines with K-Ras mutations. TheATARiS gene-level score of dependency showed thatknockout of Vdac1 decreased proliferation, even in humancancer cells driven by oncogenic K-Ras (Additional file 17:Figure S13A). Based on these results, could Vdac1 be aputative cancer driver gene in human cancer? The Can-cer Genome Atlas (TCGA) data sets from 89 cancerstudies were analyzed for gene mutation, deletion, gain,and amplification in the Vdac1 gene with cBioPortal(http://www.cbioportal.org) [34, 35]. The alteration fre-quency varied from 80 to 1 % depending on the type ofcancer. The Vdac1 gene was mainly heterologously lost(light blue) and/or gained (pink). Homologous loss(dark blue) and amplification (red) were also observed,which suggested a putative role in development of hu-man cancers (Additional file 17: Figure S13B). However,Vdac1−/− MEF grew better than Wt MEF in hypoxia,and ERK activation was required. Chan et al. showedthat ROS can participate in the degradation of DUSP6[36]. Since ROS accumulated in Vdac1−/− MEF, due inpart to a decrease in GPX7 expression, DUSP6 was de-graded in normoxia and hypoxia.The data from Vdac1−/− RAS MEF tumors in mice
emphasized two major events: i) destructuration ofblood vessels and ii) inflammation. The increase inendostatin, an inhibitor of angiogenesis that inhibitsendothelial cell proliferation, migration/invasion, andtube formation, may explain the decrease in the numberof blood vessels in these tumors. Moreover, the low levelof VEGFA expression in the Vdac1−/− RAS MEF tumorsreinforced the implication of VDAC1 in vascular devel-opment. This newly identified role of VDAC1 in modu-lating the structure of blood vessels may explain why theexpected Mendelian ratio of 1:2:1 was not observed forheterozygous mice (Vdac1+/−) [5]. Only 40 % of the ex-pected number of Vdac1−/− mice survived and, usingtimed matings, the fetal loss was determined to occurbetween embryonic day 10.5 and 11.5, a time duringwhich blood vessel formation occurs. We speculate that60 % of the Vdac1−/− mice may develop dysfunctionalblood vessels during embryogenesis. Why the other 40 %survive and show no obvious outward signs of deficiencyremains obscure. The Vdac1−/− RAS MEF tumors showedless blood vessels than Wt tumors and exhibited an inflam-matory response that may result from infiltration of redblood cells (RBCs) through permeabilization of theremaining blood vessels. RBCs could serve as a potentialsource of ROS since they contain a large pool of O2
that is autoxidized in a hypoxic microenvironment,

Brahimi-Horn et al. Cancer & Metabolism (2015) 3:8 Page 15 of 18
thereby promoting inflammation [37]. One of the earlyresponses to tissue damage due to ROS is productionof IL-8, a pro-inflammatory cytokine often associatedwith advanced stage cancer and with poor prognosis.RBCs can also bind inflammatory mediators such as IL-8.The mRNA level of Il-8 and Cxcl5 were markedly elevatedin Vdac1−/− RAS MEF, which supports the hypothesis of
Fig. 7 Schematic representation of the impact of Vdac1 knockout (Vdac1−/
in vivo (b). a In normoxia (Nx), the knockout of Vdac1 was associated with(cytochrome C leakage). In hypoxia (Hx), the knockout of Vdac1 maintainedDUSP6 while allowing slight activation of P-ERK. Activated P-ERK effected tb Through production of ROS, which stabilizes HIF-1α, a cascade of eventsand induced an inflammatory response. This cascade will then lead to a pro-tumCDKN2A: cyclin-dependent kinase inhibitor 2A; CxCL5: chemokine (C-X-C motif)
an enhanced inflammatory response. Finally, it has beenshown that RBCs may induce the secretion of matrixmetalloproteinases such as mmp-3 by fibroblasts [38],which impacts on tissue remodeling. Thrombomodulin,a protein that maintains vascular homeostasis via itsanti-inflammatory properties [39], was not expressed inthe Vdac1−/− RAS MEF, so the pro-inflammatory
−) on proliferation and cell death of MEF in vitro (a) and tumor growthproduction of ROS that reduced proliferation and increased apoptosisthe production of ROS but the effect was offset by inhibition of
he activity of COX7A1 and COX4-2, while promoting proliferation.induced (+) or repressed (−) processes that destabilized blood vesselsoral response. αSMA: alpha-smooth muscle actin; THBD: thrombomodulin;ligand 5; IL8: interlukin 8; MMP3: matrix metallopeptidase 3
Brahimi-Horn et al. Cancer & Metabolism (2015) 3:8 Page 16 of 18
activity is likely not repressed. The cascade of eventsleading to tumor development was accompanied by anotable decrease in the mRNA level of Cdkn2A, atumor suppressor gene.While we observed more rapid tumor growth of
Vdac1−/− RAS MEF compared to Wt RAS MEF, a studyusing A549 cells (human lung adenocarcinoma epithelialcells) reported that the silencing of Vdac1 expressionwith siRNA inhibited cancer cell proliferation and tumorgrowth in vivo [40]. However, we used a mouse/mousesystem (tumor/host) while Arif et al. used a human/mouse system (tumor/host). In addition, we used MEFrather than lung cancer cells. Finally and most import-antly, our system was a total knockout of Vdac1 and noton partial and temporary silencing as for siRNA. Isangiogenesis induced in the same way in these tumors?We suggest that the Vdac1−/− RAS MEF adapted andoffset an imbalance in some metabolic, angiogenic, orinflammatory processes to proliferate.
ConclusionsOur study demonstrates that VDAC1 is not just a porethat allows passage of metabolites; it is a major mito-chondrial protein that controls crucial processes in-volved in vital functions such as metabolism and celldeath (Fig. 7). This study provides a rationale for investi-gating VDAC1 as a therapeutic target in both normoxicand hypoxic tissues with tumor characteristics.
Additional files
Additional file 1: Supplemental Materials and Methods.
Additional file 2: Table S1. Main biological functions associated withthe alterations of Vdac1−/− MEF compared to Wt MEF (Wt) in normoxia(Nx) or hypoxia (Hx). Significant categories of (A) diseases and functions,(B) canonical pathways, and (C) upstream regulators associated with thecomparison of wild-type (Wt) and Vdac1−/− MEF in Nx or Hx using IPATM.Activation z-score (cut-off = 2) or –log10 p value (cut-off = 2) are represented.
Additional file 3: Table S2. Main biological functions associated withthe comparison of hypoxic and normoxic conditions in Wt MEF or Vdac1−/−
MEF. Significant categories of (A) diseases and functions, (B) canonicalpathways, and (C) upstream regulators associated with the comparison ofNormoxia (Nx) and hypoxia (Hx) in wild-type (Wt) or Vdac1−/− MEF in usingIPATM. Activation z-score (cut-off = 2) or –log10 p value (cut-off = 2) arerepresented.
Additional file 4: Table S3. Mus musculus dual specificity phosphatase(DUSP) mRNA levels associated with the comparison of hypoxic andnormoxic conditions in Wt MEF or Vdac1−/− MEF.
Additional file 5: Table S4. Mus musculus superoxide dismutase (Sod),glutathione peroxidase (GPX), and catalase (Cat) mRNA levels associatedwith the comparison of hypoxic and normoxic conditions in Wt MEF orVdac1−/− MEF.
Additional file 6: Figure S1. HIF-1α signaling pathway in hypoxicVdac1−/− MEF vs Wt MEF. Red and green color codes for up- and down-regulation, respectively.
Additional file 7: Figure S2. Perturbations in OXPHOS in Vdac1−/− MEF.Ingenuity pathway analysis of the OXPHOX in Vdac1−/− vs Wt MEF in Nxand Hx. Green color codes for down-regulation.
Additional file 8: Figure S3. Cytochrome oxidase expression: (A)Immunofluorescence to COX4-2 in Wt and Vdac1−/− MEF in Nx for 72 hand (B) COX4-2 in Wt and Vdac1−/− MEF in Hx for 72 h in the absence(Ctl) or presence of the MEK inhibitor (PD184352).
Additional file 9: Figure S4. Reactive oxygen species status of Wt andVdac1−/− MEF. (A) Mitochondrial hydrogen peroxide production. (B)Immunoblotting for SOD1, SOD2, and SOD3 of Wt (+) and Vdac1−/− (−)MEF incubated in normoxia or hypoxia for 72 h. β-tubulin was used as aloading control.
Additional file 10: Figure S5. Glutathione peroxidase expression andthe effect of ebselen. (A) Immunofluorescence to GPX7 in Wt and Vdac1−/−
MEF in Nx or Hx for 72 h. (B) Immunoblotting for HIF-1α of Wt and Vdac1−/−
MEF in the absence or presence of ebselen in normoxia. (C) Proliferation ofWt and Vdac1−/− MEF in the absence or presence of ebselen in normoxia.(D) Viability of Wt and Vdac1−/− MEF in the absence or presence of ebselenin normoxia.
Additional file 11: Figure S6. Changes in metabolic pathways inVdac1−/− vs Wt MEF. Ingenuity pathway analysis of the metabolic activityof Vdac1−/− vs Wt MEF in (A) normoxia and (B) hypoxia. Red color codefor up- regulation.
Additional file 12: Figure S7. Glucose and glutamine metabolism.(A) Wt and Vdac1−/− MEF were cultured for 2 days in Nx or Hx in thepresence of 2-deoxy-D-glucose (2DG, 1 μM) or without glucose (−Gluc).The cell number was measured on a Beckman Coulter apparatus (squares).The percentage of cell mortality was measured by trypan blue exclusion(black dots). The mean ± SEM is representative of two independentexperiments carried out in duplicate. (B) The glutamate concentration in themedia of Wt and Vdac1−/− MEF cultured in normoxia (Nx) or hypoxia 1 % O2
(Hx) was measured at day 7 using a YSI 2700 apparatus. Vdac1−/− MEFconvert little or no glutamine into glutamate compared to Wt MEF.
Additional file 13: Figure S8. Knockout of Vdac1 significantly disruptedapoptosis. Immunofluorescence to cytochrome C and DAPI in Wt andVdac1−/− MEF in Nx.
Additional file 14: Figure S9. Autophagy was detected in Vdac1−/−
MEF. (A) Representative images of electron micrographs of Wt and Vdac1−/−
MEF incubated in normoxia (Nx) for 24 h. Vdac1−/− MEF showedautophagosomes with double membranes (arrow). (B) Wt and Vdac1−/−
MEF lysates were analyzed in the absence (−) or presence of chloroquine(CQ) by immunoblotting to LC3. ARD1 was used as a loading control. Theratio of LC3-II/ARD1 was measured.
Additional file 15: Figure S11. Red blood cells are present in Vdac1−/−
RAS MEF tumor tissue. (A) 20 mg of tumor tissue derived from Wt (1, 2, and3) and Vdac1−/− RAS MEF (4, 5, and 6) tumors were resuspended in RLTbuffer before DNA/RNA/protein extraction. (B) Quantification of the numberof blood vessels/microscopic field of CD31-positive vessels ± SEM of tumortissue derived from Wt RAS (1, 2, and 3) and Vdac1−/− RAS MEF (4, 5, and 6).(C) Average of the quantification of CD31-positive vessels ± SEM per micro-scopic field in Wt RAS MEF-derived tumors (Wt RAS MEF) and Vdac1−/− RASMEF-derived tumors (Vdac1−/− RAS MEF). Statistical significance, p < 0.0001.(D) Immunofluorescence to hemoglobin (Hgb) in Vdac1−/− RAS MEF.
Additional file 16: Figure S12. Immunohistochemical staining forVEGFA of tumor sections. (A) Negative control using secondary antibodyonly on Wt RAS MEFs. (B) VEGFA immunodetection in sections of Wt andVdac1−/− RAS MEF-derived tumor using 4X (top panels), 20X (middlepanels), and 40X (bottom panels) magnification.
Additional file 17: Figure S13. VDAC1 expression in human tissuesand cancers. (A) Heatmaps run from blue (low values, more dependency/essentiality) to white to red (high values, less dependency/essentiality).ATARiS gene-level data are median centered and therefore relative withinthe particular gene that is being viewed. (B) The Cancer Genome Atlas(TCGA) data sets of 89 cancer studies analyzed for mutation, deletion,gain, and amplification in the Vdac1 gene with cBioPortal.
Additional file 18: Figure S10. Characterization of RASV12 transformedMEF expressing (WT RAS MEF) or not (Vdac1−/− RAS MEF) Vdac1. (A)Characterization of the growth of Wt and Vdac1−/− RAS MEF incubated inNx or Hx for the indicated number of days. The mean ± SEM is representativeof four independent experiments carried out in duplicate. A p < 0.00001
Brahimi-Horn et al. Cancer & Metabolism (2015) 3:8 Page 17 of 18
shows significant difference from the normoxia for Vdac1−/− RAS MEF. (B)Representative phase contrast photographs of Wt and Vdac1−/− RAS MEFincubated in Nx for 72 h. Scale bars represent X μm. (C) Relative migration ofWt and Vdac1−/− RAS MEF in Nx as evaluated in a xCELLigence system. Themean ± SEM is representative of two independent experiments carriedout in quadruplicate. (D) The extracellular acidification rate (ECAR) in Nxof Wt and Vdac1−/− RAS MEF was evaluated with a Seahorse XFbioenergetic system. Glucose (Glu 10 mM) and oligomycin (Oligo 1 μM)were injected at the indicated times. (E) The oxygen consumption rate(OCR) in Nx for Wt and Vdac1−/− RAS MEF was measured in real timewith a Seahorse XF. Glucose (Glu 10 mM), oligomycin (Oligo 1 μM),carbonilcyanide p-triflouromethoxyphenylhydrazone (FCCP 1 μM), andRotenone/Antimycine A (Rot/AA, 1 μM/1 μM) were injected at theindicated times. The mean ± SEM is representative of three independentexperiments carried out in quadruplicate. (F) Radioresistance of Wt andVdac1−/− RAS MEF cultured for 24 h in Nx or Hx and treated with theindicated dose of radiation. Cell growth was then evaluated with aclonogenic cell survival assay. X-axis: dose of X-radiation (Gy). Y-axis:surviving fraction. The mean ± SEM is representative of two independentexperiments carried out in duplicate. (G) Soft agar assay of Wt and Vdac1−/−
RAS MEF. (H) Tumor weight of Wt (Wt RAS MEF) and Vdac1−/− RAS MEF-derived tumors (Vdac1−/− RAS MEF).
Abbreviations2-Deoxy-D-glucose; αSMA: alpha-smooth muscle actin; ARD1: arrest defective1; ATARiS: analytic technique for assessment of RNAi by similarity;CxCL5: chemokine (C-X-C motif) ligand 5; CDKN2A: cyclin-dependent kinaseinhibitor 2A; COX: cytochrome oxidase; DUSP: dual specificity phosphatase;ECAR: extracellular acidification rate; ERK: extracellular signal-regulated kinase;GPX: glutathione peroxidase; Hx: hypoxia; HIF-1: hypoxia-inducible factor-1;HK: hexokinase; IPATM: ingenuity pathway analysisTM; IL8: interlukin 8; NAC:N-acetyl-L-cysteine; Nx: normoxia; MMP3: matrix metallopeptidase 3; MEF: mouseembryonic fibroblasts; OCR: oxygen consumption rate; ROS: reactive oxygenspecies; SOD: superoxide dismutase; TCGA: The Cancer Genome Atlas;THBD: thrombomodulin; VDAC: voltage-dependent anion channel.
Competing interestsThe authors declare that they have no competing interests.
Authors’ contributionsMCBH and NMM designed and performed the experiments, analyzed thedata, prepared the figures, and wrote the manuscript. TS, WJC, andJPouyssegur provided the tools. SG, JP, IB, FB, EB, CF, and MT performed theexperiments. SLG performed the electron microscopy. AP and BM performedthe IPATM analysis. MI performed the data analysis. Performed allograftexperiments: ES and JES. Performed Immunohistochemistry: BGS. Commentedon the manuscript and analyzed data: WJC and JPouyssegur. All authors readand approved the final manuscript.
AcknowledgementsThis research was supported by grants from the Fondation ARC, Fondationde France, the ANR, the INCA, la Ligue Nationale Contre le Cancer (équipelabellisée LNCC), METOXIA and Canceropôle PACA. The laboratory is fundedby the Centre A. Lacassagne, CNRS, and INSERM. The funders had no role inthe study design, data collection and analysis, decision to publish, orpreparation of the manuscript. We acknowledge the excellent support of theNice-Sophia Antipolis Functional Genomics Platform and the PICMImicroscopy facility of IRCAN. The facility was supported financially by theConseil Général 06, FEDER, Ministère de lEnseignement Supérieur andINSERM. We thank T Rudel of the University of Wuerzburg for theFlag-VDAC1 plasmid and G Rios for microarray hybridization Mircea Ivan'sresearch is supported by NCI R01 CA155332.
Author details1Institute for Research on Cancer and Aging of Nice, CNRS-UMR 7284-InsermU1081, University of Nice Sophia-Antipolis, Centre Antoine Lacassagne, 33Ave de Valombrose, 06189 Nice, France. 2Centre de Recherche enCancérologie de Toulouse, INSERM–UPSIII U1037, Oncopole, Toulouse 31037Cedex 1, France. 3Centre Commun de Microscopie Appliquée, University ofNice Sophia-Antipolis, 28 Ave Valombrose, 06103 Nice, France. 4Department
of Molecular and Human Genetics, Baylor College of Medicine, One BaylorPlaza, MS BCM225, Houston, TX 77030, USA. 5Institute for Research on Cancerand Aging of Nice, CNRS-UMR 7284-Inserm U1081, University of NiceSophia-Antipolis, 28 Ave de Valombrose, 06107 cedex 02 Nice, France.6INSERM U1065, Centre Méditerranéen de Médecine Moléculaire (C3M),Team Cellular and Molecular Physiopathology of Obesity and Diabetes, andUniversity of Nice Sophia-Antipolis, Nice, France. 7Faculté de Médecine,LP2M - CNRS UMR-7370, Université de Nice Sophia Antipolis, 28 Avenue deValombrose, Nice 06107 cedex 2, France. 8Department of Microbiology andImmunology, Indiana University School of Medicine, Indianapolis, IN 46202,USA. 9Institute of Metabolic and Cardiovascular Diseases, INSERM U1048,Rangueil Hospital, 1 Avenue Professeur Jean Poulhes, BP 8422531432 Cedex4 Toulouse, France. 10Institut de Pharmacologie Moléculaire et Cellulaire(IPMC), Centre National de la Recherche Scientifique, CNRS UMR 7275,Sophia Antipolis, & University of Nice Sophia-Antipolis, Nice, France. 11CentreScientifique de Monaco (CSM), Monte Carlo, Sophia Antipolis, Monaco.
Received: 9 January 2015 Accepted: 20 May 2015
References1. Warburg O. On respiratory impairment in cancer cells. Science. 1956;124:269–70.2. Galluzzi L, Kepp O, Trojel-Hansen C, Kroemer G. Mitochondrial control of
cellular life, stress, and death. Circ Res. 2012;111:1198–207. doi:10.1161/CIRCRESAHA.112.268946.
3. Galluzzi L, Kepp O, Kroemer G. Mitochondria: master regulators of dangersignalling. Nature reviews Molecular cell biology. 2012;13:780–8.doi:10.1038/nrm3479.
4. Shoshan-Barmatz V, Mizrachi D. VDAC1: from structure to cancer therapy.Front Oncol. 2012;2:164. doi:10.3389/fonc.2012.00164.
5. Weeber EJ, Levy M, Sampson MJ, Anflous K, Armstrong DL, Brown SE, et al.The role of mitochondrial porins and the permeability transition pore inlearning and synaptic plasticity. The Journal of biological chemistry.2002;277:18891–7. doi:10.1074/jbc.M201649200.
6. Brahimi-Horn MC, Chiche J, Pouyssegur J. Hypoxia and cancer. J. Mol Med(Berl). 2007;85:1301–7. doi:10.1007/s00109-007-0281-3.
7. Brahimi-Horn MC, Mazure NM. Hypoxic VDAC1: a potential mitochondrialmarker for cancer therapy. Advances in experimental medicine and biology.2014;772:101–10. doi:10.1007/978-1-4614-5915-6_5.
8. Lemasters JJ, Holmuhamedov E. Voltage-dependent anion channel (VDAC)as mitochondrial governator–thinking outside the box. Biochimica etbiophysica acta. 1762;2006:181–90. doi:10.1016/j.bbadis.2005.10.006.
9. Brahimi-Horn MC, Lacas-Gervais S, Adaixo R, Ilc K, Rouleau M, Notte A, et al.Local mitochondrial-endolysosomal microfusion cleaves the voltage-dependent anion channel 1 to promote survival in hypoxia. Molecular andcellular biology. 2015. doi:10.1128/MCB.01402-14.
10. Quinlan CL, Perevoshchikova IV, Hey-Mogensen M, Orr AL, Brand MD. Sitesof reactive oxygen species generation by mitochondria oxidizing differentsubstrates. Redox Biol. 2013;1:304–12. doi:10.1016/j.redox.2013.04.005.
11. Wojtala A, Bonora M, Malinska D, Pinton P, Duszynski J, Wieckowski MR.Methods to monitor ROS production by fluorescence microscopy andfluorometry. Methods Enzymol. 2014;542:243–62. doi:10.1016/B978-0-12-416618-9.00013-3.
12. Richard DE, Berra E, Gothie E, Roux D, Pouyssegur J. p42/p44 mitogen-activated protein kinases phosphorylate hypoxia- inducible factor 1alpha(HIF-1alpha) and enhance the transcriptional activity of HIF-1. J Biol Chem.1999;274:32631–7.
13. Bilton R, Mazure N, Trottier E, Hattab M, Dery MA, Richard DE, et al.Arrest-defective-1 protein, an acetyltransferase, does not alter stability ofhypoxia-inducible factor (HIF)-1alpha and is not induced by hypoxia or HIF.J Biol Chem. 2005;280:31132–40.
14. Brahimi-Horn MC, Ben-Hail D, Ilie M, Gounon P, Rouleau M, Hofman V, et al.Expression of a truncated active form of VDAC1 in lung cancer associateswith hypoxic cell survival and correlates with progression to chemotherapyresistance. Cancer research. 2012;72:2140–50. doi:10.1158/0008-5472.CAN-11-3940.
15. Kozjak-Pavlovic V, Ross K, Gotz M, Goosmann C, Rudel T. A tag at thecarboxy terminus prevents membrane integration of VDAC1 in mammalianmitochondria. J Mol Biol. 2010;397:219–32. doi:10.1016/j.jmb.2010.01.047.
16. Cash TP, Pan Y, Simon MC. Reactive oxygen species and cellular oxygensensing. Free Radic Biol Med. 2007;43:1219–25. doi:10.1016/j.freeradbiomed.2007.07.001.

Brahimi-Horn et al. Cancer & Metabolism (2015) 3:8 Page 18 of 18
17. Galanis A, Pappa A, Giannakakis A, Lanitis E, Dangaj D, Sandaltzopoulos R.Reactive oxygen species and HIF-1 signalling in cancer. Cancer Lett.2008;266:12–20. doi:10.1016/j.canlet.2008.02.028.
18. Zepeda AB, Pessoa Jr A, Castillo RL, Figueroa CA, Pulgar VM, Farias JG.Cellular and molecular mechanisms in the hypoxic tissue: role of HIF-1 andROS. Cell Biochem Funct. 2013;31:451–9. doi:10.1002/cbf.2985.
19. Rouiller C. Physiological and pathological changes in mitochondrialmorphology. International review of cytology. 1960;9:227–92.
20. Brand MD, Nicholls DG. Assessing mitochondrial dysfunction in cells. TheBiochemical journal. 2011;435:297–312. doi:10.1042/BJ20110162.
21. Fukuda R, Zhang H, Kim JW, Shimoda L, Dang CV, Semenza GL. HIF-1regulates cytochrome oxidase subunits to optimize efficiency of respirationin hypoxic cells. Cell. 2007;129:111–22. doi:10.1016/j.cell.2007.01.047.
22. Lukyanova LD, Sukoyan GV, Kirova YI. Role of proinflammatory factors, nitricoxide, and some parameters of lipid metabolism in the development ofimmediate adaptation to hypoxia and HIF-1alpha accumulation. Bull ExpBiol Med. 2013;154:597–601.
23. Tajima M, Kurashima Y, Sugiyama K, Ogura T, Sakagami H. The redox stateof glutathione regulates the hypoxic induction of HIF-1. Eur J Pharmacol.2009;606:45–9. doi:10.1016/j.ejphar.2009.01.026.
24. Krauskopf A, Eriksson O, Craigen WJ, Forte MA, Bernardi P. Properties of thepermeability transition in VDAC1(−/−) mitochondria. Biochimica etbiophysica acta. 1757;2006:590–5. doi:10.1016/j.bbabio.2006.02.007.
25. Bryson JM, Coy PE, Gottlob K, Hay N, Robey RB. Increased hexokinaseactivity, of either ectopic or endogenous origin, protects renal epithelialcells against acute oxidant-induced cell death. The Journal of biologicalchemistry. 2002;277:11392–400. doi:10.1074/jbc.M110927200.
26. Shimizu S, Shinohara Y, Tsujimoto Y. Bax and Bcl-xL independently regulateapoptotic changes of yeast mitochondria that require VDAC but notadenine nucleotide translocator. Oncogene. 2000;19:4309–18. doi:10.1038/sj.onc.1203788.
27. Vander Heiden MG, Chandel NS, Schumacker PT, Thompson CB. Bcl-xLprevents cell death following growth factor withdrawal by facilitatingmitochondrial ATP/ADP exchange. Mol Cell. 1999;3:159–67.
28. Vander Heiden MG, Li XX, Gottleib E, Hill RB, Thompson CB, Colombini M.Bcl-xL promotes the open configuration of the voltage-dependent anionchannel and metabolite passage through the outer mitochondrialmembrane. The Journal of biological chemistry. 2001;276:19414–9.doi:10.1074/jbc.M101590200.
29. Alavian KN, Beutner G, Lazrove E, Sacchetti S, Park HA, Licznerski P, et al. Anuncoupling channel within the c-subunit ring of the F1FO ATP synthase isthe mitochondrial permeability transition pore. Proceedings of the NationalAcademy of Sciences of the United States of America. 2014;111:10580–5.doi:10.1073/pnas.1401591111.
30. Michels J, Kepp O, Senovilla L, Lissa D, Castedo M, Kroemer G, et al.Functions of BCL-X L at the interface between cell death and metabolism.Int J Cell Biol. 2013;2013:705294. doi:10.1155/2013/705294.
31. Baines CP, Kaiser RA, Sheiko T, Craigen WJ, Molkentin JD. Voltage-dependent anion channels are dispensable for mitochondrial-dependentcell death. Nature cell biology. 2007;9:550–5. doi:10.1038/ncb1575.
32. Shao DD, Tsherniak A, Gopal S, Weir BA, Tamayo P, Stransky N, et al. ATARiS:computational quantification of gene suppression phenotypes frommultisample RNAi screens. Genome Res. 2013;23:665–78. doi:10.1101/gr.143586.112.
33. Cheung HW, Cowley GS, Weir BA, Boehm JS, Rusin S, Scott JA, et al.Systematic investigation of genetic vulnerabilities across cancer cell linesreveals lineage-specific dependencies in ovarian cancer. Proceedings of theNational Academy of Sciences of the United States of America.2011;108:12372–7. doi:10.1073/pnas.1109363108.
34. Cerami E, Gao J, Dogrusoz U, Gross BE, Sumer SO, Aksoy BA, et al. The cBiocancer genomics portal: an open platform for exploring multidimensionalcancer genomics data. Cancer Discov. 2012;2:401–4. doi:10.1158/2159-8290.CD-12-0095.
35. Gao J, Aksoy BA, Dogrusoz U, Dresdner G, Gross B, Sumer SO. Integrativeanalysis of complex cancer genomics and clinical profiles using thecBioPortal, Sci Signal. 2013. doi:10.1126/scisignal.2004088.
36. Chan DW, Liu VW, Tsao GS, Yao KM, Furukawa T, Chan KK, et al. Loss ofMKP3 mediated by oxidative stress enhances tumorigenicity andchemoresistance of ovarian cancer cells. Carcinogenesis. 2008;29:1742–50.doi:10.1093/carcin/bgn167.
37. Kiefmann R, Rifkind JM, Nagababu E, Bhattacharya J. Red blood cells inducehypoxic lung inflammation. Blood. 2008;111:5205–14. doi:10.1182/blood-2007-09-113902.
38. Fredriksson K, Liu XD, Lundahl J, Klominek J, Rennard SI, Skold CM. Redblood cells increase secretion of matrix metalloproteinases from humanlung fibroblasts in vitro. Am J Physiol Lung Cell Mol Physiol. 2006;290:L326–33.doi:10.1152/ajplung.00057.2005.
39. Conway EM. Thrombomodulin and its role in inflammation. SeminImmunopathol. 2012;34:107–25. doi:10.1007/s00281-011-0282-8.
40. Arif T, Vasilkovsky L, Refaely Y, Konson A, Shoshan-Barmatz V. SilencingVDAC1 expression by siRNA inhibits cancer cell proliferation and tumorgrowth in vivo. Mol Ther Nucleic Acids. 2014;3, e159. doi:10.1038/mtna.2014.9.
Submit your next manuscript to BioMed Centraland take full advantage of:
• Convenient online submission
• Thorough peer review
• No space constraints or color figure charges
• Immediate publication on acceptance
• Inclusion in PubMed, CAS, Scopus and Google Scholar
• Research which is freely available for redistribution
Submit your manuscript at www.biomedcentral.com/submit


![Tamoxifen-inducible cardiac-specific Cre transgenic mouse ...Gene knockout experiments have shown that abnormal development of the heart is the main cause of embryonic lethality [2],](https://img.pdfslide.us/doc/110x75/60b0d139548266047877d3c8/tamoxifen-inducible-cardiac-specific-cre-transgenic-mouse-gene-knockout-experiments.jpg)