Embed Size (px)
Citation preview

#NACAC17
Knocking at the College Door: Projections of High School Graduates Through 2032
Demarée K. MichelauWestern Interstate Commission for Higher Education (WICHE)

#NACAC17
The Western Interstate Commission for Higher Education - WICHE
An interstate compact formed 65 years ago

#NACAC17
WICHE’s Role in the Region
• Promotes access and excellence in higher education for all citizens of the West through:– Regional collaboration
– Resource sharing
– Sound public policy
– Innovation

#NACAC17
Knocking at the College Door: Projections of High School Graduates
• Public and Private High School Graduates
–Nation
– Four Geographical Regions
– 50 States and DC
– First-time projections for Guam/Puerto Rico
• Public by Race/Ethnicity

#NACAC17
U.S. High School Graduates
• The overall number will plateau for most of the next decade
• The racial/ethnic mix of high school graduates will continue to shift significantly toward a more diverse population
• Private high school graduates continue to decline in number and share

#NACAC17
Total U.S. Public and Private High School Graduates, School Years 2000-01 to 2012-13 (Actual) through 2013-14 to 2031-32 (Projected)
2.4
2.6
2.8
3.0
3.2
3.4
3.6
2000-01 2010-11 2020-21 2030-31
Mill
ion
s
3,466,8883,561,051
ACTUAL
PROJECTED

#NACAC17
U.S. Private High School Graduates, School Years 2000-01 to 2010-11 (Actual) through 2011-12 to 2031-32 (Projected)
200
220
240
260
280
300
320
2000-01 2010-11 2020-21 2030-31
Tho
usa
nd
s
222,087
ACTUAL
PROJECTED
302,168

#NACAC17
Total U.S. Public High School Graduates, by Race/Ethnicity, School Years 2000-01 to 2012-13 (Actual) through 2013-14 to 2031-32 (Projected)
Private
2001 2006 2011 2016 2021 2026 2031
White
Hispanic
Black
Asian/Pacific Islander
2,569,200
3,169,2573,317,313
3,076,509

#NACAC17
Converging Populations, 2013-14 to 2031-32
Only showing race/ethnicity for public school graduates (90% of total graduates)
(52%)
(48%)
White
1,725
1,587
Non-White
1,624
1,496
1,100
1,350
1,600
1,850
2,100
2013-14 2016-17 2019-20 2022-23 2025-26 2028-29 2031-32
Tho
usa
nd
s

#NACAC17
United States High School Graduates by Race and Ethnicity, Compared to SY 2012-13 (Thousands)
White
Hispanic
Asian/Pacific Islander
Black
Private schools
-80
-300
-200
-100
0
100
200
300
400
2012-13 2018-19 2024-25 2030-31
Tho
usa
nd
s640 Hispanic184 Asian/Pac. Isl.32 Am. Ind./Alaska Native474 Black298 Private Schools1,839 White
-34-9
+58
+151
-252

#NACAC17
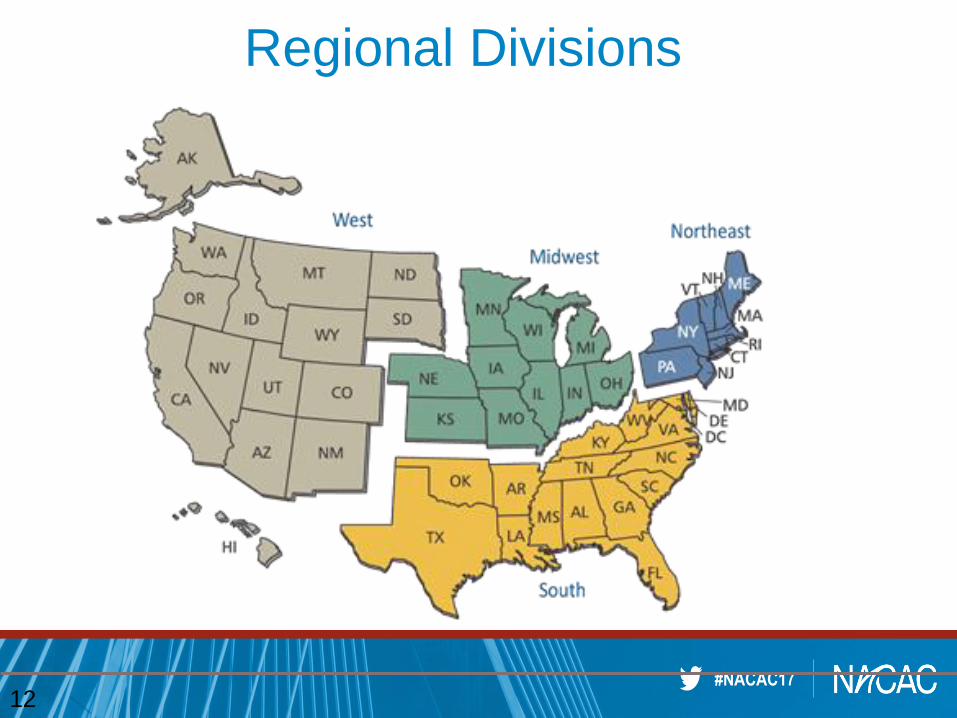
Significant Regional Variation
• The national projections mask
significant variation by region
and among the states.
#NACAC17
Regional Divisions
12

#NACAC17
Significant Regional VariationTotal Public and Private High School Graduates, 2000-01 to 2031-32
0.4
0.6
0.8
1.0
1.2
1.4
2000-01 2010-11 2020-21 2030-31
Mill
ion
s
SOUTH
WEST
MIDWEST
NORTHEAST
1,352,600
862,000
776,820
647,036

#NACAC17
-75
-25
25
75
125
175
2012-13 2018-19 2024-25 2030-31
Tho
usa
nd
s
Southern Region High School Graduates
Compared to SY2012-13(Thousands)
Asian/Pacific IslanderPrivate schools
229 Hispanic39 Asian/Pac. Isl.12 Am. Ind./Alaska Native268 Black96 Private Schools590 White
Private schools
+137K
+99K
-46K-41K
-22K
-5K
+31K

#NACAC17
Western Region High School Graduates
Compared to SY2012-13(Thousands)
-50
-30
-10
10
30
50
70
2012-13 2018-19 2024-25 2030-31
Tho
usa
nd
s
278 Hispanic86 Asian/Pac. Isl.14 Am. Ind./Alaska Native42 Black54 Private Schools356 White
+65K
-39K
-37K
-14K
+3K
-4K+2K
-8K

#NACAC17
Midwestern Region High School GraduatesCompared to SY2012-13
(Thousands)
-100
-80
-60
-40
-20
0
20
40
60
80
2012-13 2018-19 2024-25 2030-31
BlackAsian/Pacific Islander
Private schools
56 Hispanic23 Asian/Pac. Isl.4 Am. Ind./Alaska Native88 Black64 Private Schools527 White
Tho
usa
nd
s
+39K
+22K
-75K-82K
-17K
-9K
+12K

#NACAC17
-100
-80
-60
-40
-20
0
20
40
60
80
2012-13 2018-19 2024-25 2030-31
Tho
usa
nd
s
Northeastern Region High School Graduates
Compared to SY2012-13(Thousands)
BlackAsian/Pacific Islander
Hispanic
BlackAsian/Pacific Islander
Private schools
Hispanic
Black
Asian/Pacific Islander
Private schools
76 Hispanic37 Asian/Pac. Isl.2 Am. Ind./Alaska Native76 Black84 Private Schools365 White
Tho
usa
nd
s
+45K+35K
+17K
-10K
-25K
-94K
-60K

#NACAC17
Top 10 States with a Majority of U.S. High School Graduates
In 2013 From 2013 to 2025 From 2025 to 2032
CA 456,000 -25,000 -5% -37,000 -9%
TX 314,000 61,000 19% -6,000 -2%
NY 212,000 2,000 1% -14,000 -7%
FL 176,000 17,000 10% -16,000 -8%
IL 153,000 -10,000 -7% -18,000 -13%
PA 146,000 -6,000 -4% -8,000 -6%
OH 135,000 -16,000 -12% -9,000 -8%
MI 111,000 -14,000 -13% -10,000 -10%
NJ 109,000 -6,000 -6% -12,000 -12%
NC 101,000 9,000 9% -8,000 -7%
See pp. 22-23, 28-29 and Appendix A Data Tables of Knocking full report

#NACAC17
See Knocking pages 20-23 for Top 10 States & state annual change.
State Variation in Percent Change of High School Graduates, 2013- 2025
Nation: 4.7%

#NACAC17
See Knocking pages 20-23 for Top 10 States & state annual change.
State Variation in Percent Change of High School Graduates, 2013-2030
Nation: -4.0%
#NACAC17
Implications
Kent Rinehart
Assistant Vice President for Enrollment Management/Dean of Admission
Marist College (New York)
Janet Marling
Vice President for Student AffairsUniversity of North Georgia (Georgia)
Brenda Poznanski
Director of School Counseling and AdmissionBishop Guertin High School (New Hampshire)

#NACAC17
Want to Learn More?
www.wiche.edu/knocking
Demarée K. Michelau
Vice President, Policy Analysis and Research
303.541.0223
#knocking2016