Embed Size (px)
Citation preview
KNITTING EFFECTIVE PARTNERSHIPS
Tutoring Partnership Resources
Contents:
Tutoring Partnership Literature Review: Best Practices for Tutoring Programs [excerpt]
Tutoring Partnership Map
Evaluation Philosophy and Framework
Data-sharing Agreement [excerpt]
Literacy Tutoring Network Charter [excerpt]
Math Network Program Matrix
Effort vs. Impact Matrix
Academic Skill-Building Program Quality Assessment Overview
Sample Data Portfolio [excerpt]
Sample Aggregate Report
Professional Development Schedule

BEST PRACTICES FOR TUTORING PROGRAMSa guide to qualityFOUNDATION
Saint Paul Public Schools
inspire. innovate. involve. invest.
FOUNDATIONSaint Paul Public Schools
inspire. innovate. involve. invest.
FOUNDATIONSaint Paul Public Schools
inspire. innovate. involve. invest.
™
™
™
Copyright © 2011 by Saint Paul Public Schools Foundation
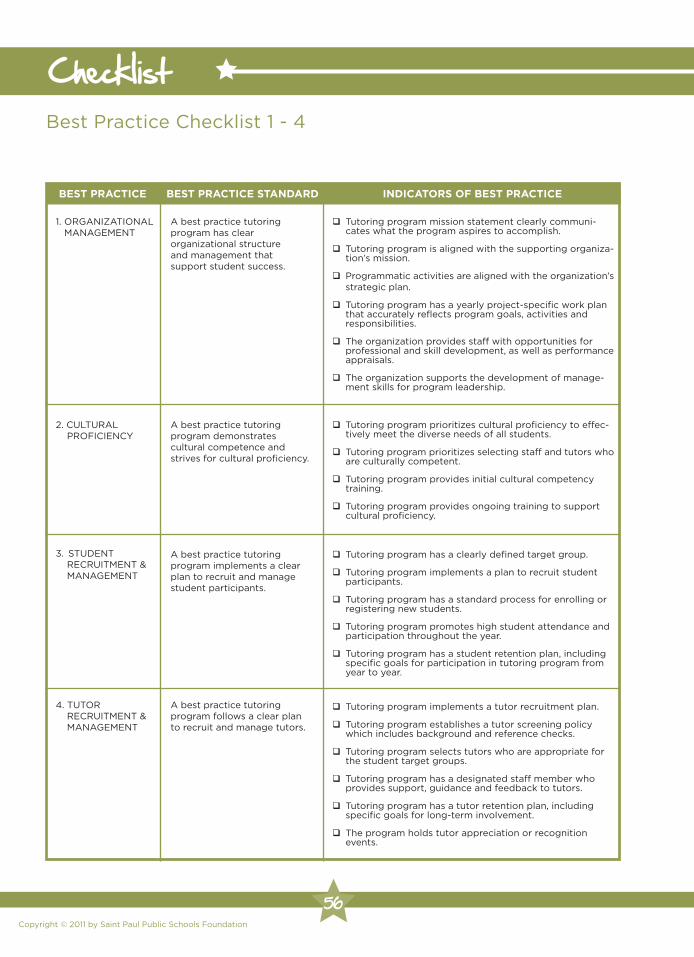
Best Practice Checklist 1 - 4
BEST PRACTICE BEST PRACTICE STANDARD INDICATORS OF BEST PRACTICE
q Tutoring program mission statement clearly communi- cates what the program aspires to accomplish.
q Tutoring program is aligned with the supporting organiza- tion’s mission.
q Programmatic activities are aligned with the organization’s strategic plan.
q Tutoring program has a yearly project-specific work plan that accurately reflects program goals, activities and responsibilities.
q The organization provides staff with opportunities for professional and skill development, as well as performance appraisals.
q The organization supports the development of manage- ment skills for program leadership.
q Tutoring program prioritizes cultural proficiency to effec- tively meet the diverse needs of all students.
q Tutoring program prioritizes selecting staff and tutors who are culturally competent.
q Tutoring program provides initial cultural competency training.
q Tutoring program provides ongoing training to support cultural proficiency.
q Tutoring program has a clearly defined target group.
q Tutoring program implements a plan to recruit student participants.
q Tutoring program has a standard process for enrolling or registering new students.
q Tutoring program promotes high student attendance and participation throughout the year.
q Tutoring program has a student retention plan, including specific goals for participation in tutoring program from year to year.
q Tutoring program implements a tutor recruitment plan.
q Tutoring program establishes a tutor screening policy which includes background and reference checks.
q Tutoring program selects tutors who are appropriate for the student target groups.
q Tutoring program has a designated staff member who provides support, guidance and feedback to tutors.
q Tutoring program has a tutor retention plan, including specific goals for long-term involvement.
q The program holds tutor appreciation or recognition events.
A best practice tutoring program has clear organizational structure and management that support student success.
1. ORGANIZATIONAL MANAGEMENT
2. CULTURAL PROFICIENCY
3. STUDENT RECRUITMENT & MANAGEMENT
4. TUTOR RECRUITMENT & MANAGEMENT
A best practice tutoring program demonstrates cultural competence and strives for cultural proficiency.
A best practice tutoring program implements a clear plan to recruit and manage student participants.
A best practice tutoring program follows a clear plan to recruit and manage tutors.
Checklist
56
Copyright © 2011 by Saint Paul Public Schools Foundation
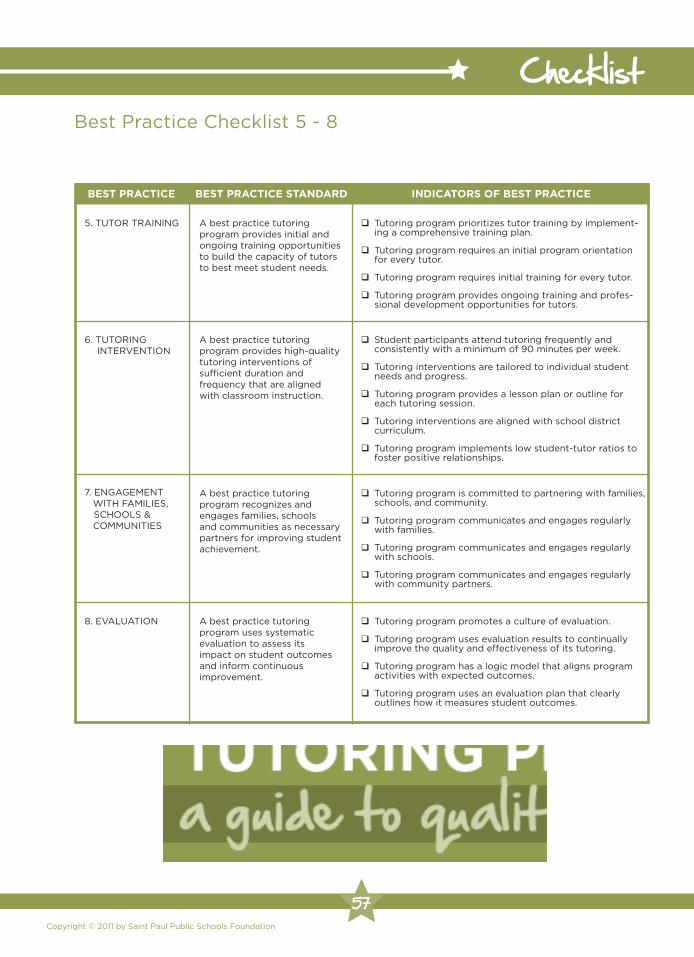
Best Practice Checklist 5 - 8
BEST PRACTICE BEST PRACTICE STANDARD INDICATORS OF BEST PRACTICE
q Tutoring program prioritizes tutor training by implement- ing a comprehensive training plan.
q Tutoring program requires an initial program orientation for every tutor.
q Tutoring program requires initial training for every tutor.
q Tutoring program provides ongoing training and profes- sional development opportunities for tutors.
A best practice tutoring program provides initial and ongoing training opportunities to build the capacity of tutors to best meet student needs.
5. TUTOR TRAINING
q Tutoring program promotes a culture of evaluation.
q Tutoring program uses evaluation results to continually improve the quality and effectiveness of its tutoring.
q Tutoring program has a logic model that aligns program activities with expected outcomes.
q Tutoring program uses an evaluation plan that clearly outlines how it measures student outcomes.
8. EVALUATION A best practice tutoring program uses systematic evaluation to assess its impact on student outcomes and inform continuous improvement.
q Student participants attend tutoring frequently and consistently with a minimum of 90 minutes per week.
q Tutoring interventions are tailored to individual student needs and progress.
q Tutoring program provides a lesson plan or outline for each tutoring session.
q Tutoring interventions are aligned with school district curriculum.
q Tutoring program implements low student-tutor ratios to foster positive relationships.
6. TUTORING INTERVENTION
A best practice tutoring program provides high-quality tutoring interventions of sufficient duration and frequency that are aligned with classroom instruction.
q Tutoring program is committed to partnering with families, schools, and community.
q Tutoring program communicates and engages regularly with families.
q Tutoring program communicates and engages regularly with schools.
q Tutoring program communicates and engages regularly with community partners.
7. ENGAGEMENT WITH FAMILIES, SCHOOLS & COMMUNITIES
A best practice tutoring program recognizes and engages families, schools and communities as necessary partners for improving student achievement.
Checklist
57

1. ACES2. Breakthrough Twin Cities3. Central Community Services4. Cherokee Park United Church5. CommonBond Communities6. East Side Learning Center7. Hmong American Partnership8. LDA Minnesota
9. Keystone Community Services10. Neighborhood House11. Project for Pride in Living12. Mid-Continent Oceanographic Institute13. Saint Paul Area Council of Churches14. Saint Paul Public Libraries15. ServeMinnesota Action Network (Reading Corps and Math Corps, serving SPPS, preK-8)16. The Sanneh Foundation17. Twin Cities Housing Development Co.18. Volunteers of America- MN19. West 7th Community Center20. YWCA of St. Paul
!
!
!
!
!
!
")
")
")
")
")
")")
")
")
")
")")
")
")
")
") !
!
!!
")
") !Chelsea Heights
")
")!!
Washington
! ")Como Park
!
") !Central
")Harding!
")!!Hazel Park Prep
")
! ")Riverview
! ")Johnson
!")Bruce Vento
")
")!
")
")
") !
Four Season's A+
!Hamline")
")
")")
")")
")
")
")")
") ")
")
")
")
")
")")
")
")
")
")
Humboldt
Highland Park
FarnsworthUpper
Linwood
Farnsworth Lower
Obama
Monroe
JacksonMaxfield
John A. Johnson
St. Paul Music Academy
!
Tutoring Partnership 2014 - 2015
SPPS Foundation, May 2014 Data Source: ESRI, TIGER, SPPS Projection: UTM 15N
1318
1
2
6
6
19
6
6
9
105
3 517 5
5
1614
14
14
14
14
14
14
1414
14
14
1416
14
! Elementary School! Middle School! Secondary School
11
1216 18
16
16
1
12
4
16
1118
8
18
161
1
8
1
1
18
13
13
13
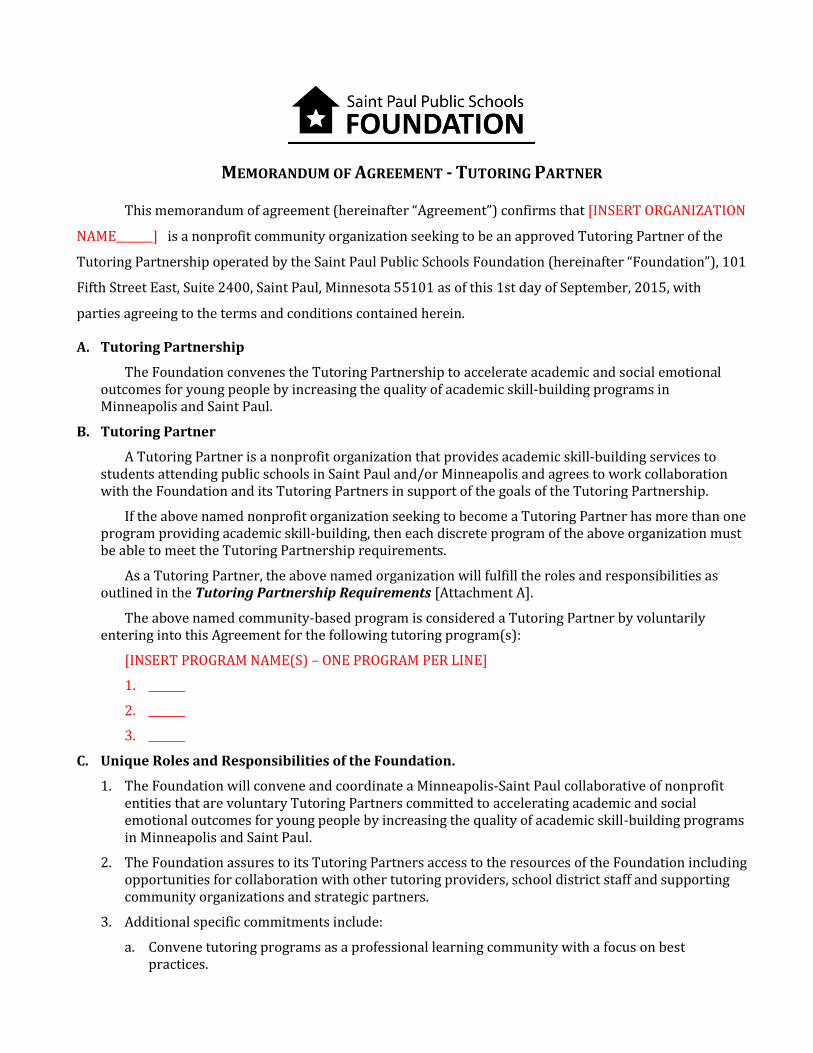
Tutoring Partnership: Philosophy of Evaluation
Tutoring Partnership Mission: To accelerate academic and social emotional outcomes for young people by increasing the quality of academic skill-building programs in Saint Paul and Minneapolis.
Goals
The Tutoring Partnership is a collaborative of community organizations that provides professional development, tutor
training, and technical assistance to tutoring programs in order to achieve the following goals:
(1) Ensure high-quality skill-building opportunities for young people.
(2) Increase academic skills for young people.
(3) Increase social emotional skills for young people.
Role of Evaluation
Evaluation is one of the Best Practices for Tutoring Programs1 and a central component of the continuous quality
improvement philosophy of the Tutoring Partnership. This philosophy guides our support of tutoring programs and is
grounded in the following principles:
We value the utilization of evaluation results, which are used first and foremost to improve.
The commitment to continuous quality improvement is how we hold ourselves and our partners accountable.
Evaluation is ongoing and cyclical; we are continually learning how we can improve.
Evaluation is embedded in the work we do, as opposed to a stand-alone activity.
Evaluation processes and tools must be culturally relevant.
Data is generated by a variety of stakeholders and is both qualitative and quantitative.
We build the capacity of all Foundation and Tutoring Partner staff to conduct evaluation and utilize results.
We are transparent with our evaluation results while respecting and maintaining the data privacy of
individuals.
Multi-pronged Approach
Evaluation results are used to improve the work of the Foundation, the work of our Tutoring Partners and ultimately,
the outcomes of the students we serve. Our evaluation efforts occur at the following levels:
Tutoring Partnership [systems-level]
Tutoring Partners [program-level]
Program Participants [student-level]
Our evaluation framework (see reverse side) outlines the measurements at each of these levels. The learning that
occurs as a result of our evaluation efforts is shared with all stakeholders, allowing us to scale effective practices and
improve our impact on the lives of students.
1 Bixby, K.E., Gordon, E.E., Gozali-Lee, E., Gray Akyea, S. & Nippolt, P.L. (2011). Best Practices for Tutoring Programs: A Guide to Quality. Saint Paul, MN: Saint Paul Public Schools Foundation.

Tutoring Partnership Evaluation Framework
Level Tool What It Measures Data Collection Method
Tutoring Partnership
Tutoring Partnership Survey Support, benefits, etc. Survey Monkey
Tutor training evaluations Quality of tutor trainings Surveys at end of training Professional development workshop evaluations
Quality of professional development workshops Surveys at end of workshop
Tutor surveys Tutor support, recruitment, training Survey Monkey
Tutoring Partners
Academic Skill-Building Program Quality Assessment (YPQA/APQA) Program quality at point of service
External observational assessments and self-assessments
Best Practice Self-Assessment Implementation of Best Practices for Tutoring Programs Survey Monkey
Program report cards Demographics, aggregate growth, aggregate proficiency SPPS data
Program profiles Tutoring program model and intervention type Fillable form
Site visits Technical assistance needs Interview and observation
Tutor surveys Program support and management of tutors Survey Monkey
Dosage overview Participation, frequency and duration Program data (Sprockets database, Excel, etc.)
Students
Academic Outcomes
MCA Proficiency in reading and math SPPS/MPS data
MAP Growth in reading and math from fall to spring SPPS/MPS data
FAST (or similar assessment)
Growth from fall to spring and benchmarks in reading and math
Pre- and post-assessments given by program staff; tracked in FAST online system
Mondo Growth from fall to spring and benchmarks in literacy SPPS data
Non-Academic Outcomes
SAYO Non-cognitive/social-emotional skills Pre- and post-surveys given by program staff
Student surveys Non-cognitive/social-emotional skills Pre- and post-surveys given by program staff/school districts
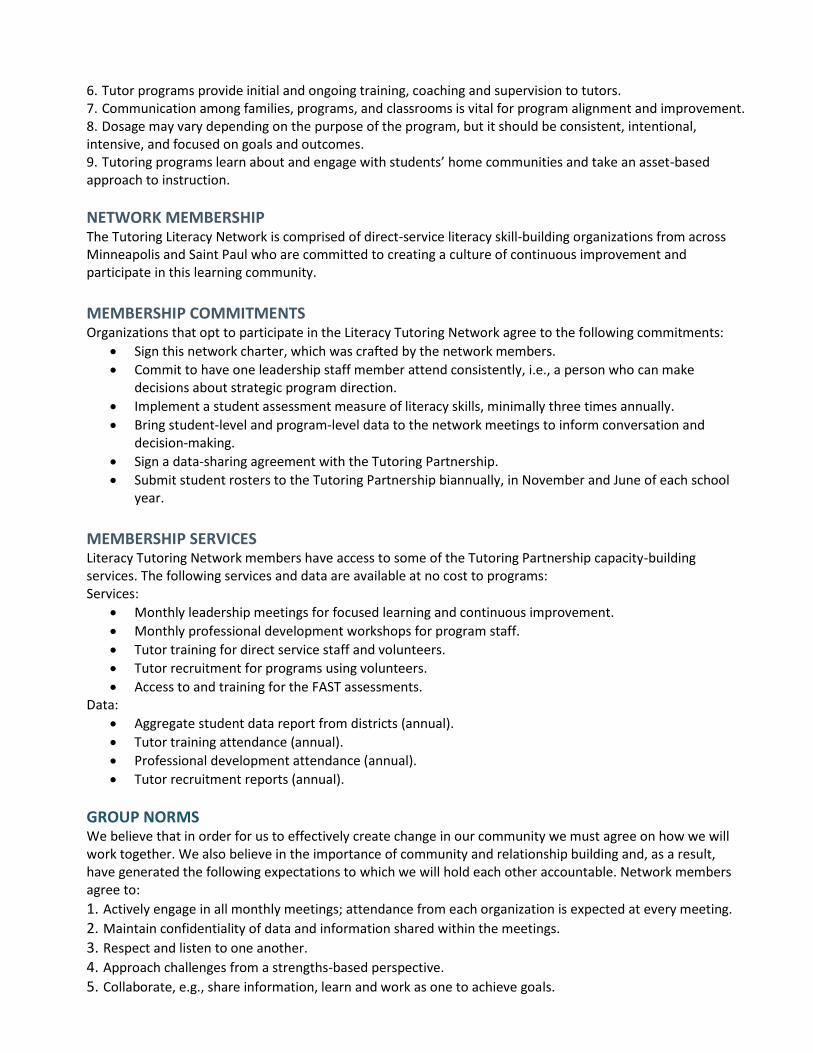
MEMORANDUM OF AGREEMENT - TUTORING PARTNER This memorandum of agreement (hereinafter “Agreement”) confirms that [INSERT ORGANIZATION
NAME ] is a nonprofit community organization seeking to be an approved Tutoring Partner of the
Tutoring Partnership operated by the Saint Paul Public Schools Foundation (hereinafter “Foundation”), 101
Fifth Street East, Suite 2400, Saint Paul, Minnesota 55101 as of this 1st day of September, 2015, with
parties agreeing to the terms and conditions contained herein.
A. Tutoring Partnership
The Foundation convenes the Tutoring Partnership to accelerate academic and social emotional outcomes for young people by increasing the quality of academic skill-building programs in Minneapolis and Saint Paul.
B. Tutoring Partner
A Tutoring Partner is a nonprofit organization that provides academic skill-building services to students attending public schools in Saint Paul and/or Minneapolis and agrees to work collaboration with the Foundation and its Tutoring Partners in support of the goals of the Tutoring Partnership.
If the above named nonprofit organization seeking to become a Tutoring Partner has more than one program providing academic skill-building, then each discrete program of the above organization must be able to meet the Tutoring Partnership requirements.
As a Tutoring Partner, the above named organization will fulfill the roles and responsibilities as outlined in the Tutoring Partnership Requirements [Attachment A].
The above named community-based program is considered a Tutoring Partner by voluntarily entering into this Agreement for the following tutoring program(s):
[INSERT PROGRAM NAME(S) – ONE PROGRAM PER LINE]
1.
2.
3.
C. Unique Roles and Responsibilities of the Foundation.
1. The Foundation will convene and coordinate a Minneapolis-Saint Paul collaborative of nonprofit entities that are voluntary Tutoring Partners committed to accelerating academic and social emotional outcomes for young people by increasing the quality of academic skill-building programs in Minneapolis and Saint Paul.
2. The Foundation assures to its Tutoring Partners access to the resources of the Foundation including opportunities for collaboration with other tutoring providers, school district staff and supporting community organizations and strategic partners.
3. Additional specific commitments include:
a. Convene tutoring programs as a professional learning community with a focus on best practices.

Literacy Tutoring Network Charter
CONTEXT The Generation Next Literacy Tutoring Network believes in the power of collective impact—that we are stronger together than on our own. With Generation Next as our backbone initiative, we seek to align our work with the tenants of collective impact: a common agenda, shared measurement, mutually reinforcing activities and continuous communication. Our network goal is to increase third grade reading proficiency, knowing that reading skills are a means to a greater end. We are committed to developing confident, competent, motivated and respected young readers. We will make this happen by implementing practices that reinforce equity and privilege the child and family. We value a culture of inquiry and will create a space where knowledge can be shared, received, and affirmed. We believe our shared knowledge reveals patterns and lessons that cannot emerge when we work in isolation. Positive relationships are critical to our success as a network and our success with youth. We are committed to continuous quality improvement as individuals and organizations. We believe that each of us is a learner in this process and that everyone’s lived experience is relevant. When we are engaged and validated, growth will emerge. In 2015, in the cities of Minneapolis and Saint Paul only 38% [40% in Minneapolis and 36% in Saint Paul] of children in 3rd grade met reading proficiency standards. Furthermore, significant proficiency gaps exist in Minneapolis and Saint Paul between ethnic and racial groups. Third grade reading proficiency for Black, Latino, Native American and Asian students hovers between 21% and 28% compared with white students at 69%.1
In order to increase reading skills and help develop confident, competent, motivated and respected young readers, the Literacy Tutoring Network is committed to using data to drive practices that result in all children reading at grade level by the end of 3rd grade, ensuring that every child has the crucial skills to thrive and be ready for future success.
GUIDING PRINCIPLES The following principles were developed by the network and will guide the work of the group: 1. There are many layers and models of supports for student success, including schools, families and community programs. All are important. 2. Successful literacy interventions target literacy skills and build on the classroom instruction to provide a cohesive learning framework. 3. Tutoring programs use a range of data and ongoing progress monitoring to provide clear content to tutors that matches students’ need(s). 4. Out-of-school time programs supplement and enhance in-school reading instruction. 5. Tutoring programs provide systematic structures and use research and/or evidence-based instruction for content delivery, pacing and materials.
1 Generation Next. (2015). “3rd Grade Reading Data.” Retrieved from
http://www.gennextmsp.org/data/3rd-grade-reading-benchmarks/.
6. Tutor programs provide initial and ongoing training, coaching and supervision to tutors. 7. Communication among families, programs, and classrooms is vital for program alignment and improvement. 8. Dosage may vary depending on the purpose of the program, but it should be consistent, intentional, intensive, and focused on goals and outcomes. 9. Tutoring programs learn about and engage with students’ home communities and take an asset-based approach to instruction.
NETWORK MEMBERSHIP
The Tutoring Literacy Network is comprised of direct-service literacy skill-building organizations from across Minneapolis and Saint Paul who are committed to creating a culture of continuous improvement and participate in this learning community.
MEMBERSHIP COMMITMENTS Organizations that opt to participate in the Literacy Tutoring Network agree to the following commitments:
Sign this network charter, which was crafted by the network members.
Commit to have one leadership staff member attend consistently, i.e., a person who can make decisions about strategic program direction.
Implement a student assessment measure of literacy skills, minimally three times annually.
Bring student-level and program-level data to the network meetings to inform conversation and decision-making.
Sign a data-sharing agreement with the Tutoring Partnership.
Submit student rosters to the Tutoring Partnership biannually, in November and June of each school year.
MEMBERSHIP SERVICES Literacy Tutoring Network members have access to some of the Tutoring Partnership capacity-building services. The following services and data are available at no cost to programs: Services:
Monthly leadership meetings for focused learning and continuous improvement.
Monthly professional development workshops for program staff.
Tutor training for direct service staff and volunteers.
Tutor recruitment for programs using volunteers.
Access to and training for the FAST assessments. Data:
Aggregate student data report from districts (annual).
Tutor training attendance (annual).
Professional development attendance (annual).
Tutor recruitment reports (annual).
GROUP NORMS We believe that in order for us to effectively create change in our community we must agree on how we will work together. We also believe in the importance of community and relationship building and, as a result, have generated the following expectations to which we will hold each other accountable. Network members agree to:
1. Actively engage in all monthly meetings; attendance from each organization is expected at every meeting.
2. Maintain confidentiality of data and information shared within the meetings.
3. Respect and listen to one another.
4. Approach challenges from a strengths-based perspective.
5. Collaborate, e.g., share information, learn and work as one to achieve goals.
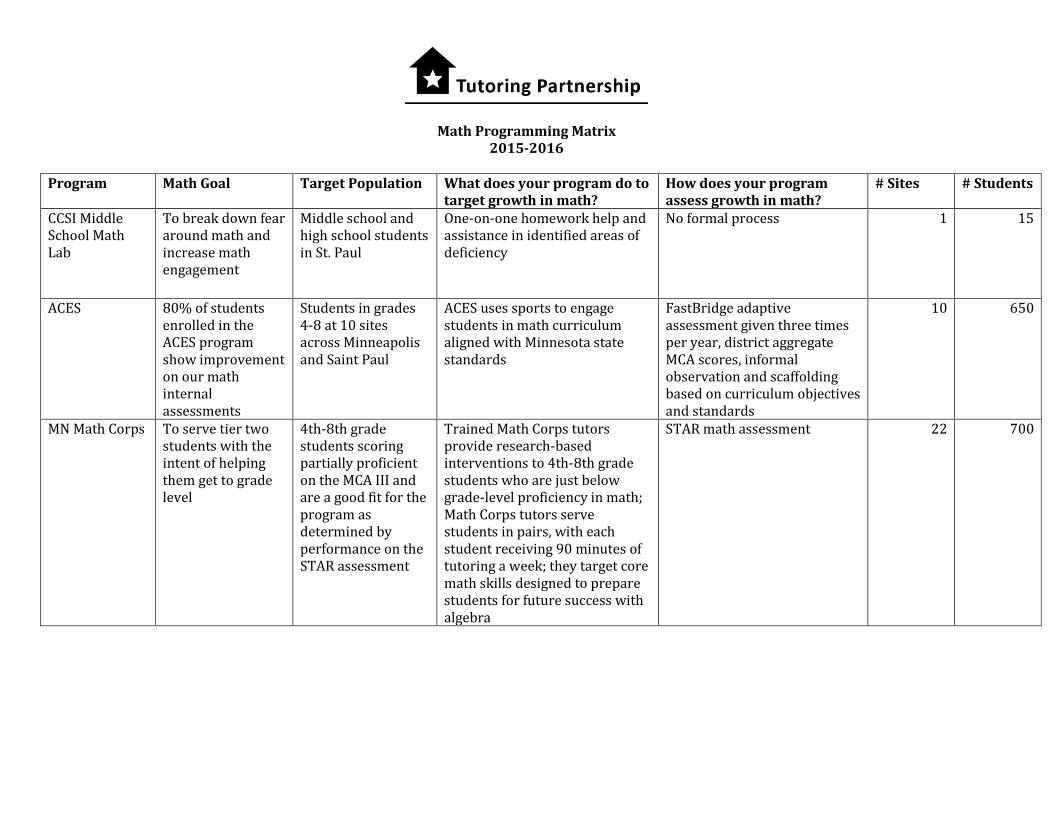
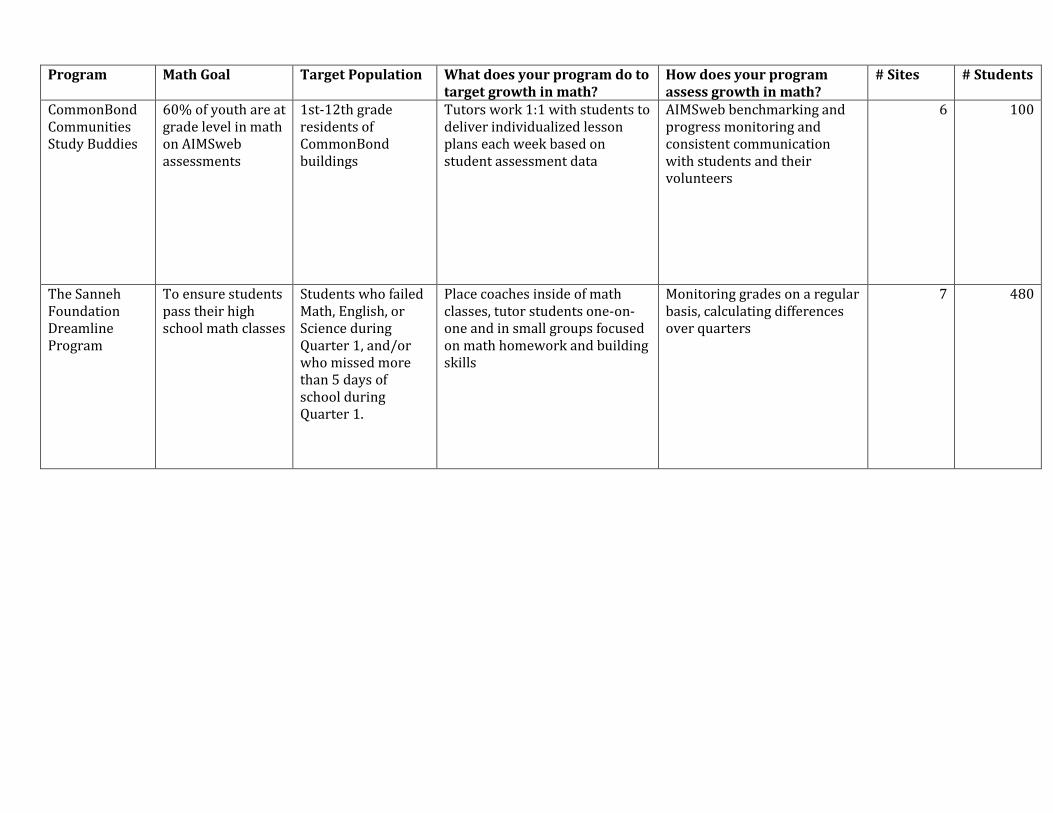
Math Programming Matrix 2015-2016
Program Math Goal Target Population What does your program do to
target growth in math? How does your program assess growth in math?
# Sites # Students
CCSI Middle School Math Lab
To break down fear around math and increase math engagement
Middle school and high school students in St. Paul
One-on-one homework help and assistance in identified areas of deficiency
No formal process 1
15
ACES 80% of students enrolled in the ACES program show improvement on our math internal assessments
Students in grades 4-8 at 10 sites across Minneapolis and Saint Paul
ACES uses sports to engage students in math curriculum aligned with Minnesota state standards
FastBridge adaptive assessment given three times per year, district aggregate MCA scores, informal observation and scaffolding based on curriculum objectives and standards
10 650
MN Math Corps To serve tier two students with the intent of helping them get to grade level
4th-8th grade students scoring partially proficient on the MCA III and are a good fit for the program as determined by performance on the STAR assessment
Trained Math Corps tutors provide research-based interventions to 4th-8th grade students who are just below grade-level proficiency in math; Math Corps tutors serve students in pairs, with each student receiving 90 minutes of tutoring a week; they target core math skills designed to prepare students for future success with algebra
STAR math assessment 22 700
Program Math Goal Target Population What does your program do to target growth in math?
How does your program assess growth in math?
# Sites # Students
CommonBond Communities Study Buddies
60% of youth are at grade level in math on AIMSweb assessments
1st-12th grade residents of CommonBond buildings
Tutors work 1:1 with students to deliver individualized lesson plans each week based on student assessment data
AIMSweb benchmarking and progress monitoring and consistent communication with students and their volunteers
6 100
The Sanneh Foundation Dreamline Program
To ensure students pass their high school math classes
Students who failed Math, English, or Science during Quarter 1, and/or who missed more than 5 days of school during Quarter 1.
Place coaches inside of math classes, tutor students one-on-one and in small groups focused on math homework and building skills
Monitoring grades on a regular basis, calculating differences over quarters
7 480
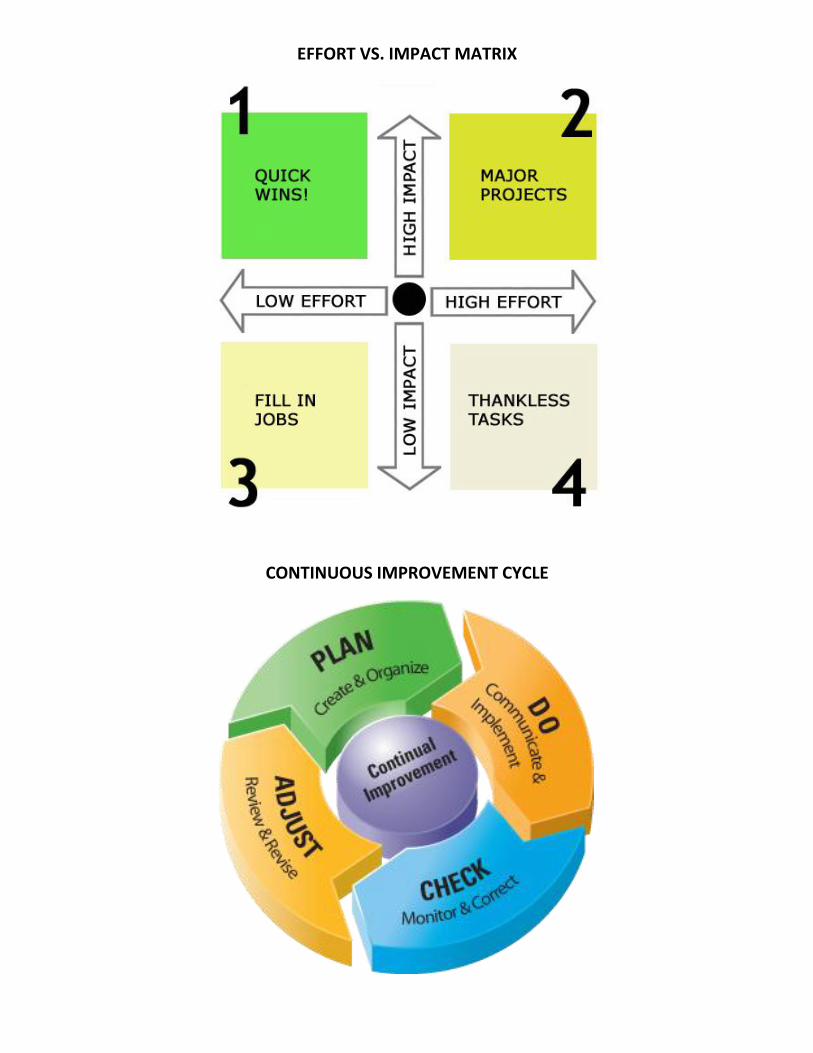
EFFORT VS. IMPACT MATRIX
CONTINUOUS IMPROVEMENT CYCLE

301 W Michigan Ave | Suite 200 | Ypsilanti, Michigan 48197 | Phone: 734.961.6900 | www.cypq.org The David P. Weikart Center for Youth Program Quality is a division of The Forum for Youth Investment.
Academic Skill-Building A Supplement to the Youth Program
Quality Assessment (PQA)
Background & Overview This improved tool measures the quality of academic
interventions and can help organizations close academic
achievement gaps. The persistent achievement gap in
educational outcomes between white students and
students of color as well as between low-income students
and students from affluent families is well documented
across the nation. i , ii , iii Students of color and low-income
students not only lag in reading and math proficiency, but
they are at higher risk of dropping out of high school and
less likely to enter higher education and complete a degree. iv In the rapidly evolving economy, young people need to be
more skilled and educated than ever before.v
Out-of-school time (OST) programming can be an effective
means of tackling the achievement gap. Research has
shown that OST programs have significant positive effects
on grades and test scores as well as behavior and social-
emotional skills for at-risk youth.vi,vii,viii However, programs
must be high quality; a meta-analysis of OST programs
finds that mediocre and low-quality programs actually
hinder student progress.ix
In late 2013, with support from Youthprise, the Weikart
Center partnered with the Saint Paul Public Schools
Foundation to develop a tool for use with their partners that
provide tutoring. The tool measures the quality of academic
supports in youth programs.
The Academic Skill-Building Program Quality Assessment
(Academic Skill-Building PQA) is a supplemental tool to the
Youth and School-Age Program Quality Assessments
(PQA).
Recommendations for Use The Academic Skill-Building PQA is best used in programs
that provide academic supports to youth. However, a
version will be developed that is intended for use in any
skill-building program – including non-academic content.
The tool can be used as a supplement to the Youth or
School PQA for low-stakes program self assessment,
external assessment, or as a set of standards for training,
planning and improvement purposes.
Supports Available or In Development Handbook
Training for use in external assessment
Webinar-based supports
External Assessor Reliability training
Excel-based scores reporter
Online scores reporter (Fall 2014)
2 Methods workshops (Fall 2014/Spring 2015)
ACADEMIC SKILL-BUILDING
PQA SCALES Active Engagement
Multiple modalities
Youth control materials
Encouragement Substantive dialogue
Mark progress
Targeted Learning Explicit learning target
Connect with school content
Academic skill focus
Out-of-setting practice
Scaffolding Identify skill components
Model skills
Gauge challenge level
Verbally guide discovery
Learning How to Learn Youth problem-solve
Youth identify learning strategy
Effort-achievement beliefs
Higher Order Thinking Skills Youth evaluate their work
Staff extends knowledge
Youth extend knowledge
Connect to other knowledge
Use creativity & imagination
attention, practice or persistence
301 W Michigan Ave | Suite 200 | Ypsilanti, Michigan 48197 | Phone: 734.961.6900 | www.cypq.org The David P. Weikart Center for Youth Program Quality is a division of The Forum for Youth Investment.
i Vanneman, A., Hamilton, L., Baldwin Anderson, J. & Rahman, T. (2009).
Achievement Gaps: How Black and White Students in Public Schools
Perform in Mathematics and Reading on the National Assessment of
Education al Progress. Washington, DC: National Center for Education
Statistics, Institute of Education Sciences, U.S. Department of Education. ii Hemphill, F.C. & Vanneman, A. (2011). Achievement Gaps: How Hispanic
and White Students in Public Schools Perform in Mathematics and
Reading on the National Assessment of Education al Progress.
Washington, DC: National Center for Education Statistics, Institute of
Education Sciences, U.S. Department of Education. iii Reardon, F. (2011). The widening achievement gap between the rich and
the poor: new evidence and possible explanations. In G.J. Duncan & R.
Murnane, (Eds.), Whither Opportunity? Rising Inequality and Uncertain Life
Chances of Low-Income Children. New York: Russell Sage Foundation
Press. iv Ross, T., Kena, G., Rathbun, A., KewalRamani, A., Zhang, J., Kristapovich,
P., and Manning, E. (2012). Higher Education: Gaps in Access and
Persistence Study (NCES 2012-046). U.S. Department of Education,
National Center for Education Statistics. Washington, DC: Government
Printing Office. v Symonds, W.C., Schwartz, R.B. & Ferguson, R. (2011). Pathways to
Prosperity: Meeting the Challenge of Preparing Young Americans for the
21st Century. Cambridge, MA: Pathways to Prosperity Project, Harvard
Graduate School of Education. vi Vandell, D.L., Reisner, E. & Pierce, K. (2007). Outcomes linked to high-
quality afterschool programs: Longitudinal findings from the study of
promising practices. Irvine, CA: University of California and Washington,
DC: Policy Studies Associates. vii Harvard Family Research Project (2009). Supporting student outcomes
through expanded learning opportunities. Cambridge, MA: Little, P.M. viii Durlak, J.A. & Weissberg, R.P. (2012). Afterschool programs that follow
evidence-based practices to promote social and emotional development
are effective. C.S. Mott Foundation: Compendium on Expanded Learning. ix Belle, D. (1999). The after-school lives of children: Alone and with others
while parents work. Mahwah, NJ: Lawrence Erlbaum Associates, Inc.
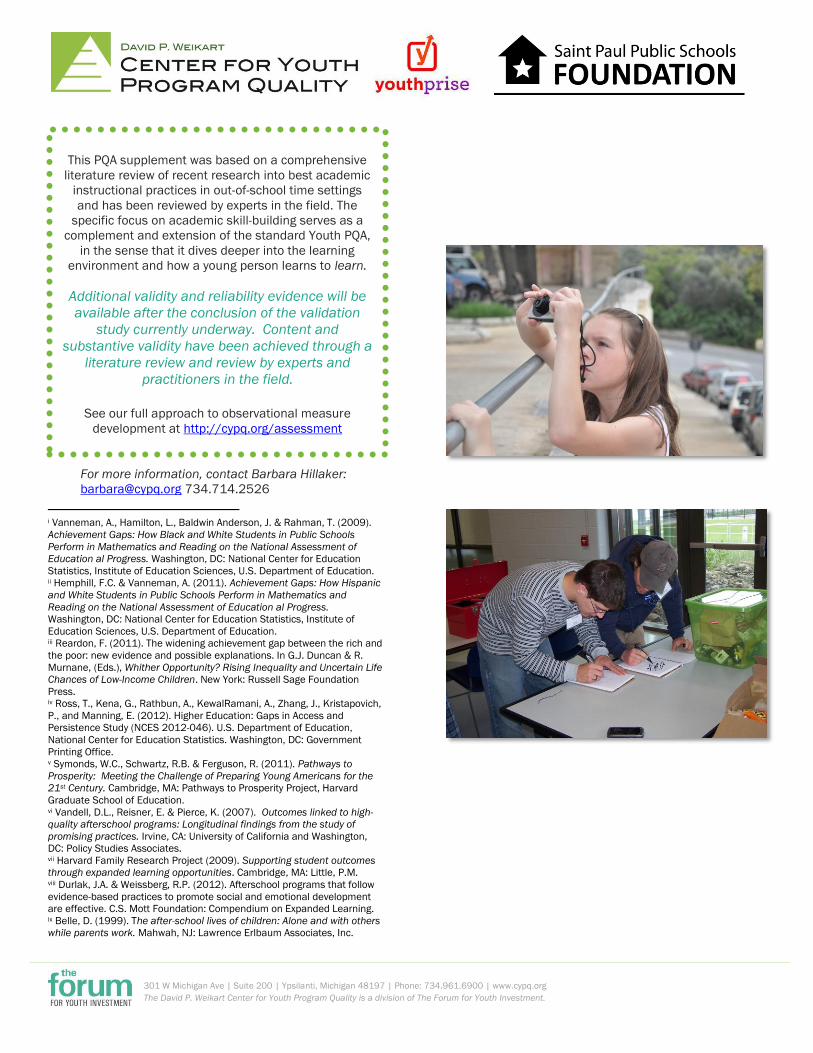
This PQA supplement was based on a comprehensive
literature review of recent research into best academic
instructional practices in out-of-school time settings
and has been reviewed by experts in the field. The
specific focus on academic skill-building serves as a
complement and extension of the standard Youth PQA,
in the sense that it dives deeper into the learning
environment and how a young person learns to learn.
Additional validity and reliability evidence will be
available after the conclusion of the validation
study currently underway. Content and
substantive validity have been achieved through a
literature review and review by experts and
practitioners in the field.
See our full approach to observational measure
development at http://cypq.org/assessment
For more information, contact Barbara Hillaker:
[email protected] 734.714.2526

Report prepared by the Saint Paul Public Schools Foundation Tutoring Partnership
June 2015
ABC Education
ABC Tutoring Program Data Portfolio
Report prepared by the Saint Paul Public Schools Foundation Tutoring Partnership June 2015
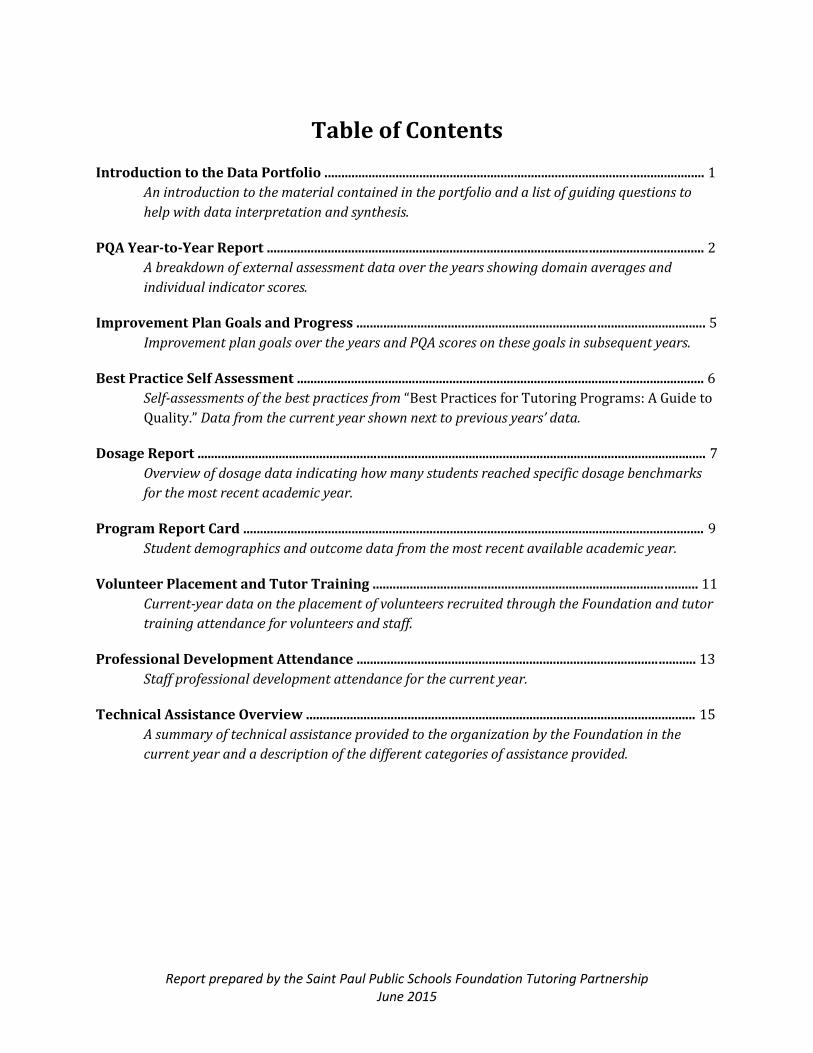
Table of Contents
Introduction to the Data Portfolio ................................................................................................................ 1
An introduction to the material contained in the portfolio and a list of guiding questions to
help with data interpretation and synthesis.
PQA Year-to-Year Report ................................................................................................................................. 2
A breakdown of external assessment data over the years showing domain averages and
individual indicator scores.
Improvement Plan Goals and Progress ....................................................................................................... 5
Improvement plan goals over the years and PQA scores on these goals in subsequent years.
Best Practice Self Assessment ........................................................................................................................ 6
Self-assessments of the best practices from “Best Practices for Tutoring Programs: A Guide to
Quality.” Data from the current year shown next to previous years’ data.
Dosage Report ...................................................................................................................................................... 7
Overview of dosage data indicating how many students reached specific dosage benchmarks
for the most recent academic year.
Program Report Card ........................................................................................................................................ 9
Student demographics and outcome data from the most recent available academic year.
Volunteer Placement and Tutor Training ................................................................................................ 11
Current-year data on the placement of volunteers recruited through the Foundation and tutor
training attendance for volunteers and staff.
Professional Development Attendance .................................................................................................... 13
Staff professional development attendance for the current year.
Technical Assistance Overview ................................................................................................................... 15
A summary of technical assistance provided to the organization by the Foundation in the
current year and a description of the different categories of assistance provided.

Report prepared by the Saint Paul Public Schools Foundation Tutoring Partnership June 2015
Introduction to the Data Portfolio This data portfolio provides an overview of your program’s data related to your participation in the
Tutoring Partnership. It includes numbers and information from program assessments, training
attendance, student participation and more. The report should be used and interpreted for
formative purposes within your program; it should not be used to draw causal conclusions about
the impact or quality of the program. It is important to note that people conducting program quality
assessments (both external and self) may have changed over the years, accounting for some
variance in numerical scores on certain items. In addition, some assessment tools have had changes
to criteria for certain scores, which could account for variance. Year ranges are measured from July
1st of the first year to June 30th of the second year to contain the full school year period.
This portfolio is intended to be a working document that can be updated and added to as time progresses. As you examine the information within, you can use the following questions to facilitate a discussion within your organization. The data contained provides an opportunity to zoom out and consider program progress and quality on a broader scale.
What trends or patterns do you see in the data?
What surprises you in the data?
What additional data or information do you have that can inform this data?
Are there areas where you see consistent program improvement over the years?
Are there areas where program improvement goals have not been met?
Does the data reflect your day-to-day experience?
Are there lessons learned over the years that you can see coming out in this data?
What questions do you still have about the data?
1
Report prepared by the Saint Paul Public Schools Foundation Tutoring Partnership
June 2015
TUTORING PARTNER 2012-2015 Program Quality Data
Network Tutoring Partnership
Organization ABC Education
Program ABC Tutoring Program
Site XYZ Elementary School
School Year 2012-2013, 2013-2014, Fall 2014, Spring 2015
Evaluator Kara Bixby (2012-2013 & 2013-2014), Maggie Kane (Fall 2014 & Spring 2015)
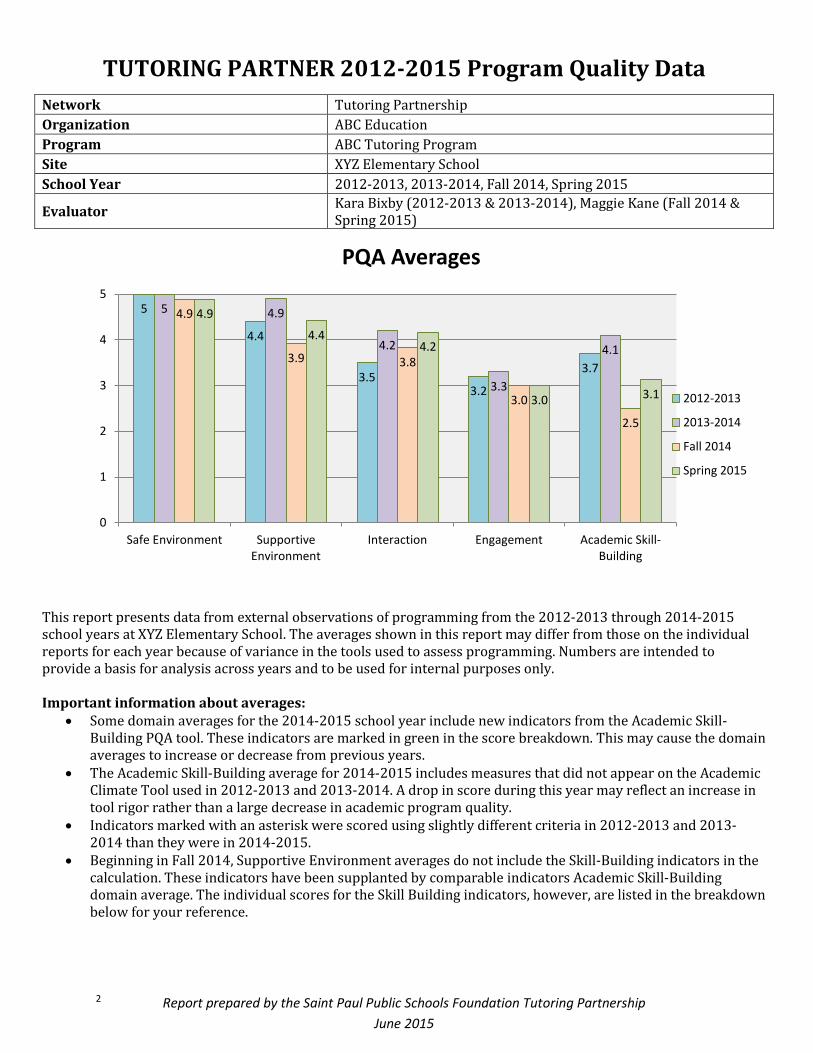
This report presents data from external observations of programming from the 2012-2013 through 2014-2015 school years at XYZ Elementary School. The averages shown in this report may differ from those on the individual reports for each year because of variance in the tools used to assess programming. Numbers are intended to provide a basis for analysis across years and to be used for internal purposes only.
Important information about averages:
Some domain averages for the 2014-2015 school year include new indicators from the Academic Skill-Building PQA tool. These indicators are marked in green in the score breakdown. This may cause the domain averages to increase or decrease from previous years.
The Academic Skill-Building average for 2014-2015 includes measures that did not appear on the Academic Climate Tool used in 2012-2013 and 2013-2014. A drop in score during this year may reflect an increase in tool rigor rather than a large decrease in academic program quality.
Indicators marked with an asterisk were scored using slightly different criteria in 2012-2013 and 2013-2014 than they were in 2014-2015.
Beginning in Fall 2014, Supportive Environment averages do not include the Skill-Building indicators in the calculation. These indicators have been supplanted by comparable indicators Academic Skill-Building domain average. The individual scores for the Skill Building indicators, however, are listed in the breakdown below for your reference.
5
4.4
3.5 3.2
3.7
5 4.9
4.2
3.3
4.1
4.9
3.9 3.8
3.0
2.5
4.9
4.4 4.2
3.0 3.1
0
1
2
3
4
5
Safe Environment Supportive Environment
Interaction Engagement Academic Skill-Building
PQA Averages
2012-2013
2013-2014
Fall 2014
Spring 2015
2

Report prepared by the Saint Paul Public Schools Foundation Tutoring Partnership
June 2015
Program Quality Assessment Scores
Scale Indicator 2012
to 2013
2013 to
2014
Fall 2014
Spring 2015
Key
Decrease from prior year Increase from prior year NS Not scored
Safe
En
viro
nm
en
t
Emotional Safety Positive emotional climate 5 3 3 5
Mutual respect and inclusion 5 5 5 5
Healthy Environment
Free of health and safety hazards 5 5 5 5
Clean and sanitary 5 5 5 5
Ventilation and lighting adequate 5 5 5 5
Comfortable temperature 5 5 5 5
Emergency Preparedness
Written procedures in view 3 5 5 5
Fire extinguisher accessible 3 5 5 5
First aid kit accessible and visible 3 5 5 3
Other safety and emergency equipment available X X X X
Entrances to indoor space supervised 3 3 3 5
Entrances to outdoor space supervised X X X 5
Accommodating Environment
Program space allows freedom of movement 5 5 5 5
Program space is suitable for all activities 3 5 5 5
Furniture is comfortable and of sufficient quality 5 5 5 5
Physical environment can be modified 5 5 5 5
Furniture appropriate to children’s physical size 5
5 5 5
Nourishment
Drinking water is available and accessible 5 5 5 5
Food and drinks are plentiful and available X 5 5 5
Available food and drink is healthy X 5 5 5
Sup
po
rtiv
e En
viro
nm
en
t
Warm Welcome
All children are greeted by staff 3 3 5 5
Staff uses warm tone of voice and respectful language 5 3 3 5
Staff uses positive body language 5 5 5 5
Session Flow
Session starts and ends within 10min of scheduled time 5 3 5 5
Staff has all materials and supplies ready 5 5 5 5
There are enough materials and supplies 5 5 5 5
Staff explains all activities clearly 5 5 5 5
There is appropriate time for all activities 3 3 5 3
Active Engagement
Activities involve engagement with materials or ideas 3 3 5 3
Structured opportunity to talk 3 3 3 5
Staff has children make a connection 5 1 3 5
Staff presents content using three or more modalities* 5 3 5 5
Staff allows children to control or handle materials NS NS 5 5
Skill-Building
Staff tells children specific focus of session or activity 3 1 1 5
Staff encourages children to try out skills 5 3 5 5
Staff models skills 3 1 3 1
Staff breaks tasks into smaller steps 1 1 1 3
Staff provides learning supports or encouragement 3 3 5 5
3
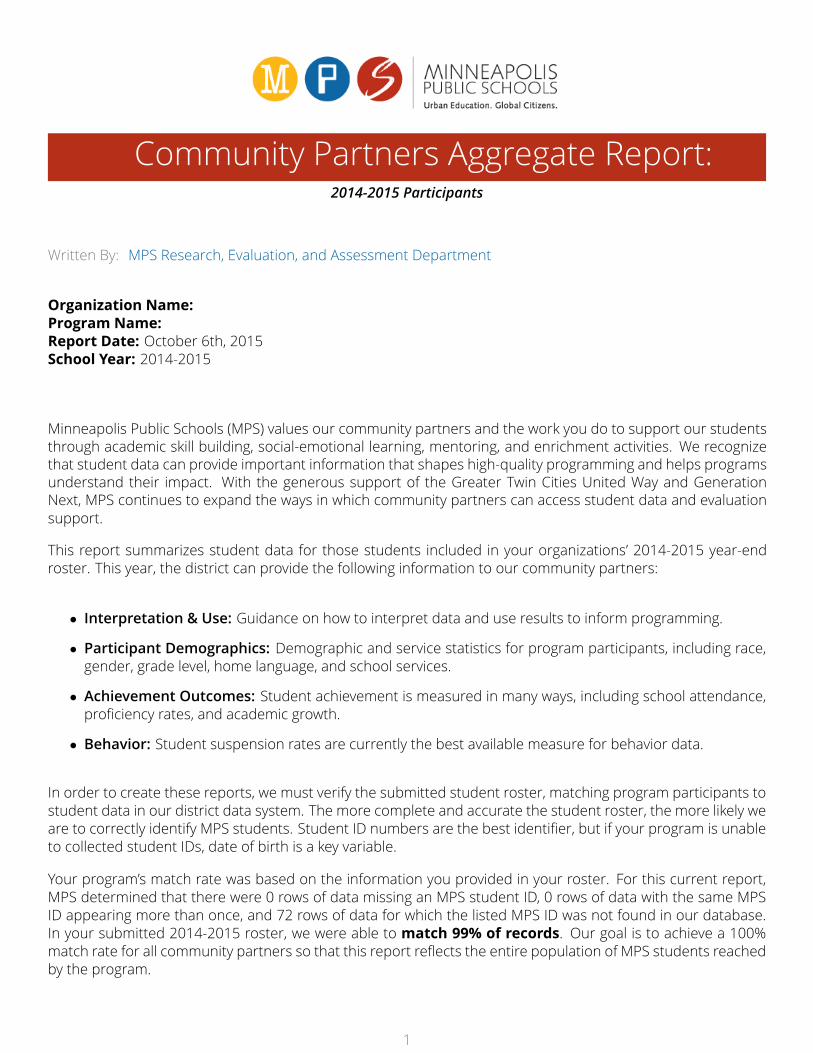
Community Partners Aggregate Report:2014-2015 Participants
Written By: MPS Research, Evaluation, and Assessment Department
Organization Name: Program Name: Report Date: October 6th, 2015School Year: 2014-2015
Minneapolis Public Schools (MPS) values our community partners and the work you do to support our students through academic skill building, social-emotional learning, mentoring, and enrichment activities. We recognize that student data can provide important information that shapes high-quality programming and helps programs understand their impact. With the generous support of the Greater Twin Cities United Way and Generation Next, MPS continues to expand the ways in which community partners can access student data and evaluation support.This report summarizes student data for those students included in your organizations’ 2014-2015 year-end roster. This year, the district can provide the following information to our community partners:
• Interpretation & Use: Guidance on how to interpret data and use results to inform programming.• Participant Demographics: Demographic and service statistics for program participants, including race,gender, grade level, home language, and school services.• Achievement Outcomes: Student achievement is measured in many ways, including school attendance,proficiency rates, and academic growth.• Behavior: Student suspension rates are currently the best available measure for behavior data.
In order to create these reports, we must verify the submitted student roster, matching program participants tostudent data in our district data system. The more complete and accurate the student roster, the more likely weare to correctly identify MPS students. Student ID numbers are the best identifier, but if your program is unableto collected student IDs, date of birth is a key variable.Your program’s match rate was based on the information you provided in your roster. For this current report,MPS determined that there were 0 rows of data missing an MPS student ID, 0 rows of data with the same MPSID appearing more than once, and 72 rows of data for which the listed MPS ID was not found in our database.In your submitted 2014-2015 roster, we were able to match 99% of records. Our goal is to achieve a 100%match rate for all community partners so that this report reflects the entire population of MPS students reachedby the program.
1
Interpretation & UseThis report combines student-level data across all grade levels and schools for those students included in yourroster who matched a record in the MPS data system.Because many factors influence the outcomes reported here, this report should be used and interpretedfor formative purposes within your program, not to draw causal conclusions about the impact ofyour program. There may be programmatic factors that shape the implementation of your program, (e.g.dosage, curriculum, staff training, and fidelity of the model). In addition, many external factors affect studentperformance (e.g. income, family engagement, family stability, and school experience). As a result, it is inaccurateto solely attribute student outcomes to one factor, such as participation in the program.As you examine the report, you can use the following questions to facilitate a discussion within your organization.While the data cannot be used tomake causal claims, it can help your organization have important conversationsthat inform programmatic decisions.
• What trends or patterns do you see in the data?• What surprises you in the data?• Are these overall results reflected in your day-to-day practice with students?• What additional data or information do you have that can supplement this data?• What questions do you still have about the data?• How does this data compare to your program goals? Are you on track to achieve them?• Why might you be seeing these results?• What factors (internal and external) contribute to the experiences of your students?
Questions?Email: [email protected] Call: Maren Henderson, Evaluation Specialist: (612) 668-0582
2
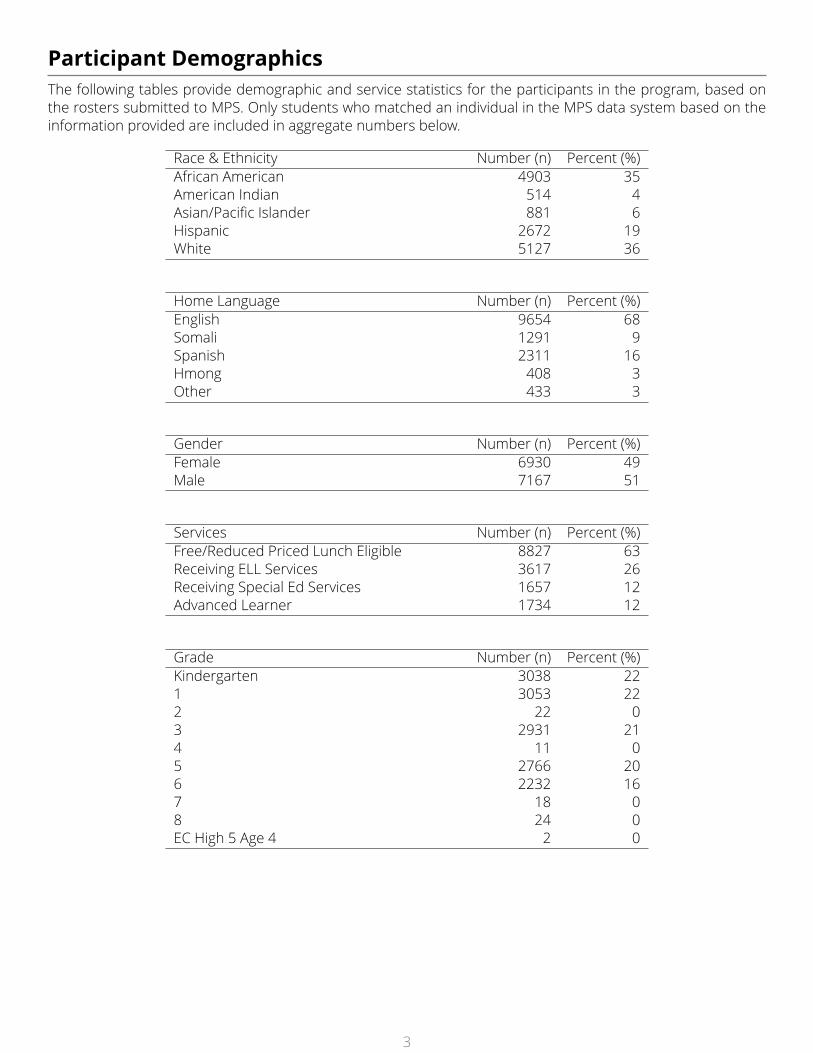
Participant DemographicsThe following tables provide demographic and service statistics for the participants in the program, based onthe rosters submitted to MPS. Only students who matched an individual in the MPS data system based on theinformation provided are included in aggregate numbers below.
Race & Ethnicity Number (n) Percent (%)African American 4903 35American Indian 514 4Asian/Pacific Islander 881 6Hispanic 2672 19White 5127 36
Home Language Number (n) Percent (%)English 9654 68Somali 1291 9Spanish 2311 16Hmong 408 3Other 433 3
Gender Number (n) Percent (%)Female 6930 49Male 7167 51
Services Number (n) Percent (%)Free/Reduced Priced Lunch Eligible 8827 63Receiving ELL Services 3617 26Receiving Special Ed Services 1657 12Advanced Learner 1734 12
Grade Number (n) Percent (%)Kindergarten 3038 221 3053 222 22 03 2931 214 11 05 2766 206 2232 167 18 08 24 0EC High 5 Age 4 2 0
3
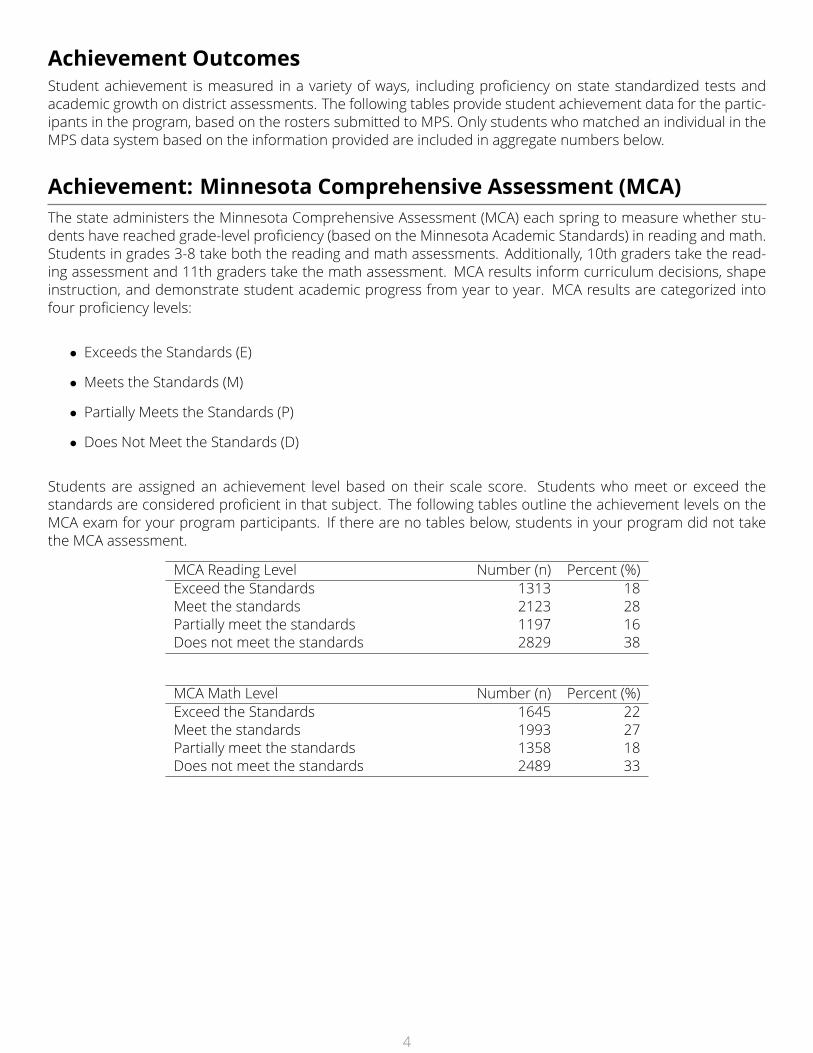
Achievement OutcomesStudent achievement is measured in a variety of ways, including proficiency on state standardized tests andacademic growth on district assessments. The following tables provide student achievement data for the partic-ipants in the program, based on the rosters submitted to MPS. Only students who matched an individual in theMPS data system based on the information provided are included in aggregate numbers below.Achievement: Minnesota Comprehensive Assessment (MCA)The state administers the Minnesota Comprehensive Assessment (MCA) each spring to measure whether stu-dents have reached grade-level proficiency (based on the Minnesota Academic Standards) in reading and math.Students in grades 3-8 take both the reading and math assessments. Additionally, 10th graders take the read-ing assessment and 11th graders take the math assessment. MCA results inform curriculum decisions, shapeinstruction, and demonstrate student academic progress from year to year. MCA results are categorized intofour proficiency levels:
• Exceeds the Standards (E)• Meets the Standards (M)• Partially Meets the Standards (P)• Does Not Meet the Standards (D)
Students are assigned an achievement level based on their scale score. Students who meet or exceed thestandards are considered proficient in that subject. The following tables outline the achievement levels on theMCA exam for your program participants. If there are no tables below, students in your program did not takethe MCA assessment.MCA Reading Level Number (n) Percent (%)Exceed the Standards 1313 18Meet the standards 2123 28Partially meet the standards 1197 16Does not meet the standards 2829 38
MCA Math Level Number (n) Percent (%)Exceed the Standards 1645 22Meet the standards 1993 27Partially meet the standards 1358 18Does not meet the standards 2489 33
4
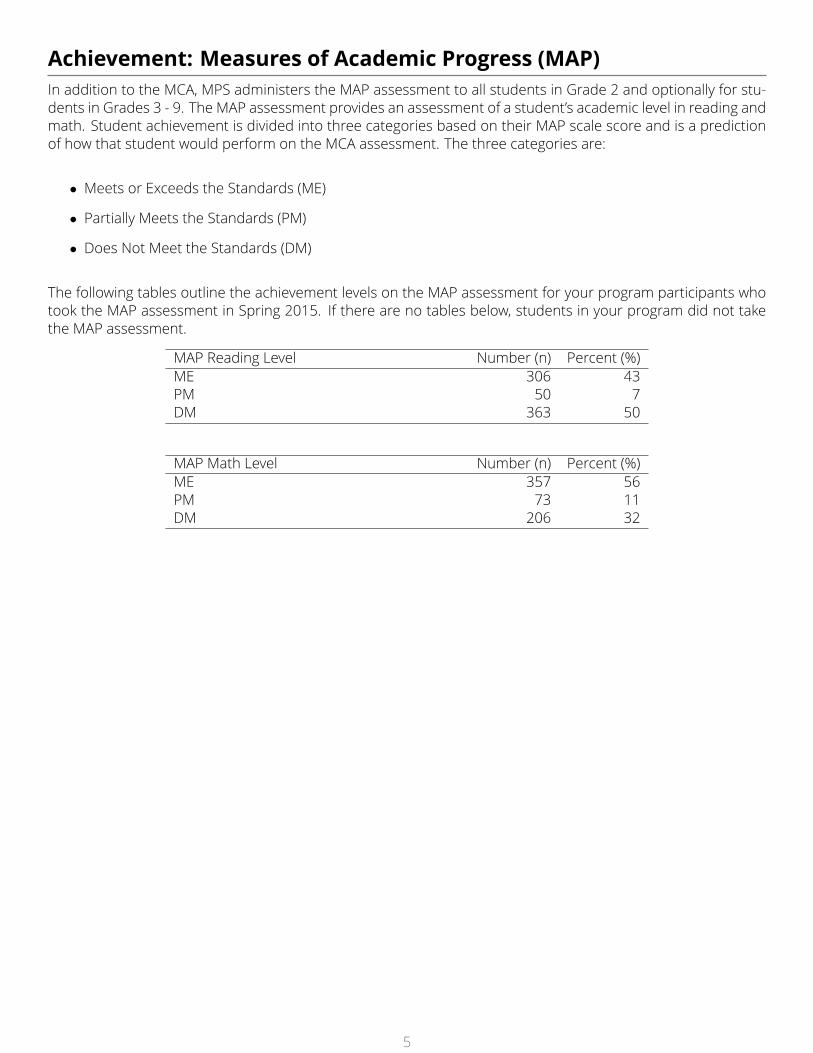
Achievement: Measures of Academic Progress (MAP)In addition to the MCA, MPS administers the MAP assessment to all students in Grade 2 and optionally for stu-dents in Grades 3 - 9. The MAP assessment provides an assessment of a student’s academic level in reading andmath. Student achievement is divided into three categories based on their MAP scale score and is a predictionof how that student would perform on the MCA assessment. The three categories are:
• Meets or Exceeds the Standards (ME)• Partially Meets the Standards (PM)• Does Not Meet the Standards (DM)
The following tables outline the achievement levels on the MAP assessment for your program participants whotook the MAP assessment in Spring 2015. If there are no tables below, students in your program did not takethe MAP assessment.MAP Reading Level Number (n) Percent (%)ME 306 43PM 50 7DM 363 50
MAP Math Level Number (n) Percent (%)ME 357 56PM 73 11DM 206 32
5
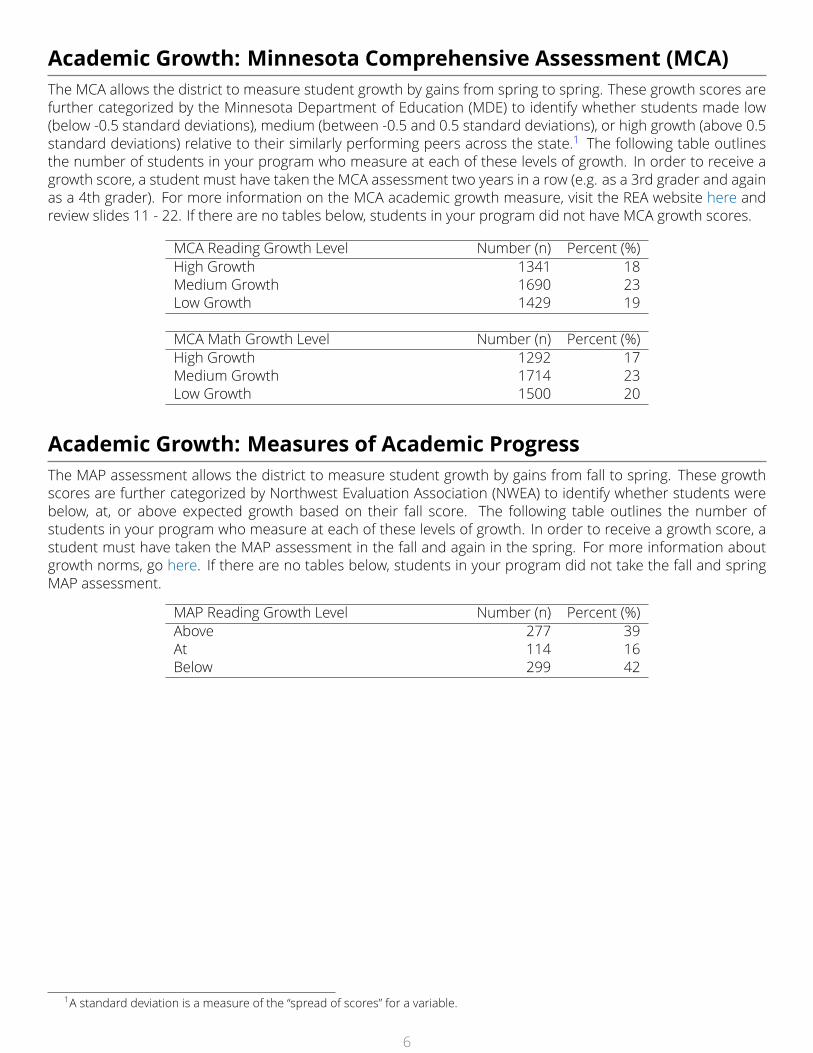
Academic Growth: Minnesota Comprehensive Assessment (MCA)The MCA allows the district to measure student growth by gains from spring to spring. These growth scores arefurther categorized by the Minnesota Department of Education (MDE) to identify whether students made low(below -0.5 standard deviations), medium (between -0.5 and 0.5 standard deviations), or high growth (above 0.5standard deviations) relative to their similarly performing peers across the state.1 The following table outlinesthe number of students in your program who measure at each of these levels of growth. In order to receive agrowth score, a student must have taken the MCA assessment two years in a row (e.g. as a 3rd grader and againas a 4th grader). For more information on the MCA academic growth measure, visit the REA website here andreview slides 11 - 22. If there are no tables below, students in your program did not have MCA growth scores.
MCA Reading Growth Level Number (n) Percent (%)High Growth 1341 18Medium Growth 1690 23Low Growth 1429 19MCA Math Growth Level Number (n) Percent (%)High Growth 1292 17Medium Growth 1714 23Low Growth 1500 20
Academic Growth: Measures of Academic ProgressThe MAP assessment allows the district to measure student growth by gains from fall to spring. These growthscores are further categorized by Northwest Evaluation Association (NWEA) to identify whether students werebelow, at, or above expected growth based on their fall score. The following table outlines the number ofstudents in your program who measure at each of these levels of growth. In order to receive a growth score, astudent must have taken the MAP assessment in the fall and again in the spring. For more information aboutgrowth norms, go here. If there are no tables below, students in your program did not take the fall and springMAP assessment.
MAP Reading Growth Level Number (n) Percent (%)Above 277 39At 114 16Below 299 42
1A standard deviation is a measure of the “spread of scores” for a variable.6
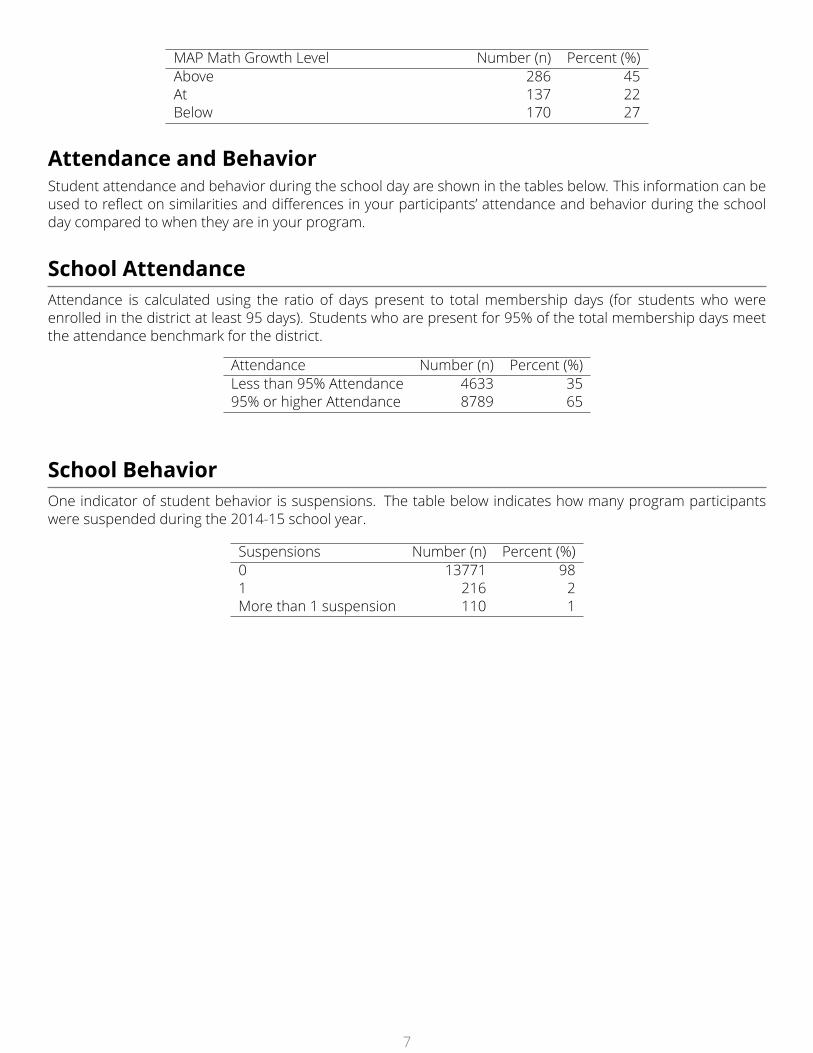
MAP Math Growth Level Number (n) Percent (%)Above 286 45At 137 22Below 170 27Attendance and BehaviorStudent attendance and behavior during the school day are shown in the tables below. This information can beused to reflect on similarities and differences in your participants’ attendance and behavior during the schoolday compared to when they are in your program.School AttendanceAttendance is calculated using the ratio of days present to total membership days (for students who wereenrolled in the district at least 95 days). Students who are present for 95% of the total membership days meetthe attendance benchmark for the district.
Attendance Number (n) Percent (%)Less than 95% Attendance 4633 3595% or higher Attendance 8789 65
School BehaviorOne indicator of student behavior is suspensions. The table below indicates how many program participantswere suspended during the 2014-15 school year.
Suspensions Number (n) Percent (%)0 13771 981 216 2More than 1 suspension 110 1
7
Evaluation Capacity Building Workshops
As part of our effort to improve community partnerships, we offer free monthly workshops that help
build your organization's capacity to utilize data and evaluation tools for program improvement. These
workshops are excellent opportunities for program staff to build their skills and learn how data and
evaluation can be used to better meet student needs.
2014-2015 Workshops
November: Developing a Logic Model
December: Creating a Culture of Continuous Improvement
January: Introduction to Excel
February: Using Actionable Data for Continuous Improvement
March: Theory of Change
April: Survey Design
May: Aggregate Report Session
June: Developing a Logic Model
2015-2016 Workshops
September: Aggregate Report Session
Continuous Improvement Series
October: Continuous Improvement with Actionable Data
November: Strategic Planning for Nonprofits
Organizational Development Series
December: Developing a Logic Model
January: Theory of Change
February: Social Emotional Learning and Measurement
Data Analysis Series
March: Excel Training
April: Qualitative Data Collection and Analysis
May: Telling Stories with Data