Embed Size (px)
Citation preview
8/3/2019 KM in Cricket
http://slidepdf.com/reader/full/km-in-cricket 1/18
Knowledge Management inCricketMIS 480/580 - Project Report
Luis Barreda | Deepika Nim | Jagadish Ramamurthy | James Sanford
With the guidance of:
Dr. Hsinchun Chen
Professor, Management Information SystemsEller College of Management
University of Arizona

8/3/2019 KM in Cricket
http://slidepdf.com/reader/full/km-in-cricket 2/18
Knowledge Management in Cricket
Executive Summary
This is a hands-on group research project done as a requirement for the MIS
480/580 – Knowledge Management course handled by Dr. Hsinchun Chen, Ph.D.,
Professor, Management Information Systems Department, Eller College of
Management, University of Arizona. This project will involve original research on
the reasons behind Australian cricket team’s track record of constant wins in the
2000s. This endeavor is to achieve our research objectives by capturing knowledge
through statistical analysis of the data obtained by mining through our primary
data source, www.cricinfo.com.
The Australian Cricket team is one of the oldest teams in Test Cricket, having
played in the first ever cricket match against England in 1877. The Australian team
is currently regarded by many as the best in the world. As of the January 2008, the
Australian team has played 692 Test matches, winning 46.82%, losing 25.86% and
drawing 27.02% of its games. It has also led the ICC Test Championship table for
the majority of the time since the creation of the ICC Test table system in January
2001. They are also the first ranked international one-day cricket team and winners
of the last three Cricket World Cups. Australia won the Cricket World Cup 4 times in
total; 1987, 1999, 2003 & 2007. As of 28 April 2007 they are undefeated in 29
consecutive World Cup matches. In 2002, they were named World Team of the Year
at the Laureus World Sports Awards in recognition of their world record sequence of
test match victories.
Our research objective is to get acceptable answers for the following question: How
have Australia managed to maintain their “Numero Uno” status in test cricket? We
also intend to bolster our answers with contextualized information. The idea is to
capture knowledge about the strategy followed by the Australian team which can
be used by the rest of the cricketing world to shape their game for the better.
Team 3Page 2

8/3/2019 KM in Cricket
http://slidepdf.com/reader/full/km-in-cricket 3/18
Knowledge Management in Cricket
Table of ContentsExecutive Summary ................................................................................................... 2
Table of Contents ....................................................................................................... 3
Introduction ................................................................................................................ 5
Research Area ............................................................................................................ 5
Research Objectives ................................................................................................... 6
Data Source ................................................................................................................ 7
Analysis Methods and Tools Used ............................................................................... 7
Research Findings ...................................................................................................... 8
Early Declarations ................................................................................................... 8
Batsmen Vs Bowlers ................................................................................................ 9
Partnerships between Left-Handed and Right-Handed Batsmen ...........................11
Effect of Match Venues ......................................................................................... 13
Age Vs Runs/Match ................................................................................................ 14
Correlation between Runs/Over and Wins ............................................................. 16
Conclusions .............................................................................................................. 17
Lessons Learned and Future Work ........................................................................... 18
References ............................................................................................................... 18
Figure 1: Performance of cricket team during the last 60 years.................................5
Figure 2: Performance of Australia during the last 60 years......................................6
Figure 3: Wins/Non-Wins and Matches Declared for all test playing nations during
the 2000s...................................................................................................................9
Figure 4: Win/Loss Ratio of Australia when particular batsmen played the game....10
Figure 5: Win/Loss Ratio of Australia when particular bowlers played the game.....10
Team 3Page 3
8/3/2019 KM in Cricket
http://slidepdf.com/reader/full/km-in-cricket 4/18
Knowledge Management in Cricket
Figure 6 and 7: Categorization of Runs scored by left-handed/right-handed batsmen
and like-handed batsmen.........................................................................................12
Figure 7: Home and Away win/loss ratio for all the teams........................................13
Figure 8: Matches played by Australia in different countries....................................14
Figure 9: Runs/Match scored by different batsman at different ages.......................15
Figure 10: Regression plot of Wins and RPO.............................................................17
Table 1: Player - Age Mapping..................................................................................15
Team 3Page 4

8/3/2019 KM in Cricket
http://slidepdf.com/reader/full/km-in-cricket 5/18
Knowledge Management in Cricket
Introduction
The sports world is known for the vast amounts of statistics that are collected for
players, teams and matches. There are also many types of statistics that are
gathered for each – a Cricket player will have data for runs scored, matches played,
average, strike rate etc. for each match. Such data are collected almost all sports
for analysis and knowledge creation for continuous improvement. But, there is
every possibility for information overload for those trying to derive meaning from
sports statistics. Hence, sports are ideal for data mining. We have chosen Cricket
for the purpose of research.
Research Area
Our research area centers on the Australian cricket team and their performance
during the 2000’s. Before selecting our research area we did an extensive study of
the performance of all the test-playing cricket teams around the world and their
performance since 1950’s till the 2000s. Following are the results that we collected.
Figure 1: Performance of cricket team during the last 60 years
One can notice that there are only two teams that have shown spectacular
performance – West Indies and Australia. Win/loss ratios for all the teams have
been plotted along the y-axis. One can observe that all the teams have their
win/loss ratio lingering around 0 to 2.5 while only West Indies and Australia have
Team 3Page 5

8/3/2019 KM in Cricket
http://slidepdf.com/reader/full/km-in-cricket 6/18
Knowledge Management in Cricket
reached win/loss ratio of more than 5.0 though in different time periods. Out of
these two teams, we chose Australia for our research purposes.
Furthermore, we singled out Australia’s performance line to decide on the time
period for our analysis as shown in Figure 2.
Figure 2: Performance of Australia during the last 60 years
It is evident from Figure 2 that there had been a gradual dip in Australia’s
performance from the 50s to the 80s during which it reached its lowest point. There
is a noticeable improvement in performance during the 90s while there is a big
spike during the 2000s. We decided to delve into the reasons for this spike using
hard data.
Research Objectives
As mentioned before, our objective is to analyze the successful strategy of the
Australian Cricket Team during the 2000s, identify patterns in the victories and
create knowledge from the patterns identified. Using the tacit knowledge of our
subject area expert, we narrowed down our research objectives to the following:
• Patterns in Individual Player performance
o
Batsmen vs. Bowlers: Who had a better impact on Australia’s victories?o Significance of Team composition: Did equal number of Left-Handed
and Right-Handed Batsmen in top batting order impact their victories?
o Age of the Batsmen: Did the batsmen mature and reach their peaks
during the 2000s?
• Effect of Match Venues
Team 3Page 6
8/3/2019 KM in Cricket
http://slidepdf.com/reader/full/km-in-cricket 7/18
Knowledge Management in Cricket
o Australia’s performance at Home and Away venues
• Run Rate
o Correlation between Run Rate and Match Win/Loss Ratio: Australia
batting faster than the rest world – did this impact their victories?
• Early Declarations
o Analysis of the outcomes of early declarations of all teams
Data Source
Our data source was primarily www.cricinfo.com. This website has a query
interface that could be used to fetch out any sample of data. The query interface
has a basic and advanced filter to fetch out detailed data
(http://stats.cricinfo.com/statsguru/engine/stats/index.html?class=1;type=batting).
Primarily we used the following dataset/attributes from the data source.
• Team : A group of players on the same side in a game
• Win/Loss : Ration of total matches won to total matches lost
• Players : Individuals in a team
• Runs : Basic unit of scoring
• Overs : An over has 6 plays
• Runs/Over: Ratio of total runs scored to total overs in a game
• Venue : Place where a game is held
• Age : Age of a player
Analysis Methods and Tools Used
We used the following analysis methods:
• Individual value plot:
o Displays all data values – so more informative than a Box Plot
o
Enables grouping of data values in different categories to makecomparisons
o Enables the drawing of conclusions based on the density of data
values in each category
Team 3Page 7
8/3/2019 KM in Cricket
http://slidepdf.com/reader/full/km-in-cricket 8/18
Knowledge Management in Cricket
• Bar chart: A bar chart is a chart with rectangular bars of lengths proportional
to that value that they represent. Bar charts are used for comparing two or
more values.
• Scatter plot: A scatter graph or scatter plot is a type of display that contains
one or more scatter plots each of which use Cartesian coordinates to display
values for two variables for a set of data. The data is displayed as a collection
of points, each having the value of one variable determining the position on the
horizontal axis and the value of the other variable determining the position on
the vertical axis.
• Regression: Regression analysis is a technique used for the modeling and
analysis of numerical data consisting of values of a dependent variable
(response variable) and of one or more independent variables (explanatory
variables).
The tools that we used are:
• MS Excel: We used this to save data retrieved from www.cricinfo.com.
• Minitab: Analytical tool to analyze the data and derive conclusions.
Research Findings
Early Declarations
In the 2000s, Australia frequently used a strategy called early declaration in an
attempt to win more games. In test match cricket, the team with the most runs
scored only wins if the game is completed; if time expires before the end of the
fourth innings, the match is a draw. Therefore, a team leading in the 3rd innings
must choose whether to secure its lead and force the game into a draw, or to
declare an end to its offensive efforts and attempt to win the game with defense
before time expires. This strategy is risky: it relinquishes control over the outcome
(a draw) and gives each team an opportunity to win the game.
We queried Statsguru for statistics for all teams, but only included data from
matches in which the 3rd innings were ended by declaration. Since we were only
interested in early, or risky, declarations – a team might be expected to declare if it
had a comfortable lead of 400 or more runs – we further limited the results to
Team 3Page 8
8/3/2019 KM in Cricket
http://slidepdf.com/reader/full/km-in-cricket 9/18
Knowledge Management in Cricket
include declarations with a lead of 350 or fewer runs. The resulting data listed
each team and summary statistics of its performance in matches in which they
declared early.
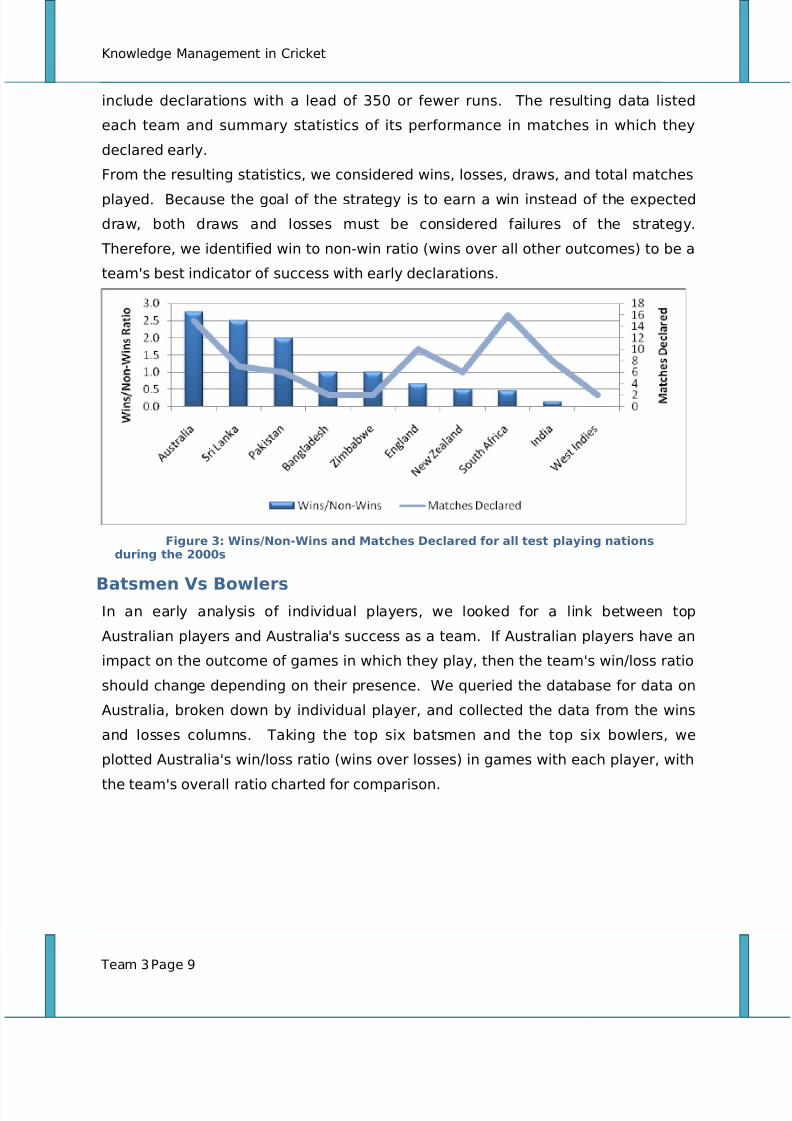
From the resulting statistics, we considered wins, losses, draws, and total matches
played. Because the goal of the strategy is to earn a win instead of the expected
draw, both draws and losses must be considered failures of the strategy.
Therefore, we identified win to non-win ratio (wins over all other outcomes) to be a
team's best indicator of success with early declarations.
Figure 3: Wins/Non-Wins and Matches Declared for all test playing nationsduring the 2000s
Batsmen Vs BowlersIn an early analysis of individual players, we looked for a link between top
Australian players and Australia's success as a team. If Australian players have an
impact on the outcome of games in which they play, then the team's win/loss ratio
should change depending on their presence. We queried the database for data on
Australia, broken down by individual player, and collected the data from the wins
and losses columns. Taking the top six batsmen and the top six bowlers, we
plotted Australia's win/loss ratio (wins over losses) in games with each player, with
the team's overall ratio charted for comparison.
Team 3Page 9

8/3/2019 KM in Cricket
http://slidepdf.com/reader/full/km-in-cricket 10/18
Knowledge Management in Cricket
Figure 4: Win/Loss Ratio of Australia when particular batsmen played thegame
The first figure shows that none of Australia's top batsmen had a major impact on
the team's rate of success. Australia's overall win/loss ratio was approximately 6.2
and this only increased by a maximum of 0.3, or 4.8%.
Figure 5: Win/Loss Ratio of Australia when particular bowlers played thegame
The second figure, however, is more interesting. The top six bowlers had much
more of an impact on the outcome of games; the shift was dramatic enough to
require a change in the scale of the chart. Australia's win/loss ratio increased by at
least 3.0, a 48.4% change, when Kasprowicz, MacGill, or Warne were playing.
We concluded from this analysis that bowlers had a much more significant impact
on the outcome of games than batsmen. This is understandable because bowlers
Team 3Page 10

8/3/2019 KM in Cricket
http://slidepdf.com/reader/full/km-in-cricket 11/18
Knowledge Management in Cricket
are the primary defensive players; on defense, the bowler handles every ball of
every over, and has significant control over how many runs the opponents score.
The same is not true for batsmen, who share an equal offensive role with every
other player.
This conclusion led us to examine batting rather than bowling in subsequent
analyses, in order to make non-obvious discoveries. Examining bowling would
have led to obvious findings, since the bowler's good performance or poor
performance would likely result in a win or a loss. Instead, we looked for patterns
and strategies that increased the impact of batting and run-scoring, which were
more likely to be non-obvious.
Partnerships between Left-Handed and Right-Handed BatsmenFirst and foremost, here is a description of what we mean by the term ‘Partnership’
in cricket. In cricket, two batsmen bat in partnership, although only one is on
strike at any time. The partnership between two batsmen will come to an end when
one of them is dismissed or retires, or the innings comes to a close. Various
statistics may be used to describe a partnership, most notably the number of runs
scored, the duration of the partnership and number of deliveries (balls) faced. We
have used the number of runs scored.
The Australian team had a strategy of selecting an equal number of right-handed
and left-handed -batsmen. In a partnership, a right-handed and a left-handed
batsman or like-handed batsmen would play. Australia’s selection strategy was
such that there were more partnerships of different-handed batsmen. The reason
behind doing this is that it disrupts the bowler’s rhythm. Every bowler has different
strategies to bowl to different handed batsmen. When the bowler has to bowl to
unlike handed batsmen in every other delivery then it becomes very difficult for a
bowler to settle in a rhythm. This is what we have proven by collecting statistical
data for runs scored for different partnerships i.e. partnerships between like
handed batsmen and partnerships between unlike handed batsmen. We also
divided the runs into 5 categories: Match Winner (200+), Significant (100-200),
Very Good (75-100), Good enough (50-75) and Insignificant (0-50). Our results are
given below.
Team 3Page 11

8/3/2019 KM in Cricket
http://slidepdf.com/reader/full/km-in-cricket 12/18
Knowledge Management in Cricket
Figure 6 and 7: Categorization of Runs scored by left-handed/right-handed batsmen andlike-handed batsmen
Comparing the two graphs, we have the following results,
Team 3Page 12

8/3/2019 KM in Cricket
http://slidepdf.com/reader/full/km-in-cricket 13/18
Knowledge Management in Cricket
• There are a higher number of unlike-handed batsmen partnerships that have
scored runs in the match winner , significant and very good categories.
• The number of unlike-handed batsmen and like-handed batsmen partnerships in
the good enough category of runs is almost equal.
• The insignificant category of runs has more like-handed batsmen partnerships
than unlike-handed batsmen partnerships
So, we have concluded that the unlike-handed batsmen partnerships have largely
contributed runs in the match winner, significant and very good categories while
the like-handed batsmen have fallen prey to the bowlers and have been able to
contribute runs only in the insignificant category of runs. This proves that Australia
selection strategy has proven advantageous for them over the past 8 years.
Effect of Match VenuesNext we considered the effect of external factors such a match venues on the
performance of the Australian team as compared to other teams. The teams that
we considered were Australia, India, England, Bangladesh, New Zealand, Pakistan,
South Africa, Zimbabwe, West Indies and Sri Lanka. We collected data such as
every team’s average Win/Loss ratio for matches played in their home country and
away venues.
Figure 7: Home and Away win/loss ratio for all the teams
What we note here is that the win/loss ratio for Australian team is close to 11.75
when they play a match in Australia and the win/loss ratio for other teams ranges
from 0.1 to 4.0. So, Australian team clearly has a much higher chances of winning a
Team 3Page 13

8/3/2019 KM in Cricket
http://slidepdf.com/reader/full/km-in-cricket 14/18
Knowledge Management in Cricket
game in its home country. We also gathered data about matched played by the
Australian team in various countries.
Figure 8: Matches played by Australia in different countries
One can observe that the Australian team has played maximum of its matches in
Australia itself.
So, we conclude that playing in Australian cricket grounds has been a great factor
for its winnings in the 2000s.
Age Vs Runs/Match
There is a myth in cricket, Cricket batsmen peak during their early 30s. We
wanted to check if this was true in the case of Australian cricket team. Further, we
also wanted to check if this was one of the factors that played any role in the
constant wins of Australia during the 2000s.
The data that we considered was performance indicator, PI = (total runs scored by
a batsman/total number of matches played in a year). We calculated PI for 5batsmen – Gilchrist, Hayden, Langer, Martyn and Ponting. We calculated PI for each
of these batsmen for all the years they played since their debut year and also
checked what their age was in these years. We used this value because the best
and most correct performance indicator for a batsman would be the average runs
scored by him in a match. Also, we wanted to compare the performance of all the
Team 3Page 14
8/3/2019 KM in Cricket
http://slidepdf.com/reader/full/km-in-cricket 15/18
Knowledge Management in Cricket
batsmen with each other. These batsmen debuted at different times and have
played unequal number of matches so they would have unequal number of runs
scored. The best possible way to compare was on the basis of the number of runs
each of these batsmen would be likely to score in a match in a particular year.
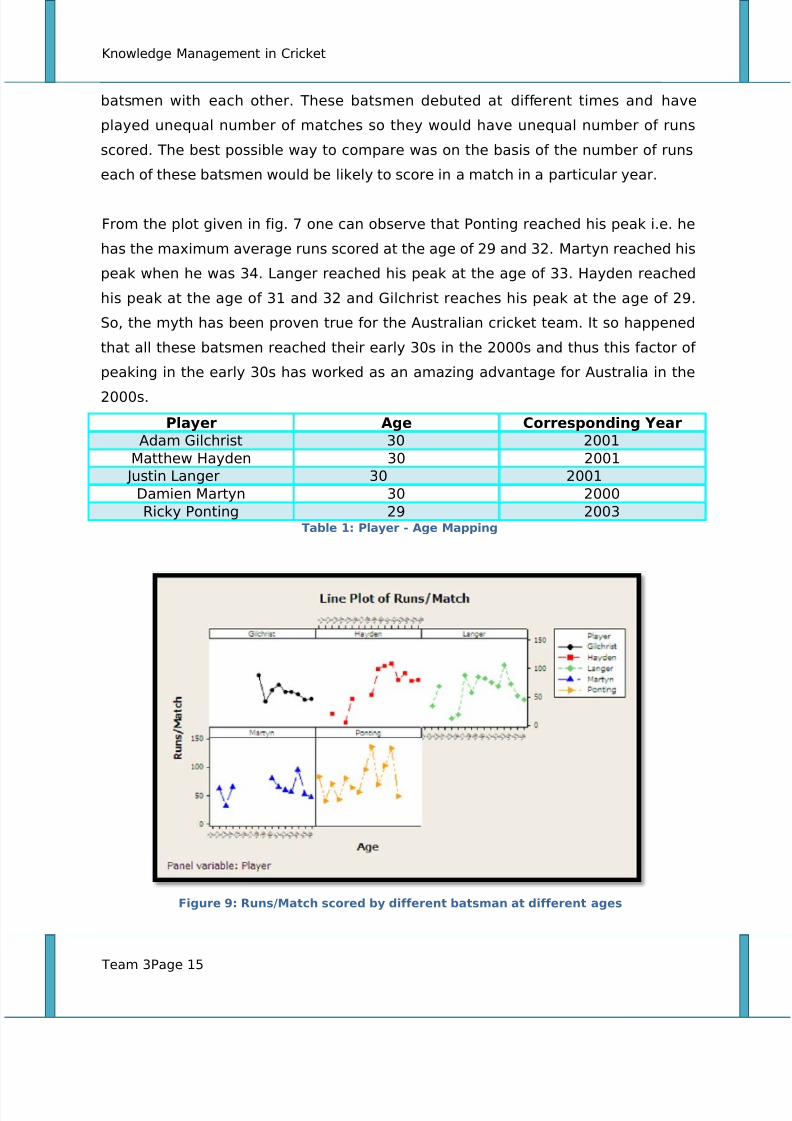
From the plot given in fig. 7 one can observe that Ponting reached his peak i.e. he
has the maximum average runs scored at the age of 29 and 32. Martyn reached his
peak when he was 34. Langer reached his peak at the age of 33. Hayden reached
his peak at the age of 31 and 32 and Gilchrist reaches his peak at the age of 29.
So, the myth has been proven true for the Australian cricket team. It so happened
that all these batsmen reached their early 30s in the 2000s and thus this factor of
peaking in the early 30s has worked as an amazing advantage for Australia in the
2000s.
Player Age Corresponding YearAdam Gilchrist 30 2001
Matthew Hayden 30 2001
Justin Langer 30 2001
Damien Martyn 30 2000
Ricky Ponting 29 2003Table 1: Player - Age Mapping
Figure 9: Runs/Match scored by different batsman at different ages
Team 3Page 15
8/3/2019 KM in Cricket
http://slidepdf.com/reader/full/km-in-cricket 16/18
Knowledge Management in Cricket
From the above table, one can clearly observe that all the batting regulars have
reached the age of thirty in the beginning of the 2000s. From the previous analysis,
we have proved the myth with data (at least in the case of Australian batsmen) and
we have shown that the Australian batting regulars were in their early 30s during
the 2000s. So, during the last 8 years, Australia had at least two batsmen peaking
every year. And this has had a tremendous impact in their success rate.
Correlation between Runs/Over and Wins
As our subject matter expert observed, Australia batted much faster than any other
team in test matches. This is out-of-the-ordinary because, in test matches, you
have unlimited number of balls to play as long as you keep your wickets (batsmen)
intact. Over time, this aspect of test cricket has encouraged a lot of teams to use
negative tactics like playing slowly to kill time and end the match with a draw. TheAustralian team of the 2000s never considered this as an option. They always
aimed at a win and hence they batted and scored runs quick. Hence, the objective
here was to analyze the runs per over of all teams and their corresponding wins
and see if there is any correlation.
We queried for statistics for all teams and we separated out runs per over and wins
for the purpose of analysis. Then, we drew a regression scatter plot between runs
per over and wins, and observed the r-squared value to draw conclusions.
Team 3Page 16

8/3/2019 KM in Cricket
http://slidepdf.com/reader/full/km-in-cricket 17/18
Knowledge Management in Cricket
Figure 10: Regression plot of Wins and RPO
The R-Sq value was .76 which meant that there is a strong correlation between the
runs per over and wins of Australia. Hence, Australia playing quick and having a
higher run rate has been a major factor in their victories. The same is the case for
other teams too.
Conclusions
To summarize, the following are the patterns that we identified in the wins of the
Australian cricket team during the 2000s:
• Key Players peaking at the right time: It was a matter of chance for
Australia that their best batsmen reached their early 30s in the 2000s and
they inadvertently proved the myth in cricket that “The performance of a
Cricket batsman peaks in his early 30s”.
• Diversity of batsmen: The Australian team comprised of a nice mix of left-
handed and right-handed batsmen which worked for them.
• High Run Rate: The Australian team’s strategy to build a heavy score
upfront in a test match creates a huge amount of pressure on the opponent
team which definitely works in their favor.
Team 3Page 17

8/3/2019 KM in Cricket
http://slidepdf.com/reader/full/km-in-cricket 18/18
Knowledge Management in Cricket
• Use of positive strategy: The Australian team played with an aim to win.
They played very fast. This is evident from the runs they score per over of the
match and this in turn was a major factor in their victories.
Lessons Learned and Future Work
We have learnt from this project that a combination of a rock solid data source,
clear research objectives and simple analytical methods are enough to derive
knowledge from sports data.
This project can be followed by the following areas of work in future:
• Comparison of the West Indies cricket team of the 80s to Australia of the 2000s
• Comparison of the top four teams in the world with Australia
•
Prediction of the outcome of a test match series
References
• www.CricInfo.com
• www.CricketAustralia.com
• De Silva, Basil M. & Swartz, Tim B. Winning the coin toss and the home team
advantage in one-day international cricket matches
• Brooks, Robert & Bussiere, Luc F. Sinister strategies succeed at the cricket
world cup
• Allsopp, Paul (2005), Measuring team performance and modeling the home
advantage effect in cricket
Osama K. Solieman, Data Mining in Sports, 2006
Team 3Page 18