Embed Size (px)
Citation preview

Klépierre2013 Investors Days
June 7, 2013

DISCLAIMER
This document has been prepared by Klépierre (the “Company”) solely for use at the presentation of June 7, 2013. This document is not to be reproduced nordistributed, in whole or in part, by any person other than the Company. The Company takes no responsibility for the use of these materials by any person.
The information contained in this document has not been subject to independent verification and no representation, warranty or undertaking, express orimplied, is made as to, and no reliance should be placed on, the fairness, accuracy, completeness or correctness of the information or opinions containedherein. None of the Company, its shareholders, its advisors or representatives nor any other person shall have any liability whatsoever for any loss arisingfrom any use of this document or its contents or otherwise arising in connection with this document.
This document does not constitute an offer to sell or an invitation or solicitation of an offer to subscribe for or purchase any securities, and this shall not formthe basis for or be used for any such offer or invitation or other contract or engagement in any jurisdiction.
Participants are invited to read the registration document (“document de référence”) of the Company filed with the AMF on March 18, 2013 and the risk factorsdescribed in the Risk Factors section from page 89 to 96 of the registration document. The registration document is made available free of charge at theheadquarters of the Company (Klépierre), on the Internet site of the AMF (http://www.amf-france.org) and on the website of the Company(http://www.klepierre.com).
Certain statements included in the registration document contain forward-looking statements with respect to future events, trends, plans or objectives. Theinformation, assumptions and estimates that were used to determine these objectives are subject to change or modification due to economic, financial andcompetitive uncertainties. Furthermore, it is possible that some of the risks described in the aforementioned section of the registration document could havean impact on the Company’s ability to achieve these objectives. Accordingly, the Company cannot give any assurance as to whether it will achieve theobjectives described, and makes no commitment or undertaking to update or otherwise revise this information.
No assurance is given as to the fairness, accuracy, completeness or correctness of the information or opinions contained in this document. In case of anydiscrepancies between the information contained in this document and the registration document, the latter will prevail.
Klépierre 2013 Investors Days - 06/07/20132 -

TABLE OF CONTENTS
3 -
1 I E-COMMERCE: KEY FACTS/FRAMINGTHE DEBATE
2 I A TARGETED ASSET ALLOCATION STRATEGY
3 I COST OPTIMIZATION POTENTIAL
4 I OPERATIONAL EXCELLENCE AND PARTNERSHIP WITH RETAILERS
Klépierre 2013 Investors Days - 06/07/2013

Table of Contents
1 I E-COMMERCE: KEY FACTS/FRAMING THE DEBATE
4 - Klépierre 2013 Investors Days - 06/07/2013

5 -
+21.1%
WORLD GDP
WORLD E-COMMERCE SALES
2012 GROWTH (vs. 2011)
+3.2%71.8
1.1
in $ trillion
EUROPE
NORTH AMERICA
ASIA
OTHER
35%
6%
26%
33%
2012 E-COMMERCE SALES BY REGION
WORLD E-COMMERCE: KEY FIGURES
Europe accounts for more than one third of e-commer ce sales
E-commerce growth is 10 times higher than global tr ade growth
+19.0%EUROPE E-COMMERCE SALES 0.4
Source: Ecommerce Europe association
May 23, 2013
Klépierre 2013 Investors Days - 06/07/2013

E-COMMERCE IN FRANCE: 2020 PROJECTIONS
2010 2012 2015e 2020e
115
3%4%
7%
10%
72
45
31
FRENCH E-COMMERCE SALES PROJECTIONS(in Bn €)Share of e-commerce in
total consumption
By 2020, e-commerce is expected to account for 10% of total consumption in France
Source: Casas & Associés
Methodology used: Consumption growth +0.0% 2013, +0.5% 2014 and 1.5% thereafter
E-commerce sales growth +18% 2013, +17% 2014, +15% 2015 and +10% thereafter
6 -
E-COMMERCE SALES IN FRANCE (in Bn€)2007 2009 2010 2011 2012
16 25 31 38 45
Klépierre 2013 Investors Days - 06/07/2013

THE EXPANSION OF E-COMMERCE
7 -
5 80015 200
36 900
64 100
100 400
117 500621 k€
383 k€
0
20 000
40 000
60 000
80 000
100 000
120 000
140 000
0
100
200
300
400
500
600
700
2003 2005 2007 2009 2011 2012
Number of e-commerce merchant websites
Average turnover per website
E-COMMERCE MERCHANT WEBSITES AND AVERAGE SALES REVENUE (1)
� Europe’s main e-commerce countries: the UK,
Germany and France
� In 10 years, the number of e-commerce
merchant websites has increased 20-fold in
France
� Average sales revenue has dropped significantly
over same period
� Growth broadly driven by all sectors, with the
exception of food sales
� E-commerce sales growth mainly driven by the
increase in number of e-shoppers(2) and
purchasing frequency
(in k€)
1. Data for France
2. Around 250 million e-shoppers in Europe (source: European Commerce Report – May 2013) and around 32 million in France
Klépierre 2013 Investors Days - 06/07/2013

E-COMMERCE AND PHYSICAL COMMERCE ARE INTERTWINED AND COMPLEMENTARY
Omni-channel prevails and the frontier between physical store and e-commerce is disappearing
All channels are interdependent and mutually reinforce one another
ROPO (Research Online – Purchase Offline) is a well-established phenomenon
Purchasing behavior is similar for both on-line and off-line distribution
The key is to get the customer’s attention by providing the best service with impulse buying
International retailer development strategy is base d on physical stores and e-stores
The most successful e-retailers worldwide - with few exceptions -enjoy a large physical footprint and are pursuing their development in both channels
The use of digital tools is part of the shopper’s experience
8 -
88%
66%do both
69%
of shoppersresearch online before
buying offline
visit the store before buying online
Source: Digitas Research – Statistics for France
of smartphone users use them at physical
point of sale
76%
Klépierre 2013 Investors Days - 06/07/2013

Shoppers like the physical experience of shopping
73% of the French prefer physical shopping. Physical shopping attributes are ”vivid” and ”human”. This preference is cross-generational.
78% of the French say they need to touch and possibly try out/on products before purchasing(1)
Transformation rates are higher in shopping malls than online
40.6%(2) in shopping malls vs. 2.15% online(3)
For personal products, the transformation rate is event higher: 55%(4)
Shoppers compare online but the majority still buy in store(5)
ASPIRATIONAL EXPERIENCE COUNTS AND IS MORE EFFICIENT
9 -
(1) IPSOS survey on a representative sample of French people aged 16+(2) French National Association of Shopping Centers, Capgemini(3) Fevad (French Federation of E-Commerce) [check translation](4) Journal du Textile(5) Source: OTO Research 2012
Exclusively in stores
Both in stores and online
Exclusively online
83% 10% 7%
BUYINGACT
Klépierre 2013 Investors Days - 06/07/2013

1. E-commerce pure players (Amazon, Asos, Cdiscoun t, Price Minister, Vente Privée, Yoox, Leboncoin.fr, etc.)
Successful e-retailer business model is usually based on the concept of marketplace
They gather a diversity of products from various brands, which allows the customer to comparison shop
10 -
+40%
+41%
+27%
0%
5%
10%
15%
20%
0
10 000
20 000
30 000
40 000
50 000
60 000
70 000
2010 2011 2012
AMAZON (US)in M$
TURNOVER EBITDA MARGIN
TWO MODELS OF SUCCESSFUL RETAILERS INE-COMMERCE (1)
EBITDA multiple(1)
� 2013E: 28.8x� 2014E: 22.0x
(1) As of 28/05/2013 estimates, source Thomsom Reuters
+52%
+46%
+35%
0%
5%
10%
15%
20%
0
200
400
600
800
1 000
1 200
2010 2011 2012
ASOS (UK)in M£
EBITDA multiple(1)
� 2013E: 44.6x� 2014E: 34.5x
YOOX (IT)in M€
+41%
+36%
+29%
0%
5%
10%
15%
20%
0
100
200
300
400
500
2010 2011 2012
EBITDA multiple(1)
� 2013E: 21.2x� 2014E: 15.3x
⇒ Revenue growth remains high but EBITDA margin is flat or declining
⇒ Trading at high EBITDA multiples
⇒ Major challenges: low margin and significant delivery costs. Only a few pure players and a handful of niche players will
surviveKlépierre 2013 Investors Days - 06/07/2013

TWO MODELS OF SUCCESSFUL RETAILERS INE-COMMERCE (2)
2. Traditional retailers are expanding in e-commerc e…
Some retailers have demonstrated the sustainability of their business model in “physical” commerce
Their success is based on a integrated model: from production to distribution
E-shops were launched in the mid/late 2000’s and their appeal is based on an extensive physical footprint that supports strong brand awareness
… but also increasing their traffic-generating retai l locations
Continued reliance on their physical presence around the world to deliver profitable growth: H&M, Zara, Sephora, Mango, Castorama, etc.
Retail real estate with a portfolio of dominant and leading shopping centers in their catchment area are best positioned to respond to these demands
11 -
E-shop launch First e-shop launched in 2009 (H&M Home) in Scandinavia, Netherlands, Germany and Austria
First e-shop in 2007 (Zara Home)
StrategyRecent acceleration in e-commercePriority given to physical stores: new locations include Europe & USA
Recent and aggressive development in e-commerceRate of new physical store openings high around the world
E-commerce weight €214 M, i.e., 3.3% of total revenues in 2011 (1) €350 M (est.) i.e. 2% of total revenues in 2012
Online buyingIn-store delivery is not possibleHome delivery entails extra costs
Free in-store deliveryHome delivery entails extra costs
Number of store openings planned for 2013
325 (out of 2,776 stores as of 31/12/12)(2) Between 440 and 480 (out of 6,009 stores as of 31/12/12)(3)
(1) Source: Internet Retailer (2) Source: H&M 2012 Annual Report (3) Source: INDITEX 2012 Annual report
Klépierre 2013 Investors Days - 06/07/2013

MULTICHANNEL PLAYERS ARE BLAZING THE TRAIL IN E-COMMERCE
Ranking in attractiveness for e-commerce websites
12 -
Source: OC&C survey, May 2011
Retailers alsodistributing goods in stores
1 Amazon Amazon Amazon
2 Yves Rocher eBay Netflix
3 Vente-Privee Douglas iTunes
4 Fnac.com Tchibo Victoria’s Secret
5 Decathlon Esprit eBay
6 iTunes Rossmann Costco
7 Darty S. Oliver Barnes & Noble
8 Créateurs de Beauté Otto LL Bean
9 eBay Deichmann Bestbuy
10 Price Minister H&M Macys
11 La Redoute Conrad Elektronic Wal-Mart
12 Sephora Bonprix Target
13 Cdiscount Dawanda JC Penney
14 Pixmania C&A Home Depot
15 Marionnaud Kaufhof GAP
#
Retailer presentin Klepierre malls
Despite having started their online development later, traditional retailers’ e-shops rank among the most attractive. Online success partly due to on an extensive network of physical stores
Klépierre 2013 Investors Days - 06/07/2013

CHALLENGES AND OPPORTUNITIES FOR KLEPIERRE
Adapting the business model and developing its comp lementarity to this new and still evolving way of shopping
⇒ Customers are increasingly mobile but the answer is not only digital
⇒ Accelerate re-tenanting and adapt sizes
⇒ Shopping centers should more than ever appeal to retailers as the ideal place to be, providing them with the highest purchase transformation rates
⇒ Shopping centers should answer aspirational customer needs:� create vibrant marketplaces
� adopt a hospitality attitude
� socialize more, entertain more, surprise more
� more rewards for loyalty
13 - Klépierre 2013 Investors Days - 06/07/2013

Table of Contents
2 I A TARGETED ASSET ALLOCATION STRATEGY
14 - Klépierre 2013 Investors Days - 06/07/2013

KLEPIERRE: A DOMINANT PLAYER IN KEY EUROPEAN REGIONS
15 -
La Gavia, Madrid
Créteil Soleil, Créteil
Val d’Europe, Marne-la-Vallée
Le Millénaire, Aubervilliers
Arcades, Noisy-le-Grand
St. Lazare Paris, Paris
Les Sentiers de Claye-Souilly
Les Passages, Boulogne-Billancourt
Southern ScandinaviaGreater Paris Area
Southwest FranceBlagnac, Toulouse
Grand Portet, Toulouse
Bègles, Bordeaux
Saint-Orens, Toulouse
Odysseum, Montpellier
Aqua Portimão, Portimão
Parque Nascente, Porto
Northern Italy
Metropoli, Milan
Brianza, Milan
Le Corti Venete, Verona
Milanofiori, Milan
Acquario center, Vignate (Milan)
Il Leone di Lonato, Lonato
Il Destriero, Vittuone
Fields’, Copenhagen
Allum, Partille
Emporia, Malmö
Sollentuna, Sollentuna
Kupolen, Borlänge
Bruun's Galleri, Aarhus
Marieberg, Örebro
Novỳ Smíchov, Prague L’esplanade, Louvain-la-Neuve
Belle Epine, Thiais
Meridiano, Santa Cruz de Tenerife
Klépierre 2013 Investors Days - 06/07/2013

STRONG FOCUS ON STRATEGIC REGIONS
16 -
Demographics and high purchasing power are key criteria
Priority given to countries with high entry barriers
Capitalizing on a strong historical and local footprint with dedicated teams
+ Additional spots in capital cities and popular tourist destinations: Madrid, Tenerife, Porto, Algarve, Warsaw, BudapestSource: Eurostat, 2010 data / GDP per capita in purchasing power standards
Population GDP per capita Demo. growth by 2030
Greater Paris Area 11.8 M 49 800 € +10.7%
Southwest France 8.7 M 25 133 € +16.7%
Greater Lyon Area 7.5 M 28 700 € +10.7%
Southern France 4.9 M 28 300 € +12.5%
Scandinavia 19.6 M 41 415 € +10.0%
Northern Italy 19.1 M 29 133 € +5.7%
Greater Brussels Area 2.5 M 41 039 € +12.2%
Prague Greater Area 2.4 M 29 700 € +10.1%
Europe 500 M 24 500 € +4.1%
Regions enjoying better demographic outlook
Klépierre 2013 Investors Days - 06/07/2013

DELIVERY OF PROJECTS IN THE PAST 5 YEARS AND GOING FORWARD WILL REINFORCE KLEPIERRE’S POSITION
17 -17 -
Southern ScandinaviaGreater Paris Area
Southwest France
Northern Italy
2007-2012■ Le Millénaire
■ St.Lazare Paris
■ Claye-Souilly
2007-2012■ Saint –Orens
■ Blagnac
■ Odysseum
■ Roques
2007-2012■ Il Leone di Lonato
■ Le Corti Venete
■ Il Destriero
■ Metropoli
2007-2012■ Steen & Strøm
■ Sollentuna
■ Gulskogen
■ Metro
■ Emporia
2007 2008 2009 2010 2011 2012 2017
Central Europe
Iberia
Italy
Scandinavia
France-Belgium
+ 2.7Bn€*
9.5Bn€12.7Bn€ 13.0Bn€
13.9Bn€ 15.0Bn€15.5Bn€
2017
13.7%
58.6%
11.5%
45.9%
26.9%
Shopping center portfolio valuation (total share, ex cl. duties)* Total pipeline estimated cost as of 12/31/2012
+ €641 M
+ €820 M
+ €4,176 M
+ €296 M
10.9%
46.3%
27.8%
Klépierre 2013 Investors Days - 06/07/2013

Project GLA (sq.m.)Estimated cost
(M€)*Expected initial
yield*Targeteddelivery
FR
AN
CE
Greater Paris Area
Val d’Europeextension
17,000 94 7.1% Q3 2016
Montparnassetrain station
Klépierre participating in the beauty contest
Southwest FranceGrand Portet
extension8,000 51 9.9% Q3 2016
Lyons Greater AreaClermont Jaude
extension16,000 101 7.2% Q3 2013
Southeast France Marseille Bourse 2,660 17 6.4% Q4 2014
SC
AN
DIN
AV
IA NorwayVinterbro extension 7,600 33 7.6% 13 June 2013
Åsane 52,000 111 8.4% Q4 2017
SwedenKristianstad 28,500 128 7.2% Q4 2014
Allum extension 14,500 58 8.4% 2015
Denmark Viva 48,500 223 6.4% Q4 2015
NORTHERN ITALYRomagna Center
extension8,000 26 7.8% Q1 2014
GREATER BRUSSELS AREA
L’esplanadeextension
26,000 130 7.6% 2016-2017
Neo project Klépierre participating in the beauty con test
DEVELOPMENT PIPELINE TARGETING SPECIFIC REGIONS
18 -
*Data as of December 31, 2012
Klépierre 2013 Investors Days - 06/07/2013
A 2.7 Bn€ PIPELINE* CONCENTRATED IN CORE REGIONS
19 -
Southwest France Norway
Salanca(April 2)
Rives d’Arcins(May 16)
Vinterbro(June 13) +2.5M€ in net rents*
Greater Lyon Area
Jaude+7.3 €M in net rents*
2013 2014Sweden
Kristianstad
*Data as of December 31, 2012. Only the largest projects are displayed.
Greater Paris Area
Val d’Europe
Brussels
L’esplanade
After 2015
Southeast France
Marseille Bourse
Scandinavia
Åsane(Norway)
Viva(Denmark)
Allum(Sweden)
Southwest FranceNorthern Italy
Romagna Center Grand Portet
Klépierre 2013 Investors Days - 06/07/2013
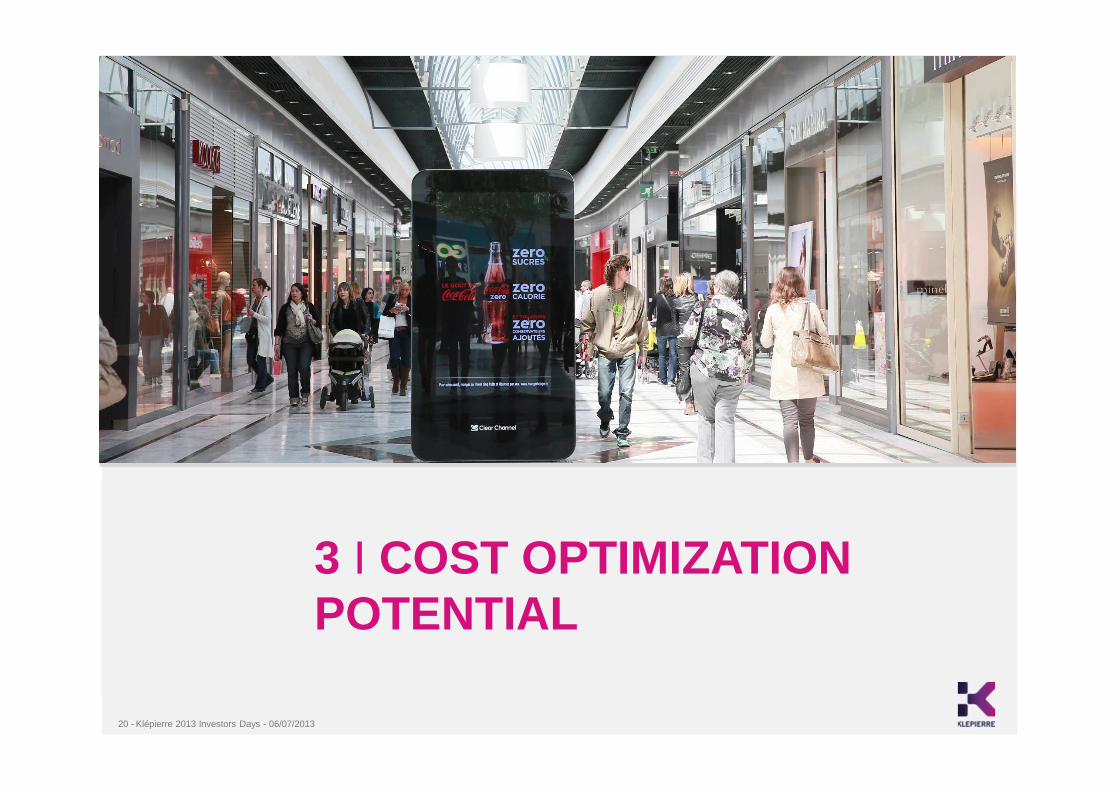
Table of Contents
3 I COST OPTIMIZATION POTENTIAL
20 - Klépierre 2013 Investors Days - 06/07/2013

COST OPTIMIZATION POTENTIAL
Cost-based Analysis
21 - Klépierre 2013 Investors Days - 06/07/2013

2012 Klépierre’s cost base is €166.5 M for manageme nt of a €20 Bn portfolio
22 -
- €120.5 M
72% - €46.0 M
28%
BREAKDOWN IN ASSETS UNDER MANAGEMENT
Klépierre assetsManagement
100%
In €M Total share Group share Third parties
Asset value (excl. duties)
16 445 12 779 3 393
Gross rents 983 782 234
Net rents 918 728 218
COSTS: KLEPIERRE BEST IN CLASS BUT SEEKS TO FURTHER OPTIMISE
PAYROLL GENERAL EXPENSES
Costs 2012 -€166.5 M
� 100% third-party fees +€17.5 M
� JV partners, property & development fees +€72.8 M
Net Costs 2012 -€76.2 M
Net Costs = 9.7% of gross rents
COST BREAKDOWN €166.5 M
Klépierre 2013 Investors Days - 06/07/2013

COST STRUCTURE LARGELY DOMINATED BY FRANCE AND SCANDINAVIA
23 -
GEOGRAPHIC BREAKDOWN IN COSTS2012 (-€166.5 M)
IBERIA(-€12.0 M)
ITALY(-€8.8 M)
CENTRAL EUROPE(-€5.6 M)
58%26%
7%5% 3%
SCANDINAVIA(-€43.4 M)
FRANCE(-€96.3 M)
BREAKDOWN IN RENTS UNDER MANAGEMENT 2012
(INCL. THIRD PARTIES - € 1 217.1 M)
47%
25%
12%
11%6%
IBERIA€140.5 M
ITALY€127.8 M
CENTRAL EUROPE€78.4 M
SCANDINAVIA€298.3 M
FRANCE€566.5 M
2010 2011 2012
1508 1492 1473 1467*
2012 2010 2011 2012
121 119 116 107*
2012
HEADCOUNT (AVERAGE)
Group Spain
* End of period
No. of employees WORKFORCE
FRANCE 576
SCANDINAVIA 405
IBERIA 152
ITALY 130
CENTRAL EUROPE 201
⇒ Not all countries are comparable: in-house facility management in Scandinavia and Central Europe
Klépierre 2013 Investors Days - 06/07/2013

Operational projectsover SAP system
COST REDUCTION DRIVEN BY NEW IT SYSTEM
⇒ Clipper development aims to improve Klépierre’s organization by reinforcing business units and downsizing support functions
General expenses expected to be positively impacted in the short term with implementation of the final steps of the new d ata processing system (SAP Clipper project)
2014 - 2015
Fast implementation of SAP in all countries (invoicing, accounting, reporting)
Central Europe
France Spain
Italy S&S
2010 2011 2012 2013
24 - Klépierre 2013 Investors Days - 06/07/2013

FOCUS ON CLIPPER PROJECT
Asset management
Rental and property management
Better control of net rents and cash flows
Full availability and transparency of data enabling investment strategy adjustments
Financial reporting Immediate availability of business information
Group organization Shared service centers for accounting, reporting and IT. Automation of closing tasks
• Global view of 13 000 contracts representing net rent of €920 M
• Annual expenses of €250 M
• ONE shared master data set
• Immediate availability of all cross-country information on demand
• Consolidated accounts available on D+5
• Group indicators available on D+7
• Significant reduction in back office
• Industrialized IT production
• Traceability
New support for ongoing and
upcoming strategic projects
� Standardized dashboards for retailer sales revenue and shopping center sales performance analysis
� Harmonization of rental forecast process
� Electronic invoicing
� Treasury integration
� CRM
� Facilitated potential integration of new countries
Material efficiency gains expected across business areas
25 - Klépierre 2013 Investors Days - 06/07/2013

ADDITIONAL SAVINGS ON GENERAL EXPENSES
Actions in progress:
⇒ Streamlining all expenses
⇒ Renegotiation with suppliers
⇒ Paris HQ: Relocation planned mid-2014/mid-2015 = A single location
Expected outcome ≈ 10% savings over 3 years
Missions & external fees(-€11.8 M / 26%)
Insurance, Communication, Special events, etc.
(-€10.1 M / 22%)Head offices
(-€9.7 M / 21%)
Operating costs(-€5.1 M / 11%)
IT(-€4.5 M / 10%)
Taxes(-€2.4 M / 5%)
R & D (-€2.4 M / 5%)
€46 M in general expenses where substantial savings are expected
26 - Klépierre 2013 Investors Days - 06/07/2013

Focus on financial structure and costs
27 -
COST OPTIMIZATION POTENTIAL
Klépierre 2013 Investors Days - 06/07/2013

STEADY IMPROVEMENT IN COST OF DEBT
28 -
Klépierre’s cost of debt is the result of:
- Long- and short-term financing
- Debt denominated in Euros & Scandinavian currencies
- A sound interest rate risk management policy
Klépierre has succeeded in lowering its cost of deb t thanks to active
management of both financing resources and interest rate hedging portfolio:
▲Private placements, taps and new issues in order to price several maturities
in Klépierre’s credit curve
▲Swaps unwinding
▲Liquidity position improved from €500 M to € 2 Bn =>
4,45% 4,47%4,17%
3,95%
3,50%
2009 2010 2011 2012 Q1 2013
COST OF DEBT(PUBLISHED DATA)
Higher cost of liquidity.
EUR 68%NOK 14%
SEK 12%
DKK 7%
KLÉPIERRE GROUP'S FINANCING BREAKDOWN BY CURRENCY - UTILIZATIONS
Commercial Paper10% Financial
leases2% Bilateral
facilities2%
Syndicated loans13%
Mortgage loans30%
Bonds43%
KLÉPIERRE GROUP'S FINANCING BREAKDOWN BY TYPE OF RESOURCE - UTILIZATIONS
Data as of June 3, 2013Klépierre 2013 Investors Days - 06/07/2013
MARKET CONDITIONS REMAIN ATTRACTIVE
29 -
Market conditions have been improving for European issuers in terms of both credit spreads and interes t rates:
- Credit spreads and liquidity costs have been tightening strongly since July 2012
- Interest rates remain at their lowest level, both in the Euro Area and Scandinavia
- The markets expect the low interest rate regime to prevail in the medium term
⇒ Banks have resumed lending and the bond market is b uoyant
⇒ Klépierre has been outperforming the market thanks to its deleveraging strategy and the clarification of its
shareholder structure
Klépierre 2013 Investors Days - 06/07/2013
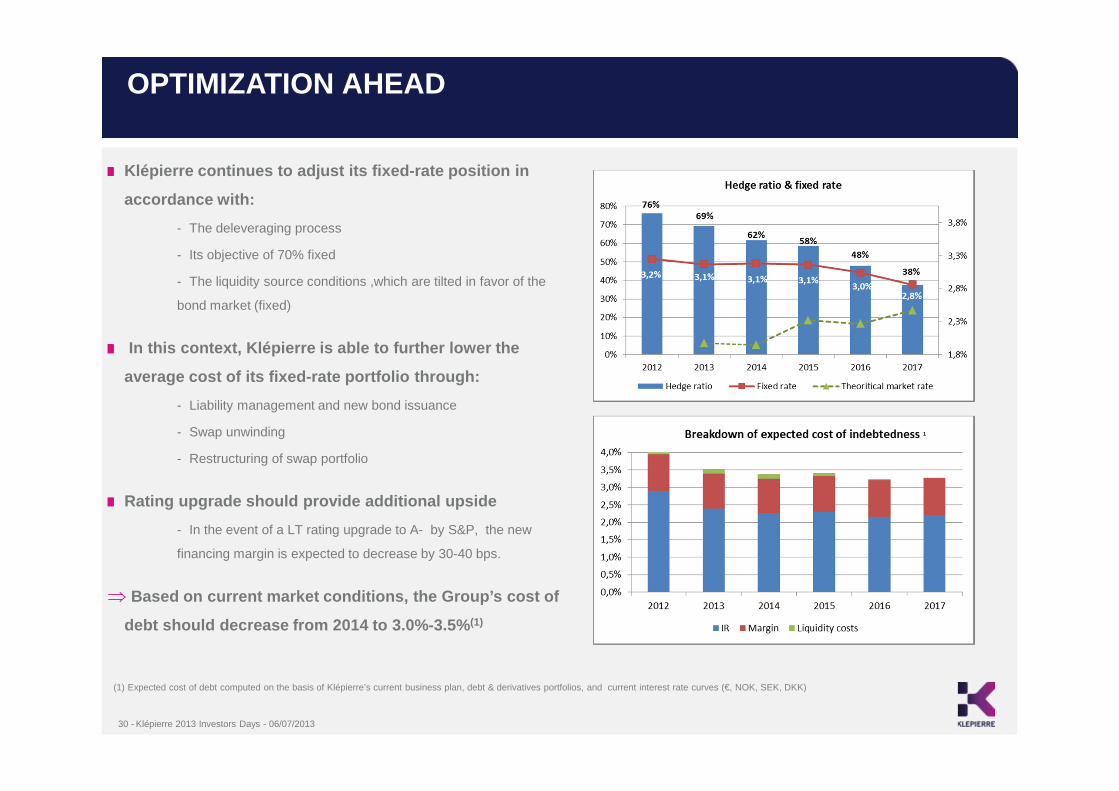
OPTIMIZATION AHEAD
30 -
Klépierre continues to adjust its fixed-rate positi on in
accordance with:
- The deleveraging process
- Its objective of 70% fixed
- The liquidity source conditions ,which are tilted in favor of the
bond market (fixed)
In this context, Klépierre is able to further lower the
average cost of its fixed-rate portfolio through:
- Liability management and new bond issuance
- Swap unwinding
- Restructuring of swap portfolio
Rating upgrade should provide additional upside
- In the event of a LT rating upgrade to A- by S&P, the new
financing margin is expected to decrease by 30-40 bps.
⇒ Based on current market conditions, the Group’s cos t of
debt should decrease from 2014 to 3.0%-3.5% (1)
(1) Expected cost of debt computed on the basis of Klépierre’s current business plan, debt & derivatives portfolios, and current interest rate curves (€, NOK, SEK, DKK)
Klépierre 2013 Investors Days - 06/07/2013

A NEW €750 M REVOLVING CREDIT FACILITY
31 -
On June 3, 2012 Klépierre signed a new € 750 M syndi cated RCFs (16 banks)
This line partially replaces 2 former BNP Paribas u ndrawn RCFs maturing 2016 and 2018
This transaction enables Klépierre to:
- Reduce its liquidity cost, with expected full-year savings of €3.3 M
- Diversify its sources of financing in terms of counterparty: BNP Paribas’ share in total authorization ≈ 22%
- Lengthen the average remaining maturity of its liquidity: + 1 year (≈ 4 years)
- Smoothen the debt maturity profile
Participation of prominent global banks underscores Klépierre’s credit attractiveness and financial syn ergies with
SPG
0
200
400
600
800
1000
1200
1400
1600
1800
2013 2014 2015 2016 2017 2018 2019 2020 2021 ≥ 2022
DEBT MATURITY SCHEDULE
Authorized debt Authorized debt with new syndicated loan (750€M)
RCFS: BREAKDOWN BY COUNTERPARTS' RATING
Klépierre 2013 Investors Days - 06/07/2013

Table of Contents
4 I OPERATIONAL EXCELLENCE AND PARTNERSHIP WITH RETAILERS
32 - Klépierre 2013 Investors Days - 06/07/2013

Retail industry challenges
Sustained economic slowdown across Europe is affecting purchasing power
Changes in e-commerce and consumption habits: customers are more complex
Retailers being online and offline may require different premises
Customer flows need to be more proactively addressed
Increasing time spent in shopping malls to increase purchase rate
Shopping centers: greater need to differentiate from competition
CHALLENGES OF AN EVOLVING RETAIL ENVIRONMENT REQUIRE OPERATIONAL EXCELLENCE
33 -
Klépierre initiatives
Operational Excellence
From Klépierre management and teams
From and towards our tenants/retailers
In welcoming shoppers
Renewed Mix Merchandising
Adapted to specific catchment areas
Adapted to what clients expect and trends
High quality of the retail mix
Customer-centric Shopping Centers
Focus on customer services, welcome and cultivating a zero-defect culture
Klépierre 2013 Investors Days - 06/07/2013

34 -
Must have 70 – 80%
Differientiate 10 – 15%
Exclusive 10 – 15%
RETAILERSTARGET MIX
For each and every asset: there is an ambition and a definition of the leasing action plan
• By sector • Local vs. international brands• Diversity in store size• Synergies between brands
(competition vs. complementarity)
RESPECT FOR RETAIL MIX BALANCE IN THE AREA
• Renewals• Renewal with latest concepts• Re-tenanting before leases
expire
• Coherence with primary and secondary catchment area
• Marketing analysis based: client expectations, satisfaction level
• Development of the area• Shopping center competition –
current and future
• KPIs: Est. Rental Value, OCR• Sales growth, etc. • Latest concept of the retailer? • Adapted size?
ANALYSISBY TENANT
CUSTOMERPROFILE
LEASING
MERCHANDISING MIX OF A REGIONAL SHOPPING CENTER
A STRUCTURED APPROACH TO LEASING ANDRE-TENANTING
Klépierre 2013 Investors Days - 06/07/2013

CHANGING THE MERCHANDISING MIX IN A FEW WORDS
Re-tenanting: time is of the essence!
Part of a global and consistent plan for the shopping center: - not an isolated decision for a specific retailer within a mall
- not one standard mix applicable everywhere
The result of a multi-criteria approach
The decision to re-tenant before the lease expires is made after a thorough financial analysis
A one- to three-year timetable for execution
As some traditional anchor stores reduce store size or close, Klépierre has an opportunity to work on value-creative reconfigurations and extract rental uplift
35 - Klépierre 2013 Investors Days - 06/07/2013

EXAMPLE OF RETENANTING PLAN – NOVY SMICHOV
Ambition ���� Be the best shopping center in the city with differ entiating and upscale brands in all sectors
36 -
How is the review structured?
1. Center analysis: key strengths and weaknesses
- Footfall analysis, revenueperformances, yields, OCR, rents benchmark, KPIs by tenants, etc.)
2. Mix merchandising and offer structure
3. Competition Analysis
4. Structured leasing action plan with timetable:
- By area, re-lettings, new brands, etc.
- Actions since 2011, additional objectives:
5. Marketing plan: achievements, ambitions, objectives
6. Financial plan: ERVs and 5-year cash flowprojections
Klépierre 2013 Investors Days - 06/07/2013

NOVY SMICHOV – NEW OPENINGS 2013
Revitalizing the retail mix with differentiating bra nds
37 -
Tommy HilfigerOpened 28/03
Swarovski Opened 15/02
Armani JeansOpened 04/03
Carwash ExpressOpened 01/03
MACOpened 01/05
Brioche DoréeOpened 28/03
Klépierre 2013 Investors Days - 06/07/2013

RELATIONSHIPS WITH RETAILERS - PROMISE: KLEPIERREIS A PARTNER TO RETAILERS
38 -
This promise demands operational excellence from bo th parties
An approach by key account complements the “asset by asset” approach
Review of each retailer’s portfolio at regional, domestic and international levels
The country and regional managers, the Group Head of Leasing and CEO/COO -when appropriate - lead account reviews:
- Bi-annual meetings with each retailer to review:
- Recent openings, new projects, new concepts to implement with Klépierre
- Financial performance
- Overall relationship
- Retailer’s strategic and development plan across the regions
Klépierre 2013 Investors Days - 06/07/2013

RELATIONSHIPS WITH RETAILERS – EXAMPLES
39 -
Expanding Italian Group – 3,000 stores globally -developing the Calzedonia, the Intimissimi, Tezenisand Falcoreni brands
Already 31 Calzedonia stores, 30 Intimissi stores and 15 Tezenis stores in Europe with Klépierre
Increased brand awareness in France and expansion plan: 5 stores opened in 2012 with Klépierre in France
MORE CALZEDONIA STORES IN KLEPIERRE SHOPPING CENTERS
Klépierre supports the development of expanding ret ailers
CELIO’S FIRST OPENING IN POLAND WITH KLEPIERRE IN THE SADYBA SHOPPING CENTER
Celio, the leading men’s clothing retailer in France has developed a strong global presence: 1,000 retail outlets in more than 60 countries.
65 Celio outlets, of which 53 in France and 12 in Europe, with Klépierre
The arrival of Celio in Poland: a major strategic challenge for the brand, and an illustration of the successful European partnership with Klépierre
Klépierre 2013 Investors Days - 06/07/2013

KEEP RETAIL MOVING FORWARD
40 -
An “R&D” team in charge of systematic, regular review of promising new retailers
Established retailers in a shopping center are very demanding towards Klépierre to regularly renew the retail mix with selected differentiating retailer/new concepts
Objective: Identify new brands and winning concepts and bring them to Klepierre malls
Successful new large retailers expanding in Europe (e.g., Primark, Hollister, J.Crew, Uniqlo, etc.)
Local brands targeting international development
Exclusive brands or exceptional designs
A methodical approach by industry: Fashion, Health & Beauty, Food & Beverage
Klépierre 2013 Investors Days - 06/07/2013

INNOVATION - KLEPIERRE AND CINEMA CITY OPEN THE FIRST 4-DX CINEMA
41 -
MAY 2013: Klépierre and Cinema City, the leading operator of multiplex cinemas in Central Europe, open the first cinema equipped with the 4-DX technology in NovýSmíchov (Prague)
This significant innovation and investment reinforce the center’s attractiveness for retailers
Klepierre already counts 19 Cinema City movie theaters in its Central Europe shopping centers and some 6.5 million people visited them in 2012
Klépierre’s goal is to constantly innovate by propo sing unique and novel concepts that amaze customers and increase their loy alty
Klépierre 2013 Investors Days - 06/07/2013
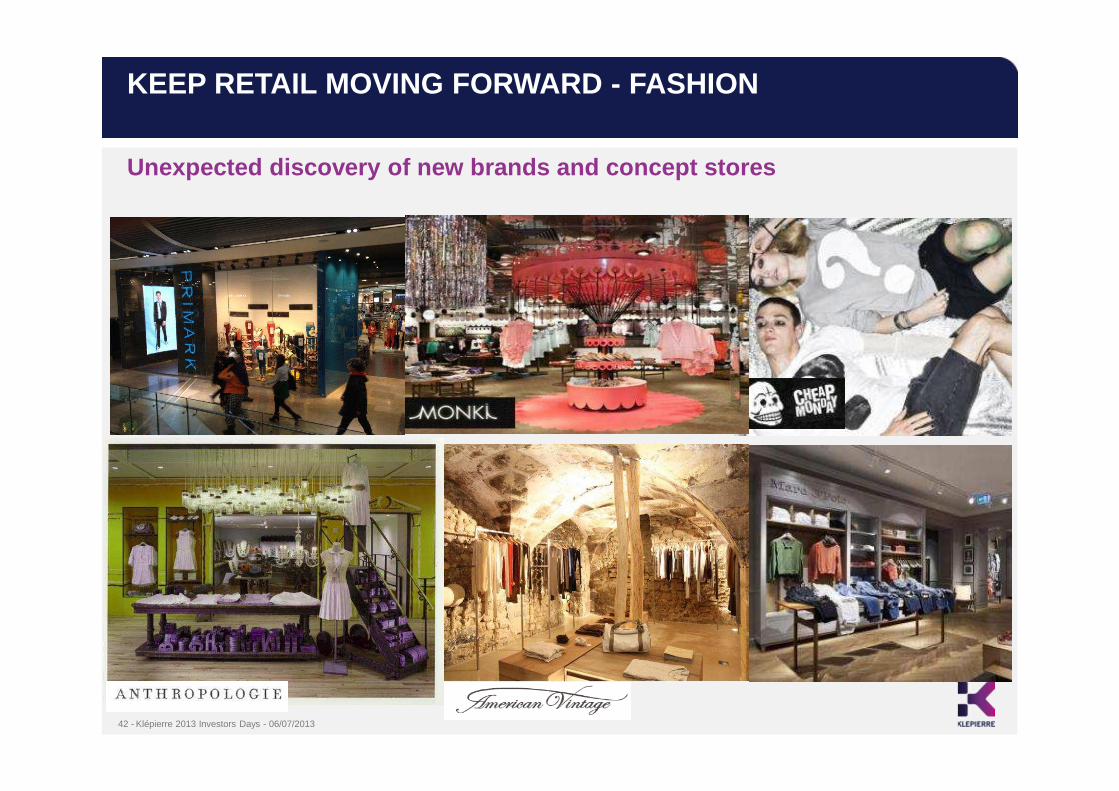
KEEP RETAIL MOVING FORWARD - FASHION
42 -
Unexpected discovery of new brands and concept stor es
Klépierre 2013 Investors Days - 06/07/2013

KEEP RETAIL MOVING FORWARD – HEALTH AND BEAUTY
43 -
Fantastic shop designs and customer invitations to try out products
Klépierre 2013 Investors Days - 06/07/2013

KEEP RETAIL MOVING FORWARD – FOOD & BEVERAGE
44 -
A great and ever-changing selection of food and bev erages from around the world
Klépierre 2013 Investors Days - 06/07/2013

45 -
OPERATIONAL EXCELLENCE IN SUSTAINABLE DEVELOPMENT
Klépierre’s 2010-2015 action plan is reviewed annua lly and adapted in accordance with changes in Group activities and reg ulations
ENVIRONMENTAL
SOCIAL
SOCIETAL
PERFORMANCE Risks whose
improvements are measurable
EXEMPLARITYMust-have social and
working conditions
INNOVATIONRisks identified as key for
the future
OBJECTIVES
ACTION PLAN
TIMETABLE
THE MOST SIGNIFICANT AND MATERIAL FOR KLÉPIERRE AND STAKEHOLDERS :
A detailed mapping of key topics
Topics belong to the 3 types of traditional risks
Topics divided into 3 expected performance targets level
For each, definition of
Klépierre 2013 Investors Days - 06/07/2013

46 -
REDUCE ENERGY CONSUMPTION
IMPROVE WASTE RECYCLING
As of 31/12/2012, 39% of waste in Klépierre’s malls was recycled
Objective: Reach 50% by 2016
ACCESSIBILITY OFSHOPPING MALLS
Objective: Increase shopping center access options to decrease carbon footprint of our shopping centers
Action plan: Development of zones dedicated to green transportation, communication on various ways to access shopping centers, etc.
SUSTAINABLE DEVELOPMENT: SELECTED EXAMPLES
PERFORMANCE PERFORMANCE INNOVATIONTarget level
Topics
Action plan
Klépierre 2013 Investors Days - 06/07/2013
Between 2010 and 2012, 33 million kWh were saved, a 10% reduction (constant scope basis)
Objective: Reduce energy consumption by 25% (kWh/visit by 2020)

THANK YOU
Klépierre 2013 Investors Days - 06/07/201347 -