Embed Size (px)
Citation preview
Kirsten Fiest, PhD
June 23, 2015
1
CONDUCTING META-ANALYSES IN HEALTH RESEARCH
A statistical method of combining data from multiple independent sources
Powerful tool to compare the effects of interventions, determine the magnitude of association, or prevalence/incidence of disease
Often informed by the results of a systematic review
Can assess differences between subgroups that may not be possible in individual studies
2
META-ANALYSIS
SAS, STATA, SPSS, R, spreadsheets, RevMan
Graphics quality will differ
Easiest to start with data in a spreadsheet
Will need, at minimum, study identifier, effect size, and measure of error
3
STATISTICAL PROGRAMS
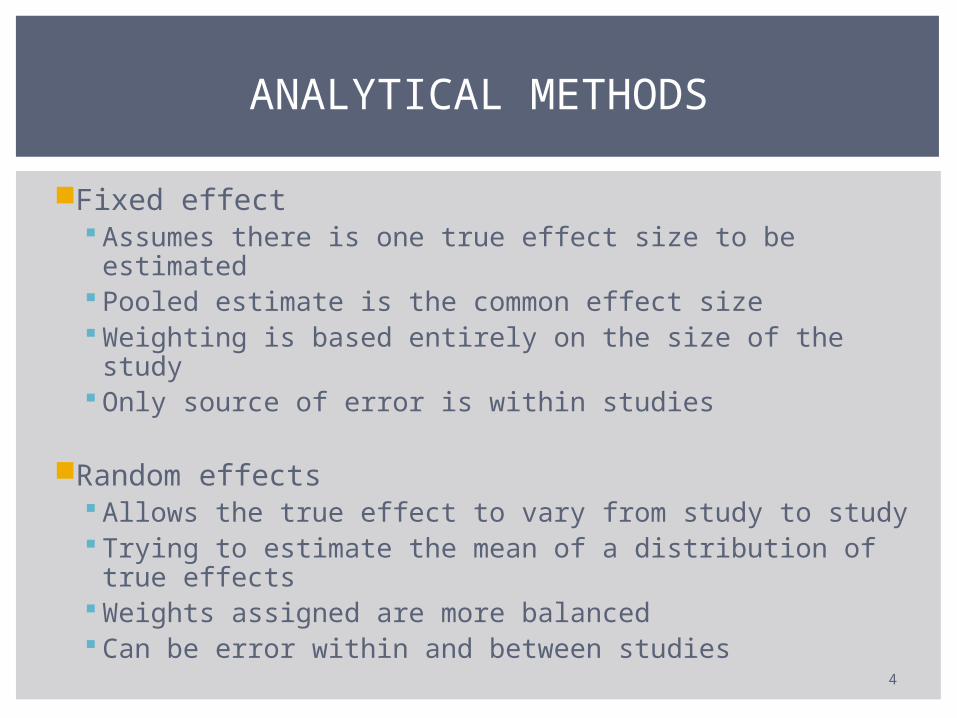
Fixed effect Assumes there is one true effect size to be estimated Pooled estimate is the common effect size Weighting is based entirely on the size of the study Only source of error is within studies
Random effects Allows the true effect to vary from study to study Trying to estimate the mean of a distribution of true
effects Weights assigned are more balanced Can be error within and between studies
4
ANALYTICAL METHODS
5
INTERPRETING META-ANALYTIC OUTPUT
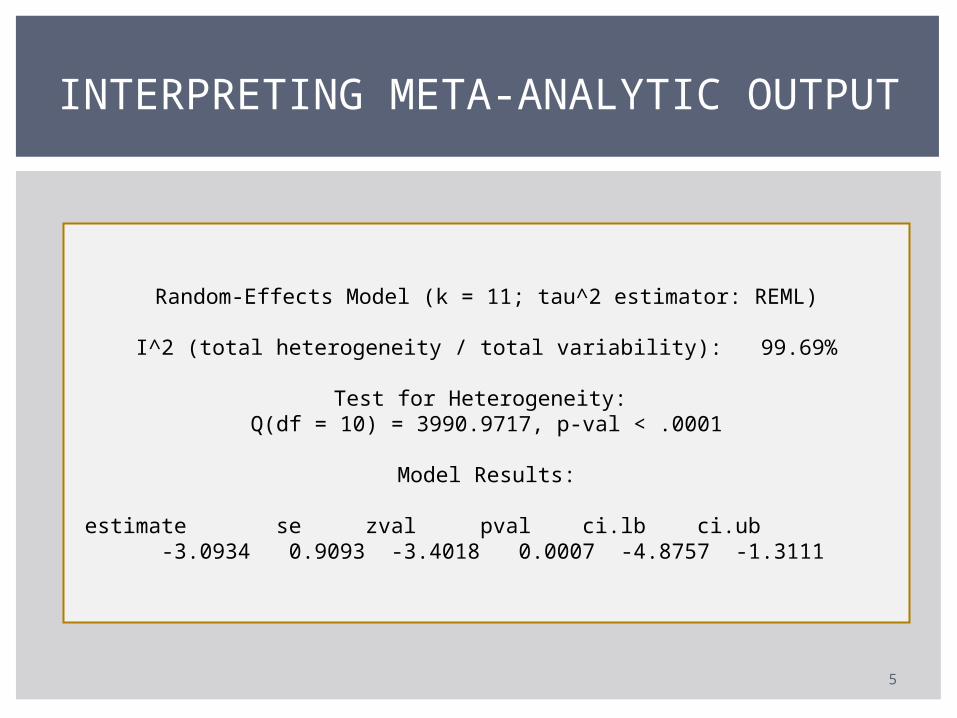
Random-Effects Model (k = 11; tau^2 estimator: REML)
I^2 (total heterogeneity / total variability): 99.69%
Test for Heterogeneity: Q(df = 10) = 3990.9717, p-val < .0001
Model Results:
estimate se zval pval ci.lb ci.ub
-3.0934 0.9093 -3.4018 0.0007 -4.8757 -1.3111

6
INTERPRETING A FOREST PLOT
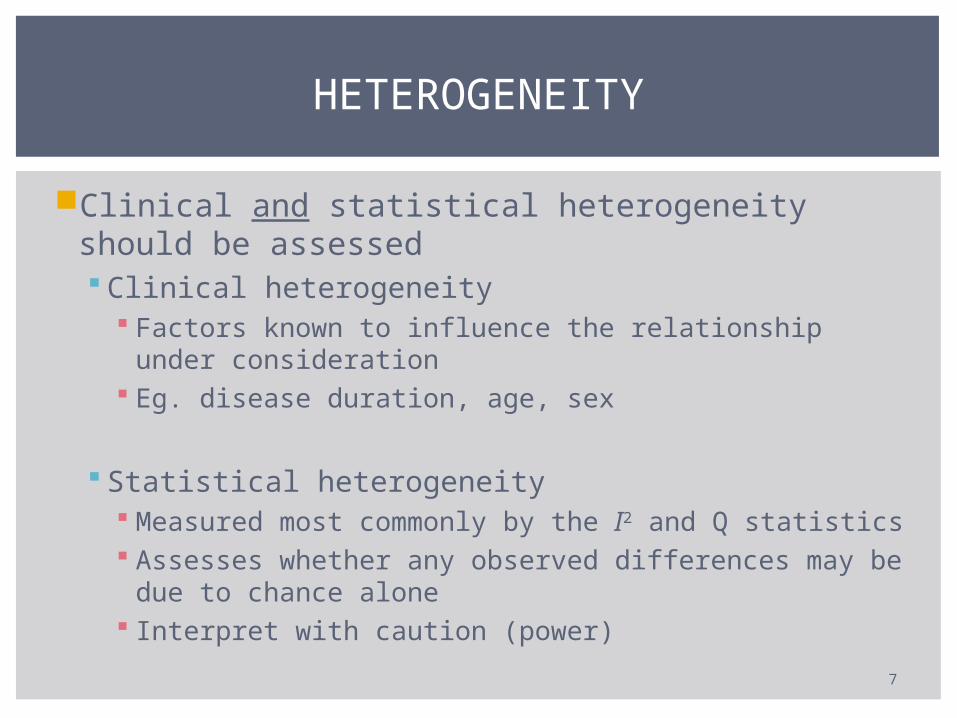
Clinical and statistical heterogeneity should be assessed Clinical heterogeneity
Factors known to influence the relationship under consideration
Eg. disease duration, age, sex
Statistical heterogeneity Measured most commonly by the I2 and Q statistics Assesses whether any observed differences may be due
to chance alone Interpret with caution (power)
7
HETEROGENEITY
8
STRATIFICATION
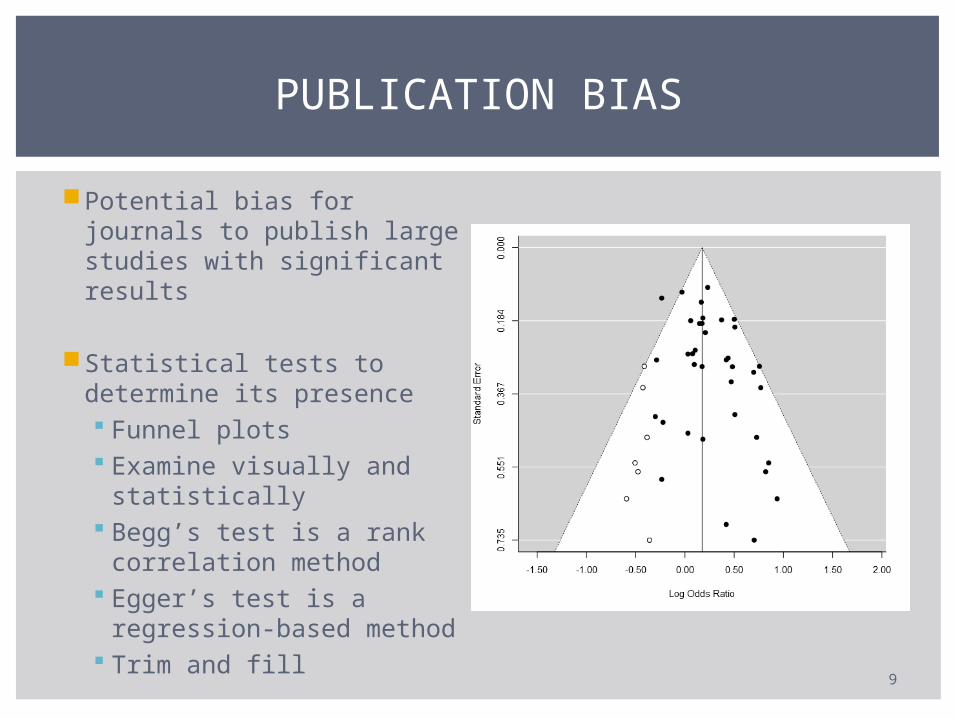
Potential bias for journals to publish large studies with significant results
Statistical tests to determine its presence Funnel plots Examine visually and
statistically Begg’s test is a rank
correlation method Egger’s test is a
regression-based method Trim and fill
9
PUBLICATION BIAS

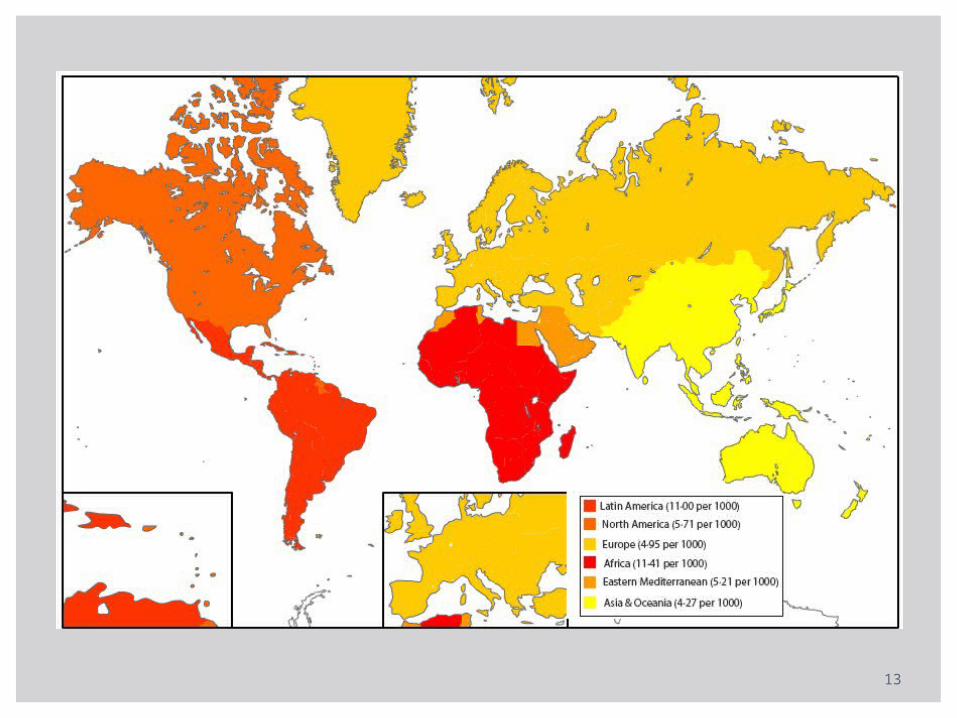
Used to identify trends across an extraneous variable
Allows for the inclusion of continuous or categorical variables
Is the incidence of dementia changing over time?
Does the prevalence of epilepsy differ by geographic region?
10
META-REGRESSION
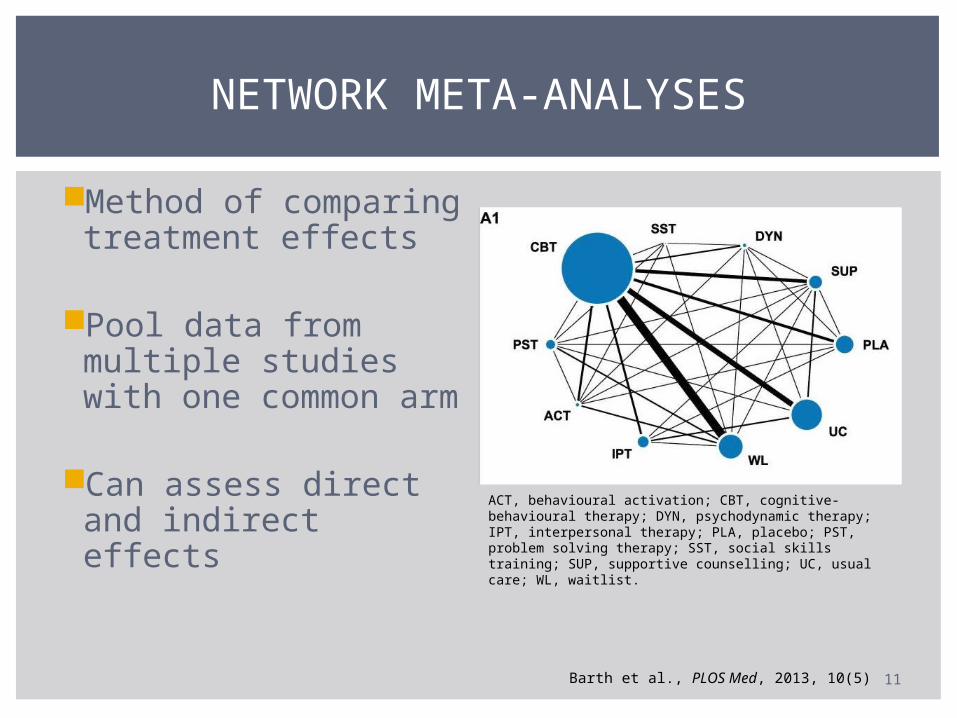
Method of comparing treatment effects
Pool data from multiple studies with one common arm
Can assess direct and indirect effects
11
NETWORK META-ANALYSES
ACT, behavioural activation; CBT, cognitive-behavioural therapy; DYN, psychodynamic therapy; IPT, interpersonal therapy; PLA, placebo; PST, problem solving therapy; SST, social skills training; SUP, supportive counselling; UC, usual care; WL, waitlist.
Barth et al., PLOS Med, 2013, 10(5)

PRISMA (Preferred Reporting Items for Systematic Reviews and Meta-Analyses)
MOOSE (Meta-Analysis of Observational Studies in Epidemiology)
Consider reporting guidelines for initial studies as well (STARD, STROBE, CONSORT)
12
REPORTING GUIDELINES
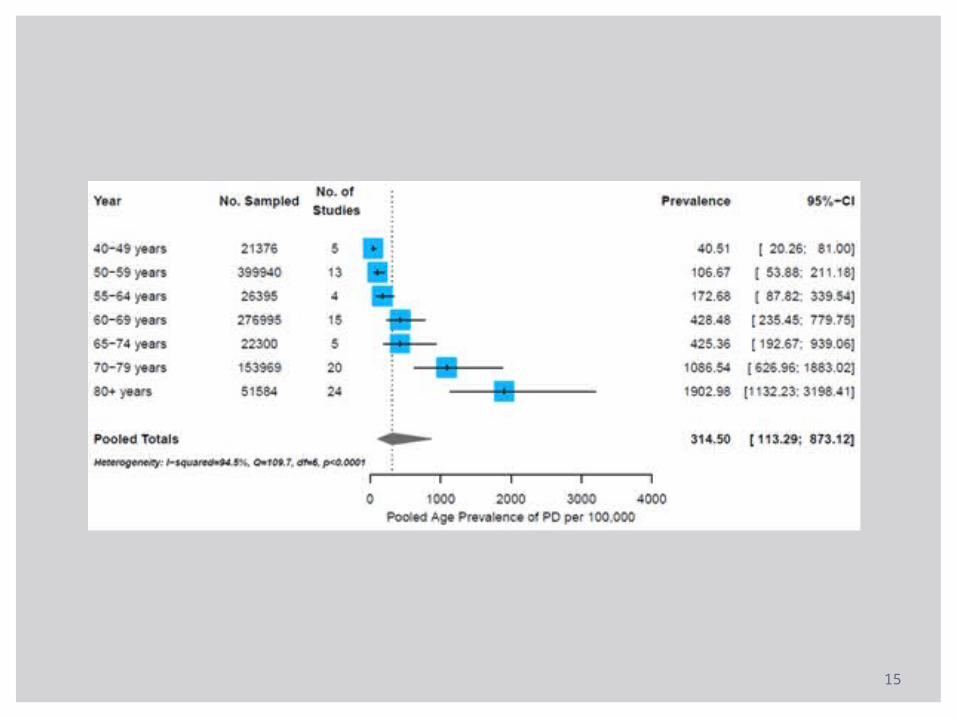
13
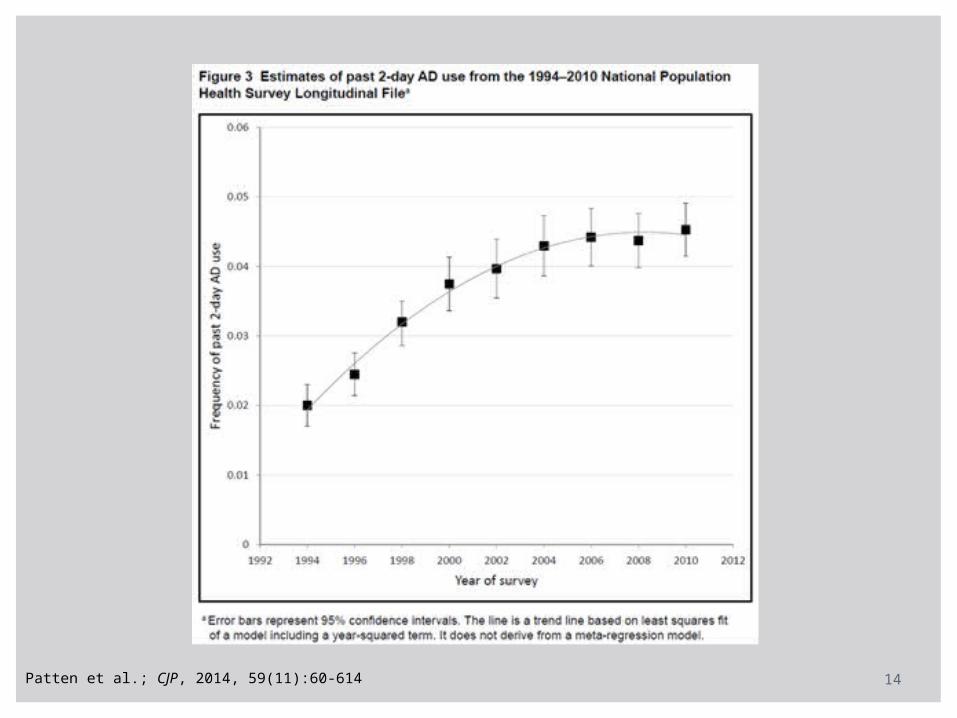
14Patten et al.; CJP, 2014, 59(11):60-614
15
Limited by the reporting of individual papers Definitions, estimates provided, basic study details
Quality of individuals studies may vary
Heterogeneity between estimates may weaken some conclusions
16
LIMITATIONS
Reporting guidelines
Systematic Reviews in Health Care: Meta-Analyses in Context, 2nd Edition. Egger, Smith & Altman. 2008.
Journals in your field of interest
RESOURCES
17

18