Embed Size (px)
Citation preview

KION HOLDING 1 GmbH
Wiesbaden
Group management report and consolidated financial statements
as at 31 December 2012
This is a translation of the German
“KION Holding 1 GmbH Konzernlagebericht und
Konzernabschluss zum 31.12.2012”
Sole authoritative and universally valid version is the German language document.

KION HOLDING 1 GmbH Wiesbaden
Group management report as at
31 December 2012

KION Holding 1 GmbH
Group management report 2012
Page 3 of 69
3
CONTENTS Highlights in 2012 .................................................................................................................................... 6
Company profile and strategy ................................................................................................................. 7
Group structure, organisation, management ....................................................................................... 7
Shareholders ................................................................................................................................... 7
Segment structure ........................................................................................................................... 9
Management and control ............................................................................................................... 10
Business model and market positioning ............................................................................................. 11
Business model .............................................................................................................................. 11
Market and influencing factors....................................................................................................... 13
Market position .............................................................................................................................. 14
Strategy of the KION Group .............................................................................................................. 15
Key strategic measures in 2012 .................................................................................................... 16
The segments and their products and services................................................................................. 18
Linde Material Handling (LMH) segment ....................................................................................... 18
STILL segment .............................................................................................................................. 19
Financial Services (FS) segment................................................................................................... 19
Other segment ............................................................................................................................... 20
Value-based management ................................................................................................................. 20
Economic environment .......................................................................................................................... 22
Macroeconomic conditions ................................................................................................................ 22
Sectoral conditions ............................................................................................................................ 22
Sales markets ................................................................................................................................ 22
Procurement markets .................................................................................................................... 24
Financial markets .............................................................................................................................. 24
Regulatory situation ........................................................................................................................... 25
Financial position and financial performance ........................................................................................ 26
Overall assessment of the economic situation .................................................................................. 26
Business situation and financial performance of the KION Group .................................................... 26
Key influencing factors .................................................................................................................. 26
Order intake ................................................................................................................................... 27
Revenue ........................................................................................................................................ 27
Earnings ......................................................................................................................................... 30
Business situation and financial performance of the LMH segment ................................................. 33
Revenue ........................................................................................................................................ 33
Earnings ......................................................................................................................................... 33
Business situation and financial performance of the STILL segment ............................................... 34
Revenue ........................................................................................................................................ 34

KION Holding 1 GmbH
Group management report 2012
Page 4 of 69
Earnings ......................................................................................................................................... 34
Business situation and financial performance of the Financial Services (FS) segment ................... 35
Business situation .......................................................................................................................... 35
Financial performance ................................................................................................................... 35
Business situation and financial performance of the Other segment ................................................ 35
Business situation .......................................................................................................................... 35
Financial performance ................................................................................................................... 35
Financial position ............................................................................................................................... 36
Principles and objectives of financial management ...................................................................... 36
Main financing activities in 2012 .................................................................................................... 36
Analysis of capital structure ........................................................................................................... 37
Analysis of capital expenditure ...................................................................................................... 40
Analysis of liquidity ........................................................................................................................ 41
Net assets .......................................................................................................................................... 43
Investor relations ............................................................................................................................... 44
Non-financial performance indicators .................................................................................................... 46
Human resources .............................................................................................................................. 46
HR strategy .................................................................................................................................... 46
Headcount ..................................................................................................................................... 47
Diversity ......................................................................................................................................... 48
Development of specialist workers and executives ....................................................................... 48
Training and professional development ......................................................................................... 48
Health and safety in the workplace ............................................................................................... 49
Research and development............................................................................................................... 50
Strategic focus of research and development ............................................................................... 50
Key R&D figures ............................................................................................................................ 50
Focus of R&D in 2012 ................................................................................................................... 51
Customers ......................................................................................................................................... 54
Customer focus at KION ................................................................................................................ 54
Customer-related performance indicators ..................................................................................... 54
Marketing and sales activities........................................................................................................ 55
Sustainability ..................................................................................................................................... 56
Events after the balance sheet date ...................................................................................................... 57
Expected developments ........................................................................................................................ 58
Opportunities report ........................................................................................................................... 58
Risk report ......................................................................................................................................... 59
Principles of risk management ...................................................................................................... 59
Material features of the internal control and risk management system pertaining to the (Group) accounting process ........................................................................................................................ 59

KION Holding 1 GmbH
Group management report 2012
Page 5 of 69
Market risks ................................................................................................................................... 60
Competition risks ........................................................................................................................... 61
Research and development risks .................................................................................................. 61
Strategic risks ................................................................................................................................ 62
Procurement and sales risks ......................................................................................................... 62
Production risks ............................................................................................................................. 63
IT risks ........................................................................................................................................... 63
Financial risks ................................................................................................................................ 63
Accounting risks arising from goodwill and the brands ................................................................. 64
Risks from financial services ......................................................................................................... 65
Human resources risks .................................................................................................................. 65
Legal risks ...................................................................................................................................... 66
External risks ................................................................................................................................. 66
Aggregate risk................................................................................................................................ 66
Outlook .............................................................................................................................................. 67
Expected macroeconomic conditions ............................................................................................ 67
Expected sectoral conditions ......................................................................................................... 67
Expected business situation and financial performance ............................................................... 67
Expected financial position ............................................................................................................ 68

KION Holding 1 GmbH
Group management report 2012
Page 6 of 69
Highlights in 2012 The KION Group can look back on a successful financ ial year 2012: a record result through strategic measures, stable demand and a further inc rease in profitability
• Order intake (€4,700 million) was up from last year despite the downturn in the global market • Consolidated revenue increased by 8.2 per cent to €4,727 million • The adjusted EBIT margin reached a new high of 9.3 per cent as a result of structural
improvements • The Group’s capital structure was significantly improved following transactions with
Weichai Power • The foundation was laid for further growth in emerging markets
KION Group key figures
in € million 2012 2011 2010Changes
2012/2011
Revenue 4,727 4,368 3,534 8.2%
In Germany 1,225 1,175 900 4.3% Outside Germany 3,501 3,194 2,634 9.6%Order intake 4,700 4,682 3,860 0.4%Order backlog 808 953 801 -15.2%
EBITDA 915 569 380 60.8%Adjusted EBITDA¹ 747 665 462 12.3%EBIT 550 213 35 >100%Adjusted EBIT¹ 438 365 139 20.2%Net income (loss) 161 -93 -197 >100%
Cash and cash equivalents² 562 373 253 50.6%Financial debt³ 2,352 3,005 2,879 -21.7%Net financial debt 1,790 2,631 2,626 -32.0%Equity 660 -488 -400 >100%
Adjusted EBITDA Margin¹ 15.8% 15.2% 13.1% -Adjusted EBIT Margin¹ 9.3% 8.3% 3.9% -
Free cash flow4 518 234 76 >100%
Capital expenditures5 155 133 123 16.6%Total spending on R&D 120 120 103 -0.1%R&D spending/revenue (%) 2.5% 2.8% 2.9% -
21,215 21,862 19,968 -3.0%R&D employees 847 900 827 -5.9%
1 Adjusted for KION acquisition items and one-off items2 Cash and cash equivalents3 Financial liabilities are defined as non-current and current f inancial liabilities4 Free cash flow is defined as Cash flow from operating activities plus Cash flow used in investing activities5 Excluding leased assets and rental assets6 Number of employees in full-time equivalents as at 31 December
Employees incl. apprentices and
trainees as at 31 December6

KION Holding 1 GmbH
Group management report 2012
Page 7 of 69
1) Management participation of around 5.7 per cent included in 75 per cent share in KION Holding 1 GmbH 2) Weichai Power with further options to acquire additional shares 3) Under certain conditions Weichai Power’s share in Linde Hydraulics can be increased further.
COMPANY PROFILE AND STRATEGY
The KION Group is a leading provider of industrial trucks and logistics solutions. By offering a broad product range, tailored service and system solutions and financing options, KION helps its customers to efficiently manage their internal production processes and global supply chains. KION has six brands – Linde, STILL, Fenwick, OM-STILL, Baoli and Voltas MH – and is the second largest manufacturer of forklift trucks, warehouse trucks and other industrial trucks in the world. It operates 15 production facilities and eleven research and development centres – and has more than 1,100 sales and service outlets in 111 countries.
Group structure, organisation, and management
Shareholders
The consolidated financial statements cover the group of consolidated companies belonging to KION Holding 1 GmbH. As at the reporting date of 31 December 2012, KION Holding 1 GmbH indirectly held all shares in KION GROUP GmbH, which acts as the strategic management holding company and operational parent company of the KION Group (also referred to below as simply 'KION').
The number of shareholders increased in the year under review. In December 2012, the shareholders’ meeting of KION Holding 1 GmbH passed a resolution to increase the Company’s share capital. After the capital increase, Weichai Power Co., Ltd. (referred to below as 'Weichai Power') holds a 25 per cent share in KION Holding 1 GmbH through its subsidiary Weichai Power (Luxembourg) Holding S.à r.l. The contribution amount was paid by Weichai Power on 27 December 2012. The capital increase was entered in the commercial register in January 2013 (see ‘Events after the balance sheet date’ on page 57). The remaining 75 per cent of the shares will be held on the one hand indirectly through investment vehicles and subsidiaries of former shareholders Goldman Sachs Capital Partners and KKR & Co. L.P., and on the other hand by an management participation company. The latter company manages about 5.7 per cent of the management holdings in KION Holding 1 GmbH.
Chart 2: Shareholders of the KION Group

KION Holding 1 GmbH
Group management report 2012
Page 8 of 69
The acquisition of shares by way of capital contributions made by Weichai Power further strengthened KION's capital structure. A detailed explanation can be found in the presentation of the financial position (see pages 36 to 42). Weichai Power has a call option vis-à-vis Superlift Holding S.à r.l. to acquire a further 3.3 per cent of the shares, which it can exercise before mid-2013 or, should KION be floated on the stock market in future, during the three months after flotation. Moreover, in the event of flotation on the stock market, Weichai Power can increase its equity investment (with full recognition of the resulting dilutive effects) to 33.3 per cent by means of a capital increase, if it previously held at least 28.3 per cent of the shares, or to 30.0 per cent, if it previously held less than 28.3 per cent of the shares.
The acquisition of shares is part of a long-term strategic partnership between the individual companies of KION and Weichai Power, at the core of which is close cooperation in the field of industrial trucks and hydraulic drive technology (further details can be found in the section on strategy, page 16). Under the agreement, Weichai Power also acquired a 70 per cent controlling interest in Linde Hydraulics GmbH & Co. KG (referred to below as 'Linde Hydraulics') with effect from 27 December 2012. The majority of the former hydraulics business of Linde Material Handling GmbH (referred to below as 'LMH GmbH') was transferred into this company. LMH GmbH continues to hold the remaining 30 per cent as a strategic investment. Weichai Power’s share in Linde Hydraulics can be increased further under certain conditions (see note 6 on page 8).

KION Holding 1 GmbH
Group management report 2012
Page 9 of 69
Segment structure
KION is represented in the market by two global brands – Linde and STILL – and four regional brands: Fenwick (France), OM-STILL (Italy), Baoli (China and other emerging markets) and Voltas MH (India). While the brand companies have full operational and commercial responsibility within their particular markets, KION GROUP GmbH acts as a strategic management holding company and is responsible for the cross-brand Group strategy as well as for key Group functions, for which it defines group-wide business standards. For internal management purposes, KION has divided its business into operating segments that correspond to the reportable segments required by international financial reporting standards (IFRS 8). KION changed this segment structure in 2012, after having already put in place the structures required from an organisational and company law perspective to manage and show the financial services activities of the Group separately in 2012. These are now aggregated in the Financial Services segment. The figures for 2012 and 2011 have been reported in accordance with the revised segment structure as shown below. The Linde Material Handling (LMH) segment encompasses the Linde, Fenwick and Baoli brands. The hydraulics business was also part of the LMH segment until KION sold its majority stake in Linde Hydraulics on 27 December 2012. Linde Hydraulics is recognised as an affiliated company in the consolidated financial statements (using the equity method). The STILL segment comprises the STILL and OM-STILL brands. Spare parts business and service form an integral part of the LMH and STILL segments and complement their product portfolios. However, financing business, which promotes sales, is assigned to the new Financial Services (FS) segment. The Other segment essentially consists of internal activities relating to IT and logistics as well as the group holding activities of the KION Group. The Voltas MH brand is also assigned to the Other segment. Chart 3: Segments

KION Holding 1 GmbH
Group management report 2012
Page 10 of 69
Management and control
KION follows generally accepted standards of sound, responsible corporate governance. The German Corporate Governance Code (DCGK) provides the framework for management and control structures and procedures. Further information about corporate governance at KION is available on the Company's website (www.kiongroup.com). The Executive Board of KION GROUP GmbH is responsible for the operational management of the KION Group, the details of which are set out in the rules of procedure. As at 31 December 2012 the responsibilities of the Executive Board members were as follows: Gordon Riske, Chief Executive Officer (CEO), is responsible for strategy, communications, governance and compliance, market intelligence and the Group's Asian business. Dr Thomas Toepfer was appointed to the Executive Board in the role of Chief Financial Officer (CFO) with effect from 1 September 2012. He is in charge of finance, the FS segment, IT activities, mergers & acquisitions and investor relations. He replaced Harald Pinger, who left at his own request on 31 August 2012. Until his departure at the end of 2012, Otmar Hauck was Chief Operating Officer (COO) and was responsible for quality, central operations, purchasing, logistics and product development in the Group. No new COO was appointed for KION GROUP GmbH. After Mr Hauck left, responsibility for purchasing passed to Dr Thomas Toepfer, while CEO Gordon Riske took charge of KION Warehouse Systems. Until his retirement on 11 January 2013, Klaus Hofer was responsible for human resources, legal affairs, health & safety and internal audit, and was also KION's Labour Relations Director. His responsibilities have been transferred to Gordon Riske and Dr Thomas Toepfer. The Executive Board was expanded in January 2013 in response to the growing significance of business in Asia and to make the management of the Linde and STILL brands more involved in running the Group as a whole (see 'Events after the balance sheet date', page 57). The Executive Board maintains a relationship of trust with, and is monitored by, the Company's Supervisory Board. The Supervisory Board consists of six shareholder representatives, who are chosen by the shareholders' meeting, and six employee representatives. It advises the Executive Board in its handling of significant matters and business transactions. The Supervisory Board has created a Human Resources Committee and an Audit Committee to increase the efficiency of its work. It also has an Arbitration Committee pursuant to section 27 (3) German Codetermination Act (MitbestG), which meets if required to do so in circumstances specified by law or by the memorandum and articles of association. The composition of the Supervisory Board is described in note 44 on pages 86 and 87. In the year under review the remuneration paid to the Executive Board comprised a fixed salary and non-cash benefits (including pension entitlements) and performance-related components. The basic principles of the remuneration structure and the total amounts paid to the members of the Executive Board and Supervisory Board are set out in the notes to the consolidated financial statements (note 43, pages 84 and 85).
KION Holding 1 GmbH
Group management report 2012
Page 11 of 69
Business model and market positioning
Business model
KION earns most of its consolidated revenue from the sale of industrial trucks. In the reporting year, new products accounted for 56 per cent of the Group's revenue, while service business (including spare parts) generated 40 per cent. Four per cent related to hydraulics components, which were sold to Weichai Power to the furthest extent possible with effect from 27 December 2012. So that it can offer comprehensive support to customers worldwide, KION covers every step of the value chain: product development, manufacturing, sales and logistics, spare parts business, financial services and system and software solutions. The purpose of research and development activities (R&D) is to consolidate and extend KION's technology leadership. 847 developers are employed across the KION brand companies. The focus of the Group's R&D activities is described on page 50. The different industrial trucks are manufactured at production facilities situated at strategically beneficial locations within the global network. Owing to the particular requirements of its business and to ensure security of supply, KION manufactures most of the major components itself – notably lift masts, axles, counterweights and safety equipment. Other components – such as electronic components, rechargeable batteries, engine components and industrial tyres – are purchased through KION's global procurement organisation. There are also long-term supply agreements for hydraulics components with Weichai Power (see p. 16 for further information about the strategic partnership with Weichai Power). KION operates a total of 15 production facilities in eight countries. The product portfolio includes counterbalance trucks powered by an internal combustion engine or electric drive, warehouse technology (ride-on and hand-operated industrial trucks) and towing vehicles for industrial applications. It covers all load capacities, from 1 tonne to significantly in excess of 40 tonnes.

KION Holding 1 GmbH
Group management report 2012
Page 12 of 69
Table 1: KION’s production and major logistics sites
Location Products/use
Linde Material Handling
Germany
Aschaffenburg IC trucks, E trucks, warehouse trucks
Weilbach Components production Kahl Spare part warehousing, Components production
France Châtellerault Components production UK Merthyr Tydfil1) Heavy IC trucks1), container trucks Basingstoke Spare part warehousing Czech Republic Český Krumlov Components production USA Summerville IC trucks, E trucks, warehouse trucks China Xiamen IC trucks, E trucks, container and heavy IC trucks, warehouse trucks Jingjiang IC trucks, E trucks, warehouse trucks
STILL
Germany
Hamburg IC trucks, E trucks, warehouse trucks Reutlingen VNA warehouse trucks Geisa Components production Italy Lainate Spare part warehousing Luzzara Warehouse trucks Brazil Indaiatuba / São Paulo IC trucks, warehouse trucks
Other (Voltas MH)
India
Pune IC trucks, E trucks, warehouse trucks
1) Consultations ongoing concerning restructuring the container handler and heavy forklift truck business and Konecranes taking over certain assets of the container division (see ‘Events after the balance sheet date’, page 57)
Revenue from the high-margin service business stabilises consolidated revenue and reduces dependency on market cycles. KION's sales and service network encompasses more than 1,100 outlets in over 100 countries. Of the total sales and service workforce – which is predominantly made up of service technicians – about two thirds are employed in the KION companies. In various markets, KION relies on external dealers.

KION Holding 1 GmbH
Group management report 2012
Page 13 of 69
The service business caters to an active fleet of over 1 million industrial trucks. Europe has the greatest concentration of service outlets. In established markets, a significant proportion of services is covered by leasing arrangements and is offered for the entire term of the lease. Service business also includes individual orders for repairs and maintenance, spare parts, used trucks and rental trucks. Financial services (see page 19 and 20) support product sales in all brand companies. They largely consist of long and short-term rental, and customised fleet management. Market and influencing factors
Industrial trucks are used for a wide variety of applications. Material handling products are used for tasks such as loading and unloading, linking production steps, moving pallets in logistics centres and transferring containers in ports. They therefore form part of the production processes and supply chains in different industries around the world. Measured in terms of unit sales of new trucks, the growth of the industrial truck market has exceeded global economic growth over the past ten years (2002 to 2012), rising at an average of around 5 per cent per year. In KION's view, the significant influencing factors with a sustained impact are the following:
• Mature markets are generating strong demand for trucks to replace old ones as customers have not made replacement investments when required in recent years, as a result of the financial and economic crisis. KION estimates that around 90 per cent of sales in western Europe are currently accounted for by replacement investments.
• In China and other emerging markets, economic growth and the increasing need for
infrastructure solutions are creating disproportionately strong demand for inexpensive industrial trucks.
• As a result of globalisation, individual steps in the value chain are increasingly being moved to
different regions, causing greater demand for transport services and logistics solutions.
• As the technology in industrial trucks becomes more complex, their users are more likely to outsource service functions. The demand for efficient fleet management is also rising.
• The market as a whole will continue to depend heavily on economic conditions in key sales
markets, with the level of capital investment and the growth in global trade being particularly crucial. During an economic downturn customers tend to delay purchasing any new trucks they need, whereas they buy more new trucks during an upturn. The service business, which is generally less cyclical, is affected by truck utilisation, which itself depends partly on macroeconomic activity. In addition, the overall market is subject to regulatory intervention, in particular in relation to emission levels, production standards and workplace safety standards (see page 25).
Measured in terms of units ordered, almost half of the volume of new business (46 per cent) was accounted for by counterbalance trucks with an internal combustion engine – with higher proportions in China and other emerging markets. Counterbalance trucks with an electric drive accounted for around 16 per cent and warehouse technology for 38 per cent. The products in the premium price segment are characterised by an above-average useful life, driver productivity, comfort and high performance, combined with lower running and energy costs. This price segment accounted for 27 per cent of the new trucks ordered according to a study conducted in 2012, although the proportions were lower in China and other emerging markets. The middle price segment (value) generated 48 per cent of orders. The low price segment accounted for 25 per cent of the global market; it is the main segment in China.

KION Holding 1 GmbH
Group management report 2012
Page 14 of 69
Broken down by region, Europe generated 33 per cent of total new trucks sales, followed by China with 23 per cent and North America with 19 per cent. Market position
KION is one of the world's leading manufacturers of industrial trucks owing to its global presence and volume of revenue. Measured in terms of units sold, KION consolidated its position as the number one in Europe and the number two worldwide in the year under review. Based on the sales figures for 2012, KION's market share was 15 per cent worldwide and 34 per cent in Europe. KION is ranked third in the Chinese market behind two domestic manufacturers, making it the largest foreign producer. It is one of the leading manufacturers in Brazil – the largest individual market in South America – and is the market leader for electric forklift trucks and warehouse trucks. Besides its strong market position in established markets and growth regions, KION has a number of other competitive advantages: As a result of its multi-brand strategy and broad range of products and services, KION is represented in all the major sales regions, product segments and price segments that make up the industrial truck market. The multi-brand strategy has helped KION to systematically expand its presence in the emerging markets in recent years. KION's position as a leading technology provider secures the status of LMH and STILL as premium brands: customers can contain the total cost of ownership (TCO) owing to the trucks' cost efficiency, high productivity and relatively low maintenance and to the high residual values of used trucks. This technology leadership position is based, among other factors, on KION's pioneering role in hydrostatic and diesel-electric drive systems and on its product innovations in the field of energy-efficient and low-emission drive technologies (electric drives, hybrid drives, fuel cells). KION is also one of the leading companies with regard to workplace safety and ergonomics (see the section on research and development, pages 50 to 53). Compared with other companies in the industry, KION spends a high proportion of its revenue on research and development. By operating eleven local development centres, KION ensures that it can fully cater to the specific needs of customers in the different markets. There are two development centres in China, one in Brazil and one in India. KION has an integrated business model , which is based on its presence in all major product categories and the fact that the service business is intrinsically tied into the new truck business. The service business generates above-average margins for KION and is less affected by economic fluctuations. In addition, the growing number of new trucks fitted with customer-specific equipment is also stabilising the service business. The associated production, service and sales processes present a significant barrier to market entry for competitors, as does the extensive network of service outlets. KION's attractive profit margins are derived from the premium positioning of its brands and the significant proportion of revenue contributed by its high-margin service business. Economies of scale, diversification advantages and synergies resulting from its global position also benefit KION. Moreover, profitability has been improved by implementing effective measures to boost efficiency and lower costs, for example during the financial and economic crisis in 2008 and 2009. Consolidation of production facilities (see page 17) has also increased capacity utilisation. The lower level of fixed costs and the resulting more flexible cost structure have enabled KION to improve its profitability and put it in a better position to absorb the impact of economic downturns than in the past. Modular and platform strategies in product development and production also help to increase cost efficiency.

KION Holding 1 GmbH
Group management report 2012
Page 15 of 69
Strategy of the KION Group
KION's strategy, which is centred on value and growth, is based on the Group's aforementioned strengths. The strategic objectives are:
1. Strengthen KION’s leading position in western Eu ropean core markets
KION is consolidating its position as the number one in Europe's industrial truck market with customer-focused technological innovations and a high proportion of trucks with bespoke fittings. In recent years, the proportion of revenue spent on research and development has been above the market average and stood at 2.5 per cent in the year under review. KION aims to increase customer benefits in all price segments by introducing innovative drive systems, advanced ergonomics, intelligent intralogistics solutions and other developments.
2. Expand the range of services in European markets and in growth regions
KION is continually extending its portfolio of services and improving their quality at every stage of the product lifecycle. This includes servicing, maintenance and spare parts as well as fleet management solutions, intralogistics processes, efficient supply chains and IT systems. Financial services are also a key component of the service portfolio. KION has an installed base of more than 1 million trucks from which to expand its service business. The Company also intends to increase its market share by, for example, opening additional service outlets in attractive growth markets and stepping up the short-term rental business.
3. Tap the full market potential of growth regions
KION wants to take full advantage of buoyant demand in the BRIC countries (Brazil, Russia, India, China) and other emerging markets. That is why it is launching region-specific products in fast-growing price segments and strengthening its local production and sales network. To do so, KION is making targeted investments in production capacity, product development and the sales and service network. It is also weighing up whether to acquire manufacturing companies and dealers in growth regions. The strategic partnership entered into with Weichai Power in 2012 will play a key role in strengthening KION's position in the Chinese and other Asian growth markets, while KION gains access to the lower price segment in India through Voltas MH. The range of products and services is tailored to region-specific requirements. To this end, KION operates a multi-brand strategy in the different regions. Region-specific products based on low-cost production platforms are the preferred option in the fast-growing emerging markets of Asia, Central America and South America. For this reason, LMH and STILL are positioned accordingly in those markets, with the Baoli and Voltas MH brand companies also playing a key role. Other external opportunities for growth are examined on an ongoing basis, including in relation to the sales and service network. Fast-growing emerging markets accounted for 30 per cent of consolidated revenue in 2012, compared with 22 per cent in 2011.
4. Optimise production, leverage group-wide synergi es and thereby reduce costs
Over the past few years KION has streamlined its production capacity in developed markets, bringing about improvements to capacity utilisation and cost efficiency. At the same time it has created new capacity in Brazil, India and China. This transfer of some aspects of production to emerging markets is expected to continue. Another way in which KION improves efficiency and increases margins is by operating a cross-brand purchasing organisation. Over the next few years it plans to increase its purchasing volume from emerging markets from 28 per cent in 2012 to as much as 40 per cent.

KION Holding 1 GmbH
Group management report 2012
Page 16 of 69
Although the brand companies in the KION Group are largely responsible for their own market activities, KION harnesses group-wide synergies and ensures that resources are used efficiently by centralising certain functions. Central departments are responsible for quality and production control, logistics and IT. This makes it possible to establish best practice across the Group. There are also a number of research and development initiatives aimed at cutting costs, improving quality and speeding up the development process. For example, KION intends to increase the proportion of standard modules used by multiple brand companies without compromising the brands' independence. Key strategic measures in 2012
Tap full market potential in growth regions
The primary objective of the strategic partnership that KION entered into with Weichai Power at the end of 2012 is strategic collaboration on hydraulic pumps, engines, valves and drive technologies. Weichai Power and KION have also agreed to cooperate in a number of strategic areas, such as the supply of engines, parts and components. The aim for both companies here is to foster growth and competitiveness in the respective product segments. Under an agreement reached between the KION Group and Weichai Power, the partnership also extends to the sharing of best practice and the development by Weichai Power of engines for installation in certain industrial trucks. Additional possibilities are also being considered, such as consolidating the forklift truck business in China. An agreement for the joint use of sales and purchasing structures has already been reached. Weichai Power has more than 500 service outlets in China, which KION can use to extend its own sales and service network. Other advantages include the strengthening of the industrial base in Europe and access to Weichai Power's suppliers in China and Europe. The partnership generates substantial economies of scale for Linde Hydraulics and enables it to improve its international competitive position. On 27 December 2012 Linde Hydraulics entered into a ten-year purchase and supply agreement with LMH GmbH, which includes an exclusivity rule for the first five years. There is also a licence agreement that ensures Linde Material Handling GmbH (LMH GmbH) has access to all the patents necessary for its industrial truck business. Weichai Power paid a cash contribution (including premium) of €467 million into KION Holding 1 GmbH to take over a 25 per cent of the Company’s share capital as part of a capital increase. The price to acquire 70 per cent of the shares (including options) in Linde Hydraulics GmbH & Co. KG was €271 million. The partnership with Weichai Power improves KION’s market presence in China via KION Baoli (Jiangsu) Forklift Co., Ltd. (referred to below as 'KION Baoli') – the regional brand for industrial trucks – following LMH GmbH's acquisition of the outstanding 2.7 per cent of the shares. The transaction was completed at the end of August 2012. In addition, Baoli also has a presence in additional emerging markets, particularly in the Near and Middle East, India and Southeast Asia, but also in Australia. By collaborating with Weichai Power, Baoli will be able to expand its product range in the short term, and consequently be an even more attractive business partner for distributors. A second major milestone was reached in the Indian market. KION acquired the outstanding 34 per cent of shares in Voltas Material Handling Private Limited (referred to below as 'Voltas MH') with effect from 2 November 2012. Founded in 2011 as a means of strategic cooperation between KION and the Indian conglomerate Voltas Limited, Voltas MH develops, manufactures, sells and maintains forklift trucks and warehouse trucks, focusing on India's high-volume market. The acquisition of the outstanding shares in Voltas MH enables KION to tap into the potential of the Indian market more efficiently. Voltas MH's sales and service network encompasses 59 dealers. In the second quarter of 2012 Voltas MH opened a new production facility in Pune, where it builds smaller counterbalance trucks powered by an internal combustion engine or electric drive as well as warehouse trucks.

KION Holding 1 GmbH
Group management report 2012
Page 17 of 69
By setting up a new legal entity, KION South Asia Pte. Ltd., in Singapore in April 2012, KION put in place the necessary organisational structure to fully unlock the market potential in other countries of South and Southeast Asia. KION South Asia is enabling the steady expansion of the local sales and service networks of the Linde, STILL and Baoli brands. On 1 September 2012, KION South America launched production operations at its new plant in Indaiatuba/São Paulo, Brazil, thereby doubling its capacity. By pooling production in São Paulo and stepping up cross-brand cooperation, KION can leverage synergies and respond faster to customer requirements. KION's strategic competitive position has improved significantly because it can now manufacture counterbalance trucks (with an internal combustion engine) locally in addition to warehouse trucks. Imports of trucks, which are subject to high customs duties, can therefore be reduced significantly. The new facility also has better transport connections. The warehouse technology factory in Rio de Janeiro has closed, and the building and site have been sold. Some employees have transferred to the new plant. KION helped those unwilling to move to find new employment. Consolidation of market position in Europe and expansion of service network
The sales and service network was strengthened through acquisitions and partnerships in 2012. One of KION's sales channels in the large Russian market is the sales company Liftec, which has been part of LMH since November 2011. In the reporting year LMH also acquired Liftec's business in Kazakhstan (February 2012) and Ukraine (July 2012). This has given LMH direct access to these markets and will enable it to expand its sales and service structures in Eastern Europe and Central Asia. STILL continued to consistently expand its service and distribution organisations in growth regions, by opening new branches in Russia and Poland, and its own Asian representative office in Singapore. In February 2012 LMH acquired the outstanding 51 per cent of shares in the sales company Linde Creighton Ltd., West Bromwich, United Kingdom. This was another measure aimed at strengthening LMH's presence in the United Kingdom following the acquisition of the outstanding shares in Linde Castle Ltd. and Linde Sterling Ltd. in 2011. Between them, the three companies employ over 650 people. LMH has also restructured its sales operations in Croatia by entering into a joint venture with a local dealer. Increase in cost efficiency through optimisation of production and leverage of group-wide synergies
In 2012 KION continued to rigorously implement the extensive restructuring and consolidation programme that it had begun in 2009 in light of the financial and economic crisis. The long-term optimisation of production capacity has already begun to pay off and was a considerable factor in improving profitability in 2012. By making its cost structure more flexible, KION can take faster and more extensive action in an economic downturn. The relocation of individual warehouse technology production plants within Europe was completed in the year under review. Production operations in Montataire, France, were transferred to Luzzara in Italy, while forklift truck production in Bari, Italy, was moved to Hamburg, Germany. Furthermore, at the end of 2012 the decision was made to carry out the process of restructuring the container handler and heavy forklift truck business at the Merthyr Tydfil site (Wales, UK), which should improve the competitiveness of both segments in the long term, as well as increase the efficiency of KION’s European production network. Steps were also taken to increase efficiency in purchasing and product development. KION expects that the strategic partnership with Weichai Power will also help to boost cost efficiency, notably through the joint use of sales structures and improved access to low-cost sources of supply for components. In addition, KION has initiated measures to improve cost efficiency in research and development by using module and platform strategies (see page 50). The aim here is to reduce the complexity and diversity of products and accelerate the development process.

KION Holding 1 GmbH
Group management report 2012
Page 18 of 69
The segments and their products and services
Table 2: Segment overview
Linde Material Handling (LMH) segment The LMH segment encompasses the products and services of the Linde, Fenwick and Baoli brands. Linde is a global premium brand and a technology leader. Its USP is its hydrostatic drive technology, which gives it a significant competitive edge worldwide and enables it to meet customer’s high standards of technology, efficiency, functionality and design. The product portfolio ranges from warehouse trucks to heavy trucks and container handlers and caters to all of the major application areas. Linde has been developing and manufacturing electric drive systems for decades and makes the resulting expertise available to external customers for use in a variety of applications. In France, Linde products are sold under the Fenwick brand. The Baoli brand covers the lower price segment in China and other growth markets in Asia, eastern Europe, the Middle East and Africa as well as Central and South America. LMH's strategic investment in Linde Hydraulics means it continues to hold a stake in one of the major producers of hydraulic components. An exclusive contract ensures the supply of these components over the long term, which provide the basis for the Linde trucks' precise lifting and handling capabilities as well as their low fuel consumption. LMH will continue to exploit the synergies between the technologies of the trucks and drive systems despite selling its majority stake in the hydraulics business. In terms of unit sales of industrial trucks, Linde is the second largest brand worldwide and the market leader in Europe, while Fenwick occupies the number-one spot in France. Around the globe, LMH can rely on a network of around 700 sales outlets (including Fenwick). Its sales are split roughly equally between its own sales companies and external dealers. Baoli has about 150 sales outlets.
Segments 2012
Revenue Year-on-year change
Adjusted EBIT¹
Year-on-year change
EBIT Year-on-year change
Em-ployees²
Year-on-year change
in € million
LMH 3,132 9.8% 330 18.3% 523 >100% 13,148 -4.6%
STILL 1,677 0.6% 123 22.4% 98 >100% 7,253 -0.5%
Financial Services 509 6.2% 1 -48.1% 1 -48.1% 112 16.7%
Other 251 12.4% 44 -34.6% -12 <-100% 702 2.0%
Consolidation/reconciliation -842 0.0% -61 0.0% -61 0.0% − -
Total 4,727 8.2% 438 20.2% 550 >100% 21,215 -3.0%
¹ Adjusted for KION acquisition items and one-off items
² Number of employees in full-time equivalents as at 31 December

KION Holding 1 GmbH
Group management report 2012
Page 19 of 69
STILL segment
The STILL and OM-STILL brands are grouped in the STILL segment. STILL is a global premium provider of trucks with diesel-electric drives. It focuses, above all, on the European and Latin American markets. In Brazil, STILL is ranked second in terms of product sales. OM-STILL is the market leader in Italy. By opening its own representative office in Singapore, an essential prerequisite to creating further growth in Southeast Asia has also been established. The segment's portfolio consists of forklift trucks and warehouse trucks plus associated services. STILL is a market leader throughout Europe in electric forklift trucks and has also established innovative drive technologies on the market such as hybrid drive in particular. STILL has also positioned itself as a leading provider of intelligent intralogistics solutions. In this manner, STILL realizes the intelligent interplay of forklift trucks, warehousing technology and towing tractors, as well as process-oriented, value-added services concerning internal operations logistics processes, shelving systems and fleet management and services. The STILL segment operates around 240 sales outlets in its markets, most of which it owns itself.
Financial Services (FS) segment
In view of the increased importance of financial services, KION laid the foundations for combining its activities in the FS segment in 2011 and completed the new segmentation in the year under review. Legally independent FS companies were set up in the main sales markets with a high volume of financing and leasing (France, Germany, Italy, Spain and the United Kingdom) so that financing and leasing business can be managed separately. The purpose of the FS segment is to act as an internal funding partner for the LMH and STILL brand segments, providing finance solutions that promote sales. FS activities include the internal financing of the short-term rental fleet on the one hand, and the financing of long-term leasing business for KION Group customers on the other hand, as well as the accompanying risk management. The key performance indicator for the FS segment is earnings before taxes (EBT). When long-term leasing business is being conducted, FS itself acts as the contractual partner to customers and offers financing. Various financing models are available and give customers the greatest possible flexibility. In long-term business, FS is also responsible for risk management, which includes credit risk management as well as management of residual-value risk. Leases have an average term of four to five years. In short-term leasing, FS is the internal financing partner of the brand segments: customers are offered rental trucks from a brand segment rental pool for short-term use. Financial performance largely depends on the rental fleet's capacity utilisation, which is controlled by the brand segments. Operational responsibility for the short-term rental business lies with the brand segments. FS acts as the contractual partner to the brand segments, providing the financing primarily in conjunction with external financial partners. The brand segments pay FS for its work in the form of an interest margin at a rate appropriate to the market. FS works on refinancing with over 40 financing partners worldwide. Leasing is largely refinanced via sale and leaseback agreements, whilst the refinancing of single-step leases via financial liabilities still plays a subordinate role.

KION Holding 1 GmbH
Group management report 2012
Page 20 of 69
Chart 5: Business model of Financial Services
In addition to KION’s direct leasing to end clients via FS, lease financing is also procured through independent leasing providers. In such cases, the lessor is not KION, but rather an external leasing company. Other segment The Other segment primarily comprises KION GROUP GmbH with its holding activities, the KION Group's service companies, which provide cross-segment services. These include, in particular, IT services from KION Information Management Services GmbH and logistics services. The subsidiaries of the Voltas MH brand company, which manufacture and sell counterbalance trucks and warehouse technology for the Indian market, also belong to this segment.
Value-based management
The KION Group's strategy, which centres on value and growth, is reflected in how the Company is managed. KION uses six key performance indicators (KPIs) to continuously monitor the market success, profitability, financial strength and liquidity of both the Group and the individual segments. The performance targets of the Group and the segments are based on selected financial KPIs, as is the performance-based remuneration paid to managers (see note 43 on page 84). Each month, the KPIs are measured and made available to the Executive Board as part of a comprehensive report. This enables the management team to take prompt corrective action in the event of discrepancies.
Financing of long-term leasing Financing
(external) (single steps)
Financing of short-term rental fleet Financing
(internal) (SALB leases)
End customerlong-term
leasing
LMH / STILL short-term
rental
Financial Services
Financial debt
Leasing partner

KION Holding 1 GmbH
Group management report 2012
Page 21 of 69
Table 3
KPIs related to business volume
Order intake and revenue are broken down by region, segment and product group in the KION Group's management reporting so that growth drivers and pertinent revenue trends can be identified and analysed in a timely fashion. Order intake is a leading indicator for revenue. The length of time between receipt and invoicing of an order varies between business units and product groups. KPIs related to earnings
Adjusted EBIT: The key figure used for the operational management and analysis of financial performance is adjusted earnings before interest and taxes (EBIT). It is calculated in the same way as EBIT, except that it does not take account of the KION purchase price allocation (see note 18, page 34) or any non-recurring items. Adjusted EBIT corresponds to the KPI used in internal management reporting called EBIT. Another important indicator used to measure the KION Group's operational efficiency is the adjusted EBIT margin , which is the ratio of adjusted EBIT to revenue. Adjusted EBITDA: Unlike EBIT, the EBITDA figure is shown before deduction of depreciation, amortisation, impairments and reversals to non-current assets. Adjusted EBITDA also excludes effects from the KION purchase price allocation (see note 18, page 33) and non-recurring items. Adjusted EBITDA constitutes an approximation of the cash flow KPI and provides information on the Company's long-term financial performance. KPIs related to liquidity
Net financial debt: Net financial debt is defined as the difference between the financial liabilities and cash and cash equivalents shown on the balance sheet. It serves as a measure of performance and is only used at Group level. Free cash flow: Free cash flow is another relevant KPI for managing leverage and liquidity. It is determined solely by the KION Group's operating and investing activities. Free cash flow does not include interest arising from financing activities. The performance measurement of free cash flow is supported by the carefully targeted management of working capital and by detailed planning of capital expenditure. KION also analyses non-financial key performance indicators . These essentially relate to customers, employees, sustainability and technology. Some of them are used operationally as leading indicators for the financial KPIs. The non-financial KPIs are described in detail on pages 46 to 56.
Key performance indicators
Order intake Revenue Adjusted EBIT¹
Adjusted EBITDA¹
Net financial debt
Free cashflow
in € million
2012 4,700 4,727 438 747 1,790 5182011 4,682 4,368 365 665 2,631 2342010 3,860 3,534 139 462 2,626 76
¹ Adjusted for KION acquisition items and one-off items

KION Holding 1 GmbH
Group management report 2012
Page 22 of 69
ECONOMIC ENVIRONMENT
Macroeconomic conditions
Global economic growth slowed down in 2012. One of the reasons for this was that the euro zone – still going through a sovereign debt crisis – slid into recession, taking major trading partners with it. The markets were also weighed down by uncertainty regarding fiscal problems in the United States and China's economic prospects. According to a projection by the International Monetary Fund (IMF), global economic output only increased by 3.2 per cent, compared to 3.9 per cent in 2011, whilst advanced industrial nations achieved growth of just 1.3 per cent (2011: 1.6 per cent).
The pace of growth also tailed off in the emerging markets. All four BRIC countries registered lower rates of growth than in 2011 owing to declining demand from Europe and, in particular, dwindling domestic demand and economic policy aimed at stemming inflation in Asia and Latin America.
Chart 6: Economic growth in relevant markets
Demand for machinery and equipment weakened globally, but especially in the euro zone. A declining willingness to invest was accompanied by a slowdown in the growth of global trade, which more than halved according to the IMF’s projection. This brought it down to just 2.8 per cent in 2012 (2011: 5.8 per cent). Imports and exports decreased in equal measure. Unlike in the previous year, demand for industrial trucks therefore received little stimulus from the markets in 2012.
Sectoral conditions
Sales markets
The slowdown of the global economy also filtered through to the market for industrial trucks. Whereas unit sales of new trucks during the early months of 2012 were still influenced by the high level of order intake in the previous year, the subsequent months saw a fall in demand.
China 7.8%
India 5.4%
Russia 3.4%
World 2.3%
USA 2.2%
Japan 2.0%
Brazil 1.0%
Germany 0.8%
EU -0.3%
Source: Oxford Economics (Status 12 February 2013)
Gross domestic product 2012Real change compared with the previous year

KION Holding 1 GmbH
Group management report 2012
Page 23 of 69
The number of trucks ordered globally decreased by 3.1 per cent. In western Europe – KION's largest market by far – the number of orders decreased by 7.1 per cent. Germany, which remains KION's largest individual market, proved somewhat more stable than Europe as a whole and contracted by 5.5 per cent. The United Kingdom bucked the trend with a rise of 4.4 per cent in orders for new trucks, whereas France and Italy both registered sharp falls of 8.0 per cent and 21.5 per cent, respectively.
Order intake in eastern Europe was stable thanks to growth in the Russian market. Decreasing unit sales in Asia were primarily the result of a decline in the Chinese market. A sharp contraction of business in Brazil had a significant adverse impact on unit sales in Central and South America.
There was only a slight shift in the market shares of the individual regions compared with 2011. Western Europe remained in first place with a share of 27 per cent of total unit sales, with as much as 45 per cent of global orders for warehouse trucks coming from western Europe. China accounted for 23 per cent of orders for new trucks in 2012 and was also the largest market for counterbalance trucks with a global market share of 33 per cent.
Order intake broken down by product group shows that the market for warehouse trucks was much more stable than the market as a whole, with orders decreasing by just 1.9 per cent. Within this group, there was a sharp rise in order intake for rider trucks. The decrease of 3.8 per cent in the number of orders for counterbalance trucks was predominantly attributable to declining figures for combustion engine industrial trucks.
Table 4
Global Industrial Truck Market (order intake)
in thousand units 2012 2011 Changes
Western Europe 259 278 -7.1% thereof Germany 72 76 -5.5% France 51 56 -8.0% United Kingdom 28 27 4.4%Eastern Europe 54 54 -1.3% thereof Russia 24 23 4.7%Europe 312 333 -6.1%
North America 181 170 6.8% thereof U.S.A. 165 155 6.7%Central & South America 49 55 -12.0% thereof Brazil 19 23 -16.7%China 217 238 -9.0%Rest of World 187 181 3.6%
World 947 977 -3.1%
Source: WITS/FEM
KION Holding 1 GmbH
Group management report 2012
Page 24 of 69
Procurement markets
Commodity prices have a direct impact on around 26 per cent of the cost of materials for manufacturing an industrial truck at KION. Owing to the gloomier economic data, the price of steel plate was 9.6 per cent lower on average than it had been in 2012, while the price of steel bars was down by 12.8 per cent. The price of steel scrap, an important commodity used in counterweights, fell by an average of 4.7 per cent. Copper prices decreased by 2.4 per cent year on year. Like rubber (fall of 23.4 per cent) and plastic, copper has a lesser impact on manufacturing costs. The price of lead-acid batteries, which make up a significant proportion of the total price of electric trucks, is particularly dependent on lead prices on the metal exchanges. However, these price fluctuations are borne by customers owing to the way in which contracts are formulated.
Energy prices were higher in 2012 than they had been the previous year. Natural gas prices rose in Europe and Asia. Although KION's production facilities predominantly use electricity and gas, the oil price is used as an indicator because it affects other energy sources as well as the price of plastic. The price of Brent crude oil (listed in US dollars) was 8.6 per cent higher on average than in 2011.
Financial markets
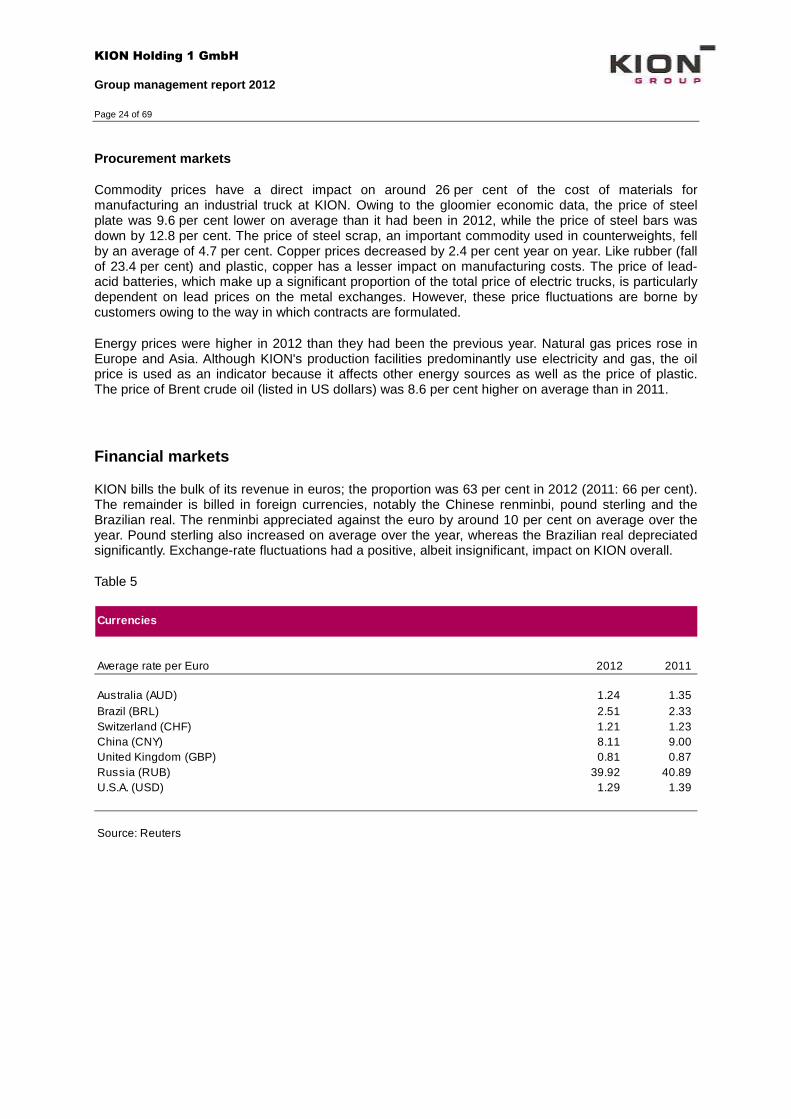
KION bills the bulk of its revenue in euros; the proportion was 63 per cent in 2012 (2011: 66 per cent). The remainder is billed in foreign currencies, notably the Chinese renminbi, pound sterling and the Brazilian real. The renminbi appreciated against the euro by around 10 per cent on average over the year. Pound sterling also increased on average over the year, whereas the Brazilian real depreciated significantly. Exchange-rate fluctuations had a positive, albeit insignificant, impact on KION overall.
Table 5
Currencies
Average rate per Euro 2012 2011
Australia (AUD) 1.24 1.35Brazil (BRL) 2.51 2.33Switzerland (CHF) 1.21 1.23China (CNY) 8.11 9.00United Kingdom (GBP) 0.81 0.87Russia (RUB) 39.92 40.89U.S.A. (USD) 1.29 1.39
Source: Reuters

KION Holding 1 GmbH
Group management report 2012
Page 25 of 69
Regulatory situation
The companies in the KION Group have to comply with specific legal requirements in their markets with respect to their products and services. These requirements serve to minimise or eliminate the risks for users of the products and for other people, equipment and the immediate working environment. Moreover, they can also help to maintain the performance of the machines. The compliance of products and services with the different requirements has to be verified or certified.
KION has established processes aimed at implementing the legal requirements efficiently, documenting its compliance with them and incorporating any changes in the legal framework at an early stage of development. Many of the legal requirements are enshrined in product-specific and other standards (e.g. EN, ISO and DIN). KION endeavours to comfortably comply with the minimum standards defined for its products and services and, in some cases, surpass them.
KION responds to updates to the standards promptly. For example, as a result of the tighter emissions standards for forklift trucks fitted with an internal combustion engine, KION revised a number of product series last year so that they now comfortably meet the new requirements and their emissions are well below the maximum levels permitted (see page 51). This allows KION to differentiate itself from the competition and position itself as a technology leader. In addition, the KION Group is an active member of associations such as the German Engineering Federation (VDMA) and its working groups in which it helps to continually enhance standards and regulations.
The construction and operation of production facilities are also subject to certain legal requirements, including in relation to avoidance of air pollution, noise reduction, waste production & disposal and health & safety. The KION Group has also established stable processes in this regard to ensure that it complies with the regulatory requirements. KION also fulfils all of the legal requirements pertaining to exports and financing business.

KION Holding 1 GmbH
Group management report 2012
Page 26 of 69
FINANCIAL POSITION AND FINANCIAL PERFORMANCE
Overall assessment of the economic situation
The KION Group can look back on a successful financial year 2012. Despite the slight market downturn, the Group increased its market share in all of its major sales regions and expanded its service business. KION therefore proved that its business model is stable, even in a difficult economic climate. The targeted increase in revenue was exceeded, with revenue rising by 8.2 per cent on the back of higher volumes and price increases. About half of the growth in revenue was generated by the emerging markets, which are KION's strategic focus region – although the volume of business generated by the mature markets also surpassed the prior-year figure. In western Europe, KION consolidated its premium position and gained market share owing to the close cooperation between its new truck business and service business.
The target of achieving a year-on-year increase for the adjusted EBIT margin was also achieved. The increase from 8.3 per cent in 2011 to 9.3 per cent in 2012 can be attributed, above all, to the extensive restructuring and consolidation programme, which was largely completed in the year under review. As planned, capacity utilisation in the plants was higher than in 2011. The more flexible cost structure now in place gives KION a significant competitive edge.
The net income generated of €161 million was very encouraging and exceeded the anticipated figure. It was partly boosted by a net gain from the transactions conducted with Weichai Power, but also by an improvement in the financial result resulting from the success of the steps taken to reduce debt levels.
KION invested in its continued growth in the reporting year. Spending on research and development equated to 2.5 per cent of revenue, which was once again higher than the industry average. Moreover, KION expanded its production capacity in China and Brazil in line with its strategic objective of increasing the volume of production in emerging markets.
The considerable improvement to the financial position resulting from a capital increase, the conversion of a shareholder loan into equity and the extension of the terms of the loans all give KION greater flexibility with which to generate profitable growth in future. Besides optimising its funding structure, the Group also improved its liquidity position. Another contributing factor was the increase in free cash flow on the back of the sale of significant portions of the hydraulics business, strong earnings performance, and efficient management of working capital.
Business situation and financial performance of the KION Group
Key influencing factors
Faltering growth in the economy and global trade impacted on the market for industrial trucks in KION's major sales regions. Against a backdrop of economic uncertainty, customers acted increasingly cautiously and, overall, placed fewer orders for new trucks than in 2011. The decline in volume was offset by price increases that resulted, among other reasons, from the higher proportion of trucks with customer-specific fittings. Postponement of necessary replacement investments in previous years, combined with the high degree of capacity utilisation by customers, also led to greater demand for maintenance services.
Exchange-rate differences – in particular the appreciation of the renminbi and pound sterling against the euro – only had a minor impact on KION's financial performance. Commodity prices, which declined on average over the year, had a slightly positive effect on the cost of sales.
KION Holding 1 GmbH
Group management report 2012
Page 27 of 69
Order intake
Despite the more subdued market conditions, the KION Group continued along its growth trajectory in 2012 and consolidated its market position as the second largest provider worldwide and as number one in the European market.
Bucking the negative market trend, the number of new industrial trucks ordered remained relatively stable. In western Europe, LMH and STILL benefited from their premium position and strong sales network. The KION companies in Italy and France both performed better than the declining market, while in the UK, KION even surpassed market growth. In Germany, KION's unit sales declined largely in line with the market trend.
KION outperformed the largely flat market in eastern Europe and registered a year-on-year increase in unit sales in the emerging Russian market. Unit sales rose in the Asia-Pacific region too, with KION gaining market share in China, Vietnam, Thailand and Australia. In Central and South America, KION significantly expanded its market share. Moreover, it was able to maintain the number of new trucks ordered at a high level in its largest individual market, Brazil, despite the decline in demand there.
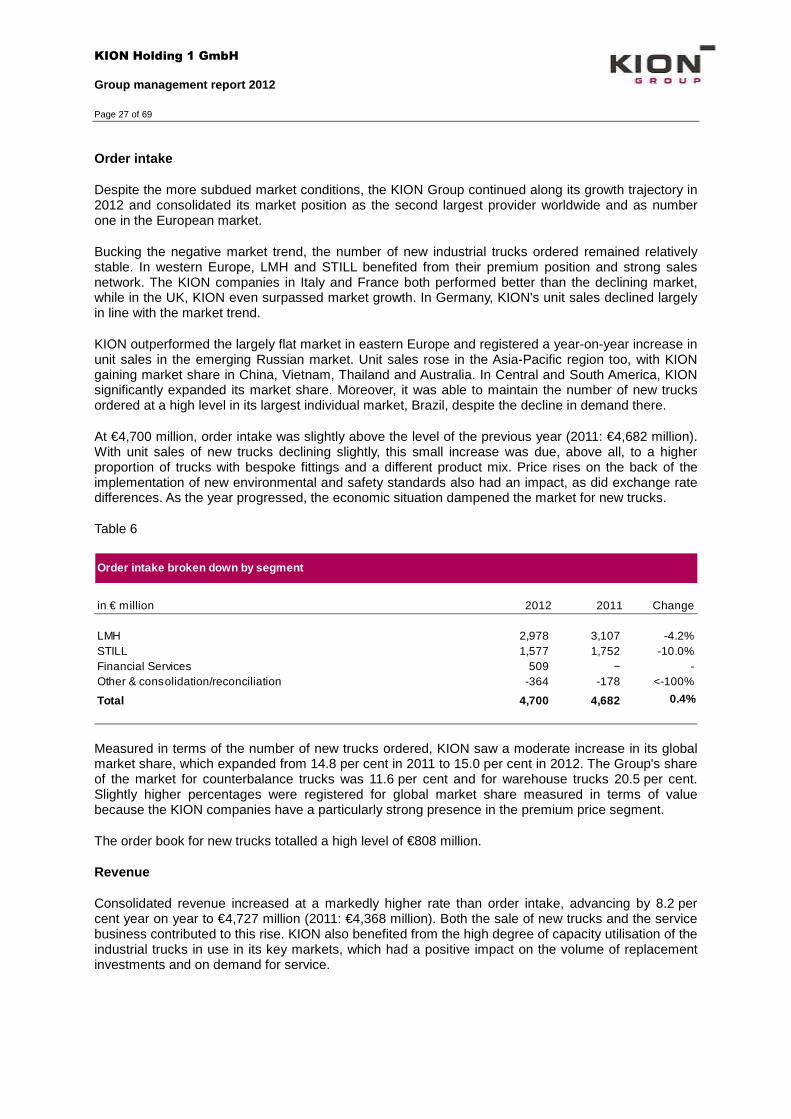
At €4,700 million, order intake was slightly above the level of the previous year (2011: €4,682 million). With unit sales of new trucks declining slightly, this small increase was due, above all, to a higher proportion of trucks with bespoke fittings and a different product mix. Price rises on the back of the implementation of new environmental and safety standards also had an impact, as did exchange rate differences. As the year progressed, the economic situation dampened the market for new trucks.
Table 6
Measured in terms of the number of new trucks ordered, KION saw a moderate increase in its global market share, which expanded from 14.8 per cent in 2011 to 15.0 per cent in 2012. The Group's share of the market for counterbalance trucks was 11.6 per cent and for warehouse trucks 20.5 per cent. Slightly higher percentages were registered for global market share measured in terms of value because the KION companies have a particularly strong presence in the premium price segment.
The order book for new trucks totalled a high level of €808 million.
Revenue
Consolidated revenue increased at a markedly higher rate than order intake, advancing by 8.2 per cent year on year to €4,727 million (2011: €4,368 million). Both the sale of new trucks and the service business contributed to this rise. KION also benefited from the high degree of capacity utilisation of the industrial trucks in use in its key markets, which had a positive impact on the volume of replacement investments and on demand for service.
Order intake broken down by segment
in € million 2012 2011 Change
LMH 2,978 3,107 -4.2%STILL 1,577 1,752 -10.0%Financial Services 509 − -Other & consolidation/reconciliation -364 -178 <-100%
Total 4,700 4,682 0.4%

KION Holding 1 GmbH
Group management report 2012
Page 28 of 69
Table 7
Revenue by product category
Revenue from new trucks went up by 12.1 per cent to €2,651 million (2011: €2,364 million), one of the main reasons being the strong order book from 2011. Targets were exceeded both in the LMH segment and the STILL segment. A significant factor here was the substantial demand for electric forklift trucks and warehouse trucks, which was fulfilled by increasing the utilisation of production capacities.
Table 8
Service business contributed €1,907 million (2011: €1,831 million) to consolidated revenue and thereby accounted for 40.4 per cent of revenue (2011: 41.9 per cent). The growing number of truck fleets covered by service agreements and the high level of truck utilisation pushed up demand for maintenance services. Muted demand from southern Europe decreased revenue to a moderate degree. Both short-term and long-term truck rentals declined slightly compared with the previous year. Revenue from the sale of used trucks was also slightly lower than it had been in 2011. Among other reasons, this was because demand from southern and eastern Europe was lower than anticipated.
KION sold the majority of its hydraulics business on 27 December 2012. The amount of revenue contributed by the hydraulics business amounted to €168 million in 2012 – a marginal change compared to the previous year (2011: €173 million).
Revenue broken down by segment
in € million 2012 2011 Change
LMH 3,132 2,854 9.8%STILL 1,677 1,667 0.6%Financial Services 509 480 6.2%Other 251 223 12.4%Consolidation/reconciliation -842 -855 1.5%
Total revenue 4,727 4,368 8.2%
Revenue by product category
in € million 2012 2011 Change
New business 2,651 2,364 12.1%Hydraulics 168 173 -2.8%Service offering 1,907 1,831 4.1% - After sales 1,150 1,066 7.9% - Rental business 428 441 -3.1% - Used trucks 213 219 -2.7% - Other 117 106 10.8%
Total revenue 4,727 4,368 8.2%

KION Holding 1 GmbH
Group management report 2012
Page 29 of 69
Revenue by region
KION's revenue went up in all of its sales regions, with revenue growth exceeding market growth in many countries. Around half of the €358 million increase in revenue was attributable to emerging markets in Asia, South America and eastern Europe.
Germany and its neighbouring western European countries also accounted for a considerable proportion (44 per cent) of the absolute rise in consolidated revenue. Here the KION companies benefited from a higher proportion of trucks with customer-specific fittings and the intrinsic link between new truck business and service business. Expansion of the sales network, which continued in countries such as the United Kingdom in 2012, also helped to improve KION's market position.
The above-average rise in revenue from eastern Europe was largely due to the revenue increases in Russia resulting, among other reasons, from an intensification of sales and service activities. Revenue also went up in Poland and the Czech Republic.
Table 9
As in 2011, KION maintained a high level of growth in Asia. The strategy pursued in this region is to offer specific products that are based on tried-and-tested platforms but tailored to local requirements. This was a significant factor in the 11.7 per cent rise in revenue compared with the previous year. For the first time, the Asia-Pacific markets generated more than 10 per cent of consolidated revenue, above all as a result of strong growth in China, to which the local Baoli brand made a significant contribution.
In the Americas, KION achieved moderate revenue growth despite the challenging economic situation in South America, primarily due to the volume of new orders in the Brazilian market. It should also be noted that the full effects of the considerable expansion of production capacity during the year have not yet been felt.
Overall, the volume of foreign revenue increased disproportionately by 9.6 per cent to €3,501 million (2011: €3,194 million), causing the share in Group sales to climb from 73.1 per cent to 74.1 per cent. The fast-growing emerging markets contributed 30 per cent of consolidated revenue, compared with 22 per cent in 2011.
Revenue by customer location
in € million 2012 2011 Change
Germany 1,225 1,175 4.3%EU excl. Germany 2,253 2,115 6.6%Rest of Europe 248 204 21.7%America 324 281 15.5%Asia 486 435 11.7%Rest of world 191 160 19.2%
Total revenue 4,727 4,368 8.2%

KION Holding 1 GmbH
Group management report 2012
Page 30 of 69
Earnings
Table 10
EBIT and EBITDA
Earnings before interest and tax (EBIT) more than doubled year on year to €550 million (2011: €213 million). The reasons for this rise of €337 million include one-off items, sustained growth of unit sales in established regional markets, and stable demand from China and eastern Europe. Another factor in the increase in EBIT was improved capacity utilisation in the new truck business.
The non-recurring items included in EBIT totalled €153 million (2011: €-115 million). The capital increase and the sale of significant portions of the hydraulics business resulted in a net gain before taxes of €212 million after deduction of consultancy costs and contractual obligations. In addition to the net gain of €103 million from the sale of the hydraulics business, this includes a gain of €109 million from the remeasurement of the remaining 30 per cent of shares held at fair value. There was also a one-off gain of €13 million resulting from remeasurement of the shareholding in Linde Creighton. Non-recurring losses were largely the result of follow-up costs in connection with the closure of production facilities and the restructuring of the container handler and heavy forklift truck business, including necessary impairment of assets. These, combined with consultancy costs, amounted to losses of €71 million.
The effects of the purchase price allocation in connection with the KION acquisition equated to a loss of €41 million in 2012, compared to the loss reported in 2011 of €36 million. They essentially consist of depreciation and impairment, as well as administrative expenses for KION Holding 1 GmbH.
Adjusted EBIT, which excludes non-recurring items and KION acquisition items, advanced by €74 million to €438 million (2011: €365 million). This equates to an adjusted EBIT margin of 9.3 per cent (2011: 8.3 per cent).
Condensed income statement of the KION Group
in € million 2012 2011 Change
Revenue 4,727 4,368 8.2%Cost of sales -3,430 -3,256 -5.3%
Gross profit 1,297 1,112 16.6%Selling expenses -562 -521 -8.0%Research and development costs -124 -120 -4.1%Administrative expenses -313 -283 -10.5%Other 253 25 >100%
Earnings before interest and taxes (EBIT) 550 213 >100%Financial result -239 -272 12.0%
Earnings before taxes 311 -59 >100%Income taxes -150 -34 <-100%
Net income (loss) 161 -93 >100%

KION Holding 1 GmbH
Group management report 2012
Page 31 of 69
Table 11
EBITDA grew from €569 million in 2011 to €915 million in 2012, while adjusted EBITDA rose by €82 million year on year to €747 million. Accordingly, the adjusted EBITDA margin improved from 15.2 per cent to 15.8 per cent.
Financial result
The financial result – financial income offset against financial expense – improved from €-272 million in 2011 to €-239 million in 2012. Interest expenses arising from loan liabilities fell significantly owing to a change in interest rates. By contrast, interest expenses arising from capital market liabilities were higher than in 2011 because the bond had only existed for eight months of that year. The balance of finance costs arising from translation differences increased €33 million year on year. The reasons for this include other income from the translation of loans denominated in US dollars, which were contrasted by an expense in the previous year.
Table 12
Income taxes
Income taxes amounted to an expense of €150 million (2011: €34 million). Within this amount, current income tax expenses increased by €73 million to €122 million, largely owing to the improvement in operating performance and the net tax effects of €62 million resulting from the sale of the hydraulics business. As in the previous year, additional deferred tax assets were not recognised because it is unlikely that the corresponding benefit can be utilised.
Adjusted EBIT
in € million 2012 2011 Change
Earnings before interest and tax (EBIT) 550 213 >100% One-off items -153 115 <-100% KION acquisition items 41 36 15.3%
Adjusted EBIT¹ 438 365 20.2%
¹ Adjusted for KION acquisition items and one-off items
Financial result
in € million 2012 2011 Change
Financial income 62 74 -15.7%Financial expense -302 -346 12.8%
Financial result -239 -272 12.0%

KION Holding 1 GmbH
Group management report 2012
Page 32 of 69
Net income (loss)
Following the net loss of €93 million reported for 2011, KION generated net income of €161 million in the year under review. This difference of €254 million largely resulted from an increase in adjusted EBIT and a net gain from the sale of the hydraulics business. These positive effects were partly offset by the rise in income taxes.
Key influencing factors for earnings
The disproportionately low rise in the cost of sales, which went up by 5.3 per cent to €3,430 million (2011: €3,256 million), was the result of more efficient production operations, greater capacity utilisation and an overall fall in commodity prices. Compared with revenue, selling expenses remained virtually unchanged. Research and development costs advanced by 4.1 per cent to €124 million (2011: €120 million) on the back of larger-scale projects that made it necessary to increase headcount, in particular in preliminary development and series development.
Higher consultancy costs for strategic projects primarily contributed to the 10.5 per cent increase in administrative expenses, which totalled €313 million.
Table 13
The balance of other expenses and income (see notes 10 and 11, pages 23 and 24) was €235 million (2011: €11 million). Other income of €294 million (2011: €82 million) was mainly attributable to one-off income generated from the sale of the hydraulics business. The decline in other expenses to €60 million (2011: €70 million) primarily resulted from the decrease in impairment losses on non-current assets and the decrease in book losses from the sale of non-current assets. Table 14
Other income and expenses
in € million 2012 2011 Change
Other income 294 82 >100%Other expenses -60 -70 15.0%
Other income and expenses 235 11 >100%
EBIT by segment adjusted¹
in € million 2012 2011 Change
LMH 330 279 18.3%STILL 123 100 22.5%Financial Services 1 3 -48.1%Other & consolidation/reconciliation -16 -18 8.1%
Total 438 365 20.2%
¹ Adjusted for KION acquisition items and one-off items

KION Holding 1 GmbH
Group management report 2012
Page 33 of 69
Table 15
Business situation and financial performance of the LMH segment
Revenue
The LMH segment's revenue went up by 9.8 per cent to €3,132 million in 2012 (2011: €2,854 million). This equates to 66.3 per cent of consolidated revenue (2011: 65.3 per cent).
The new truck business grew at a particularly strong rate, rising by 16.0 per cent year on year and thereby exceeding the budgeted figure. All product groups contributed to this increase, with electric forklift trucks proving to be the main growth driver. The number of trucks ordered of this type rose by 2.3 per cent, thereby bucking the global market trend. Strong growth in Asia and the Americas resulted in a rise of 3.4 per cent for diesel trucks despite the market's overall weakness, while warehouse technology also outperformed the market with a decline of just 0.5 per cent.
Service revenue rose on the back of maintenance carried out in response to individual orders as well as under service agreements. LMH's rental business performed better than in 2011 owing to growth in short-term rentals. Sales of used trucks generated less revenue than in the previous year, although the prior-year figure had been boosted by a significant one-off transaction.
LMH saw particularly strong revenue growth in Germany and the United Kingdom. Revenue was also up in Russia and other eastern European countries thanks to more intensive marketing activities. In China, the Linde and Baoli brands bucked the negative market trend and increased their revenue. In fact, revenue in Asia as a whole increased from what had already been a high level the previous year.
Earnings
EBIT more than doubled, from €258 million in 2011 to €523 million in 2012. The crucial factor here was a one-off gain – the sale of the majority stake of the hydraulics business – which totalled €247 million in the LMH segment. EBIT also included an additional one-off gain amounting to €13 million, resulting from the remeasurement made in connection with the acquisition of the remaining 51 per cent of the shares in Linde Creighton. A gain of €3 million generated by the sale of the plot of land in Basingstoke, United Kingdom, was largely offset by follow-up costs caused by the closure of the plant there. Total one-off and non-recurring items amounted to a gain of €226 million. One-off items had amounted to an expense of €5 million in 2011. The KION acquisition items attributable to the LMH segment amounted to an expense of €33 million in 2012, compared with an expense of €26 million in 2011. Adjusted EBIT increased by €51 million to €330 million (2011: €279 million). Apart from the growth in earnings, the reason for this rise was the programme of measures designed to cut costs and boost efficiency. As a result, the adjusted EBIT margin improved from 9.8 per cent in 2011 to 10.5 per cent in 2012. Adjusted EBITDA in the LMH segment came to €478 million (2011: €423 million), corresponding to an adjusted EBITDA margin of 15.3 per cent (2011: 14.8 per cent).
EBIT by segment
in € million 2012 2011 Change
LMH 523 258 >100%STILL 98 -5 >100%Financial Services 1 3 -48.1%Other & consolidation/reconciliation -73 -42 -72.6%
Total 550 213 >100%

KION Holding 1 GmbH
Group management report 2012
Page 34 of 69
Business situation and financial performance of the STILL segment
Revenue
The STILL segment's revenue increased slightly by 0.6 per cent to €1,677 million (2011: €1,667 million). The reduction in revenue in western Europe was offset by substantial growth in central and eastern Europe and Asia, where significant new orders were secured. STILL’s market presence in eastern Europe has been strengthened even further by integrating of the STILL and OM dealers in Russia. In Yekaterinburg in the Ural region, STILL has already founded its third branch in Russia after Moscow and Saint Petersburg. In Poland, STILL’s service and distribution structure has been expanded via a new branch in Gdansk.
Also going significantly against the market trend, STILL generated revenue growth in South America, where the core market is Brazil. STILL took a further step towards becoming market leader there by relocating and expanding production (see page 17) and launching the production of diesel trucks. Revenue rose slightly in Asia, where STILL expanded its footprint by opening a new office in Singapore. In Italy, integration of OM into the STILL Group was completed, helping to consolidate STILL's market leadership.
Overall, revenue from new trucks was moderately lower than in 2011 despite the increase in revenue from diesel trucks. The relocation of production led to a decrease in the numbers of units manufactured during the transition period. This one-off effect was in line with expectations.
The small decrease in the new truck business was more than offset by higher revenue from service activities, with especially strong gains in revenue from short-term rental business.
Earnings
EBIT in the STILL segment stood at €98 million in the year under review. This very substantial increase of €103 million was the result of the increase in sales, cost savings, and the use of efficiency gains. The EBIT figure reported for 2011, which had amounted to a net loss of €5 million, had been negatively affected by expenses in connection with the consolidation of production facilities in Europe and closure of the plants in Montataire and Bari, including provisions for the related severance payments. Accordingly, non-recurring items produced an expense of €97 million in 2011, compared with a net expense of just €17 million in 2012.
The KION acquisition items attributable to the STILL segment amounted to an expense of €7 million in 2012, compared with an expense of €8 million in 2011. Adjusted EBIT climbed to €123 million (2011: €100 million). This caused the adjusted EBIT margin to rise from 6.0 per cent in 2011 to 7.3 per cent in 2012. Adjusted EBITDA improved to €218 million (2011: €191 million), while the adjusted EBITDA margin climbed from 11.5 per cent to 13.0 per cent.

KION Holding 1 GmbH
Group management report 2012
Page 35 of 69
Business situation and financial performance of the Financial Services (FS) segment
Business situation
Revenue generated by the Financial Services segment increased from €480 million to €509 million and includes intra-group revenue with the LMH and STILL segments. The revenue that the FS segment generated outside the Group rose by 12.0 per cent to €297 million (2011: €265 million).
The volume (residual value) of leasing in the FS segment amounted to €997 million as at 31 December 2012 (31 December 2011: €906 million). Of this total, 45 per cent was attributable to FS companies. The volume, which was refinanced via sale and leaseback agreements, amounts to 80 per cent of the total value. The refinancing of the remaining 20 per cent takes place via Group treasury as part of KION’s financial liabilities. If one includes the indirect leasing business, which is handled via external lease providers and is not a part of the FS segment, 73 per cent of the leasing business concentrates on the core European markets of Germany, France, the UK, Italy and Spain.
Financial performance
The FS segment registered earnings before taxes (EBT) of €5 million in 2012 (2011: €6 million). The adjusted EBT margin, expressed as a percentage of total revenue, decreased from 1.28 per cent to 0.94 per cent.
Business situation and financial performance of the Other segment
Business situation
Total revenue in the Other segment rose significantly year on year to €251 million (2011: €223 million). As in 2011, the main revenue drivers were internal IT and logistics services. Revenue generated from external companies amounted to €43 million (2011: €40 million), most of which was contributed by Voltas MH, which had only been consolidated for nine months in 2011. Voltas MH benefited from the increased production capacity at the plant built in Pune in 2011 and from the further strengthened sales and service network.
Financial performance
EBIT in the Other segment decreased to €-12 million (2011: €43 million), while adjusted EBIT fell from €68 million in 2011 to €44 million in 2012, owing in part to decreased investment income. The markedly positive result of the Other segment includes significant investment income from subsidiaries that were eliminated at Group level. Operationally, Voltas MH in particular made a positive contribution to segment earnings.

KION Holding 1 GmbH
Group management report 2012
Page 36 of 69
Financial position
Principles and objectives of financial management
By pursuing an appropriate financial management strategy, KION GROUP GmbH ensures that sufficient cash and cash equivalents are available at all times to meet the Group companies' operational and strategic funding requirements. In addition, KION GROUP GmbH optimises its financial relationships with customers and suppliers, manages any collateral security offered and mitigates the financial risk to its enterprise value and profitability, notably currency risk, interest-rate risk, price risk, counterparty risk and country risk.
A syndicated credit facility with a group of international banks and investors meets KION's basic borrowing requirements. In addition, KION avails itself of the funding facilities offered by the public capital markets, having issued a corporate bond of 2011.
The financial resources within the Group are provided based on an internal funding approach. According to this approach, KION collects liquidity surpluses of the Group companies in central or regional cash pools and, where possible, covers subsidiaries' funding requirements with intercompany loans. This central source of funding enables KION to present a united front in the capital markets and strengthens its hand in negotiations with banks and other market participants.
The Group occasionally arranges additional credit lines for KION Group companies with local banks or leasing companies in order to comply with legal, tax and other regulations.
For funding purposes, KION also engages to a small extent in factoring. The volume of non-recourse factoring business amounted to €20 million at the end of 2012 (31 December 2011: €18 million); the Company only uses recourse factoring in isolated cases. The KION Group maintains a liquidity reserve in the form of unrestricted, bindingly committed credit lines and cash in order to ensure financial flexibility and solvency.
The senior facility agreement (SFA), which is the main loan agreement, and the contractual terms and conditions governing the issuance of the corporate bond require, among other things, compliance with covenants. The SFA also requires compliance with specific financial covenants during the term of the agreement. The financial covenants specify required ratios for the financial position and financial performance of the KION Group. If undertakings or financial covenants are breached, this may, for example, give lenders the right to terminate the SFA or permit bondholders to call the corporate bond prior to its maturity date. All the financial covenants were complied with in the past financial year.
KION only uses derivatives to hedge underlying operational transactions; in particular, they comprise currency forwards and interest-rate swaps and are used for hedging purposes to mitigate currency and interest-rate risks. In the year under review only cash flow hedges were used for currency and interest-rate risks.
Main financing activities in 2012
KION's financial position improved substantially in 2012 owing to a number of measures put in place. The steps taken to reduce debt levels will have a positive impact on financial result in future years.
The shareholder loan from Superlift Holding S.à r.l., which had a principal amount of €500 million plus accrued interest of €171 million, was converted into equity on 27 December 2012. On the same date, a contribution of €467 million (including premium) was paid by Weichai Power for the takeover of 25 per cent of the share capital of KION Holding 1 GmbH (see note 28, page 41). These two steps, less credit procurement costs, increased the KION Group's equity by €1,133 million, which had been negative as at 31 December 2011. Another positive impact came from Weichai Power's acquisition of 70 per cent of the shares in Linde Hydraulics. This resulted in earnings of €212 million before taxes,

KION Holding 1 GmbH
Group management report 2012
Page 37 of 69
which, together with the favourable operating result, boosted net income in 2012 and thereby also helped to increase equity.
Conversion of the shareholder loan improved the borrowing situation. Furthermore, KION GROUP GmbH successfully negotiated with its creditors to extend the maturities of existing loan facilities with a volume of more than €1 billion (see note 30 on page 53). This also creates greater flexibility with regard to paying back senior facilities agreements (SFAs). The maturity of the existing revolving credit line was also extended from December 2013 to December 2016. Additional commercial and technical changes included a moderate increase in the funds available for acquisitions (acquisition basket). Shareholder loan G, which has a volume of €114 million, was extended from December 2016 to June 2018. By issuing a new corporate bond at the beginning of the new financial year, KION achieved a further extension on its debt maturity profile (see ‘Events after the balance sheet date’, page 57).
Analysis of capital structure
Table 16
Financial debt KION's total financial liabilities – including the bond issued in 2011 – amounted to €2,352 million as at 31 December 2012, down by €652 million compared with the same date a year earlier. The crucial factor here was the reduction of financial liabilities resulting from cash inflows from the Weichai transaction of €471 million, the repayment of a drawdown of €138 million taken on the revolving credit facility in November 2011, as well as the repayment of the multicurrency capex facility in the amount of €56 million and a decrease in the financial liabilities of local Group companies. This was counteracted by the increase in accrued and unpaid interest (payment in kind, PIK).
As at 31 December 2012, the equity and liabilities side of the consolidated statement of financial position continued to be significantly affected by the financial liabilities incurred through KION Group's acquisition financing (SFA).
Condensed balance sheet, equity and liabilities
in € million 2012 in % 2011 in % Change
Equity 660 10.6% -488 -8.0% >100%
Non-current liabilities 3,929 63.2% 4,842 79.8% -18.9%
thereof: Shareholder loan − 0.0% 643 10.6% -100.0%
Corporate bond 489 7.9% 488 8.0% 0.4%
Financial liabilities 1,811 29.2% 2,290 37.7% -20.9%
Deferred tax liabilities 309 5.0% 339 5.6% -8.9%
Lease liabilities 329 5.3% 300 4.9% 9.7%
Current liabilities 1,624 26.1% 1,711 28.2% -5.1%
thereof: Financial liabilities 52 0.8% 227 3.7% -77.2%
646 10.4% 634 10.5% 1.9%
Lease liabilities 146 2.3% 147 2.4% -0.6%
Total equity and liabilities 6,213 6,066 2.4%
Trade payables

KION Holding 1 GmbH
Group management report 2012
Page 38 of 69
Non-current financial liabilities stood at €2,301 million as at 31 December 2012 (31 December 2011: €2,777 million), which was primarily due to cash inflows resulting from the Weichai transaction of €471 million, and currency fluctuations. Also included were capital market liabilities of €489 million. These were the liabilities arising from the corporate bond issued in 2011 with a total volume of €500 million. Of this amount, €325 million carried a fixed interest rate and €175 million a floating interest rate. The carrying amount of the bond was reduced by associated borrowing costs of €11 million.
Current financial liabilities, which came to €52 million as at 31 December 2012, largely consisted of the remaining multi-currency capex facility (€18 million) and the financial liabilities of local Group companies (€33 million). The year-on-year decrease (31 December 2011: €176 million) is attributable to the payment of the amount of the revolving credit facility, the partial reduction of the capex facility, and the reclassification of €18 million of non-current financial liabilities to current financial liabilities within the multi-currency capex facility, which were carried out in 2012. The weighted average interest rate on current financial liabilities arising from the multi-currency capex facility was 3.4 per cent as at 31 December 2012 (31 December 2011: 4.4 per cent).
Table 17
Net financial debt
After deduction of cash and cash equivalents, the remaining net financial debt came to €1,790 million as at 31 December 2012 (31 December 2011: €2,631 million). At €34 million, the borrowing costs included within this were close to the level of the previous year (31 December 2011: €33 million). The sharp decline in net financial debt of 32.0 per cent is due to repayments and the net cash provided by the contributions made as part of the resolution to carry out a capital increase.
Credit terms
in € million Type Currency Interest rate Maturity 2012 2011
Term Loan Facility Term B1 Bank Loan EUR EURIBOR + MARGIN 2014 139 691Term Loan Facility Term B2 Bank Loan EUR EURIBOR + MARGIN 2017 411 − Term Loan Facility Term B1 Bank Loan USD LIBOR + MARGIN 2014 108 311Term Loan Facility Term B2 Bank Loan USD LIBOR + MARGIN 2017 79 − Term Loan Facility Term C1 Bank Loan EUR EURIBOR + MARGIN 2015 287 663Term Loan Facility Term C2 Bank Loan EUR EURIBOR + MARGIN 2017 383 − Term Loan Facility Term C1 Bank Loan USD LIBOR + MARGIN 2015 227 311Term Loan Facility Term C2 Bank Loan USD LIBOR + MARGIN 2017 81 − Term Loan Facility Term D Bank Loan EUR EURIBOR + MARGIN 2012 − 202Term Loan Facility Term G Bank Loan EUR EURIBOR + MARGIN 2018 116 111Term Loan Facility H1a (Corporate bond - fixed rate) Fixed rate 2018 325 325Term Loan Facility H1b (Corporate bond - floating rate) 3-M-EURIBOR+MARGIN 2018 175 175Multicurrency Revolving Credit Facility Bank Loan EUR EURIBOR + MARGIN 2012 − 133
Bank Loan EUR EURIBOR + MARGIN 2013 18 72
Diverse Diverse 33 38
4 7./. Capitalized borrowing costs -34 -33
Financial debt 2,352 3,005
Multicurrency Capex Restructuring and Acquisition Facility
Other liabilities to banksVarious currencies and interest terms
Other financial liabilities to non-banks
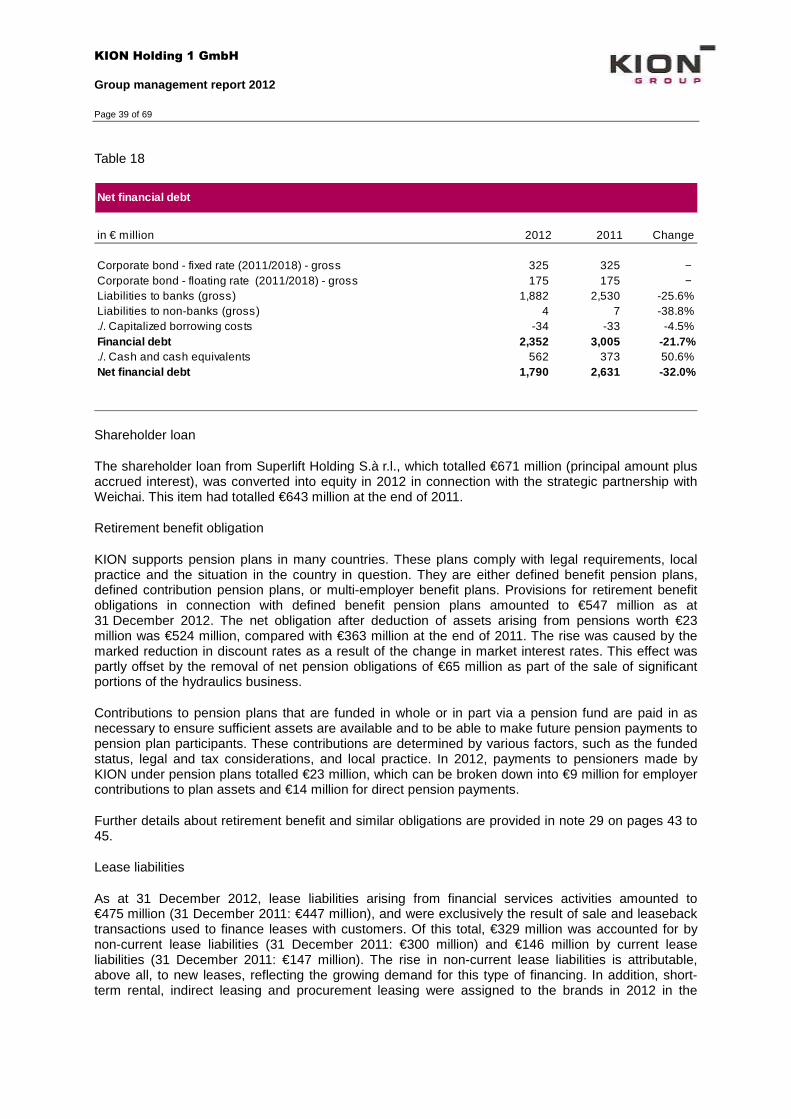
KION Holding 1 GmbH
Group management report 2012
Page 39 of 69
Table 18
Shareholder loan
The shareholder loan from Superlift Holding S.à r.l., which totalled €671 million (principal amount plus accrued interest), was converted into equity in 2012 in connection with the strategic partnership with Weichai. This item had totalled €643 million at the end of 2011.
Retirement benefit obligation
KION supports pension plans in many countries. These plans comply with legal requirements, local practice and the situation in the country in question. They are either defined benefit pension plans, defined contribution pension plans, or multi-employer benefit plans. Provisions for retirement benefit obligations in connection with defined benefit pension plans amounted to €547 million as at 31 December 2012. The net obligation after deduction of assets arising from pensions worth €23 million was €524 million, compared with €363 million at the end of 2011. The rise was caused by the marked reduction in discount rates as a result of the change in market interest rates. This effect was partly offset by the removal of net pension obligations of €65 million as part of the sale of significant portions of the hydraulics business.
Contributions to pension plans that are funded in whole or in part via a pension fund are paid in as necessary to ensure sufficient assets are available and to be able to make future pension payments to pension plan participants. These contributions are determined by various factors, such as the funded status, legal and tax considerations, and local practice. In 2012, payments to pensioners made by KION under pension plans totalled €23 million, which can be broken down into €9 million for employer contributions to plan assets and €14 million for direct pension payments.
Further details about retirement benefit and similar obligations are provided in note 29 on pages 43 to 45.
Lease liabilities
As at 31 December 2012, lease liabilities arising from financial services activities amounted to €475 million (31 December 2011: €447 million), and were exclusively the result of sale and leaseback transactions used to finance leases with customers. Of this total, €329 million was accounted for by non-current lease liabilities (31 December 2011: €300 million) and €146 million by current lease liabilities (31 December 2011: €147 million). The rise in non-current lease liabilities is attributable, above all, to new leases, reflecting the growing demand for this type of financing. In addition, short-term rental, indirect leasing and procurement leasing were assigned to the brands in 2012 in the
Net financial debt
in € million 2012 2011 Change
Corporate bond - fixed rate (2011/2018) - gross 325 325 − Corporate bond - floating rate (2011/2018) - gross 175 175 − Liabilities to banks (gross) 1,882 2,530 -25.6%Liabilities to non-banks (gross) 4 7 -38.8%./. Capitalized borrowing costs -34 -33 -4.5%Financial debt 2,352 3,005 -21.7%./. Cash and cash equivalents 562 373 50.6%Net financial debt 1,790 2,631 -32.0%

KION Holding 1 GmbH
Group management report 2012
Page 40 of 69
context of the new segmentation. The corresponding liabilities were reclassified accordingly under other financial liabilities (see note 33, pages 58 and 59). Other financial liabilities also include liabilities arising from residual-value guarantees amounting to €21 million. These relate to residual-value guarantees, provided in connection with the sale of assets to leasing companies, where the guaranteed amount is more than 10 per cent of the fair value of the asset in question. The lease liabilities are covered to the furthest extent possible by lease receivables, future inflows of funds from sub-leases with customers and revenue from the sale of used trucks.
Equity
The KION Group's equity rose by €1,148 million year on year to €660 million (31 December 2011: minus €488 million). The main contributing factor here was the conversion of the shareholder loan into equity, as well as the contribution made by Weichai Power for the acquisition of 25 per cent of the shares in KION Holding 1 GmbH by way of a capital increase (see page 7). The increase in the balance of retained earnings and net income from minus €806 million to minus €648 million was due to the encouraging level of net income.
Funding vehicles not reported on the statement of financial position
KION makes limited use of funding vehicles not reported on the statement of financial position. As part of its financing activities KION has, both for its own use and to be transferred on to its customers, entered into lease agreements that in accordance with the relevant IFRS requirements are not reported as either an asset or a liability on the statement of financial position. The nominal amount of the contractual obligations arising from such leases not reported on the statement of financial position was €194 million as at 31 December 2012 (31 December 2011: €205 million, see note 34, page 61).
Analysis of capital expenditure
Capital expenditure (excluding leasing and rental assets) was funded by cash flow from operating activities and by withdrawals from the revolving part of the SFA in 2012.
The total volume of investment was €155 million, which represents a year-on-year rise of 16.6 per cent (2011: €133 million). The main reasons for this rise were product developments and production modifications, ongoing modernisation of the IT infrastructure and the construction and expansion of production facilities, particularly in China and Brazil. In both segments, LMH and STILL, capital expenditure increased.
The bulk of capital expenditure went on the development of new counterweight trucks, electric forklift trucks and reach trucks (see the section on research and development, pages 50 to 53) – partly to comply with stricter environmental regulations – and on innovations such as hybrid technology. Operational investments predominantly related to equipment and machinery for the production of new industrial trucks and components. IT investment projects related to areas such as central sales management.

KION Holding 1 GmbH
Group management report 2012
Page 41 of 69
Table 19
Current capital expenditure projects do not incur any significant subsequent financial obligations.
Analysis of liquidity
Liquidity management is an important aspect of central financial management. The sources of liquidity are cash and cash equivalents (including pledged cash deposits), cash flow from operating activities and lines of credit available under the SFA. Cash and cash equivalents totalled €562 million as at 31 December 2012 (31 December 2011: €373 million). Taking into account the available multi-currency revolving credit facility, KION had access to cash and cash equivalents amounting to €931 million as at the reporting date, compared with €499 million as at 31 December 2011.
Table 20
Cash flow from operating activities increased from €387 million in 2011 to €414 million in 2012. This was due to the €337 million increase in EBIT, which had been influenced to some extent by non-recurring items (see page 30). Overall, this more than offset the decrease in cash flow caused by the net increase in leased and rental assets (after the deduction of writedowns).
Cash flow from investing activities resulted in the amount of €104 million (2011: net cash outflow of €153 million). The outflows of cash for the acquisition of the outstanding shares in Linde Creighton and for investment in plant and machinery as well as office equipment – predominantly in Brazil and China – were offset by net inflows of €260 million from the sale of the hydraulics business.
Due to the influencing factors described, free cash flow (see page 21) rose to €518 million (2011: €234 million).
Capital expenditures by segment
in € million 2012 2011 Change
LMH 89 76 17.4%STILL 51 43 18.1%Financial Services 0 − -Other 15 14 7.3%
Total 155 133 16.6%
Condensed cash flow statement
in € million 2012 2011 Change
EBIT 550 213 >100%Cash flow from operating activities 414 387 7.0%Cash flow from investing activities 104 -153 >100%
Free cash flow 518 234 >100%Cash flow from financing activities -330 -115 <-100%Currency effects on cash 1 1 -7.2%
Change in cash and cash equivalents 189 121 56.7%
Net financial debt 1,790 2,631 -32.0%

KION Holding 1 GmbH
Group management report 2012
Page 42 of 69
Cash flow from financing activities amounted to a total net cash outflow of €330 million in 2012 (2011: net cash outflow of €115 million). Repayment of the finance facilities resulted in an outflow of cash of €665 million, of which €138 million was used to repay the multi-currency revolving credit facility and €56 million to repay the multi-currency capex facility. Interest payments amounted to €130 million, compared with €147 million in 2011. Of the moderate cash outflow of €10 million, €8 million occurred in connection with the acquisition of the remaining shares in Voltas MH. The inflow of cash from the contribution made as part of the resolution to carry out the capital increase had a positive effect on cash flow.
This caused cash and cash equivalents to rise sharply, from €373 million at the end of 2011 to €562 million at the reporting date (see page 43).

KION Holding 1 GmbH
Group management report 2012
Page 43 of 69
Net assets
Table 21
Non-current assets
Non-current assets increased by 1.7 per cent year on year to €4,231 million (31 December 2011: €4,160 million).
The decline in intangible assets, which had fallen by €108 million to €2,407 million as at the reporting date, was predominantly due to the reduction in goodwill as part of the sale of significant portions of the hydraulics business. Depreciation and amortisation on technologies, developments and other intangible assets exceeded the volume of assets capitalised during the period.
As at 31 December 2012 leased assets totalled €191 million, up by €24 million compared with 31 December 2011. The increase can primarily be attributed to the greater volume of operating leases for industrial trucks, in which beneficial ownership remains with KION as the lessor. KION’s good operational development led to an increase in leasing assets in spite of the separation of leased and rental assets resulting from the new segmentation (see note 8, page 9). Rental assets also increased by €38 million as at 31 December 2012, to €395 million.
Other property, plant and equipment declined by €53 million year on year to €500 million. New assets were added, above all in connection with the expansion of production facilities in China and Brazil. However, these were offset by disposals resulting from the sale of the hydraulics business, impairment losses recognised in connection with the closure of production facilities as well as depreciation and amortisation.
The marked increase in investments accounted for using the equity method, from €37 million to €155 million is primarily attributable to the consolidation of the minority shareholding in Linde Hydraulics.
Condensed balance sheet, assets
in € million 2012 in % 2011 in % Change
Non-current assets 4,231 68.1% 4,160 68.6% 1.7%
thereof: Goodwill 1,473 23.7% 1,538 25.4% -4.2%
Brand names 594 9.6% 594 9.8% -0.1%
Deferred tax assets 265 4.3% 262 4.3% 1.1%
Leased assets 191 3.1% 167 2.8% 14.3%
Rental assets 395 6.4% 357 5.9% 10.8%
Lease receivables 267 4.3% 243 4.0% 10.0%
Current assets 1,982 31.9% 1,906 31.4% 4.0%
thereof: Inventories 550 8.9% 625 10.3% -12.1%
Trade receivables 625 10.1% 677 11.2% -7.6%
Lease receivables 132 2.1% 118 2.0% 11.6%
Cash 562 9.1% 373 6.2% 50.6%
Total assets 6,213 6,066 2.4%

KION Holding 1 GmbH
Group management report 2012
Page 44 of 69
The increase in non-current leasing receivables by 10.0 per cent to €267 million reflects the high number of additional long-term leasing agreements.
The increase in other financial assets from €26 million to €50 million was predominantly due to the measurement of derivatives at fair value and the measurement of the put option on additional shares in Linde Hydraulics.
An explanation of the change in deferred tax assets is provided in note 16 on page 27.
Acquisition of the outstanding shares in Linde Creighton resulted in additions of €27 million to non-current assets and of €19 million to current assets.
Current assets
Current assets had grown by €76 million to €1,982 million as at 31 December 2012. The main reason for this was the rise in cash and cash equivalents owing to the contributions made as part of the resolution to carry out a capital increase in connection with Weichai Power's investment in KION Holding 1 GmbH.
Inventories decreased by €75 million to €550 million, predominantly due to the deconsolidation of Linde Hydraulics. Moreover, the year-on-year increase resulting from KION’s operating activities was rebalanced at the end of the year under review.
Table 22
Trade receivables fell by €51 million to €625 million as at 13 December 2012. Working capital (inventories and trade receivables less trade payables) was €529 million as at the reporting date, €138 million less than it had been a year earlier (31 December 2011: €668 million).
The substantial rise in cash and cash equivalents, from €373 million at the end of 2011 to €562 million as at 31 December 2012, can be attributed to the considerable improvement to the operational cash flow of the KION Group. The cash inflow of €738 million resulting from the Weichai transactions was used as far as possible to repay financial debt, leading to an increase in cash of €73 million (see page 42).
Investor relations
In April 2011 KION issued its first secured corporate bond, thereby opening up access to the international capital markets and diversifying its investor base. With a maturity date of 2018 and a total volume of €500 million, the bond was issued in a tranche of €325 million at a fixed interest rate and in
Inventories
in € million 2012 2011 Change
Materials and supplies 120 151 -20.5%Work in progress 75 98 -23.8%Finished goods and merchandise 349 371 -5.8%Advances paid 6 5 11.8%
Total inventories 550 625 -12.1%

KION Holding 1 GmbH
Group management report 2012
Page 45 of 69
a tranche of €175 million at a floating interest rate. It is listed on the Luxembourg stock exchange. The coupon on the fixed-interest tranche (ISIN XS0616432224) is 7.875 per cent. The floating-rate tranche (ISIN XS0616442298) is 425 basis points above the prevailing three-month EURIBOR rate, which equated to an average interest rate of 5.0 per cent over the reporting period.
Chart 7: Bond performance since issue in April 2011
Having been rather subdued in 2011, the market for corporate bonds was generally very popular in 2012. Market growth also benefited the performance of the two KION tranches, which completely made up for the falls in price seen during the previous year. As a result, the increase generated in 2012 was sharper than that of the benchmark index, the iBoxx. This was certainly also due to KION's strong operational performance, as reflected in the adjusted annualised EBIT, which benefited the bond prices. Since issuing the bond, KION has established relationships based on transparent communications with financial analysts and investors specialising in high-yield bonds and has integrated them in its regular capital market communications as part of its investor relations activities. Another important aspect of this work was the cooperation with the rating agencies Standard & Poor’s (S&P) and Moody’s Investors Service (Moody’s), which have rated KION since the bond issue. The credit ratings awarded did not change in 2012: the KION Group's rating was B3/stable (Moody’s) and B/stable (S&P), while the bond's was B2 (Moody’s) and B (S&P). During the new financial year, Moody’s raised its rating outlook for the KION Group from stable to positive. At the same time, the very successful placement of an additional corporate bond has also confirmed KION’s good standing with bond investors (see ‘Events after the balance sheet date’ on page 57).

KION Holding 1 GmbH
Group management report 2012
Page 46 of 69
NON-FINANCIAL PERFORMANCE INDICATORS
KION's enterprise value is determined not only by financial KPIs but to a significant extent also by non-financial ones. The non-financial KPIs are based on KION's relations with its customers and employees, on its technological position and on environmental considerations. They enable conclusions to be drawn about the extent to which KION succeeds in:
• being an attractive and responsible employer that can retain competent and committed employees;
• developing products that meet customers' needs and environmental requirements now and in future;
• continually increasing the customer benefits provided by its products and services;
• designing production processes in such a way that resources are conserved and emissions are avoided as far as possible.
KION firmly believes that these aspects are crucial to its positioning as a pioneering company in a highly competitive environment. Human resources
HR strategy
KION's success is founded on the capabilities and commitment of its employees. The Group's human resources (HR) strategy is geared towards providing the best possible support for strategic development and international growth. KION aims to always have a sufficient number of qualified, committed employees at all levels of the Group and to offer them attractive working conditions and the opportunities afforded by working for an international group of companies. This strategy also enables KION to tackle the challenges of demographic change.
The KION Group's growth in 2012 was reflected in the size of its workforce, which amounted to 22,232 employees on average over the year (2011: 20,797 employees). As at 31 December 2012, a total of 21,215 employees (full-time equivalents including trainees and apprentices) were employed across the Group. The reduction is a result of spinning off the hydraulics business. A total of 1,487 employees transferred to the new company Linde Hydraulics on 27 December 2012 and therefore no longer belong to the KION Group.
The number of employees in the LMH segment fell moderately. The aforementioned effect of the sale of the hydraulics business was largely offset by growth in other areas, including the acquisition of the sales company Linde Creighton Ltd. with 300 full-time equivalents. The service teams in eastern Europe were also enlarged in order to meet growing demand in that region. In the STILL segment, the decline in the number of production employees – resulting from the transfer of production to other sites – was offset by an increase in sales and service roles. The new FS segment's headcount advanced from 96 to 112 over the course of the year.
Every region (except Germany) registered a year-on-year rise in employee numbers. Germany is an exception to this, as the divestment of the hydraulics business resulted in a decrease in employees in the KION Group. The strongest percentage increases occurred in the Americas and China. As at 31 December 2012, 65.1 per cent of the workforce was employed outside Germany (31 December 2011: 61.5 per cent).

KION Holding 1 GmbH
Group management report 2012
Page 47 of 69
Headcount
Table 23
Consolidation of the European production sites, which had been initiated in 2011, was implemented in 2012 with the minimum possible social impact and in close collaboration with employee representatives. The site in Montataire (France) was shut down and manufacturing of warehouse trucks was transferred from there to Luzzara (Italy) in the fourth quarter of 2012. The site in Bari (Italy) closed in July 2012, with production of counterbalance trucks transferring to Hamburg. Due to higher average number of positions during the year under review, coupled with wage and salary adjustments, personnel costs were 13.1 per cent higher than in the previous year.
Table 24
31/12/2012 LMH STILL FS Other Total
Germany 3,073 3,864 21 439 7,397France 2,302 739 13 95 3,149Rest of Europe 3,919 2,193 52 0 6,164China 3,124 0 9 0 3,133Americas 122 457 1 0 580Rest of World 608 0 16 168 792
Total 13,148 7,253 112 702 21,215
31/12/2011
Germany 4,331 3,641 16 428 8,416France 2,221 899 16 107 3,243Rest of Europe 3,644 2,379 55 2 6,080China 2,856 0 1 0 2,857Americas 161 373 3 0 537Rest of World 573 0 5 151 729
Total 13,786 7,292 96 688 21,862
Full-time equivalents
Personnel expenses
in € million 2012 2011 Change
Wages and salaries 947 834 13.5%Social security contributions 222 200 11.1%Post-employment benefit costs 34 30 13.4%
Total 1,203 1,064 13.0%

KION Holding 1 GmbH
Group management report 2012
Page 48 of 69
Diversity
KION sees itself as a global provider with intercultural skills that fosters international cooperation between employees – for example through the Linde expat programme, which enables employees to move to a number of partner countries. As at 31 December 2012, KION employed people from 69 different countries.
Another aspect of diversity is increasing the proportion of female employees, which rose from 14.7 per cent to 15.9 per cent in 2012. Women occupied 8.6 per cent of management positions (2011: 8.2 per cent).
KION has taken a range of steps to tackle the challenges of demographic change. For example, it ensures working conditions are suited to employees' age-related requirements and organises healthy-living programmes so that it can continue to benefit from older employees' experience. KION also offers partial retirement models, in which 333 employees were participating as at the reporting date (31 December 2011: 412). On this date, 23 per cent of employees were over the age of 50 (31 December 2011: 23 per cent).
In addition, KION offers flexible working-time models that promote a good work-life-balance. For example, Linde MH signed a company agreement about 'teleworking/home office' in the first quarter of 2012. The agreement stipulates the terms on which employees can work at home on a mutually agreed, voluntary basis.
Development of specialist workers and executives
Finding highly qualified people to fill specialist and executive positions is crucial to KION's success. As a result, one of the focuses of HR work was again the recruitment of suitable young talent in 2012. KION endeavours to offer them interesting development opportunities and flexible, family-friendly working-time models.
The Group companies collaborate on areas such as talent management and training & development programmes. This helps to systematically identify and support staff with strong potential, high performers and experts in key functions. Launched in 2012, KION Campus is an international, cross-brand executive development programme aimed at the Group's 300 or so top executives. KION cooperates with the European School of Management and Technology (ESMT) on the programme. In addition, new managers at STILL receive support under the First Leading programme during their first few years. Prospective managers can enhance their skills through STILL's Young Professional programme, while international staff with high potential can participate in the International Junior Circle. The STILL Academy offers subject-specific and interdisciplinary skills training courses. Opportunities at LMH include a virtual assessment centre for future managers.
In March 2012 STILL was one of around 100 German companies to receive the 'Germany's Top Employers 2012' award. Certification for this award is carried out by the international Corporate Research Foundation (CRF Institute), which looks at what employers offer in terms of remuneration and employee benefits, career and development opportunities, working conditions and corporate culture.
Training and professional development
The companies in the KION Group currently offer training for 17 professions in Germany. They employed a total of 543 trainees and apprentices as at 31 December 2012 (31 December 2011: 621 including the hydraulics business). Work placements for students combining vocational training with a degree course are also offered in cooperation with various universities. In the year under review STILL came third in the competition 'Hamburg's best workplace training providers'.

KION Holding 1 GmbH
Group management report 2012
Page 49 of 69
Health and safety in the workplace
The steps that the KION companies must take with regard to workplace safety, health and the environment are laid down in a corporate policy. According to this document, KION's obligations include taking comprehensive precautions to ensure a safe working environment and ensuring employees know how to avoid risks and accidents.
Strict rules governing health, safety and the environment apply in all areas of the company. In the reporting year, ten plants were audited in accordance with a group-wide standard. The audits increased awareness of workplace safety and highlighted areas for improvement. In 2012 the KION companies arranged 783 training courses in Germany alone on various aspects of workplace safety. At 97 per cent, the health rate remained at the same high level as in the previous year. The number of workplace accidents and the workdays lost as a result had fallen compared with 2011. Analysis of accidents and detailed action plans help to reduce risks in the workplace.

KION Holding 1 GmbH
Group management report 2012
Page 50 of 69
Research and development
Strategic focus of research and development
In 2012 the KION Group again channelled a considerable proportion of its product revenue into enhancing its portfolio so that it can consolidate its position as a leading technology provider. Research and development (R&D) is therefore geared towards the overarching aim of containing customers' total cost of ownership (TCO) – including purchase price, maintenance and repair costs and fuel consumption – while complying with environmental targets and regulatory requirements. R&D activities also focus on integrating KION's logistics solutions into customers' value chains and harnessing the potential of new application areas.
Brand-specific and cross-brand modular and platform strategies are pursued to ensure R&D is as cost-efficient as possible. KION has taken steps to reduce the complexity and diversity of products and thereby accelerate the development process. The cross-brand R&D platform enables research results and technological expertise to be shared, although responsibility for product development lies mainly with the individual companies.
In the year under review the KION Group continued to expand its international R&D facilities so that it can better cater to the different requirements of customers around the world. A research centre at the new São Paulo plant was set up in 2012 to develop trucks for the South American market. KION also expanded its development departments in Xiamen, China and Pune, India. Following the closure of the plant in Montataire, France, the European development teams for warehouse trucks are now located in Châtellerault, France and Luzzara, Italy.
Key R&D figures
The KION Group spent a total of €120 million on R&D in 2012, the same amount as in the previous year. This corresponded to 2.5 per cent (2011: 2.8 per cent) of revenue, or 4.3 per cent of revenue in new trucks and the hydraulics business. Consequently, R&D costs during the year under review were higher than the industry average. This total included capitalised development costs of €51 million (2011: €53 million), which were offset by depreciation and amortisation of €56 million (2011: €53 million) (see note 18, page 32). The 4.1 per cent rise in the amount recognised as an expense was largely attributable to a multitude of new developments and refinements – which required additional headcount, above all in preliminary and series development – as well as higher salary costs and material costs. The cost increases were kept down by improving efficiency, notably through cross-brand cooperation as part of modular and platform strategies and by concentrating CAD services in Xiamen.
The number of full-time equivalents employed in R&D totalled 847 as at the reporting date (31 December 2011: 914, including hydraulics activities). An increase in full-time positions can be calculated on a comparable basis, which primarily related to the expansion of the KION Asia development centre in Xiamen (China), whereas there was only an insignificant change in headcount in Europe.
External costs predominantly related to engineering services, materials for prototype development and IT. LMH and Linde Hydraulics have begun to collaborate closely on developing new hydraulics products for the future.
Total R&D spending, including depreciation, amortisation and impairment, as well as capitalisation of assets, amounted to €120 million in 2012.

KION Holding 1 GmbH
Group management report 2012
Page 51 of 69
Table 25
KION takes comprehensive measures to protect the products it develops against imitations. In 2012 the KION companies registered a total of 63 patents. The number of patent applications totalled 96, of which 50 were submitted by LMH and 41 by STILL. The decrease year on year (2011: 125 patent applications) results from the disposal of the hydraulics business. On a comparable basis, the number of patent applications increased moderately compared to the previous year. As at 31 December 2012, the companies of the KION Group held a total of 1,495 patent applications and issued patents (31 December 2011: 1,720 patent applications and issued patents).
Focus of R&D in 2012
Reduction of emissions and fuel consumption
In light of the stricter exhaust emissions standards, LMH and STILL undertook significant projects to reduce emissions (see also page 25and 56).
For example, LMH put new engines into its counterbalance trucks in the 2.5-5 tonne weight category and fitted them with a particulate filter system as standard in order to meet the European Stage IIIB limits for diesel-powered forklift trucks with an output of 37kW or higher, which came into force in January 2013. Trucks in the Linde EVO series produce emissions at a far lower level than permitted limits and achieve double-digit percentage reductions in fuel consumption. Series production will begin in early 2013. Another major project at Linde was the development to production readiness of a new reach truck. This truck also offers lower fuel consumption and a variety of attractive new product features. In addition, LMH expanded the range of model variants in its electric forklift truck series in the 2-5 tonne weight category.
A focus of development activities at STILL was the new reach truck, which is based on the Group's platform concept. Two diesel counterbalance trucks in the 4-5 and 6-8 tonne weight category are also being developed. They will go into series production in 2013 and will also comply with the new emissions standards.
Drive technology
Development of new drive technologies centred on powerful lithium-ion batteries for electric and hybrid trucks. Various sizes of battery for hand pallet trucks and towing vehicles were refined at the development centre in Châtellerault, France. LMH and STILL expect to offer the first trucks fitted with lithium-ion batteries at the end of 2013. They store considerably more energy and can be charged faster than lead-acid batteries.
In addition, LMH and STILL are also pushing forward with the development of lithium-ion batteries for counterbalance trucks in higher weight categories. Another project, which LMH is working on with a
Total R&D spending
in € million 2012 2011 Change
R&D expenses 124 120 4.1%Amortisation/impairment charges -56 -53 -5.7%Capitalised development expenses 51 53 -4.0%
Total R&D spending 120 120 -0.1%R&D spending as percentage of revenue 2.5% 2.8% -

KION Holding 1 GmbH
Group management report 2012
Page 52 of 69
strategic partner, is concerned with developing high-performance booster batteries for hybrid trucks. In 2010 STILL was the first manufacturer worldwide to go into series production with a hybrid truck. This truck combines a drive system based on an internal combustion engine with a breaking-energy recuperation system from an electric truck, enabling it to achieve very low emissions values. Customer testing of the trucks provided feedback for product development. In November 2012 the hybrid truck won the new Federal Ecodesign Award from the Federal Ministry for the Environment, Nature Conservation and Nuclear Safety and the Federal Environment Agency.
In 2012 LMH's Electronic Systems & Drives (ES&D) unit teamed up with a strategic partner to develop the Rotrac E2, an electric trolley for pulling very heavy loads. It can be used to shunt rail vehicles, for example. A prototype of a container loader with an eco-friendly drive concept for use at airports has been undergoing field-testing since mid-2012.
KION is also participating in a government-sponsored research project (E-LOG-Biofleet) to improve handling and environmental friendliness using a fleet of industrial trucks with a fuel-cell hybrid solution. As part of the project, Linde equipped a fleet of ten trucks, which a customer has been putting through field tests since the end of 2012. The strategic partner for this project is a manufacturer of battery charging systems. STILL continued its longstanding international fuel cell activities for industrial trucks in 2012, putting an additional six trucks into operation for two clients.
Workplace safety and ergonomics
The safety features of the industrial trucks continued to be refined in 2012. The new models in the Linde EVO series are the world's first diesel trucks with a 'curve assist' system fitted as standard. This system adjusts cornering speed depending on the steering angle. An automatic parking brake has been developed for electric trucks, thereby improving convenience and safety. STILL developed a new restraint system, netProtect, which operates automatically so that the driver does not have to fasten or undo the seatbelt manually.
The KION companies are also working on further reducing human vibration and other vibrations, including by improving the seats and cushioning.
Region-specific and customer-specific design
In 2012, KION's R&D centre in Xiamen focused on adapting truck concepts to meet the specific requirements of customers in China and other emerging markets. A basic, low-cost variant of a new counterbalance truck, which has a drive unit with a torque converter, was almost ready for series production at the end of 2012. LMH will use a platform concept to offer three models with different drive systems in different price categories. Progress was also made with three types of warehouse truck and a smaller towing vehicle that can pull loads of up to 2 tonnes. It will be marketed in China and elsewhere rounding out the product range at the lower end.
In 2012 customisation of industrial trucks to meet customer requirements featured more heavily in R&D activities than in previous years. The modular concept is intended to help KION to fulfil customers' requirements with even greater flexibility and speed in future.
Networking
The KION Group is working on refining material-flow management systems (MMSs) to meet the growing demand for automated solutions. At the Hannover trade fair in April 2012, STILL showcased a prototype of an autonomous reach truck that can independently navigate through a warehouse and respond to changes in the environment. The prototype was built in cooperation with partners as part of a project sponsored by the Federal Ministry of Economics and Technology.

KION Holding 1 GmbH
Group management report 2012
Page 53 of 69
The order-picker truck that was launched in 2012 can also navigate independently. The STILL PalletShuttle was launched in 2012: this semi-automatic storage and retrieval system can be integrated with STILL's MMS. Presented at CeBIT 2012, the Fleet Data Services software solution from STILL enables vehicle and driver data to be intelligently captured, formatted and made available online. Since February 2012 LMH has offered an extended logistics train programme, providing a more flexible way of optimising production, warehouse and transport logistics.
Represented by STILL, KION is participating in the IdentProLog research project, which is examining how to optimise the flow of goods by using radio frequency identification (RFID). The aim of the project is to establish consistent standards for RFID across the industry.

KION Holding 1 GmbH
Group management report 2012
Page 54 of 69
Customers
Customer focus at KION
KION focuses on the benefit for customers at every stage of the value chain. Its overarching objective is to make the TCO – the total acquisition and operating costs for the customer – as attractive as possible compared with competitor products. Central aspects of KION's focus on customers are:
• product development geared to creating benefits for customers (see page 50);
• interlinking of product and service business, encompassing spare parts, maintenance, fleet management and financing solutions;
• more than 1,100 sales and service outlets in over 100 countries, staffed by more than 8,400 employees and around 4,400 external service technicians and salespeople.
The individual brand companies are responsible for customer relations. They use tried-and-tested feedback processes, among other things, to obtain extensive knowledge about customer preferences in the different regions and price segments. Key account managers look after customers who are important in terms of the volume of unit sales and potential for growth and technology. Nevertheless, KION's reliance on individual customers is low: the ten largest customers generated 6 per cent of consolidated revenue in 2012 (2011: 6 per cent).
Customer-related performance indicators
Systematic customer relationship management (CRM) is crucial to KION's success and is therefore an integral element of how the Company is run. Service levels remained high in 2012, with many services available 24 hours a day. Faster response times are achieved using technologies such as the STILLProActive communications system, which forwards error messages to service engineers automatically.
This high level of service is possible owing to the high number of KION trucks in use, which creates demand for after-sales services. KION firmly believes that, by generating a high proportion of total revenue from services, it can stabilise business performance and reduce its susceptibility to economic downturns. At 40 per cent in 2012, this proportion was at a similar level to 2011 (42 per cent).
The KION companies gauge customer satisfaction in feedback discussions and from the degree of customer loyalty. STILL carries out regular customer satisfaction surveys in service and sales. A CRM project has also been launched with the aim of gaining a better understanding of the customer structure and customer needs so that resources can be deployed in an even more targeted manner. The number and quality of contacts with customers at trade fairs enable KION to draw conclusions about existing and new customers' interest in product innovations.
KION's overarching aim of offering customers a lower TCO than competitors was confirmed by, among other things, a study by the TÜV NORD Group. Two Linde warehouse trucks were subjected to a performance test in the study, which found that their total operating costs – including energy costs – offered potential savings of up to 20 per cent compared with competitor products.

KION Holding 1 GmbH
Group management report 2012
Page 55 of 69
Marketing and sales activities
As in previous years KION took the opportunity to showcase its range of products and services at a number of exhibitions and trade fairs.
Having acquired its trading partner Liftec Rusfors in 2011, LMH had its own stand for the first time at CeMAT Russia – the foremost logistics trade fair in Russia. LMH's StaplerCup, an international competition for forklift truck drivers, won the European Best Event Award (EuBEA) in Milan. Two trade fairs in Germany – MobiliTec in Hannover and sps ipc drives in Nuremberg – provided an opportunity to showcase the portfolio of electric trucks and electric drive systems. Baoli participated in CeMAT Asia, where it presented its new D series of forklift trucks in the 3-tonne weight category.
STILL demonstrated product innovations at the Hannover trade fair as well as updated intralogistics solutions at CeBIT 2012. At the International Supply Chain Conference in Berlin, STILL reported on the use of innovative drive technologies. In 2011 STILL introduced the cubeXX concept truck, which combines six different classes of industrial truck in a single vehicle, thereby creating greater flexibility in warehouse management. Moreover, STILL won the German Award for Business Communications in the category 'Best Event and Trade Fair Marketing' in 2012.

KION Holding 1 GmbH
Group management report 2012
Page 56 of 69
Sustainability
KION endeavours to achieve a balance between environmental, economic and social considerations in its business activities. This focus on sustainability is reflected in the development of eco-friendly and safe products that help customers to conserve energy, reduce emissions and comply with strict workplace safety standards (see the section on research and development, pages 50 to 53).
Furthermore KION designs the production processes in its plants around the globe to have as minimal an impact on the environment as possible. The corporate policy on health, safety and the environment, which was issued in November 2011, defines a number of requirements for the KION companies, including:
• avoiding the release of pollutants, discharge and emissions into the environment as far as possible;
• reducing the volume of waste by making better use of raw materials and using recyclable materials;
• using materials, products and processes that comply with best environmental practice; and
• using resources, energy and raw materials efficiently.
All plants capture data about their energy consumption, volumes of waste and recycling, water consumption, CO2 emissions and volatile organic compounds (VOC). This data is included in an annual internal environmental report. Data for 2012 was not available at the time this group management report was compiled.
According to the 2011 environmental report, energy consumption had declined slightly compared with 2010 despite the increased volume of production. As in 2010 around 50 per cent of the energy consumed was electricity and just under 30 per cent was gas. Approximately 92.5 per cent of waste was recycled, resulting in a further year-on-year decrease in the volume of waste. Water consumption rose slightly, VOC emissions declined significantly and CO2 emissions were slightly higher compared with 2010.
The Aschaffenburg site took significant steps in the year under review to ensure environmentally-friendly production by participating in a climate change project in the Lower Main region of Bavaria and by implementing a heat recovery system in its foundry.
LMH and STILL also took part in the Blue Competence sustainability initiative launched by the VDMA, in which participating companies from the plant and mechanical engineering sectors present examples of solutions that protect the environment and conserve resources.

KION Holding 1 GmbH
Group management report 2012
Page 57 of 69
EVENTS AFTER THE BALANCE SHEET DATE
On 11 January 2013, the Supervisory Board of KION GROUP GmbH expanded the Company's Executive Board. Ching Pong Quek, who has headed up KION's entire Asia business since 2008, was appointed to the Executive Board as Chief Asia Pacific Officer. This new post has been created in recognition of the growing importance of the region for the Group's financial performance.
The Supervisory Board has also made the management of the Linde and STILL brands more involved in running the Group as a whole. The CEO of Linde Material Handling GmbH, Theodor Maurer, and the CEO of STILL GmbH, Bert-Jan Knoef, have also been appointed to the Executive Board of the KION Group. They remain in charge of their respective brand companies.
The KION Group's Executive Board now has five members and is presided over by CEO Gordon Riske. CFO Dr Thomas Toepfer has also assumed responsibility for HR and been appointed as the KION Group's Labour Relations Director. Klaus Hofer, who had been in charge of human resources, has left the Company.
At the end of January 2013, KION entered into consultations with employee representatives and trade unions concerning the process of restructuring of its container handler and heavy forklift truck business. This also includes the intended closure of LMH’s plant in Merthyr Tydfil (Wales, UK). The proposed measures are intended to sustainably improve KION’s competitiveness in both areas, as well as the efficiency of its European production network.
In February 2013, the KION Group announced that Konecranes, a world-leading group of Lifting BusinessesTM, would take over certain assets from LMH’s container handling truck business. The transaction should be concluded during the second quarter of 2013. LMH will continue to offer reach stackers and empty and laden container handlers in the future, the production of which should take place at Konecranes going forward. Both companies also signed a long-term supply agreement and are working together to improve their respective international competitiveness in the container handling truck business.
In February 2013, KION Finance S.A. placed a senior secured note on the European bond market with a total volume of €650 million. The proceeds will be used to fully refinance loans that will fall due in 2014, as well as to partially refinance loans that will fall due in the following years.
The senior secured bond, which will mature in 2020, was issued in a fixed-interest tranche (6.75 per cent) in the amount of €450 million, and in a floating-rate tranche (4.5 per cent above the prevailing three-month EURIBOR rate) in the amount of €200 million.
As a result of the successful bond placement and refinancing, KION is extending the maturity profile of the Group’s financial debt until the year 2020, as well as expanding its circle of investors. In connection with the bond placement, Moody’s raised its rating outlook for KION from stable to positive. In doing so, Moody’s is reacting to KION’s positive operational performance since its initial bond placement in 2011, as well as to the reduction of its financial debt and improved strategic perspectives.
The capital increase that was resolved in 2012 in connection with Weichai Power’s 25 per cent shareholding was entered in the commercial register on 14 January 2013.

KION Holding 1 GmbH
Group management report 2012
Page 58 of 69
EXPECTED DEVELOPMENTS
Opportunities report
Recognising and seizing market, strategic and operational opportunities is an essential element of the KION’s value-driven management. To identify these opportunities, the Company systematically monitors, analyses and evaluates its relevant markets and tracks sectoral and macroeconomic trends. Strategic measures are adopted and implemented on this basis at KION. These are always aimed at profitable growth and a sustained increase in shareholder value.
KION's strengths and strategy – described in detail on pages 14 to 17 – provide the Company with considerable opportunities.
Significant market opportunities are presented, in particular, by:
• growing demand for intralogistics products and services as a consequence of globalisation
• high demand for replacement investments, especially in developed markets
• the trend towards outsourcing service functions to industrial truck manufacturers
KION's strategic opportunities result, in particular, from:
• strengthening of its market-leading position in core western European markets, especially in view of its leading technology and high proportion of customer-specific fittings;
• expansion of the service portfolio at every stage of the product lifecycle, taking advantage of the high number of trucks in use;
• harnessing of market potential in fast-growing regions, including through the strategic partnership concluded with Weichai Power in 2012
The main opportunities involving the supply of goods and services arise in connection with the optimisation of production and the leveraging of group-wide synergies. The associated cost benefits boost the Group's competitiveness.

KION Holding 1 GmbH
Group management report 2012
Page 59 of 69
Risk report
Principles of risk management
KION encounters business risks that may jeopardise its business objectives. Risk management, like opportunity management, therefore forms an integral part of the Company's day-to-day management. To ensure that the risk management systems are fully integrated into KION's overall financial planning and reporting process, they are located in the Group Accounting & Finance function.
The procedures governing the KION Group's risk management activities are laid down in internal risk guidelines. For certain types of risk, such as financial risk or risks arising from financial services, the relevant departments also have guidelines that are specifically geared to these matters and describe how to deal with inherent risks. Risk management is organised in such a way that it directly reflects the structure of the Group itself. Consequently, risk officers supported by risk managers have been appointed for each company and each division. A central Group risk manager is responsible for the implementation of risk management processes in line with procedures throughout the Group. His or her remit includes the definition and implementation of standards to ensure that risks are uniformly captured and evaluated.
The risk management process is organised on a decentralised basis. Firstly, a group-wide risk catalogue is used to capture the risks attaching to each company. Each risk must be captured individually. If the losses caused by a specific risk or the likelihood of this risk occurring exceed a defined limit, the KION Group's Executive Board and its Accounting & Finance function are notified immediately. Each risk is documented in a specially developed module within the internet-based reporting system used for the entire planning and reporting process.
The risks reported by the individual companies are combined to form divisional risk reports as part of a rigorous reporting process. To this end, minuted risk management meetings are held once a quarter. Moreover, material risks are discussed at the quarterly business review meetings. The divisional risk reports are then used to compile an overall risk portfolio for the KION Group as a whole. To support this, additional meetings are held each quarter with relevant departments of the holding company in order to identify and assess risk, above all Company-wide, cross-brand risk affecting areas such as treasury, purchasing, tax, human resources and financial services. The Executive Board of KION GROUP GmbH and the Supervisory Board's audit committee are informed of the Group's risk position at least once a quarter.
Material features of the internal control and risk management system pertaining to the (Group) accounting process
Principles
The main objectives of the special accounting-related internal control system are to avoid the risk of material misstatements in financial reporting, to identify material mismeasurement and to ensure compliance with applicable regulations and internal work instructions. There can, however, be no absolute certainty that these objectives are achieved in full and at all times.
Material processes and controls in the (Group) accounting process
For its (Group) accounting process, KION has defined suitable structures and processes within its internal control and risk management system and implemented them in the organisation. Changes to the law, accounting standards and other pronouncements are continually analysed with regard to their relevance and effect on the consolidated financial statements; the relevant changes are then incorporated into the Group's internal policies and systems.

KION Holding 1 GmbH
Group management report 2012
Page 60 of 69
Besides defined control mechanisms, this special accounting-related internal control system includes, for example, system-based and manual reconciliation processes, separation of functions, the double-checking principle and adherence to policies and instructions.
The employees involved in the Group's accounting process receive regular training in this field. Throughout the accounting process, the local companies are supported by central points of contact. The consolidated accounts are drawn up centrally using data from the consolidated subsidiaries. A consolidation department with specially trained employees carries out the consolidation activities, reconciliations and monitoring of the stipulated deadlines and processes. This team monitors the system-based controls and supplements them with manual checks. The entire accounting process contains a number of specific approval stages. Employees with the relevant expertise provide support on specialist questions and complex issues. The central Internal Audit department also checks, among other things, the reliability of the accounting work by the subsidiaries in Germany and abroad. It focuses primarily on the following aspects:
• compliance with legal requirements, directives from the Executive Board, other policies and internal instructions;
• integrity and effectiveness of the internal control systems for avoiding financial losses;
• correct performance of tasks and compliance with business principles;
• formal and material correctness of the accounting and of the financial reporting that is based on the accounting.
Market risks
Cyclical fluctuations in macroeconomic activity affect the market for industrial trucks. Customers' decisions on whether to invest, particularly in new trucks, depend to a large degree on the macroeconomic situation and conditions in their particular sector. During an economic downturn, such as the financial and economic crisis of 2008–2009, customers tend to postpone their purchases of new trucks. Although demand for services is less cyclical, it correlates with the degree of utilisation in the truck fleet – which usually declines during difficult economic periods. As KION can only adjust its fixed costs to fluctuations in demand to a limited extent, reductions in revenue impact on earnings.
Various measures aimed at making cost structures more flexible – such as the consolidation of production facilities – help to contain the earnings risk arising from reductions in revenue caused by economic conditions. Diversification of the customer base in terms of industry and region as well as expansion of service activities also play a role in mitigating risk. Moreover, KION closely monitors the market and its competitors so that it can identify market risks at an early stage and adjust its production capacities in good time.
Despite KION’s strong growth in emerging markets, the proportion of revenue it earns in the euro zone continues to be high. As a result, the market conditions that prevail in the euro zone impact significantly on KION's financial performance. Budget consolidation in affected euro-zone countries has resulted in faltering economic growth and higher unemployment. Doubts surrounding the stability of the financial system and the continued existence of the single currency have not been allayed, despite a tangible calming of the markets as a result of steps taken by the European Central Bank and politicians. These doubts are now compounded by fears about the high level of government debt in the United States and the declining pace of growth in China. Overall, these factors could reduce customers' willingness to invest and the resulting demand for KION products.
Current developments, above all in Europe, are making it increasingly difficult to gauge demand patterns reliably. The precise timing and even the extent of any change in the markets remain uncertain. KION therefore continually monitors macroeconomic and market conditions so that it can

KION Holding 1 GmbH
Group management report 2012
Page 61 of 69
react at an early stage. Besides global economic growth, KION also analyses exchange rates, price stability, the consumer and investment climate, foreign trade activity and political stability in its key sales markets.
Due to the strained financial and economic situation in the euro zone, risk management analyses its possible impact on the Group’s financial position and financial performance on an ongoing basis. In addition to continuous screening and monitoring, separate observations are regularly made in its risk reports concerning the risks surrounding the member state financial crisis.
Competition risks
The markets in which KION operates are characterised by strong competition, including with regard to prices. Although KION's strengths (see page 14) have enabled it to charge appropriate prices until now, competition risks could have a negative impact on the Group's business situation and financial performance.
Manufacturers from Asia have cost advantages in production due to the currency situation and also because local labour costs are lower. Competition is therefore very fierce, particularly in the lower price segment and in emerging markets. Building on their local competitive advantages, Asian manufacturers – especially those from China – are also looking for opportunities to expand. Although customers' high quality expectations and service needs form a barrier to growth for many of these manufacturers, this situation is likely to intensify competition in future.
It is also conceivable that competitors will join forces and their resulting greater competitiveness will be detrimental to KION's sales opportunities. Moreover, predictions of higher volumes and margins may lead to overcapacity, which would put increased pressure on prices.
Alliances, partnerships, acquisitions and other measures are playing an increasing role in improving KION's competitiveness in terms of resources, market access and product range. The steps that KION is taking to mitigate its competition risk include making its plants more efficient and securing low-cost sources of supply, for example through its strategic partnership with Weichai Power. KION also continually evaluates its options for strengthening and consolidating its position in emerging markets.
Research and development risks
KION's market position and business performance depend to a large extent on its ability to remain a leading provider of technology. This requires the Group to continually develop products that meet customer expectations and comply with changing regulatory and technological requirements. To this end, KION must anticipate customers' needs and quickly bring new products to market. If the Company does not succeed in doing this, its technological and competitive position could be compromised in the long term.
KION counteracts research and development risks by carefully managing customer relations (see page 54), focusing on customer benefits (TCO) in its product development (see page 50) and ensuring close cooperation between sales and development teams in order to continuously incorporate customer requirements into the development process.
The innovations developed by KION and its subsidiaries are comprehensively protected by intellectual property rights, in particular patents. Nevertheless, there is always the possibility that products or product components will be imitated. There is also a risk that patent applications will not be successful.

KION Holding 1 GmbH
Group management report 2012
Page 62 of 69
Strategic risks
A mainstay of KION's strategy is the exploitation of potential offered by fast-growing regions in respect of strategic partnerships, joint ventures and the acquisition of local providers. One of the risks of such alliances and acquisitions is that the expected benefits will materialise only partly or not at all. For example, the organisational integration of new units can harm financial performance for a variety of reasons. Other strategic risks arise from having inadequate experience of specific political, economic or cultural parameters in target markets and if there is a lack of attractive strategic partners or companies suitable for acquisition. It is also possible that a partner will collaborate with competitors if exclusivity agreements are not in place.
KION mitigates such strategic risks by, for example, carrying out in-depth market research, conducting thorough evaluation procedures and drafting appropriate contracts – including as part of its strategic partnership with Weichai Power.
In the course of that partnership, Weichai Power acquired the majority of KION’s hydraulics business. To build its industrial trucks, LMH requires hydraulic components that are manufactured by the affiliated company Linde Hydraulics. Because LMH is highly dependent on these components, their supply is secured by detailed contractual agreements. LMH also has access to patents and other intellectual property rights that are important to its business activities. This mitigates the risks resulting from no longer having unrestricted access to the hydraulics business.
Procurement and sales risks
Procurement activities constitute a potential risk for the KION Group in terms of the lack of availability of parts and components for logistical or qualitative reasons, and the rising cost of raw materials, energy, base products and intermediate products. As a result, there is always the possibility that KION will face backlogs in the supply of individual raw materials and components. KION obtains some of its key components, such as combustion engines, tyres, high-performance forged and electronic parts, from a limited number of core suppliers.
Although there were no substantial supply bottlenecks in 2012, the risk of supply bottlenecks – such as in the event of a shortage of raw materials – cannot be eliminated. It is also possible that suppliers will get into economic difficulty and be unable to fulfil orders. KION mitigates this risk through appropriate diversification of its supplier structure in the context of a global procurement organisation. In addition, the supplier development department, which focuses on making improvements to supplier production processes, helps suppliers to ensure the cost efficiency and qualitative excellence of their processes.
Price changes present another procurement-related risk. In 2012 only around 27 per cent of the cost of materials for new trucks was directly influenced by changes in commodity prices. Moreover, conditions on the commodity markets typically affect component prices after a delay of three to six months. KION endeavours to pass on price increases to customers but cannot always do so entirely due to market pressures.
The main sales risks – besides a drop in revenue caused by market conditions – result from dependence on individual customers and sectors. For example, it is possible that customers would postpone or cancel orders during a period of economic difficulty. Significant cancellations have not occurred in the past years, however. It is also conceivable that customers would face a liquidity shortfall and therefore be unable to fulfil their payment obligations immediately or even at all. In terms of its customer portfolio, KION is currently not particularly dependent on any individual sector. Its business is also highly diversified from a regional perspective. In addition, KION supplies companies of all sizes. The risk of possible payment defaults, which experience has shown is low for KION, can be reduced further by realising collateral.
KION Holding 1 GmbH
Group management report 2012
Page 63 of 69
Production risks
High-quality products and a high level of delivery reliability are key aspects of KION's premium positioning. Delays in delivery or a rise in the number of complaints could harm this position and, as a result, KION's financial situation.
KION's closely integrated manufacturing network presents a heightened risk to its ability to deliver goods on time in the event of operational disruptions or lengthy periods of production downtime at individual sites. To mitigate these risks, the KION Group carries out preventive maintenance, implements fire protection measures, trains its staff and builds a pool of external suppliers.
The Company has taken out a commercially appropriate level of insurance cover against loss. Quality assurance is a high priority throughout the value chain and reduces possible quality-related risks arising from the products and services provided. KION mitigates its quality-related risks significantly by applying rigorous quality standards to its development activities, conducting stringent controls throughout the process chain and maintaining close contact with customers and suppliers.
Key measures related to consolidation of the European production facilities were completed in 2012 with the closure of plants in Italy and France. However, there is a risk that further structural measures and reorganisation projects, such as the process of restructuring the container handler and heavy-duty forklift business in Merthyr Tydfil, will not be implemented in future owing to disruption of production or strikes. Furthermore, costs may also be incurred by the environmental restoration of sites that have housed production facilities for many years, for example work required due to contamination. Any damage to the environment may also lead to legal disputes and give rise to reputational risk. To mitigate these risks, KION undertakes restructuring measures only after a comprehensive planning process and works closely with employee representatives to ensure HR measures are implemented with the minimum possible social impact.
IT risks
Tight integration between the different sites and with customers and other companies means that KION also relies on its IT systems working flawlessly. KION mitigates any IT risks – which can in part arise from the consolidation of IT systems and infrastructure – by continuously working on developing a robust, expandable and flexible IT systems landscape. Internal IT resources are pooled in KION Information Management Services GmbH, which has well-established processes for portfolio management and project planning and control. Quality assurance also takes place via external independent audits. Various technical and organisational measures protect the data of KION and its Group companies against unauthorised access, misuse and loss. To that end, authorisation to access the group infrastructure is verified and logged, and a virus scanner and firewall systems are also used.
Financial risks
Despite considerable improvements in the funding situation during the year under review, the Group remains dependent on debt financing to a significant degree. This results in obligations relating to interest and capital repayments. Group Treasury is responsible for ensuring that this does not hinder international growth and that sufficient financial resources are always available for this purpose.
The main types of financial risks managed by Group Treasury, including risk from funding instruments, are liquidity, exchange-rate, interest-rate and counterparty risk. Credit risk consists solely of counterparty risks attaching to financial institutions. Risk management procedures issued by Group Treasury stipulate how to deal with the aforementioned risks. In contrast, the individual Group companies directly manage counterparty risks involving customers.
Acquisition financing as part of the Senior Facility Agreement essentially provides the Group with the flexibility needed to meet the requirements of the lending covenants. Accordingly, the KION Group has

KION Holding 1 GmbH
Group management report 2012
Page 64 of 69
secured acquisition finance in the form of committed credit lines. The individual tranches have varying maturities from the end of 2013 to 2018. During the year under review, KION significantly reduced its financial liabilities by converting a shareholder loan and receiving the contribution by Weichai Power as part of a resolution to carry out a capital increase (see pages 37 to 40). In the course of negotiating with its lenders, KION GROUP GmbH also managed to extend the due date of its existing credit facilities with a total volume of more than €1 billion. In addition, €483 million of KION’s original acquisition finance was funded by issuing a corporate bond for a total of €500 million in April 2011, which will mature in 2018.
The term of the revolving loan facility was extended considerably in the year under review (see page 37). Other steps to ensure the Company's long-term funding are also regularly pursued. As contractually agreed, the capex facility was reduced by approximately €56 million over the course of 2012.
The Company generally refers to credit ratings to manage counterparty risk when depositing funds with a financial institution. Deposits are also restricted to the limits covered by the deposit protection fund run by the Federal Association of German Banks.
KION only uses derivatives to hedge underlying operational transactions; they are not used for speculative purposes. Records are kept of the type of financial instruments used, the limits governing their use and the group of banks acting as counterparties.
Group Treasury rigorously complies with and monitors the strict separation of functions between the front, middle and back offices. Each Group company's liquidity planning is broken down by currency and incorporated into KION's financial planning and reporting process. Group Treasury checks the liquidity planning and uses it to determine the funding requirements of each company.
KION is exposed to currency risk because of the high proportion of its business conducted in currencies other than the euro. Normally, at least 50 per cent of the currency risk related to the planned operating cash flows based on liquidity planning is hedged by currency forwards in accordance with the relevant guideline. The KION Group uses interest-rate and currency-related derivatives – primarily interest-rate swaps and currency swaps – to hedge the interest-rate and currency risks arising in connection with the acquisition finance. Approximately 65 per cent of the currency risk arising from the US dollar tranche is hedged by currency forwards with an average €-US$ exchange rate of around 1.29. At the end of 2012 around 48 per cent of the interest-rate risk was hedged by interest-rate swaps. The need to add new hedging instruments or replace ones that expire is reviewed on an ongoing basis.
The funds raised for acquisitions also give rise to risks for KION in terms of compliance with certain financial covenants specified in the loan agreement. These covenants could limit the Company's flexibility with regard to its ongoing strategic development. This risk continues to apply in view of the current uncertain economic and financial market environment. However, the Company is mitigating it by continuing steadfastly with steps to boost efficiency and by ensuring sufficient flexibility when defining new lending agreements. KION complied with all the lending covenants in the reporting year.
Accounting risks arising from goodwill and the bran ds
Goodwill and the brands represented 33 per cent of total assets as at 31 December 2012 (31 December 2011: 35 per cent). Pursuant to IFRS, these assets are not amortised and their measurement depends, above all, on future expectations. If these future expectations are not fulfilled, there is a risk that impairment losses will have to be recognised on these assets.

KION Holding 1 GmbH
Group management report 2012
Page 65 of 69
Risks from financial services
The funding terms and conditions faced by the lenders themselves (manifested, for example, in the payment of liquidity premiums on interbank lending) may result in a future shortage of lines of credit and/or increased financing costs for companies. However, the Group currently does not expect any further changes in its lines of credit or any excessive increases in margins. KION's leasing activities mean that it may be exposed to residual value risks from the marketing of trucks that are returned by the lessee at the end of a long-term lease and subsequently sold or re-leased. Residual values in the markets for used trucks are therefore constantly monitored and forecast. KION regularly assesses its overall risk position arising from financial services.
The risks identified are immediately taken into account by the Company in the costing of new leases by recognising writedowns or valuation allowances and adjusting the residual values. Risk-mitigating factors include the demand for used trucks, which stabilises the residual values of KION's industrial trucks. The majority of the residual values have underlying remarketing agreements that transfer any residual-value risk to the leasing company. This had a positive impact on the 2012 financial results. Group-wide standards to ensure that residual values are calculated conservatively, combined with an IT system for residual-value risk management, reduce risk and provide the basis on which to create the transparency required.
KION mitigates its liquidity risk and interest-rate risk by ensuring that most of its transactions and funding loans have matching maturities. Long-term leases are primarily based on fixed-interest agreements. The credit facilities provided by various banks ensure that the Group has sufficient liquidity. Moreover, KION offers the majority of financial services indirectly via selected financing partners that bear the risks of the finance transaction. In order to exclude exchange-rate risk, KION generally funds its leasing business in the local currency used in each market.
Because of low default rates, counterparty risk has not been significant to date in the KION Group. The Group has not identified any material changes between 2011 and 2012. KION also mitigates any losses from defaults by its receipt of the proceeds from the sale of repossessed trucks. It also primarily offers financial services indirectly via selected financing partners, and KION bears the counterparty risk in under 5 per cent of cases. The credit risk management system was updated during 2012 in preparation for the pooling of financial services activities in a separate segment. In particular, this involved revising the regulations concerning the process organisation as well as processes for risk management and control.
Human resources risks
KION relies on having highly qualified managers and experts in key roles. If they left, it could have a long-term adverse impact on the Group's prospects.
That is why KION actively engages in HR work aimed at identifying and developing young professionals with high potential who already work for the Company and retaining them over the long term, thereby enabling succession planning for key roles across the Group. KION also positions itself in the external market as an employer of choice. This will enable it to make strategic additions to its portfolio of existing staff and, in this way, avert the risk of possibly losing expertise and thereby becoming less competitive.
The relocation of production and other restructuring measures may result in a risk of strikes and reactions of other kinds by the workforce. As demonstrated several times in the past, this risk is contained by collaborating closely with employee representatives, and, if job losses are necessary, taking comprehensive steps to ensure they are achieved with the minimum possible social impact.

KION Holding 1 GmbH
Group management report 2012
Page 66 of 69
Legal risks
The legal risks arising from KION's business are typical of those faced by any company operating in this sector. The Group companies are a party in a number of pending lawsuits in various countries. The individual companies cannot assume with any degree of certainty that it will win any of the lawsuits or that the existing risk provision in the form of insurance or provisions will be sufficient in each individual case. However, the KION Group is not expecting any of these existing legal proceedings to have a material impact on its financial position or financial performance. These lawsuits relate, among other things, to liability risks, especially as a result of legal action brought by third parties because, for example, the Company's products were allegedly faulty or the Company allegedly failed to comply with contractual obligations.
The KION Group has taken measures to prevent it from incurring financial losses as a result of these risks. Although legal disputes with third parties have been insignificant both currently and in the past, the Company has a centralised reporting system to record and assist pending lawsuits. In addition to the high quality and safety standards applicable to all users of the Company's products, with which it complies when it develops and manufactures the products, it has also taken out the usual types of insurance to cover any third-party claims. These issues are also tackled by teams whose members come from a variety of functions. The aim of the teams is to identify and minimise risks, for example the risks arising from inadequate contractual arrangements. A further objective of this cooperation across functions is to ensure compliance with mandatory laws, regulations and contractual arrangements at all times.
External risks
External risks arise as a result of constant changes in the Company's political, legal and social environment. Because it operates in countries in which the political or legal situation is uncertain, KION is exposed to the consequent risk of government regulation, capital controls and expropriations. Although fairly unlikely, natural disasters and terrorist attacks constitute a further risk to KION's financial position and financial performance.
Aggregate risk
In 2012 KION continuously analysed the risks arising, in particular, from the financial crisis and the performance of the real economy in addition to its normal quarterly risk reporting. Particular attention was paid to the potential impact of financial instability in some economies and financial institutions in the context of the sovereign debt crisis in the euro zone. As far as possible, risk prevention measures were initiated at an early stage where risks were identified.
As conditions in the financial markets eased in the second half of 2012 and global growth is expected to pick up slightly in 2013, KION is acting under the assumption that the economic environment will be somewhat more favourable in 2013 than in the year under review. The situation in the global markets remains challenging, however. Uncertainties in the euro zone, the high level of government debt in the United States and comparatively muted growth prospects in the developed markets all continue to pose a substantial threat to growth.
As things stand at present, there are no indications of any risks that could jeopardise the Company's continuation as a going concern.

KION Holding 1 GmbH
Group management report 2012
Page 67 of 69
Outlook
The forward-looking statements and information given below are based on the Company's current expectations and assessments. Consequently, they involve a number of risks and uncertainties. Many factors, several of which are beyond the control of KION, affect the Group's business activities and profitability. Any unexpected developments in the global economy would result in the KION Group's performance and profits differing significantly from those forecast below. KION does not undertake to update forward-looking statements to reflect subsequently occurring events or circumstances. Furthermore, KION cannot guarantee that future performance and actual results will be consistent with the stated assumptions and estimates and can accept no liability in this regard.
Expected macroeconomic conditions
According to estimates made by the International Monetary Fund (IMF), global economic growth may pick up slightly in 2013, amounting to 3.5 per cent (2012 estimate: 3.2 per cent). The purchasing managers’ index (PMI) also signals a slight economic recovery. Growth prospects are better in particular for emerging markets such as Brazil and China, which could provide considerable stimulus for European exports. The outlook for the euro zone still assumes slightly negative growth, however. On the other hand, an economic upturn is anticipated in the euro zone beginning in 2014, which could also provide additional momentum to the growth anticipated globally.
Global growth will be fuelled, above all, by a rise in capital expenditure, whereas consumer spending may only increase to a small extent. The IMF predicts that the volume of global trade will grow more robustly than it did in 2012. It also anticipates a moderate fall in commodity prices.
Overall, therefore, economic conditions may already be somewhat more benign in 2013 than in the year under review. However, this forecast is based on the assumption that monetary and fiscal policy will support the global economy. There are also considerable risks resulting, in particular, from the sovereign debt problems in the euro zone and the United States, consolidation and tightening of public finances as well as a possible destabilisation of the financial markets.
Expected sectoral conditions
The overall market for industrial trucks will continue to depend heavily on economic conditions in key sales markets, with the level of capital investment and the growth in global trade being particularly crucial. Whereas the global market for industrial trucks in 2012 was around 3 per cent down on the record level achieved in 2011, KION expects demand to recover slightly in 2013 as well as in the following year. China, other Asian countries and eastern Europe are likely to be the main growth engines in the market. Stable demand is expected in western Europe, fuelled predominantly by the in some cases overdue replacement of old trucks.
Market expectations are also positive from a longer-term perspective. Based on current macroeconomic forecasts and in view of past market performance, KION predicts an average annual growth rate of about 4 per cent for the next five years, which should not involve any significant shifts of the shares of the individual product segments in total revenue.
Expected business situation and financial performan ce
In 2012 KION laid the foundations for continued profitable growth in subsequent years. Drawing on its multi-brand strategy and the successive expansion of its service business, the Group intends to tap the potential offered by the developed markets of western Europe and the emerging markets. A continuing high level of capital investment and research and development spending serve to preserve the technological leadership of LMH and STILL, and ensure their continued position as premium brands.

KION Holding 1 GmbH
Group management report 2012
Page 68 of 69
Adjusted Group revenue is expected to be higher in 2013 than in 2012. KION anticipates that the new truck business will initially grow at a faster rate than the service business in 2013 because of the strong demand for replacement investment – as a result of the investment backlog from the financial crisis – and due to increasing product sales in Asia and Latin America. Once pent-up capital investment has been exhausted, KION expects that the next few years will see above-average growth of the service business due to the large number of trucks that already exist on the market. The service business is expected to contribute around 40 per cent of consolidated revenue.
The emerging markets are predicted to again be a significant factor in the growth of revenue. In this context, the partnership with Weichai Power is expected to have a positive impact in the Chinese and Asian markets as early as 2013, leading to intensified sales activities in these markets. Additional options, such as consolidating the forklift business in China, are currently being examined. Unit sales in Latin America are forecast to rise on the back of increased production capacity and intensified sales activities. The service network in western and eastern Europe, which was expanded in 2012, is intended to make a considerable contribution to growth also in the new truck business.
Similar to the Group as a whole, the two segments LMH and STILL are aiming for a moderate rise in revenue in 2013. Following the deconsolidation of the hydraulics business, LMH intends to increase its volume of business in all key sales regions, with above-average revenue growth in Asia and other growth markets. STILL expects to generate growth in Latin America and eastern Europe. Moreover, sales in 2012 were also impaired by shifts in production. Adjusted EBIT is expected to improve moderately in both segments. KION forecasts a further rise in the volume of leasing in the FS segment, accompanied by almost unchanged EBT. As in 2012 this business will be concentrated in western Europe.
The good market position of the brands, the broad product portfolio, high market share in the core markets in Germany and France, good positioning in growth markets, growing service business, the measures taken towards a more flexible cost structure as well as economies of scale should all contribute to moderately improving the adjusted EBIT margin in 2013 as well. It will also be positively influenced by the consolidation of the European production facilities, which was largely completed in 2012. The higher proportion of procurement in emerging markets, which will be supported by the partnership with Weichai Power, should have a positive effect on earnings by as early as 2013.
The consolidated result for 2012 was influenced by positive one-off items that will not occur again to the same extent. For 2013, however, slightly positive consolidated net income is expected, which should also reflect the reduction of debt.
In 2014, KION anticipates further moderate revenue growth, slightly improved adjusted EBIT, and continued positive net income, all on the back of even more buoyant global economic growth.
Expected financial position
KION significantly improved its financial position in 2012, particularly owing to the investment of Weichai Power. As a result of the successful issue of the corporate bond in February 2013 (see page 57), the debt maturity structure has also been extended. All in all, KION has significantly expanded its financial flexibility and possesses a sound foundation for its course of growth.
The Company will continue to reduce debt levels while at the same time optimising the funding structure. No specific steps were being planned at the time this group management report was compiled.

KION Holding 1 GmbH
Group management report 2012
Page 69 of 69
Wiesbaden, 13 March 2013 The Executive Board Gordon Riske Bert-Jan Knoef Theodor Maurer Ching Pong Quek Dr Thomas Toepfer

KION HOLDING 1 GmbH Wiesbaden
Consolidated Financial Statements 31 December 2012

KION Holding 1 GmbH Consolidated statement of income for the year ended 31 December 2012
Consolidated income statement
€ thousand Note 2012 2011
Revenue [9] 4,726,664 4,368,395Cost of sales -3,429,914 -3,256,378
Gross profit 1,296,750 1,112,017
Selling expenses -562,404 -520,547 Research and development costs -124,454 -119,526 Administrative expenses -313,190 -283,322 Other income [10] 294,374 81,503Other expenses [11] -59,530 -70,043 Profit from at-equity investments [12] 15,912 11,192Other financial result [13] 2,655 1,886
Earnings before interest and taxes 550,113 213,160
Financial income [14] 62,084 73,664Financial expense [15] -301,569 -345,709
Financial result -239,485 -272,045
Earnings before taxes 310,628 -58,885
Income taxes [16] -149,540 -34,041 Current taxes -122,137 -49,349 Deferred taxes -27,403 15,308
Net income (loss) 161,088 -92,926 Attributable to shareholders of KION Holding 1 GmbH 159,008 -95,093 Attributable to non-controlling interests 2,080 2,167

KION Holding 1 GmbH Consolidated statement of comprehensive income for the year ended 31 December 2012
Consolidated statement of comprehensive income
€ thousand 2012 2011
Net income (loss) 161,088 -92,926
Impact of exchange differences 2,765 6,476 thereof changes in unrealised gains and losses 2,755 6,476 thereof realised gains and losses 10 0
Gains/losses on employee benefits -151,311 8,394 thereof changes in unrealised gains and losses -214,109 13,995 thereof tax effect 62,798 -5,601
Gains/losses on cash flow hedges 6,074 -8,149 thereof changes in unrealised gains and losses 27,312 7,071 thereof realised gains and losses -19,662 -18,452 thereof tax effect -1,576 3,232
Gains/losses from at-equity investments -26 532 thereof changes in unrealised gains and losses -26 532
Other comprehensive loss (income) -142,498 7,253
Total comprehensive income (loss) 18,590 -85,673
Comprehensive income (loss) Attributable to shareholders of KION Holding 1 GmbH 16,554 -87,840 Attributable to non-controlling interests 2,036 2,167
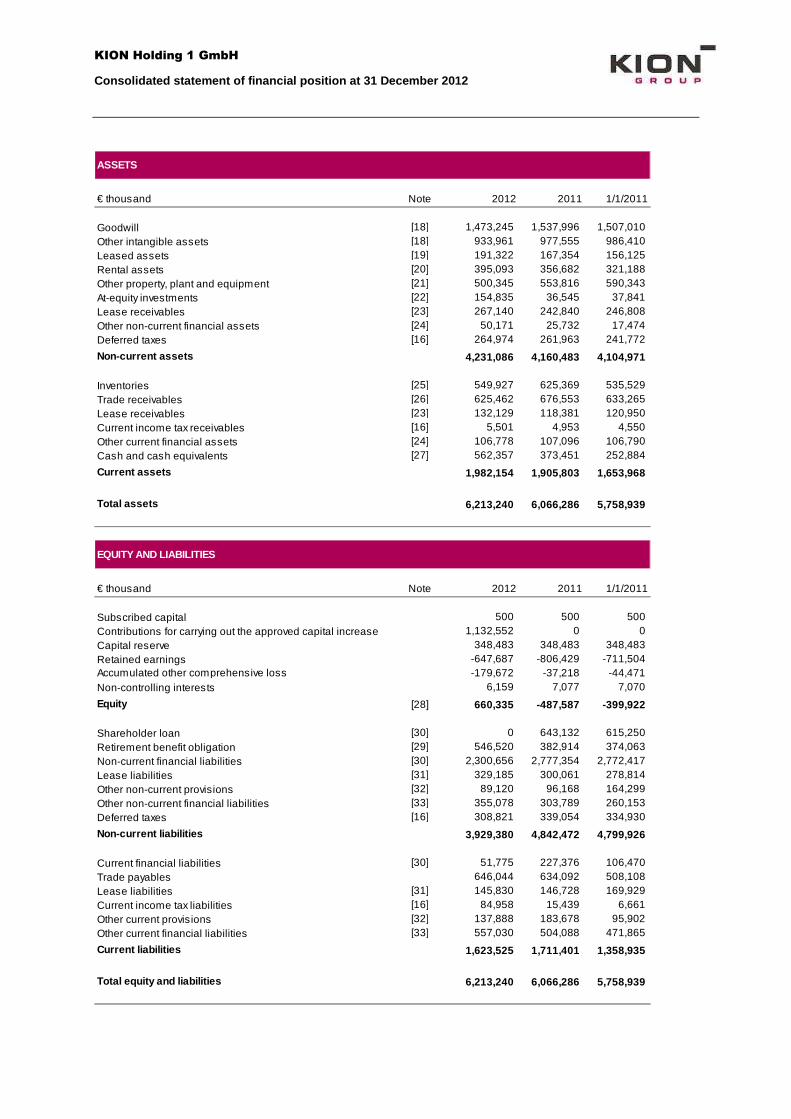
KION Holding 1 GmbH Consolidated statement of financial position at 31 December 2012
ASSETS
€ thousand Note 2012 2011 1/1/2011
Goodwill [18] 1,473,245 1,537,996 1,507,010Other intangible assets [18] 933,961 977,555 986,410Leased assets [19] 191,322 167,354 156,125Rental assets [20] 395,093 356,682 321,188Other property, plant and equipment [21] 500,345 553,816 590,343At-equity investments [22] 154,835 36,545 37,841Lease receivables [23] 267,140 242,840 246,808Other non-current financial assets [24] 50,171 25,732 17,474Deferred taxes [16] 264,974 261,963 241,772
Non-current assets 4,231,086 4,160,483 4,104,971
Inventories [25] 549,927 625,369 535,529Trade receivables [26] 625,462 676,553 633,265Lease receivables [23] 132,129 118,381 120,950Current income tax receivables [16] 5,501 4,953 4,550Other current financial assets [24] 106,778 107,096 106,790Cash and cash equivalents [27] 562,357 373,451 252,884
Current assets 1,982,154 1,905,803 1,653,968
Total assets 6,213,240 6,066,286 5,758,939
EQUITY AND LIABILITIES
€ thousand Note 2012 2011 1/1/2011
Subscribed capital 500 500 5001,132,552 0 0
Capital reserve 348,483 348,483 348,483Retained earnings -647,687 -806,429 -711,504 Accumulated other comprehensive loss -179,672 -37,218 -44,471 Non-controlling interests 6,159 7,077 7,070
Equity [28] 660,335 -487,587 -399,922
Shareholder loan [30] 0 643,132 615,250Retirement benefit obligation [29] 546,520 382,914 374,063Non-current financial liabilities [30] 2,300,656 2,777,354 2,772,417Lease liabilities [31] 329,185 300,061 278,814Other non-current provisions [32] 89,120 96,168 164,299Other non-current financial liabilities [33] 355,078 303,789 260,153Deferred taxes [16] 308,821 339,054 334,930
Non-current liabilities 3,929,380 4,842,472 4,799,926
Current financial liabilities [30] 51,775 227,376 106,470Trade payables 646,044 634,092 508,108Lease liabilities [31] 145,830 146,728 169,929Current income tax liabilities [16] 84,958 15,439 6,661Other current provisions [32] 137,888 183,678 95,902Other current financial liabilities [33] 557,030 504,088 471,865
Current liabilities 1,623,525 1,711,401 1,358,935
Total equity and liabilities 6,213,240 6,066,286 5,758,939
Contributions for carrying out the approved capital increase

KION Holding 1 GmbH Consolidated statement of cash flows for the year ended 31 December 2012
Consolidated statement of cash flows
€ thousand 2012 2011
Net income (loss) 161,088 -92,926 + income taxes 149,540 34,041+ financial result 239,485 272,045
= Earnings before interest and taxes 550,113 213,160
184,042 192,068Depreciation/Impairment of leased assets and rental assets 181,227 163,953Other non-cash income (-) and expenses (+) -142,530 9,943Gains (-) / losses (+) on disposal of non-current assets -103,814 6,428Change in leased assets and rental assets -245,764 -208,691
24,592 26,056Change in inventories 20,513 -75,242 Change in trade receivables 56,850 -36,829 Change in trade payables -3,928 114,886Cash payments for defined benefit obligations -23,311 -21,038 Change in other provisions -39,884 13,989Change in other operating assets -26,686 334Change in other operating liabilities 37,020 30,346Taxes paid -54,432 -42,553
= Cash flow from operating activities 414,008 386,810
Cash receipts from disposal of non-current assets 7,353 3,408Cash payments for purchase of non-current assets -155,101 -133,005 Deposits from other loan claims -5,510 2,879Dividends received 5,317 6,599Interest income received 4,488 3,397Acquisitions of subsidiaries, net of cash acquired -9,703 -32,916
259,746 0Cash payments (-) for sundry assets -2,538 -2,942
= Cash flow from investing activities 104,052 -152,580
Dividends paid to non-controlling interests -2,405 -2,209 Cash paid for increased ownership interests (after control) -10,373 -1,461 Cash proceeds from sale of ownership interests (after control) 138 82
467,000 0Proceeds from borrowings 7,676 632,691Loan financing costs paid -14,549 -24,579
-1,095 0Repayment of borrowings -664,577 -537,018 Proceeds (+) / Repayment (-) of other capital borrowings -2,723 -21,052 Cash receipts (+) / cash payments (-) for forward foreign exchange hedging contracts 20,490 -13,714 Interest paid -129,712 -147,455
= Cash flow from financing activities -330,130 -114,715
Effect of foreign exchange rate changes on cash and cash equivalents 976 1,052
188,906 120,567
Cash and cash equivalents at the beginning of the year 373,451 252,884Cash and cash equivalents at the end of the year 562,357 373,451
Amortisation, depreciation and impairment charges of non-current assets (excl. leased assets and rental assets)
Change in lease receivables, lease liabilities and liabilities from finance leases
Cash proceeds from sale of entities (excl. cash and cash equivalents)
Contributions for carrying out the approved capital increase
Transactions costs for carrying out the approved capital increase
= Change in cash and cash equivalents

KION Holding 1 GmbH Consolidated statement of changes in equity for the year ended 31 December 2012
Consolidated statement of changes in equity
€ thousand
Subscribed capital
Contributions for carrying out the
approved capital increase
Capital reserves
Retained earnings
Cumulative translation adjustment
Gains/losses on defined
benefit obligation
Gains/losses on Cash Flow
Hedges
Gains/losses from equity investments
Non-controll ing interests
Total
Balance as at 1/1/2011 500 348,483 -711,504 -42,025 12,498 -14,819 -125 -406,992 7,070 -399,922
Net loss -95,093 -95,093 2,167 -92,926
Other comprehensive income (loss) 6,476 8,394 -8,149 532 7,253 7,253
Comprehensive loss -95,093 6,476 8,394 -8,149 532 -87,840 2,167 -85,673
Dividends -2,209 -2,209
Other Changes 168 168 49 217
Balance as at 31/12/2011 500 348,483 -806,429 -35,549 20,892 -22,968 407 -494,664 7,077 -487,587
Balance as at 1/1/2012 500 348,483 -806,429 -35,549 20,892 -22,968 407 -494,664 7,077 -487,587
Net income 159,008 159,008 2,080 161,088
Other comprehensive income (loss) 2,765 -151,267 6,074 -26 -142,454 -44 -142,498
Comprehensive income 159,008 2,765 -151,267 6,074 -26 16,554 2,036 18,590
Contributions for carrying out the approved capital increase 1,137,784 1,137,784 1,137,784
Transaction costs -5,232 -5,232 -5,232
Dividends -2,405 -2,405
Effects on the acquisition / disposal of non-controlling interests -425 -425 -549 -974 Other changes 159 159 159
Balance as at 31/12/2012 500 1,132,552 348,483 -647,687 -32,784 -130,375 -16,894 381 654,176 6,159 660,335
Accumulated other comprehensive income (loss)
Total equity attributable to shareholders
KION Holding 1 GmbH Notes to the consolidated financial statements for the year ended 31 December 2012
Page 1 of 88
Notes to the consolidated financial statements of KION Holding 1 GmbH for the year ended 31 December 2012
Basis of presentation
[ 1 ] General information on the Company
KION Holding 1 GmbH, whose registered office is at Abraham-Lincoln-Strasse 21, 65189 Wiesbaden, is the
parent company of the KION Group in Germany. KION Holding 1 GmbH was formed with articles of association dated 24 October 2006, and entered in the commercial register at the Wiesbaden Local Court under reference HRB 22785 on 21 February 2007. The parent company of KION Holding 1 GmbH is Superlift Holding S.à r.l.,
Luxembourg. The KION Group is a leading global supplier of industrial trucks (forklift trucks and warehouse trucks). It generat-
ed revenue of €4,726,664 thousand in the financial year 2012 from its Linde, Fenwick, STILL, OM-STILL, Baoli and Voltas brands (2011: €4,368,395 thousand).
The consolidated financial statements and the group management report were prepared by the Executive Board of KION Holding 1 GmbH on 13 March 2013.
[ 2 ] Basis of preparation
The consolidated financial statements of the KION Group for the financial year ended 31 December 2012 have been prepared in accordance with section 315a of the German Commercial Code (HGB) which requires the application of International Financial Reporting Standards (IFRSs) of the International Accounting Standards
Board (IASB) applicable as at the reporting date as well as the associated interpretations (IFRICs) of the IFRS Interpretations Committee (IFRS IC) as adopted by the European Union in accordance with Regulation (EC) No. 1606/2002 of the European Parliament and of the Council concerning the application of international accounting
standards. All of the IFRSs and IFRICs that were issued by the reporting date and that were required to be ap-plied in the financial year 2012 have been applied in preparation of the consolidated financial statements.
Financial reporting standards adopted for the first time in the financial year under review :
The following financial reporting standard was adopted for the first time in 2012: • Amendments to IFRS 7 'Financial Instruments: Disclosures': disclosures relating to transfers of financial
assets The first-time adoption of this standard has had no significant effect on the presentation of the financial position or
financial performance of the KION Group.

KION Holding 1 GmbH Notes to the consolidated financial statements for the year ended 31 December 2012
Page 2 of 88
Financial reporting standards issued but not yet ad opted
In the consolidated financial statements for the year ended 31 December 2012 the KION Group has not applied the following standards and interpretations, which have been issued by the IASB but are not yet required to be
adopted in 2012: • Amendments to IFRS 1 'First-time Adoption of International Financial Reporting Standards': amendments
relating to fixed transition dates and severe hyperinflation • Amendments to IFRS 1 'First-time Adoption of International Financial Reporting Standards': amendments
relating to government loans with a below-market rate of interest
• Amendments to IFRS 7 'Financial Instruments: Disclosures': offsetting of financial assets and financial liabili-ties
• Amendments to IFRS 7 'Financial Instruments: Disclosures': disclosures about the transition to IFRS 9 'Fi-
nancial Instruments' • IFRS 9 'Financial Instruments' • Amendments to IFRS 9 'Financial Instruments': mandatory effective date;
• IFRS 10 'Consolidated Financial Statements' • Amendments to IFRS 10 'Consolidated Financial Statements': amendments relating to the consolidation of
investment entities
• IFRS 11 'Joint Arrangements' • IFRS 12 'Disclosure of Interests in Other Entities' • Amendments to IFRS 12 'Disclosure of Interests in Other Entities': amendments relating to the consolidation
of investment entities • Transition Guidance (Amendments to IFRS 10, IFRS 11 and IFRS 12) • IFRS 13 'Fair Value Measurement'
• Amendments to IAS 1 'Presentation of Financial Statements': amendments relating to the presentation of items of other comprehensive income
• Amendments to IAS 12 'Income Taxes': limited amendment to IAS 12 relating to the recovery of underlying
assets • IAS 19R 'Employee Benefits' • IAS 27R 'Separate Financial Statements'
• Amendments to IAS 27 'Separate Financial Statements': amendments relating to the consolidation of invest-ment entities
• IAS 28R 'Investments in Associates and Joint Ventures'
• Amendments to IAS 32 'Financial Instruments: Presentation': offsetting of financial assets and financial liabilities
• IFRIC 20 'Stripping Costs in the Production Phase of a Surface Mine'
• Improvements to IFRSs (2009-2011). These standards and interpretations will be applied by the companies included in the KION Group from the date
on which they must be adopted for the first time. The transitional requirements of the revised IAS 19R 'Employee Benefits' require retrospective application. In the
KION Group, actuarial gains and losses, in consideration of deferred taxes, are already recognised in other com-prehensive income (loss). The Management expects that first-time adoption of the revised IAS 19 for the financial year 2013 will increase net income (after income taxes) by €1,030 thousand and decrease other comprehensive
income (after deferred taxes) by €983 thousand due to the alignment of the expected return on plan assets with the discount rate for 2012. The retrospective recognition of previously unrecognised past service cost will result in a reduction of retained earnings by €749 thousand as of 1 January 2012.

KION Holding 1 GmbH Notes to the consolidated financial statements for the year ended 31 December 2012
Page 3 of 88
The impact of the first-time adoption of IFRS 10 'Consolidated Financial Statements' is currently still being evalu-ated, but we currently do not anticipate any material effects. The effects of the first-time adoption of the other standards and interpretations on the financial position and financial performance of the KION Group are expected
to be insignificant. The various amendments issued in May 2012 as part of the annual improvement project mainly relate to termino-
logical and editorial aspects. They are not expected to have any significant effect on the presentation of the financial position and financial performance.
In order to improve the clarity of presentation, certain items are aggregated on the face of the statement of finan-cial position and the income statement. The items concerned are presented and disclosed in the notes. Assets and liabilities are classified into current and non-current items in accordance with IAS 1.60. The consolidated
income statement is prepared in accordance with the cost of sales (function-of-expense) method. The reporting currency is the euro. All amounts are disclosed in thousands of euros (€ thousand) unless stated
otherwise. The rounding of amounts added together may result in rounding differences of +/- €1 thousand in the corresponding totals. The separate financial statements included in the consolidation were prepared at the same reporting date as the annual financial statements of KION Holding 1 GmbH.
[ 3 ] Principles of consolidation
Acquisitions are accounted for using the acquisition method. In accordance with IFRS 3R, the identifiable assets and the liabilities assumed on the acquisition date are recognised separately from goodwill, irrespective of the
extent of any non-controlling interests. The identifiable assets acquired and the liabilities assumed are measured at their fair value.
The amount recognised as goodwill is calculated as the amount by which the sum of the consideration trans-ferred, the amount of non-controlling interests in the acquiree and the fair value of all previously held equity inter-est at the acquisition-date exceeds the fair value of the group's interest in the acquiree's net assets. If the consid-
eration transferred is lower than the fair value of the acquiree's net assets, the difference is recognised as a gain. For each acquisition, the group decides on a case-by-case basis whether the non-controlling interest in the ac-
quiree is recognised at fair value or as the present proportion of the net assets of the acquiree. The option to recognise non-controlling interests at fair value is currently not used. As a result, non-controlling interests are recognised at the proportionate share of the fair value of the net assets attributable to them excluding goodwill.
For business contributions achieved in stages, previously held equity interests are recognised at their fair value on the acquisition-date. The difference between their carrying amount and fair value is recognised in the consoli-
dated income statement. For the purpose of impairment testing, goodwill is allocated to cash-generating units that are likely to benefit from
the business combination. Transaction costs are immediately recognised in the income statement. Contingent consideration elements are
included at fair value at the acquisition-date when determining the consideration transferred. Contingent consid-eration elements may consist of equity instruments or financial liabilities. Depending on the classification, changes in their fair value are reflected in subsequent measurements.

KION Holding 1 GmbH Notes to the consolidated financial statements for the year ended 31 December 2012
Page 4 of 88
The consolidated financial statements include all of the parent company's subsidiaries. Intragroup balances, transactions, income and expenses, and gains and losses on intercompany transactions are completely eliminat-ed. Deferred taxes are recognised on temporary tax differences resulting from consolidation entries.
Transactions with non-controlling interests are treated as transactions with the Group's equity investors. Differ-ences between the consideration paid for the acquisition of a non-controlling interest and the relevant proportion
of the carrying amount of the subsidiary's net assets are recognised in other comprehensive income. Gains and losses arising from the sale of non-controlling interests are also recognised in other comprehensive income, provided there is no change in control.
Associates and joint ventures that are material to the financial position and financial performance of the KION Group are accounted for using the equity method.
[ 4 ] Basis of consolidation
KION Holding 1 GmbH's equity investments include subsidiaries, joint ventures, associates and financial invest-ments.
In addition to KION Holding 1 GmbH, the consolidated financial statements of the KION Group include all material subsidiaries in which KION Holding 1 GmbH holds a majority of the voting rights, either directly or indirectly, and
which it exercises control i.e. has the power to govern the financial and operating policies of the entity so as to obtain benefits from its activities. Subsidiaries acquired in the course of the financial year are consolidated from the date at which control is transferred, i.e. the date from which it is possible to govern their financial and operat-
ing policies so as to obtain benefits. Companies sold in the course of the financial year are deconsolidated from the date on which control is lost.
A joint venture is an equity interest in which the entity is jointly managed by companies in the KION Group and one or more partners. Joint control differs from significant influence insofar as it is governed by a contractual agreement.
Associates are entities in which companies in the KION Group are able to exercise significant influence, either directly or indirectly, over the financial and operating policies of the entity concerned. Significant influence is
generally presumed to exist when KION Holding 1 GmbH holds between 20 per cent and 50 per cent of the voting rights.
All other equity interests over which KION Holding 1 GmbH is unable to exercise control or a significant influence, or that are not jointly controlled by KION Holding 1 GmbH are classified as financial investments and are not consolidated.

KION Holding 1 GmbH Notes to the consolidated financial statements for the year ended 31 December 2012
Page 5 of 88
The following table shows the number of equity investments broken down by category:
A total of 19 German and 79 foreign subsidiaries were consolidated in addition to KION Holding 1 GmbH as at 31 December 2012. Following the separation of financial services operations into separate entities, six financial
services companies were consolidated as part of the KION Group for the first time in January 2012 because they had become more financially significant (additions, consolidated subsidiaries). Previously, these companies had been reported at cost and are therefore reported as disposals of investments recorded at cost. In addition, a new
company, KION South Asia Pte. Ltd., Singapore, Singapore, was founded in July 2012. Information about other acquisitions can be found in note [ 5 ] while information about disposals are provided in notes [ 6 ] and [ 13 ].
Ten joint ventures and associates were accounted for under the equity method as at 31 December 2012 (31 December 2011: eleven). In each case, measurement under the equity method was performed on the basis of the last available annual financial statements. The addition relates to the non-controlling interest held in Linde Hy-
draulics GmbH & Co. KG. 39 (2011: 70) companies with minimal business volumes or no business operations were not included in the
consolidation. The unconsolidated subsidiaries and the associates not accounted for using the equity method are not material to the financial position and financial performance of the KION Group, both individually and as a whole.
Shareholdings by categories
1/1/2012 Addtions Disposals 31/12/2012
Consolidated subsidiaries 93 9 4 98 Domestic 17 2 − 19 Foreign 76 7 4 79
11 1 2 10 Domestic 7 1 − 8 Foreign 4 − 2 2
70 12 43 39 Domestic 16 4 13 7 Foreign 54 8 30 32
At-equity investments in Joint Ventures and Associa tes
Subsidiaries and financial investmentsrecorded at cost
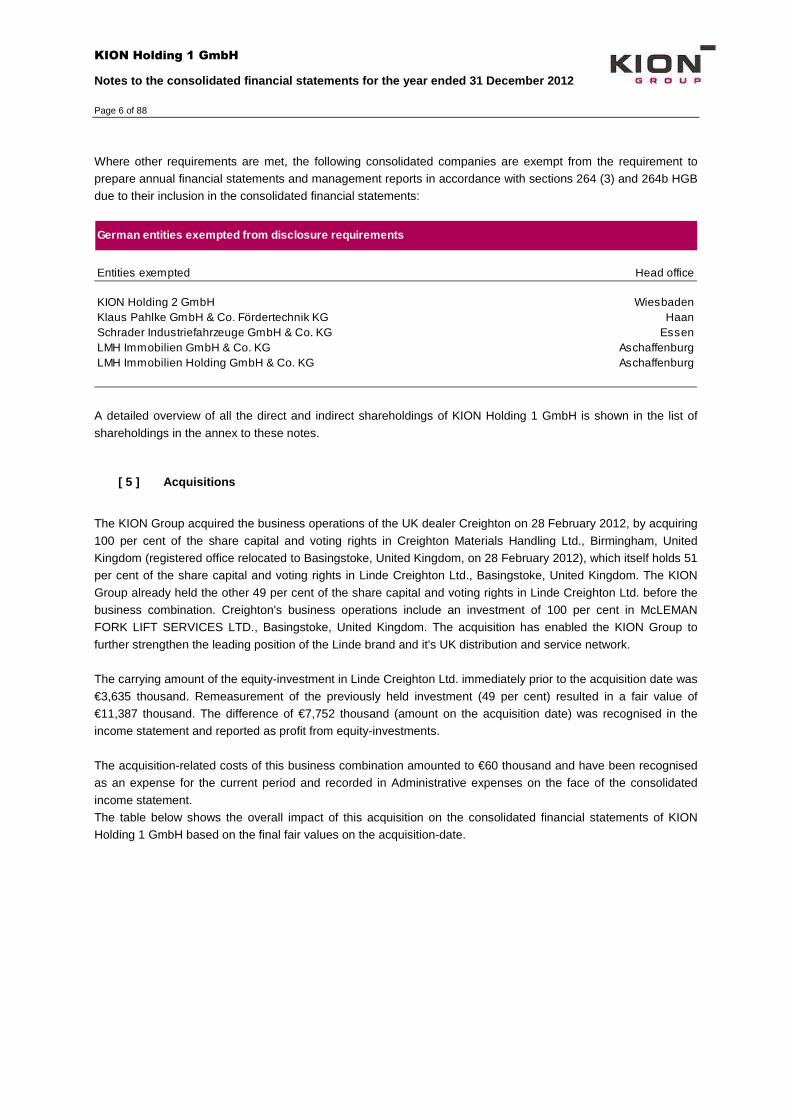
KION Holding 1 GmbH Notes to the consolidated financial statements for the year ended 31 December 2012
Page 6 of 88
Where other requirements are met, the following consolidated companies are exempt from the requirement to prepare annual financial statements and management reports in accordance with sections 264 (3) and 264b HGB due to their inclusion in the consolidated financial statements:
A detailed overview of all the direct and indirect shareholdings of KION Holding 1 GmbH is shown in the list of
shareholdings in the annex to these notes.
[ 5 ] Acquisitions
The KION Group acquired the business operations of the UK dealer Creighton on 28 February 2012, by acquiring
100 per cent of the share capital and voting rights in Creighton Materials Handling Ltd., Birmingham, United Kingdom (registered office relocated to Basingstoke, United Kingdom, on 28 February 2012), which itself holds 51 per cent of the share capital and voting rights in Linde Creighton Ltd., Basingstoke, United Kingdom. The KION
Group already held the other 49 per cent of the share capital and voting rights in Linde Creighton Ltd. before the business combination. Creighton's business operations include an investment of 100 per cent in McLEMAN FORK LIFT SERVICES LTD., Basingstoke, United Kingdom. The acquisition has enabled the KION Group to
further strengthen the leading position of the Linde brand and it's UK distribution and service network. The carrying amount of the equity-investment in Linde Creighton Ltd. immediately prior to the acquisition date was
€3,635 thousand. Remeasurement of the previously held investment (49 per cent) resulted in a fair value of €11,387 thousand. The difference of €7,752 thousand (amount on the acquisition date) was recognised in the income statement and reported as profit from equity-investments.
The acquisition-related costs of this business combination amounted to €60 thousand and have been recognised as an expense for the current period and recorded in Administrative expenses on the face of the consolidated
income statement. The table below shows the overall impact of this acquisition on the consolidated financial statements of KION Holding 1 GmbH based on the final fair values on the acquisition-date.
German entities exempted from disclosure requiremen ts
Entities exempted Head office
KION Holding 2 GmbH WiesbadenKlaus Pahlke GmbH & Co. Fördertechnik KG HaanSchrader Industriefahrzeuge GmbH & Co. KG EssenLMH Immobilien GmbH & Co. KG AschaffenburgLMH Immobilien Holding GmbH & Co. KG Aschaffenburg

KION Holding 1 GmbH Notes to the consolidated financial statements for the year ended 31 December 2012
Page 7 of 88
The gross amounts of the receivables acquired as part of this transaction, which are exclusively trade receivables, totalled €8,183 thousand. At the acquisition date it was estimated that €147 thousand of these trade receivables
were irrecoverable. Revenue rose by €50,076 thousand as a result of the acquisition. The net income (loss) reported for 2012 contains a profit of €1,382 thousand attributable to the entity acquired. If this business combina-tion had been completed as at 1 January 2012, this would have had no further material impact on either the
revenue or the net income (loss) reported by the KION Group for 2012. Goodwill represents the expected strategic and geographical synergies that the KION Group is able to derive from
the business combination. The goodwill arising from this acquisition is currently not tax deductible.
Impact of the acquisition on the financial position of the KION Group
€ thousand
Goodwill 15,794Other intangible assets 5,017Property, plant and equipment 5,437Deferred taxes (net) 1,025Inventories 4,029
8,036Cash and cash equivalents 2,149
5,131
Total assets 46,618
7,907Liabilities 15,472Deferred taxes (net) 0
Total liabilities 23,379
Total net assets 23,239
Cash payment 11,852Fair value of the purchase price obligation 0
Consideration transferred 11,852
Previously held share of equity (49 per cent in Linde Creighton Ltd.) 11,387
Total 23,239
Other assets
Provisions
Fair value at theacquisition date
Trade receivables

KION Holding 1 GmbH Notes to the consolidated financial statements for the year ended 31 December 2012
Page 8 of 88
[ 6 ] Disposal of subsidiaries
With effect from 27 December 2012 the KION Group sold and deconsolidated its controlling interest of 70 per cent in Linde Hydraulics GmbH & Co. KG, Aschaffenburg (referred to below as Linde Hydraulics), to Weichai Power
Co., Ltd., Weifang, China (referred to below as Weichai Power). Before the disposal, significant assets and liabilities of the former hydraulics business of the KION Group, includ-
ing land and buildings plus shares in the subsidiaries Linde Hydraulics Ltd., Abingdon, United Kingdom, and Linde Hydraulics Corporation, Canfield, USA, were transferred to Linde Hydraulics. As part of the transaction, Weichai Power granted the KION Group a put option on the remaining shares (30 per cent) in Linde Hydraulics. The KION
Group also granted Weichai Power two call options relating to these shares. The put option, which is reported in other financial assets, is measured at fair value. The call options, also measured at fair value, are reported in other financial liabilities.
Non-current assets of €164,669 thousand, current assets of €63,330 thousand, cash and cash equivalents of €3,467 thousand, non-current liabilities of €68,414 thousand and current liabilities of €30,328 thousand were
derecognised as a result of the sale. The gain resulting from this sale (before tax) of €138,276 thousand is the difference between the total considera-
tion received for the hydraulics business including the options (€271,000 thousand) and the carrying amounts of the assets and liabilities disposed of. It is reported on the face of the consolidated income statement as other income.
Linde Material Handling GmbH (referred to below as LMH GmbH) continues to hold the remaining 30 per cent of Linde Hydraulics which is included in the scope of consolidation as an at-equity investment on a going-forward
basis. It will be accounted for using the equity method. The gain from the remeasurement of the remaining shares at fair value amounts to €108,692 thousand and is also reported as other income.
[ 7 ] Currency translation
The financial statements in foreign currencies are translated in accordance with the functional currency concept (IAS 21 'The Effects of Changes in Foreign Exchange Rates'). The functional currency is the currency of the primary economic environment in which a company operates. The closing-rate method is used for currency trans-
lation. The assets and liabilities of foreign subsidiaries, including goodwill, are translated at the middle spot exchange rate, i.e. at the average of the bid or offer rates on the reporting date. Income and expenses are translated at the
average rate for the year. With the exception of income and expenses recognised as other comprehensive in-come (loss), equity is recognised at historical rates. The resulting translation differences are recognised in other comprehensive income (loss) until subsidiaries are disposed of.
Transactions of the consolidated companies in foreign currencies are translated into the relevant company's functional currency at the rate prevailing on the transaction date. On the reporting date, monetary items are
translated at the closing rate and non-monetary items at the rate prevailing on the transaction date. Currency translation differences are recognised in the income statement as other income/expenses.
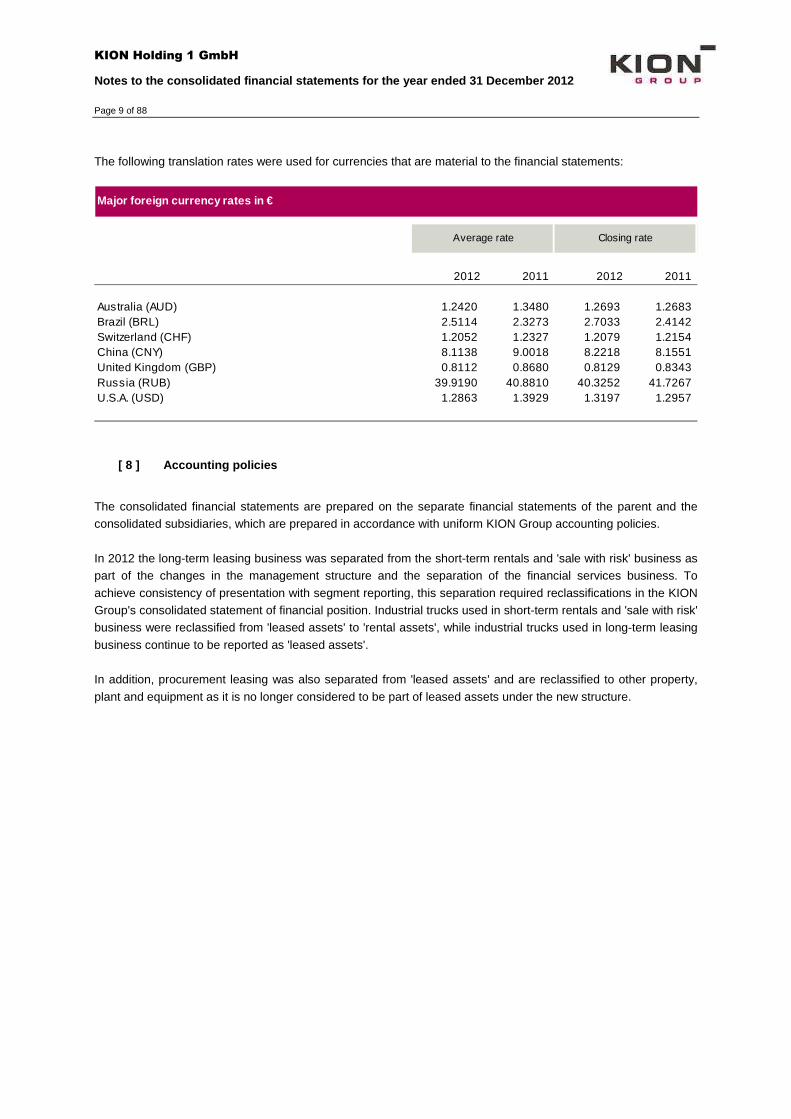
KION Holding 1 GmbH Notes to the consolidated financial statements for the year ended 31 December 2012
Page 9 of 88
The following translation rates were used for currencies that are material to the financial statements:
[ 8 ] Accounting policies
The consolidated financial statements are prepared on the separate financial statements of the parent and the consolidated subsidiaries, which are prepared in accordance with uniform KION Group accounting policies.
In 2012 the long-term leasing business was separated from the short-term rentals and 'sale with risk' business as part of the changes in the management structure and the separation of the financial services business. To
achieve consistency of presentation with segment reporting, this separation required reclassifications in the KION Group's consolidated statement of financial position. Industrial trucks used in short-term rentals and 'sale with risk' business were reclassified from 'leased assets' to 'rental assets', while industrial trucks used in long-term leasing
business continue to be reported as 'leased assets'. In addition, procurement leasing was also separated from 'leased assets' and are reclassified to other property,
plant and equipment as it is no longer considered to be part of leased assets under the new structure.
Major foreign currency rates in €
Average rate Closing rate
2012 2011 2012 2011
Australia (AUD) 1.2420 1.3480 1.2693 1.2683Brazil (BRL) 2.5114 2.3273 2.7033 2.4142Switzerland (CHF) 1.2052 1.2327 1.2079 1.2154China (CNY) 8.1138 9.0018 8.2218 8.1551United Kingdom (GBP) 0.8112 0.8680 0.8129 0.8343Russia (RUB) 39.9190 40.8810 40.3252 41.7267U.S.A. (USD) 1.2863 1.3929 1.3197 1.2957

KION Holding 1 GmbH Notes to the consolidated financial statements for the year ended 31 December 2012
Page 10 of 88
In connection with this reclassification, the corresponding liabilities are reported as other financial liabilities and no longer as lease liabilities. The resulting reclassifications as at 1 January 2011 and 31 December 2011 are as follows:
Assets and Liabilities
€ thousand
01.01.2011 before
reclassifications reclassifications
01.01.2011 after
reclassifications
AssetsLeased assets 501,164 -345,039 156,125Rental assets 0 321,188 321,188Other property, plant and equipment 566,492 23,851 590,343
LiabilitiesNon-current lease liabilities 411,097 -132,283 278,814Other non-current financial liabilities 127,870 132,283 260,153Current lease liabilities 250,552 -80,623 169,929Other current financial liabilities 391,242 80,623 471,865
€ thousand
31.12.2011 before
reclassifications reclassifications
31.12.2011 after
reclassifications
AssetsLeased assets 539,731 -372,377 167,354Rental assets 0 356,682 356,682Other property, plant and equipment 538,121 15,695 553,816
LiabilitiesNon-current lease liabilities 471,131 -171,070 300,061Other non-current financial liabilities 132,719 171,070 303,789Current lease liabilities 230,381 -83,653 146,728Other current financial liabilities 420,435 83,653 504,088

KION Holding 1 GmbH Notes to the consolidated financial statements for the year ended 31 December 2012
Page 11 of 88
Revenue recognition
Revenue is the fair value received for the sale of products and services and lease income (excluding VAT) after deduction of trade discounts and rebates. In accordance with IAS 18, revenue is recognised when it is sufficiently
probable that a future economic benefit will flow to the company and that it can be reliably measured. Additional criteria also apply, depending on each individual transaction, such as:
Sale of goods With the exception of items classified as 'sale with risk', revenue from the sale of goods is recognised when the KION Group delivers goods to a customer, the goods are accepted by the customer and the flow of benefits to the
Group is considered to be probable. If a customer is expected to accept goods but has yet to do so, the corre-sponding revenue is only recognised when the goods are accepted. Appropriate provisions are recognised for risks relating to the sale of goods. In the case of revenue from agreements classified as 'sale with risk', the reve-
nue is recognised pro rata over the term of the agreement if the risks and rewards remain substantially with the KION Group. The term 'sale with risk' and the corresponding revenue recognition are discussed in the following section and under 'Rental assets' below.
Rendering of services Revenue from the rendering of services is recognised in the year in which the services are rendered. For services
provided over several periods, revenue is recognised in accordance with the proportion of the total services rendered in each period (stage of completion). Revenue from long-term service agreements is therefore recog-nised on the basis of the average term of the service agreements and in line with the progressive cost trends
(constant margin). Revenue from financial service transactions is recognised in the amount of the sales value of the leased asset if
classified as a finance lease and in the amount of the lease payments if classified as an operating lease. As part of the financial services provided by the Group, industrial trucks are also sold to finance partners who then enter into leases directly with the end customer (sale with risk). If significant risks and rewards remain with the KION
Group as a result of an agreed residual value guarantee that accounts for more than 10 per cent of the asset's value or as a result of an agreed default guarantee, the proceeds from the sale are deferred and recognised as revenue on a straight-line basis over the term until the residual value guarantee or the default guarantee expires.
Interest income and royalties Interest income is recognised pro rata temporis in accordance with the effective interest method. Income from
royalties is deferred in accordance with the substance of the relevant agreements and recognised pro rata tempo-ris.
Regarding the deferral of lease income, please refer to the accounting policies for leases.
Cost of sales
The cost of sales comprises the cost of goods and services sold and includes directly attributable material and
labour costs as well as directly attributable overheads, including depreciation of production equipment and amor-tisation of certain intangible assets, as well as write-downs of inventories. Cost of sales also includes additions to warranty provisions, which are recognised in the amount of the estimated cost at the date on which the related
product is sold.

KION Holding 1 GmbH Notes to the consolidated financial statements for the year ended 31 December 2012
Page 12 of 88
Government grants
Government grants are recognised at fair value provided that the Group has satisfied the necessary conditions for receiving the grant. Grants not related to capital expenditures are recognised in the income statement, under
other income, in the period in which the expense intended to be covered by the grant is incurred. Grants for capital expenditures are deducted from the cost of the asset concerned and result in a corresponding reduction in depreciation over the subsequent periods.
Financial income and expenses
Net financial income mainly consists of interest expenses on financial liabilities, interest income from financial receivables, gains and losses on financial instruments recognised through profit or loss, exchange rate gains and
losses on financial activities and the interest expenses on pension provisions. The expected return on plan assets relating to pension provisions is also included in financial income.
Interest income and expenses are recognised in profit and loss in accordance with the effective interest method. The effective interest method is used for calculating the amortised cost of a financial asset or financial liability and the allocation of interest income and interest expenses over the relevant periods. The effective interest rate is the
interest rate at which the estimated future payments (including all fees that are part of the effective interest rate, transaction costs and other premiums and discounts) are discounted to the net carrying amount of the financial asset or liability over the expected term of the financial instrument.
Dividends are recognised in income when a resolution on distribution has been passed. They are reported in the income statement under other financial income/expenses.
Goodwill
Goodwill has an indefinite useful life and is not amortised. Instead, it is tested for impairment in accordance with IAS 36 ('Impairment of Assets') at least once a year, and more frequently if there are indications that the asset
might be impaired. Impairment testing is performed at the level of the individual cash-generating units (CGUs) or groups of CGUs. A
CGU is defined as the smallest identifiable group of assets that generates cash inflows from continuing use that are largely independent of the cash inflows from other assets or groups of assets. CGUs are generally based on the lowest level of an entity at which – for internal management purposes – the management systematically
monitors and controls the contribution to earnings made by the assets concerned, including goodwill. However, a CGU may not be larger than an operating segment as defined in IFRS 8 'Operating Segments'. In particular, CGUs are considered to be clearly defined and independent if the entity's management has prepared independ-
ent forecasts relevant to decision-making for the individual CGUs. For the purposes of internal and external reporting, the activities of the KION Group are broken down into the
LMH, STILL, Financial Services and Other segments on the basis of their characteristics and risk profile. The 2012 forecast, the budget for 2013, the medium-term planning for 2014 to 2015 and the KION Group's internal market forecasts for 2016 to 2017 were drawn up on the basis of this segment structure.
The relevant CGUs for the purposes of goodwill impairment testing are the LMH and STILL segments and the CGU Voltas Material Handling Private Limited, Pune, India (referred to below as VMH), which is part of the Other
segment, as goodwill and brand names have been allocated to these CGUs.

KION Holding 1 GmbH Notes to the consolidated financial statements for the year ended 31 December 2012
Page 13 of 88
The recoverable amount of a CGU is determined by calculating its value in use on the basis of the discounted cash flow method. The cash flows used in calculating the operating cash flows are taken from financial forecasts approved by KION's management and are also used for internal management purposes. The cash flows forecast
for the next five years are used for the impairment test. The financial forecasts are based on assumptions relating to the development of the global economy, commodity prices and exchange rates. The budget for 2013, the medium-term planning for 2014 to 2015 and the KION Group's internal market forecasts for 2016 to 2017 were
used to determine the cash flows. Cash flows beyond the five-year planning horizon were extrapolated for the CGUs LMH and STILL by using a growth rate of 1 per cent (2011: 1 per cent). A growth rate of 3 per cent (2011: 2 per cent) was used for VMH to take into account of the forecasted trends for the high-growth market of India
and the high level of inflation. CGU cash flows are discounted using a weighted average cost of capital (WACC) that reflects current market
assessments of the specific risks of the CGUs. The underlying capital structure for the CGUs LMH and STILL is determined by comparing peer group companies in the same sector. The beta factor derived from the peer group was 1.08 (2011: 1.03). Yield curve data from the European Central Bank as at 31 October 2012 was used to
determine a risk-free interest rate; this interest rate was 2.5 per cent (2011: 3.4 per cent). The market risk premi-um derived from empirical studies of the capital markets was set at 6.0 per cent (2011: 5.5 per cent) and reflects the increased uncertainty currently observed in the capital markets. The country risk taken into consideration for
the CGUs LMH and STILL was 0.2 per cent and 0.5 per cent respectively (2011: 0.0 per cent respectively). The risk-adjusted cost of borrowing before tax was based on an interest rate of 4.4 per cent (2011: 5.3 per cent). A leverage ratio of 22.7 per cent (2011: 25.4 per cent) was calculated based on the capital structure determined for
the peer group. To determine the country-specific WACC for VMH, a leveraged beta of 1.07 (2011: 1.10) was used, which was
based on the average of three one-year beta factors. An interest rate of 8.7 per cent (2011: 7.3 per cent) was used as the risk-free interest rate for India as at 31 October 2012. The market risk premium is derived from empir-ical data of the capital markets and was set at 6.0 per cent (2011: 5.5 per cent) and the country risk premium for
India was set at 3.0 per cent (2011: 2.3 per cent). The risk-adjusted cost of borrowing before tax was determined to be 10.6 per cent (2011: 11.3 per cent). A leverage ratio of 22.7 per cent (2011: 25.4 per cent) was calculated for the peer group as at 31 October 2012.
The pre-tax interest rate determined on the basis of these parameters and used to discount the estimated cash flows was 10.7 per cent for LMH (2011: 10.5 per cent), 11.0 per cent for STILL (2011: 10.4 per cent) and 21.5 per
cent for VMH (2011: 14.6 per cent). The WACC after tax was 7.8 per cent for LMH (2011: 7.7 per cent), 8.0 per cent for STILL (2011: 7.7 per cent) and 15.8 per cent for VMH (2011: 11.0 per cent).
The impairment test carried out as at 31 December 2012 did not reveal any need to recognise impairment losses for the existing goodwill of the LMH, STILL and VMH CGUs. Sensitivity analysis has enabled us to determine that no impairment losses need to be recognised for goodwill, even if key assumptions vary within realistic limits.
Other intangible assets
Other purchased intangible assets with a finite useful life are carried at cost less all accumulated amortisation and all accumulated impairment losses. If events or market developments suggest impairment has occurred, impair-
ment tests are carried out on the carrying amount of items classified as other intangible assets with a finite useful life. The carrying amount of an asset is compared with its recoverable amount, which is defined as the higher of its value in use and its fair value net of costs to sell. If the reasons for recognising impairment losses in the past
no longer apply, impairment losses not exceeding the amortised cost of the assets are reversed.

KION Holding 1 GmbH Notes to the consolidated financial statements for the year ended 31 December 2012
Page 14 of 88
Other intangible assets with an indefinite useful life are carried at cost and are mainly capitalised brand names. Brand names are not amortised because they have been established in the market for a number of years and there is no foreseeable end to their useful life. In accordance with IAS 36, they are tested for impairment at least
once a year or whenever there are indications that the asset might be impaired. The impairment test is performed in the same way as the impairment test for goodwill. Assessments of indefinite useful life are carried out in every period.
The brand name of VMH, which is allocated to the Other segment, is subject to a usage right with a contractually limited term and it will therefore be amortised over its useful life.
Development costs are capitalised if the following can be demonstrated:
• the technical feasibility of the intangible asset; • the intention to complete the intangible asset and use or sell it; • the ability to use or sell the intangible asset;
• the extent to which the intangible asset is expected to generate future economic benefits; • the availability of adequate technical, financial and other resources to complete the development and to use
or sell the intangible asset; and
• the ability to reliably measure the expenditure attributable to the intangible asset during its development. Capitalised development costs include all costs and overheads directly attributable to the development process.
Once they have been initially capitalised, these costs and internally generated intangible assets – particularly internally generated software – are carried at cost less accumulated amortisation and accumulated impairment losses. Internally generated intangible assets are not qualifying assets so finance costs are not capitalised. All
development costs which do not meet the recognition criteria are expensed as incurred and reported on the income statement under research and development costs together with research costs and the amortisation on capitalised development costs.
The following useful lives are applied in determining the carrying amounts of other intangible assets:
Leases/rental
KION Group companies lease equipment, mainly various industrial trucks, to their customers in order to promote sales. The leases may be of a short-term nature (short-term rental) or long-term nature (leasing).
Companies in the KION Group enter into leases as lessors and as lessees. In line with IAS 17, these contracts are classified as finance leases if substantially all of the risks and rewards incidental to ownership of the
leased/rental asset are transferred to the lessee. All other leases and rental transactions are classified as operat-ing leases, in accordance with IAS 17.
Useful life of other intangible assets
Years
Customer relationships/client base 10Technology 10Development costs 5-7Patents and licences 3-15Software 3-8

KION Holding 1 GmbH Notes to the consolidated financial statements for the year ended 31 December 2012
Page 15 of 88
If a KION Group company enters into a finance lease as the lessor, the future lease payments to be paid by the lessee are recognised as lease receivables at an amount equal to the net investment in the lease. Interest income is allocated to each reporting period in order to ensure a constant return on the outstanding net investment in the
lease.
Leased assets
If the economic ownership of leased assets remains with a KION Group company as the lessor under an operat-
ing lease, the assets are reported as leased assets in a separate item on the face of the statement of financial position. The leased assets are carried at cost and depreciated over the term of the underlying leases. Lease-related income is recognised on a straight-line basis over the terms of the leases.
In the case of these long-term leases, industrial trucks are generally sold to leasing companies. The industrial trucks are then leased back to companies in the KION Group, who sub-lease them to customers (described below
as 'sale-and-leaseback sub-leases'). Long-term leases generally have a term of four to five years. If, in the case of sale-and-leaseback sub-leases, the risks and rewards incidental to the head lease are substantially borne by KION Group companies, the corresponding assets are reported as non-current leased assets. If substantially the
risks and rewards are transferred to the end customer, a corresponding lease receivable is recognised. Long-term customer leases are funded for terms that match those of the lease; funding items are recognised as lease liabili-ties.
Rental assets
Rental assets are assets resulting from short-term rentals as well as industrial trucks in relation to which signifi-cant risks and rewards remain with the KION Group despite having been sold ('sale with risk').
In the case of short-term rentals, LMH and STILL brand companies rent industrial trucks to customers directly. Short-term rental agreements usually have a term of one day to one year. The significant risks and rewards remain with the LMH and STILL brand companies. The industrial trucks are carried at cost and depreciated over
their economic usefull lifes. Depending on the product group, the economic useful life is between five and seven years.
As part of 'sale with risk' business, industrial trucks are sold to finance partners who then enter into leases with end customers. If LMH and STILL brand companies provide material residual value guarantees or a customer default guarantee, these transactions, which classify as sale agreements under civil law, are recognised in ac-
cordance with the provisions for lessors in operating leases and the IFRS principles for revenue recognition. In this case, the trucks are recognised as assets in the statement of financial position at their cost on the date of the sale and depreciated to their guaranteed residual value, or zero, over the term of the lease between the finance
partner and end customer. If the KION Group provides a residual value guarantee, an amount equivalent to the residual value obligation is recognised under other financial liabilities. The purchase consideration paid by the finance partner is recognised as deferred income and released to revenue on a pro rata basis over the term of the
lease between the finance partner and the end customer.
Other property, plant and equipment
Property, plant and equipment are carried at cost less straight-line depreciation and impairment losses. The cost
of internally generated machinery and equipment includes all costs directly attributable to the production process and an appropriate portion of production overheads. This includes production-related depreciation and propor-tionate costs for administration and social insurance / employee benefits.

KION Holding 1 GmbH Notes to the consolidated financial statements for the year ended 31 December 2012
Page 16 of 88
The cost of property, plant and equipment is reduced by the amount of any government grants received. Expens-es for maintenance and repairs are recognised in income to the extent that they are not required to be capitalised. Borrowing costs are capitalised for certain items of property, plant and equipment whose acquisition or production
exceeds one year as soon as the definition of a qualifying asset is met. As was the case in the previous year, there were no qualifying assets in 2012.
Depreciation of property, plant and equipment is recognised on a straight-line basis and reported in functional costs. The useful lives and depreciation methods are reviewed annually and adjusted to reflect changes in condi-tions.
The following useful lives are applied in determining the carrying amounts of items of property, plant and equip-ment:
KION Group companies also lease property, plant and equipment for their own use using finance leases, which
are recognised as other property, plant and equipment. In this case, the lower of the fair value and present value of future lease payments is recognised at the inception of the lease. A corresponding liability to the lessor is recognised under other financial liabilities in the statement of financial position.
Property, plant and equipment covered by finance leases is depreciated over the shorter of its useful life or the term of the lease, unless title to the leased assets passes to the lessee when the lease expires, in which case the
property, plant and equipment is depreciated and the other financial liabilities are reversed over the useful life of the leased assets.
The difference between total finance lease liabilities and the fair value of the financed leased assets represents the finance charge which is recognised in the income statement over the term of the lease at a constant rate of interest on the outstanding balance in each period. At the end of the lease term, the leased assets are either
returned or purchased, or the contract is extended. If there are certain indications of impairment of the property, plant and equipment, the assets are tested for im-
pairment by comparing the residual carrying amount of the assets with their recoverable amount, which is defined as the higher of value in use and fair value less costs to sell. If the residual carrying amount is greater than the recoverable amount, an impairment loss is recognised for an asset.
The KION Group calculates the recoverable amount primarily on the basis of value in use. In determining value in use, the expected future cash flows are discounted using a risk-adjusted discount rate, taking into account the
current and future level of earnings and segment-specific, technological, economic and general trends.
Useful life of other property, plant and equipment
Years
Buildings 10-25Plant and machinery 6-15Office furniture and equipment 3-15

KION Holding 1 GmbH Notes to the consolidated financial statements for the year ended 31 December 2012
Page 17 of 88
If an impairment test for an item of property, plant and equipment is performed at the level of a cash-generating unit to which goodwill is allocated and results in the recognition of an impairment loss, first the goodwill and, subsequently, the assets must be written down in proportion to their relative carrying amounts. If the reason for an
impairment loss recognised in prior years no longer exists, impairment losses not exceeding the amortised cost of the asset concerned are reversed. This does not apply to goodwill.
Equity-accounted investments
In accordance with the equity method, associates and joint ventures are measured as the proportion of the inter-est in the equity of the investee. They are initially carried at cost. In subsequent periods, the KION Group's inter-est in the profit or loss generated after acquisition is recognised in income. Other changes in the equity of associ-
ates and joint ventures are recognised in other comprehensive income (loss) in the consolidated financial state-ments in proportion to the Group's interest in the associate or joint venture.
If the Group's interest in the losses made by an associate or joint venture exceeds the carrying amount of the proportionate equity attributable to the Group, no additional losses are recognised. Any goodwill arising from the acquisition of an associate or joint venture is included in the carrying amount of the investment in the associate or
joint venture. When an associate or joint venture is sold, the Group's interest in its goodwill is taken into account in determining the proceeds on disposal.
If there is evidence that an associate or joint venture may be impaired, the carrying amount of the investment is tested for impairment.
Income taxes
In the consolidated financial statements, current and deferred taxes are recognised on the basis of the tax laws of the relevant jurisdictions. Deferred taxes are recognised in other comprehensive income (loss) if they relate to transactions also recognised in other comprehensive income (loss).
Deferred tax assets and liabilities are recognised in accordance with the liability method for all temporary differ-ences between the IFRS carrying amounts and the tax base, as well as for temporary differences resulting from
consolidation measures. Deferred tax assets also include tax refund claims that arise from the expected utilisation of existing tax loss
carryforwards and interest carryforwards in subsequent years and whose utilisation is reasonably certain accord-ing to current forecasts. On the basis of this estimate, deferred tax assets were recognised on some interest carryforwards for the first time in 2011.
Deferred taxes are determined on the basis of the tax rates that will apply or are expected to apply at the realisa-tion date in accordance with the current legal situation in each country concerned. In accordance with the provi-
sions in IAS 12, deferred tax assets and liabilities are not discounted. Deferred tax assets are offset against deferred tax liabilities to the extent that they have the same maturity and
relate to the same taxation authority.
KION Holding 1 GmbH Notes to the consolidated financial statements for the year ended 31 December 2012
Page 18 of 88
Inventories
Inventories are carried at the lower of cost and net realisable value.
The acquisition costs of raw materials and merchandise are calculated on the basis of an average. The cost of finished goods and work in progress includes direct costs and an appropriate portion of the material
and production overheads and production-related depreciation directly attributable to the production process. Administrative costs and social insurance / employee benefits are included to the extent that they are attributable to the production process. Borrowing costs as defined by IAS 23 are not a component of cost as they are not
qualifying assets as defined by IAS 23.4. The amount recognised is an average value or a value determined in accordance with the FIFO method.
Net realisable value is the selling price that can be realised less the estimated costs of completion and the esti-mated selling costs.
Write-downs are recognised for inventory risks resulting from duration of storage, impaired recoverability, etc. Write-downs are reversed up to a maximum of cost if the reasons for their recognition no longer apply.
Trade receivables
In the first period in which they are recognised, trade receivables ('LaR') are carried at fair value including directly attributable transaction costs. In subsequent periods they are measured at amortised cost using the effective interest method. Appropriate valuation allowances are recognised for identifiable individual risks. Low-interest or
non-interest-bearing receivables due in more than one year are carried at their present value.
Other financial assets
The investments in non-consolidated affiliated companies and (long-term) equity investments that are reported in
other non-current financial assets are carried at cost less impairment losses, as observable fair values are not available and reliable results cannot be obtained using other permitted measurement techniques. At present there is no intention to sell these financial instruments. At each reporting date, financial assets or groups of financial
assets are tested for impairment. Impairment losses are recognised in income as appropriate. Primary financial assets are initially recognised and derecognised in the financial statements on their settlement
dates. Under IAS 39 ('Financial Instruments: Recognition and Measurement'), securities allocated to current or non-
current financial assets are classified according to those carried at fair value through profit and loss (FAHfT), available for sale (AfS) and held to maturity (HtM).
The KION Group did not designate any securities as carried at fair value through profit and loss (FAHfT) in the reporting year. The FAHfT category therefore only includes derivative financial instruments that do not form part of a formally documented hedge relationship.
Available-for-sale financial instruments (AfS) are carried at fair value. If they are equity investments for which no market price is available, they are carried at cost. Unrealised gains and losses, including deferred taxes, are
reported in other comprehensive income (loss) until they are realised.

KION Holding 1 GmbH Notes to the consolidated financial statements for the year ended 31 December 2012
Page 19 of 88
In the first period they are recognised, other financial assets which are categorised as loans and receivables ('LaR') are carried at fair value including directly attributable transaction costs. In subsequent periods they are measured at amortised cost using the effective interest method. Appropriate valuation allowances are recognised
for identifiable individual risks. Low-interest or non-interest-bearing receivables due in more than one year are carried at their present value.
Carrying amounts are tested for impairment on every reporting date and whenever indications of impairment arise. If there is an objective indication of impairment (such as a borrower being in significant financial difficulties), an impairment loss must be recognised directly in the income statement.
If objective facts in favour of reversing impairment losses are present on the reporting date, reversals are recog-nised to an appropriate extent. Reversals may not exceed the amortised cost that would have arisen if the im-
pairment loss had not been recognised. In the case of debt instruments classified as available-for-sale financial assets, reversals of impairment losses are recognised in the income statement.
Held to maturity financial assets are carried at amortised cost less impairment losses in accordance with the effective interest method.
KION Holding 1 GmbH Notes to the consolidated financial statements for the year ended 31 December 2012
Page 20 of 88
Derivative financial instruments
Derivative financial instruments are measured at their fair value and are reported as financial assets or financial liabilities as at the reporting date.
Derivative financial instruments in the KION Group comprise currency forwards and interest-rate swaps and are used for hedging purposes to mitigate exchange-rate and interest-rate risks. In addition, the options on the re-
maining shares in Linde Hydraulics are reported as derivative financial instruments (see note [ 6 ]). In accordance with IAS 39 (Financial Instruments: Recognition and Measurement), all derivative financial instru-
ments are measured at their fair value irrespective of an entity's purpose or intention in entering into the derivative contract. Changes in the fair value of derivative financial instruments in a formally documented hedge are report-ed in the income statement (for fair value hedges) or in other comprehensive income (loss) (for cash flow hedg-
es). The KION Group currently only uses cash flow hedges for exchange-rate and interest-rate risks.
In the case of cash flow hedges, derivatives are used to hedge future cash flow risks from existing underlying transactions or planned transactions. The effective portion of changes in the fair value of derivatives is initially
recognised in other comprehensive income (loss), and is subsequently reclassified to the income statement when the revenue from the corresponding underlying transaction is realised. The ineffective portion of the changes in fair value is recognised immediately in net financial income/expenses.
If the criteria for hedge accounting are not met, changes in the fair value of derivative financial instruments are recognised in the income statement.
In the case of hedges of net investments in foreign subsidiaries, the translation risks resulting from investments with a different functional currency are hedged. Unrealised gains and losses on hedging instruments are reported
in other comprehensive income (loss) until the company is sold. In the past financial year, KION Group compa-nies have not entered into any hedges for net investments in foreign subsidiaries.
Further information on risk management and accounting for derivative financial instruments can be found in note [ 36 ].
Retirement benefit obligation
The retirement benefit obligation is calculated in accordance with the projected unit credit method. Future pension obligations are measured on the basis of the pro rata vested benefit entitlements as at the reporting date and discounted to their present value. The calculations include assumptions about future changes in certain parame-
ters, such as expected salary and pension increases and biometric factors affecting the amount of future benefits. Pension provisions are reduced by the fair value of the plan assets used to cover the Group's benefit obligations. Plan assets are measured at fair value. Actuarial gains and losses, including deferred taxes, are recognised in other comprehensive income (loss). The cost of additions to pension provisions is allocated to functional costs. The interest cost on pension obligations and the expected return on plan assets are reported in net financial income/expenses. Further details can be
found in note [ 29 ].

KION Holding 1 GmbH Notes to the consolidated financial statements for the year ended 31 December 2012
Page 21 of 88
Other provisions
Other provisions are recognised when the Group has a legal or constructive obligation to a third party as the result of a past event that is probable to result in a future outflow of resources and that can be reliably estimated.
A provision is recognised in the amount of the mean of the range of probabilities. Measurement is at full cost. Provisions for identifiable risks and contingent liabilities are recognised in the amount that represents the best
estimate of the cost required to settle the obligations. Recourse claims are not taken into account. The settlement amount also includes cost increases identifiable as at the reporting date. Provisions with a maturity of more than twelve months are discounted using the standard market interest rate. The discount rate is a before-tax rate that
reflects current market expectations for the time value of money and the specific risks inherent in the liability. Accrued interest is recognised in interest expenses.
Warranty provisions are recognised on the basis of past or estimated future claim statistics. Individual provisions are recognised for claims that are known to the Group. The corresponding expense is recognised in cost of sales at the date on which the revenue is recognised.
Provisions for expected losses from onerous contracts and other business obligations are measured on the basis of the work yet to be performed.
A restructuring provision is recognised when a KION Group company has prepared a detailed, formal restructur-ing plan and this plan has raised a valid expectation in those affected that the company will carry out the restruc-
turing by starting to implement that plan or announcing its main features to those affected by it. The measurement of a restructuring provision only includes the direct expenditures arising from the restructuring and not associated with the ongoing activities of the company concerned.
Shareholder loan, financial liabilities, other finan cial liabilities, trade payables
These liabilities are initially recognised at fair value at the time they are entered into. Directly attributable transac-tion costs are deducted for all financial liabilities that are not subsequently designated as at fair value through
profit or loss. The shareholder loan, non-current financial liabilities and other financial liabilities are then carried at amortised
cost. Any differences between historical cost and the settlement amount are recognised in accordance with the effective interest method.

KION Holding 1 GmbH Notes to the consolidated financial statements for the year ended 31 December 2012
Page 22 of 88
Assumptions and estimates
The preparation of the IFRS consolidated financial statements requires the use of assumptions and estimates for certain line items that affect recognition and measurement in the statement of financial position and the income
statement. The actual amounts realised may differ from estimates. Assumptions and estimates are applied in particular:
• in assessing the need for and the amount of impairment losses on intangible assets, property, plant and equipment and inventories
• in determining the useful life of non-current assets
• in classifying leases • to the recognition and measurement of defined benefit pension obligations, provisions for tax, and other
provisions and
• in assessing the recoverability of deferred tax assets. Goodwill is tested for impairment annually at the level of the cash-generating units to which goodwill is allocated,
applying the budget for 2013 and the medium-term planning for 2014 to 2015 combined with the growth predicted in the market forecasts for 2016 to 2017 and assuming division-specific growth rates for the period thereafter. Any material changes to these factors might result in the recognition of impairment losses. Further information on
goodwill can be found in note [ 18 ]. Information on leases can be found in the sections on leases/rental, leased assets, rental assets and other prop-
erty, plant and equipment in this note. Defined benefit pension obligations are calculated on the basis of actuarial parameters. As differences due to
actuarial gains and losses are recognised in other comprehensive income (loss), any change in these parameters would not affect the net profit for the current period. For further details about sensitivity analysis of the impact of certain assumptions, please refer to the information about the retirement benefit obligation in note [ 29 ].
Significant estimates are involved in calculating provisions for tax. These estimates may change on the basis of new information and experience (see also note [ 16 ]). Where necessary, the KION Group's accounting depart-
ments receive assistance from external legal advisers and tax consultants when making the estimates required. The recognition and measurement of other provisions is based on an estimate taking into consideration the prob-
ability of the future outflow of resources, past experience and the circumstances known to the Group at the report-ing date. Accordingly, the actual outflow of resources for a given event may be different from the amount recog-nised in other provisions. Further details can be found in note [ 32 ].
Deferred tax assets on tax loss carryforwards and interest carryforwards are recognised on the basis of an esti-mate of the future recoverability of the tax benefit, i.e. an assumption as to whether sufficient taxable income or
tax relief will be available against which the carryforwards can be utilised. The actual amount of taxable income in future periods, and hence the actual utilisation of tax loss carryforwards and interest carryforwards, may be differ-ent from the estimates made when the corresponding deferred tax assets were recognised.
Changes are recognised in profit or loss when they become known and assumptions are adjusted accordingly.

KION Holding 1 GmbH Notes to the consolidated financial statements for the year ended 31 December 2012
Page 23 of 88
Notes to the consolidated income statement
[ 9 ] Revenue
The revenue generated by the KION Group in the year under review is comprised of the following by product
category:
Further information on revenue can be found in note [ 39 ] Segment report.
[ 10 ] Other income
Other income is comprised of the following:
Net gains on the Weichai transactions relate to the gain of €138,276 thousand from the disposal of the (indirect) controlling interest of 70 per cent in Linde Hydraulics (see also note [ 6 ]). Costs incurred in connection with the
sale amounting to €35,205 thousand are also reported under net gains on the Weichai transactions.
Revenue by product category
€ thousand 2012 2011
New business 2,651,483 2,364,235Hydraulics 167,771 172,662Service offering 1,907,410 1,831,498 - After sales 1,149,791 1,065,731
- Rental business 427,610 441,152
- Used trucks 212,974 218,982
- Other 117,035 105,633
Total revenue 4,726,664 4,368,395
Other income
€ thousand 2012 2011
Net gains on the Weichai transactions 211,763 − Foreign currency exchange rate gains 18,926 22,600Profit from release of deferred lease profits 10,593 6,886Income from reversal of provisions 5,196 6,638Remeasurement of purchase price obligations 4,557 11,971Gains on disposal of non-current assets 4,045 1,381Rental income 2,677 2,155Sundry income 36,617 29,872
Total other income 294,374 81,503

KION Holding 1 GmbH Notes to the consolidated financial statements for the year ended 31 December 2012
Page 24 of 88
In addition, the net gains on the Weichai transactions also include the gain arising from the remeasurement of the remaining shares (30 per cent) in Linde Hydraulics at fair value in the amount of €108,692 thousand.
The foreign currency exchange rate gains and losses result from the measurement of financial receivables and liabilities denominated in foreign currency and the measurement of corresponding derivatives. The foreign curren-cy exchange rate gains include gains amounting to €9,670 thousand (2011: €11,354 thousand) on derivative
financial instruments used to hedge operating exchange-rate risk. These gains were offset by foreign currency exchange rate losses (other expenses) of €5,101 thousand in 2012 (2011: €11,542 thousand). Overall, this re-sulted in a net gain of €4,569 thousand (2011: net loss of €188 thousand).
The remeasurement of purchase price obligations relates to the shares acquired in Linde Creighton Ltd., Basing-stoke, United Kingdom in 2012. This gain results from the significantly improved market environment and a corre-
sponding increase in the value of the investment (see also note [ 5 ]).
[ 11 ] Other expenses
The breakdown of other expenses is as follows:
The change in foreign currency exchange rate gains and losses is attributable to exchange rate movements (see also note [ 10 ]). Overall, there was a net gain of €4,569 thousand on derivative financial instruments used to
hedge operating exchange-rate risk (2011: net loss of €188 thousand). The impairment recognised on non-current assets in the reporting year comprised impairment losses of €4,825
thousand on intangible assets (2011: €10,261 thousand) and impairment losses of €16,309 thousand on other property, plant and equipment (2011: €16,771 thousand). It was largely caused by the planned closure of produc-tion sites.
[ 12 ] Profit from at-equity investments
Profit from equity-accounted investments amounted to €15,912 thousand in the reporting year (2011: €11,192 thousand). This amount includes income of €8,015 thousand (average price) arising from the remeas-
urement of an existing equity-accounted investment of 49 per cent held in Linde Creighton Ltd., Basingstoke, United Kingdom, over which a controlling influence can be exerted following the acquisition of the remaining shares (see note [ 5 ]). Further details on equity-accounted investments can be found in note [ 22 ].
Other expenses
€ thousand 2012 2011
Foreign currency exchange rate losses 23,277 19,467Impairment of non-current assets 21,134 27,032Losses on disposal of non-current assets 3,334 7,963Sundry expenses 11,785 15,581
Total other expenses 59,530 70,043

KION Holding 1 GmbH Notes to the consolidated financial statements for the year ended 31 December 2012
Page 25 of 88
[ 13 ] Other financial result
Other financial result is essentially comprised of income from equity investments (€2,197 thousand) and gains on the disposal of equity investments (€427 thousand). These gains on the disposal of equity investments largely
resulted from the gain of €298 thousand on the disposal of the 80 per cent controlling interest in TPZ Linde Vilicari Hrvatska d.o.o., Zagreb, Croatia, in February 2012.
[ 14 ] Financial income
Financial income is comprised of the following:
The return on pension plan assets item shows the expected return on plan assets used to cover pension obliga-
tions. The interest income from leases relates to the interest portion of lease payments in financial services transactions
in which KION Group companies operate as lessors (finance leases). Gains on foreign exchange rate differences – financing – include gains of €9,142 thousand on the translation of a
foreign-currency loan denominated in US dollars (2011: €19,022 thousand) and a gain of €75 thousand on hedg-ing transactions (2011: €22,883 thousand).
Financial income
€ thousand 2012 2011
Return on pension plan assets 22,731 22,732Interest income from leases 22,451 24,414Foreign currency exchange rate gains (financing) 12,108 23,149Other interests and similar income 4,794 3,369
Total financial income 62,084 73,664

KION Holding 1 GmbH Notes to the consolidated financial statements for the year ended 31 December 2012
Page 26 of 88
[ 15 ] Financial expense
The financial expense is comprised of the following:
Interest expenses include interest costs of €101,239 thousand arising from variable-rate loan liabilities under the senior facilities agreement (2011: €117,273 thousand) and losses of €19,861 thousand on interest-rate swaps
(2011: €18,464 thousand). The interest cost of the defined benefit obligation is the annual interest expense in connection with the unwinding
of the discount on non-current pension obligations. The interest cost of leases relates to the interest portion of lease payments in financial services transactions in
which the material risks and rewards are borne by KION Group companies as the lessee (finance leases). Sale-finance leaseback-operating sub-leases (SALB-FL-OL) incurred interest expenses of €20,719 thousand (2011: €19,587 thousand). These interest expenses were not directly offset by any interest income. The corresponding
income reported within revenue as lease payments received. The foreign currency exchange rate losses – financing – include losses on derivative financial instruments
amounting to €7,588 thousand (2011: €31,843 thousand).
Financial expense
€ thousand 2012 2011
Interest expense from loans 121,100 135,737Interest cost of defined benefit obligation 43,809 42,436Interest cost of leases 39,636 37,738Interest expense from corporate bond 34,458 25,395Interest cost of shareholder loan 27,653 27,882Amortisation of finance costs 11,422 11,359Foreign currency exchange rate losses (financing) 7,632 52,264Interest cost of non-current financial liabilities 2,192 2,574Other interest expenses and similar charges 13,667 10,324
Total financial expense 301,569 345,709

KION Holding 1 GmbH Notes to the consolidated financial statements for the year ended 31 December 2012
Page 27 of 88
[ 16 ] Income taxes
The income tax expense of €149,540 thousand (2011: expense of €34,041 thousand) consisted of €122,137 thousand in current tax expense (2011: €49,349 thousand) and €27,403 thousand in deferred tax
expense (2011: deferred tax income of €15,308 thousand). The current tax expense includes expenses of €8,820 thousand (2011: expenses of €2,602 thousand) relating to previous financial years.
At the reporting date there were income tax receivables due from tax authorities of €5,501 thousand (2011: €4,953 thousand) and income tax liabilities of €84,958 thousand (2011: €15,439 thousand).
Deferred taxes are recognised for temporary differences between the tax base and the carrying amounts under IFRS. Deferred taxes are determined on the basis of the tax rates that will apply or are expected to apply at the realisation date in accordance with the current legal situation in each country concerned. The current corporate
income tax rate in Germany is 15.0 per cent. Taking into account the average trade tax rate of 14.11 per cent and the solidarity surcharge (5.5 per cent of corporate income tax), the combined tax rate for companies in Germany remained at 29.9 per cent. The income tax rates for foreign companies used in the calculation of deferred taxes
are between 10.0 per cent and 38.1 per cent (2011: 10.0 per cent and 38.5 per cent). No deferred taxes have been recognised on differences of €96,090 thousand (2011: €100,146 thousand) between
the IFRS carrying amounts and the tax base of the investments (outside basis differences) because the KION Group is in a position to manage the timing of the reversal of temporary differences and there are no plans to sell the investments in the foreseeable future.
Deferred tax assets are allocated to the following items in the statement of financial position:
Deferred tax assets
€ thousand 2012 2011
Intangible assets and property, plant and equipment 107,051 86,789Financial assets 4,141 1Current assets 33,832 34,697Deferred charges and prepaid expenses 8,622 6,065Provisions 121,478 101,669Liabilities 250,973 200,678Deferred income 46,428 46,386Tax loss carryforwards and interest carryforwards 31,795 70,230Offsetting -339,346 -284,552
Total deferred tax assets 264,974 261,963

KION Holding 1 GmbH Notes to the consolidated financial statements for the year ended 31 December 2012
Page 28 of 88
Deferred tax liabilities are allocated to the following items in the statement of financial position:
The deferred tax liabilities essentially relate to the purchase price allocation as a result of the acquisition of KION Group, particularly for intangible assets and property, plant and equipment.
Deferred tax assets amounting to €233,162 thousand (2011: €211,398 thousand) have not been recognised because due to the current tax structure it is unlikely that the corresponding benefit can be utilised despite the
improved income situation. Unrecognised deferred tax assets relate to tax loss carryforwards of €108,630 thousand (2011: €91,636 thousand), interest carryforwards of €123,952 thousand (2011: €116,060 thousand) and other temporary differences of €580 thousand (2011: €3,702 thousand).
Deferred taxes on tax loss carryforwards and interest carryforwards are recognised to the extent that sufficient future taxable income is expected to be generated against which the losses can be utilised. The deferred tax
assets recognised on interest carryforwards in 2011 were utilised in the year under review. No deferred taxes on interest carryforwards had been recognised as at 31 December 2012. The total amount of unrecognised deferred tax assets relating to loss carryforwards of €108,630 thousand (2011: €91,636 thousand) concerns tax losses that
can be carried forward indefinitely. The KION Group's tax loss carryforwards in Germany as at 31 December 2012 amounted to €289,786 thousand
(31 December 2011: €381,941 thousand) for corporate income tax and €270,800 thousand (31 December 2011: €263,525 thousand) for trade tax. There were also foreign tax loss carryforwards totalling €190,476 thousand (31 December 2011: €187,438 thousand).
The interest that can be carried forward for an indefinite period of time in Germany amounted to €463,461 thousand as at 31 December 2012 (31 December 2011: €464,939 thousand).
The table below shows the reconciliation of expected income tax expense to effective income tax expense. The Group reconciliation is an aggregation of the individual company-specific reconciliations prepared in accordance
with relevant local tax rates, taking into account consolidation effects recognised in income. The expected tax rate applied in the reconciliation is 29.9 per cent (2011: 29.8 per cent).
Deferred tax liabilities
€ thousand 2012 2011
Intangible assets and property, plant and equipment 452,436 456,138Financial assets 3,259 3,139Current assets 150,410 113,340Deferred charges and prepaid expenses 398 8,588Provisions 23,706 29,838Liabilities 15,361 9,749Deferred income 2,597 2,814Offsetting -339,346 -284,552
Total deferred tax liabilities 308,821 339,054

KION Holding 1 GmbH Notes to the consolidated financial statements for the year ended 31 December 2012
Page 29 of 88
Tax-exempt income includes €17,410 thousand of tax-exempt income in connection with the transfer of significant parts of the former hydraulics business of LMH GmbH to Linde Hydraulics.
Income taxes
€ thousand 2012 2011
Earnings before taxes 310,628 -58,885
Anticipated income taxes -93,002 17,548Deviations due to the trade tax base -3,882 -3,087Deviations from the anticipated tax rate -322 13,560Change in valuation allowance on deferred taxes -623 -9,765Losses for which deferred taxes have not been recognised -19,972 -17,372Change in tax rates and tax legislation -1,473 -1,404Interest carryforwards for which deferred taxes have not been recognised -7,113 -31,786Non-deductible expenses -20,244 -8,556Tax-exempt income 20,924 1,903Tax relating to other periods -8,820 -2,602Deferred taxes prior periods -11,168 5,001Other -3,845 2,519
Effective income taxes (current and deferred taxes) -149,540 -34,041

KION Holding 1 GmbH Notes to the consolidated financial statements for the year ended 31 December 2012
Page 30 of 88
[ 17 ] Other income statement disclosures
The cost of materials declined by €64,085 thousand in the reporting year to €2,179,984 thousand (2011: €2,244,069 thousand).
Personnel expenses increased by €138,999 thousand in 2012 to €1,202,725 thousand (2011: €1,063,726 thou-sand). Personnel expenses include wages and salaries of €946,574 thousand (2011: €833,585 thousand) as well
as social security contributions and expenses for pensions and other benefits of €256,151 thousand (2011: €230,141 thousand). The interest cost from the unwinding of the discount on estimated pension obligations is not recognised under personnel expenses and is instead reported under financial expense as a component of interest
cost of the defined benefit obligation. The pension expense of €33,688 thousand (2011: €29,741 thousand) is essentially comprised of the pension entitlements of €16,243 thousand vested in 2012 (2011: €16,242 thousand) and the unrecognised past service cost of €399 thousand (2011: €177 thousand).
Impairment losses and depreciation expenses on property, plant and equipment together with impairment losses and amortisation expenses on intangible assets amounted to €365,269 thousand in the reporting year (2011:
€356,021 thousand). Inventories were written down by €8,167 thousand (2011: €6,179 thousand). The breakdown of lease and rental payments expensed in the period and related to operating leases where KION
Group companies are lessees is as follows:
The expenses in connection with sub-leases relate to leases and rental agreements in which KION Group com-panies are both lessors and lessees. These expenses were offset by income of €53,639 thousand in 2012 (2011:
€51,072 thousand).
Lessee: Expenses recognised for operating lease pay ments
€ thousand 2012 2011
Procurement lease contracts 80,454 67,043Sublease contracts 18,983 38,181
Total recognised expenses for lease payments 99,437 105,224

KION Holding 1 GmbH Notes to the consolidated financial statements for the year ended 31 December 2012
Page 31 of 88
Notes to the consolidated statement of financial position
[ 18 ] Goodwill and other intangible assets
Goodwill is allocated to the segments as follows:
The change in goodwill was the result of the disposal of goodwill amounting to €80,700 thousand in the LMH segment in connection with the sale of the controlling interest (70 per cent) in Linde Hydraulics. In addition, good-will of €16,306 thousand arose from the acquisition of the UK dealer Creighton. It was allocated to the LMH seg-
ment.
Goodwill broken down by segment
€ thousand 2012 2011
LMH 907,835 971,873STILL 552,208 552,208Other 13,202 13,915
Total goodwill 1,473,245 1,537,996

KION Holding 1 GmbH Notes to the consolidated financial statements for the year ended 31 December 2012
Page 32 of 88
The Group intends to retain and further strengthen the Linde, STILL, OM-STILL and KION brand names on a
long-term basis. Brand names worth €473,755 thousand (31 December 2011: €473,782 thousand) are assigned to the LMH segment. The value of brand names allocated to the STILL segment was unchanged year on year at €114,000 thousand. These assets are not amortised as they have an indefinite useful life. An amount of €1,830
thousand had been allocated to the Voltas brand name and is reported in the 'Other' segment in 2011 as part of the purchase price allocation. Unlike the other brand names, the Voltas brand name is amortised over its useful life. As at 31 December 2012 the brand names allocated to the 'Other' segment had a carrying amount of €6,193
thousand (31 December 2011: €6,597 thousand). The total carrying amount for technology and development assets as at 31 December 2012 was
€217,892 thousand (31 December 2011: €251,723 thousand). Development costs of €51,247 thousand were capitalised in the reporting year (2011: €53,363 thousand). Total research and development costs of €124,454 thousand (2011: €119,526 thousand) were expensed. Of this amount, €60,285 thousand (2011:
€62,780 thousand) related to amortisation and impairment losses.
Intangible assets
€ thousand GoodwillBrand
names
Technology &
development
Sundry intangible
assets Total
Balance as at 1/1/2011 1,507,010 591,018 261,194 134,19 8 2,493,420
Group changes 31,535 2,982 0 7,634 42,151Currency translation adjustments 150 524 -14 225 885Additions 0 99 53,363 16,755 70,217Disposals -699 0 -1 -163 -863Amortisation 0 -244 -52,544 -27,359 -80,147Impairment 0 0 -10,236 -25 -10,261Reclassification 0 0 -39 188 149
Balance as at 31/12/2011 1,537,996 594,379 251,723 131, 453 2,515,551
Gross carrying amount as at 31/12/2011 1,537,996 594,609 449,864 236,275 2,818,744Accumulated amortisation 0 -230 -198,141 -104,822 -303,193
Balance as at 1/1/2012 1,537,996 594,379 251,723 131,45 3 2,515,551
Group changes 16,306 0 0 4,691 20,997Currency translation adjustments -542 -85 366 230 -31Additions 185 0 51,247 18,923 70,355Disposals -80,700 0 -25,094 -3,433 -109,227Amortisation 0 -346 -55,527 -29,828 -85,701Impairment 0 0 -4,758 -67 -4,825Reclassification 0 0 -65 152 87
Balance as at 31/12/2012 1,473,245 593,948 217,892 122, 121 2,407,206
Gross carrying amount as at 31/12/2012 1,473,245 594,494 426,727 232,942 2,727,408Accumulated amortisation 0 -546 -208,835 -110,821 -320,202

KION Holding 1 GmbH Notes to the consolidated financial statements for the year ended 31 December 2012
Page 33 of 88
Impairment losses of €4,825 thousand were recognised on these assets in 2012 to reflect the lack of opportunities to use them in future as a result of the planned closure of production sites. Of this amount, €4,741 thousand relates to capitalised development costs. The impairment losses related to the LMH segment.
Other intangible assets relate primarily to the intangible assets identified through the purchase price allocation for the acquisition of the KION Group, such as the customer base.
The amortisation expense and impairment losses on intangible assets are reported under the functional costs.
[ 19 ] Leased assets
The changes in leased assets in 2012 and 2011 were as follows:
Leased assets are attributable solely to the Financial Services segment and relate to industrial trucks in the amount of €191,192 thousand (2011: €167,164 thousand) and to truck equipment in the amount of €130 thousand (2011: €190 thousand).
Leased assets include assets leased over the long term with a carrying amount of €142,668 thousand (31 De-cember 2011: €120,742 thousand) that are funded by means of sale-and-leaseback transactions with leasing
companies and leased assets with a residual value of €48,653 thousand (31 December 2011: €46,612 thousand) that are largely funded internally or by means of bank loans.
Leased assets resulted in non-cancellable lease obligations from customers amounting to €189,600 thousand (31 December 2011: €162,140 thousand).
Leased assets
€ thousand 2012 2011
Balance as at 1/1/ 167,354 156,125
Group changes 0 3,110Currency translation adjustments 708 -451Additions 135,096 87,897Disposals -60,589 -28,642Depreciation -51,171 -49,961Reclassification -76 -724
Balance as at 31/12/ 191,322 167,354
Gross carrying amount as at 31/12/ 453,945 455,893Accumulated depreciation -262,623 -288,539
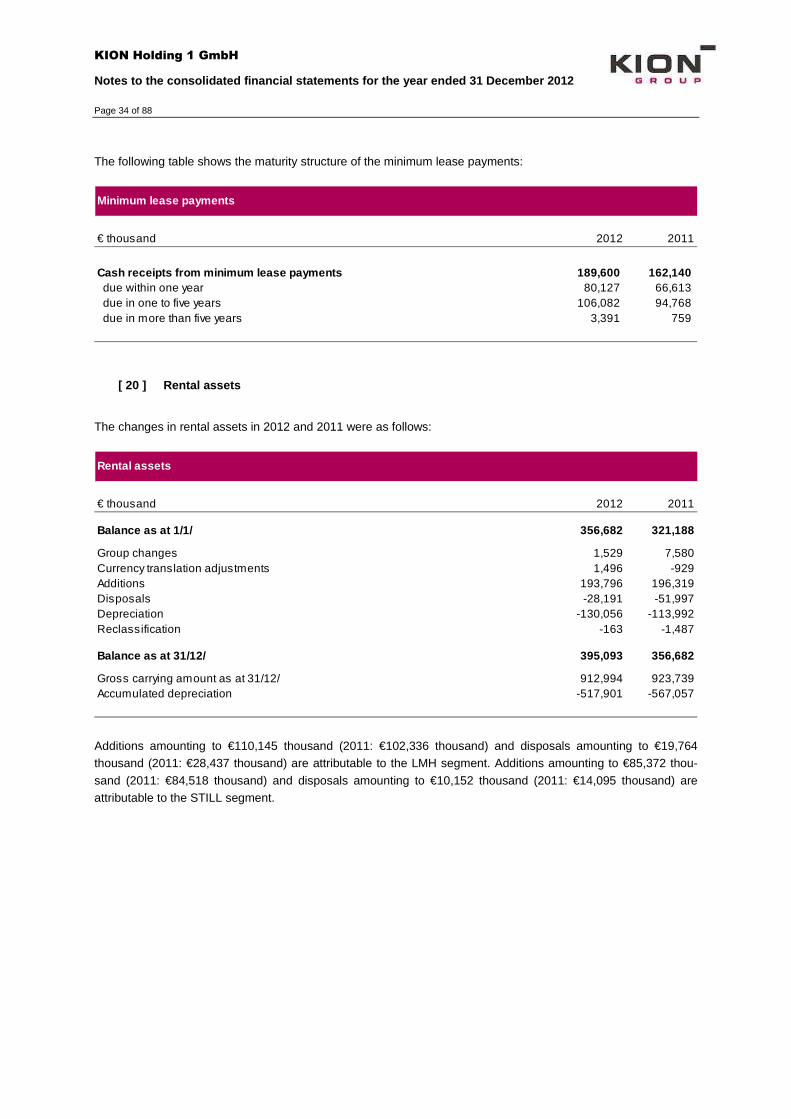
KION Holding 1 GmbH Notes to the consolidated financial statements for the year ended 31 December 2012
Page 34 of 88
The following table shows the maturity structure of the minimum lease payments:
[ 20 ] Rental assets
The changes in rental assets in 2012 and 2011 were as follows:
Additions amounting to €110,145 thousand (2011: €102,336 thousand) and disposals amounting to €19,764 thousand (2011: €28,437 thousand) are attributable to the LMH segment. Additions amounting to €85,372 thou-
sand (2011: €84,518 thousand) and disposals amounting to €10,152 thousand (2011: €14,095 thousand) are attributable to the STILL segment.
Minimum lease payments
€ thousand 2012 2011
Cash receipts from minimum lease payments 189,600 162,140 due within one year 80,127 66,613 due in one to five years 106,082 94,768 due in more than five years 3,391 759
Rental assets
€ thousand 2012 2011
Balance as at 1/1/ 356,682 321,188
Group changes 1,529 7,580Currency translation adjustments 1,496 -929Additions 193,796 196,319Disposals -28,191 -51,997Depreciation -130,056 -113,992Reclassification -163 -1,487
Balance as at 31/12/ 395,093 356,682
Gross carrying amount as at 31/12/ 912,994 923,739Accumulated depreciation -517,901 -567,057

KION Holding 1 GmbH Notes to the consolidated financial statements for the year ended 31 December 2012
Page 35 of 88
The breakdown of rental assets by contract type is shown in the following table:
Rental assets comprises assets resulting from short-term rentals ('operating leases as lessor') and assets for which significant risks and rewards remain with the KION Group although they were sold ('sale with risk').
Rental assets broken down by contract types
€ thousand 2012 2011 2012 2011 2012 2011
Industrial trucks 323,647 287,913 66,760 66,466 390,407 354,379
Truck equipment 4,585 2,066 101 237 4,686 2,303
Total rental assets 328,232 289,979 66,861 66,703 395,09 3 356,682
Operating leases as lessor
Sale with risk Total
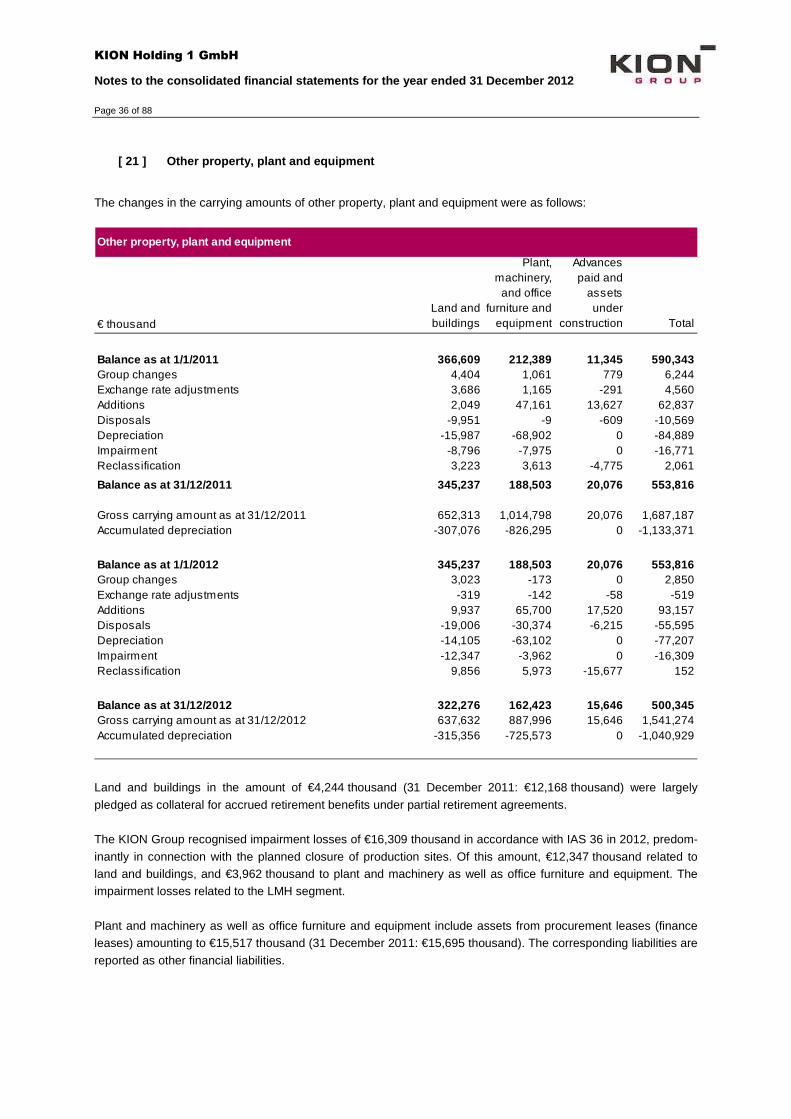
KION Holding 1 GmbH Notes to the consolidated financial statements for the year ended 31 December 2012
Page 36 of 88
[ 21 ] Other property, plant and equipment
The changes in the carrying amounts of other property, plant and equipment were as follows:
Land and buildings in the amount of €4,244 thousand (31 December 2011: €12,168 thousand) were largely
pledged as collateral for accrued retirement benefits under partial retirement agreements. The KION Group recognised impairment losses of €16,309 thousand in accordance with IAS 36 in 2012, predom-
inantly in connection with the planned closure of production sites. Of this amount, €12,347 thousand related to land and buildings, and €3,962 thousand to plant and machinery as well as office furniture and equipment. The impairment losses related to the LMH segment.
Plant and machinery as well as office furniture and equipment include assets from procurement leases (finance leases) amounting to €15,517 thousand (31 December 2011: €15,695 thousand). The corresponding liabilities are
reported as other financial liabilities.
Other property, plant and equipment
€ thousandLand and buildings
Plant, machinery,
and office furniture and
equipment
Advances paid and
assets under
construction Total
Balance as at 1/1/2011 366,609 212,389 11,345 590,343Group changes 4,404 1,061 779 6,244Exchange rate adjustments 3,686 1,165 -291 4,560Additions 2,049 47,161 13,627 62,837Disposals -9,951 -9 -609 -10,569Depreciation -15,987 -68,902 0 -84,889Impairment -8,796 -7,975 0 -16,771Reclassification 3,223 3,613 -4,775 2,061
Balance as at 31/12/2011 345,237 188,503 20,076 553,816
Gross carrying amount as at 31/12/2011 652,313 1,014,798 20,076 1,687,187Accumulated depreciation -307,076 -826,295 0 -1,133,371
Balance as at 1/1/2012 345,237 188,503 20,076 553,816Group changes 3,023 -173 0 2,850Exchange rate adjustments -319 -142 -58 -519Additions 9,937 65,700 17,520 93,157Disposals -19,006 -30,374 -6,215 -55,595Depreciation -14,105 -63,102 0 -77,207Impairment -12,347 -3,962 0 -16,309Reclassification 9,856 5,973 -15,677 152
Balance as at 31/12/2012 322,276 162,423 15,646 500,345Gross carrying amount as at 31/12/2012 637,632 887,996 15,646 1,541,274Accumulated depreciation -315,356 -725,573 0 -1,040,929

KION Holding 1 GmbH Notes to the consolidated financial statements for the year ended 31 December 2012
Page 37 of 88
[ 22 ] At-Equity-accounted investments
The KION Group reported at-equity investments with a total carrying amount of €154,835 thousand as at 31 December 2012 (31 December 2011: €36,545 thousand). These associates and joint ventures are included in the
list of shareholdings in the annex to these notes. Their key figures are as follows:
The figures shown in the table are based on a notional 100 per cent investment.
The significant increase in the carrying amount of the associates mainly resulted from the remaining shares (30 per cent) in Linde Hydraulics, which were measured at their fair value of €116,143 thousand and will be account-ed for using the equity method on a going-forward basis.
At-Equity investments
€ thousand 2012 2011
Associates (100 percent)
Revenue 569,374 540,068Net income 15,260 10,960
Assets 1,073,037 576,103Liabilities 712,873 494,021
Joint ventures (100 percent)
Revenue 132,036 107,874Net income 4,764 5,612
Assets 54,999 51,546 non-current assets 24,209 25,115 current assets 30,790 26,431Liabilities 30,225 26,223 non-current liabilities 4,744 2,699 current liabilities 25,481 23,524

KION Holding 1 GmbH Notes to the consolidated financial statements for the year ended 31 December 2012
Page 38 of 88
[ 23 ] Lease receivables
For leases where KION Group companies lease assets directly to customers as part of the Group's financing activities, the Group's net investment in the lease is reported as a lease receivable.
The amounts recognised as lease receivables are based on the following data:
Gross investments include minimum lease payments from non-cancellable sub-leases amounting to €345,499 thousand (31 December 2011: €326,930 thousand).
Lease receivables include the unguaranteed residual values accruing to the benefit of the KION Group in the amount of €44,051 thousand (31 December 2011: €38,714 thousand).
Lease receivables
€ thousand 2012 2011
Gross investments 443,452 399,726 due within one year 150,995 135,897 due in one to five years 282,293 254,724 due in more than five years 10,164 9,105
Present value of outstanding minimum lease payments 399,269 361,221 due within one year 132,129 118,381 due in one to five years 257,328 234,043 due in more than five years 9,812 8,797
Unrealised financial income 44,183 38,505

KION Holding 1 GmbH Notes to the consolidated financial statements for the year ended 31 December 2012
Page 39 of 88
[ 24 ] Other financial assets
Other financial assets of €156,949 thousand (31 December 2011: €132,828 thousand) are comprised of the following:
Pension assets relate to asset surpluses from defined benefit plans. At the reporting date, the present values of
defined benefit obligations are netted against the fair value of plan assets. If the plan assets exceed the obliga-tion, this results in an asset.
The non-current derivative financial instruments include the put option for the remaining shares in Linde Hydrau-lics amounting to €19,740 thousand (2011: €0 thousand).
The sundry financial assets essentially include receivables from value added tax amounting to €37,178 thousand (2011: €21,782 thousand) and non-derivative financial receivables amounting to €35,236 thousand (31 December 2011: €36,237 thousand) that are within the scope of IFRS 7.
Other financial assets
€ thousand 2012 2011
Pension assets 22,759 19,958Investments in affiliated companies 3,919 1,956Other investments 2,253 2,253Loans receivable 730 795Non-current securities 770 770Derivative financial instruments 19,740 0
Other non-current financial assets 50,171 25,732
Derivative financial instruments 4,202 23,277Financial receivables from affiliated companies and related companies 8,477 4,277Financial receivables from third parties 1,110 1,074Deferred charges and prepaid expenses 20,357 14,030Sundry financial assets 72,632 64,438
Other current financial assets 106,778 107,096
Total other financial assets 156,949 132,828

KION Holding 1 GmbH Notes to the consolidated financial statements for the year ended 31 December 2012
Page 40 of 88
[ 25 ] Inventories
The reported inventories are comprised of the following:
The year-on-year reduction in inventories was mainly attributable to disposals in the amount of €56,626 thousand in connection with the sale of the controlling interest (70 per cent) in Linde Hydraulics.
[ 26 ] Trade receivables
The trade receivables are comprised of the following:
Valuation allowances of €50,532 thousand (31 December 2011: €49,565 thousand) were recognised for trade receivables.
Inventories
€ thousand 2012 2011
Materials and supplies 119,980 150,949Work in progress 74,954 98,387Finished goods and merchandise 349,049 370,714Advances paid 5,944 5,319
Total inventories 549,927 625,369
Trade receivables
€ thousand 2012 2011
Receivables from third parties 607,303 651,560 thereof receivables from third parties before valuation allowances 657,835 701,125 thereof valuation allowances for overdue receivables > 90 days ≤ 180 days -7,620 -9,242 thereof valuation allowances for overdue receivables > 180 days -27,512 -27,988 thereof other valuation allowances for receivables -15,400 -12,335 Trade receivables from affiliated companies 3,487 3,150Trade receivables from investments in associated companies and joint ventures 14,672 21,843
Total trade receivables 625,462 676,553
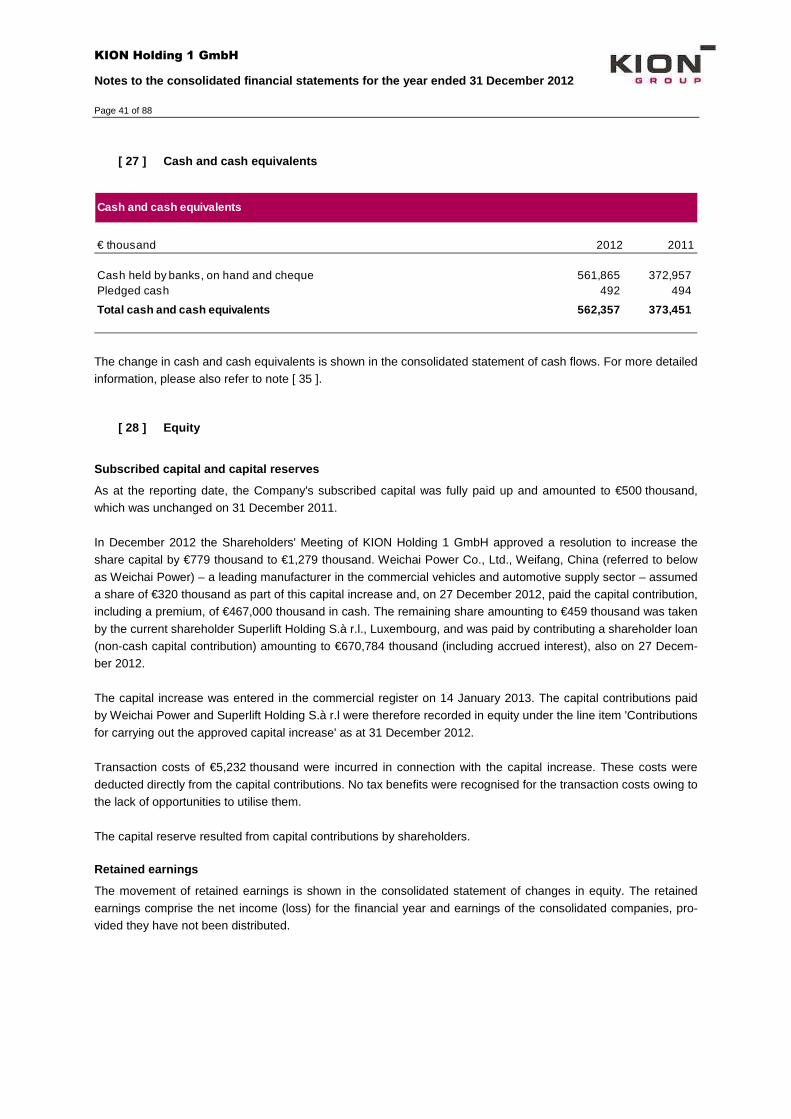
KION Holding 1 GmbH Notes to the consolidated financial statements for the year ended 31 December 2012
Page 41 of 88
[ 27 ] Cash and cash equivalents
The change in cash and cash equivalents is shown in the consolidated statement of cash flows. For more detailed information, please also refer to note [ 35 ].
[ 28 ] Equity
Subscribed capital and capital reserves
As at the reporting date, the Company's subscribed capital was fully paid up and amounted to €500 thousand, which was unchanged on 31 December 2011.
In December 2012 the Shareholders' Meeting of KION Holding 1 GmbH approved a resolution to increase the share capital by €779 thousand to €1,279 thousand. Weichai Power Co., Ltd., Weifang, China (referred to below
as Weichai Power) – a leading manufacturer in the commercial vehicles and automotive supply sector – assumed a share of €320 thousand as part of this capital increase and, on 27 December 2012, paid the capital contribution, including a premium, of €467,000 thousand in cash. The remaining share amounting to €459 thousand was taken
by the current shareholder Superlift Holding S.à r.l., Luxembourg, and was paid by contributing a shareholder loan (non-cash capital contribution) amounting to €670,784 thousand (including accrued interest), also on 27 Decem-ber 2012.
The capital increase was entered in the commercial register on 14 January 2013. The capital contributions paid by Weichai Power and Superlift Holding S.à r.l were therefore recorded in equity under the line item 'Contributions
for carrying out the approved capital increase' as at 31 December 2012. Transaction costs of €5,232 thousand were incurred in connection with the capital increase. These costs were
deducted directly from the capital contributions. No tax benefits were recognised for the transaction costs owing to the lack of opportunities to utilise them.
The capital reserve resulted from capital contributions by shareholders.
Retained earnings
The movement of retained earnings is shown in the consolidated statement of changes in equity. The retained
earnings comprise the net income (loss) for the financial year and earnings of the consolidated companies, pro-vided they have not been distributed.
Cash and cash equivalents
€ thousand 2012 2011
Cash held by banks, on hand and cheque 561,865 372,957Pledged cash 492 494
Total cash and cash equivalents 562,357 373,451

KION Holding 1 GmbH Notes to the consolidated financial statements for the year ended 31 December 2012
Page 42 of 88
Accumulated other comprehensive income (loss)
Accumulated other comprehensive income (loss) includes the currency translation differences arising from the translation of the financial statements of foreign subsidiaries, the effects of the fair value measurement of deriva-
tive financial instruments, the profit (loss) from at-equity investments, and the actuarial gains and losses in con-nection with defined benefit pension obligations.
Non-controlling interests
Non-controlling interests in companies in the KION Group amounted to €6,159 thousand (31 December 2011: €7,077 thousand).
[ 29 ] Retirement benefit obligation
The retirement benefit obligation is recognised for obligations to provide current and future post-employment benefits. Post-employment benefit plans are classified as either defined benefit plans or defined contribution plans, depending on the substance of the plan as derived from its principal terms and conditions.
Defined contribution plans
In the case of defined-contribution pension plans, the Group pays contributions to government or private pension insurance providers based on statutory or contractual provisions, or on a voluntary basis. The Group does not
enter into any obligations above and beyond the payment of contributions to an external pension fund. The amount of future pension benefits is based solely on the amount of the contributions paid by the employer (and in some cases the beneficiaries themselves) to the external pension fund, including income from the investment of
these contributions. The total expense arising from defined contribution plans amounted to €63,895 thousand in 2012 (2011: €56,118 thousand). Of this total, contributions paid by employers into government-run plans amount-ed to €59,682 thousand (2011: €53,337 thousand). The defined contribution plan expense is reported within the
functional costs.
Defined benefit plans
The KION Group currently grants pensions to almost all employees in Germany and a number of foreign employ-
ees. These pensions consist of fixed benefit entitlements and are therefore reported as defined benefit plans in accordance with IFRS. For all of the significant defined benefit plans within the Group, the benefits granted to employees are determined on the basis of their individual income, i.e. either directly or by way of intermediate
benefit arrangements. In accordance with IAS 19 ('Employee Benefits'), pension provisions are recognised to cover obligations arising
from the current and future pension entitlements of active and former employees of the KION Group and their surviving dependants.
Some of KION Group's pension obligations in Germany are financed by way of contractual trust arrangements (CTAs), which qualify as plan assets within the meaning of IAS 19. In the United Kingdom, Switzerland and the Netherlands, significant plan assets are invested in external pension funds with restricted access.

KION Holding 1 GmbH Notes to the consolidated financial statements for the year ended 31 December 2012
Page 43 of 88
In the case of defined benefit plans, the beneficiaries are granted a specific benefit by the Group or an external pension fund. Due to future salary increases, the benefit entitlement at the retirement age of the beneficiary is likely to be higher than the amount granted as at the reporting date. Pensions are often adjusted after an employ-
ee reaches retirement age. The amount of the Group's obligation, which is defined as the actuarial present value of the obligation to provide the level of benefits currently earned by each beneficiary, is expressed as the present value of the defined benefit obligation, which includes adjustments for future salary and pension increases.
Measurement assumptions
The discount rate used to calculate the defined benefit obligation at each reporting date is determined on the basis of current capital market data and long-term assumptions about future salary and pension increases in
accordance with the best estimate principle. These assumptions vary depending on the economic conditions affecting the currency in which benefit obligations are denominated and in which fund assets are invested, as well as capital market expectations.
Benefit obligations are calculated on the basis of current mortality probabilities as determined in accordance with actuarial principles. The calculations also include assumptions about future employee turnover based on employ-
ee age and years of service and about the probability of retirement. The defined benefit obligation is calculated on the basis of the following weighted-average assumptions as at the reporting date:
The assumed discount rate is determined on the basis of the yield as at the reporting date on investment-grade, fixed-interest corporate bonds with maturities that match the expected maturities of the pension obligations.
Pension obligations in foreign companies are calculated on a comparable basis taking into account any country-specific requirements.
The rate of remuneration increase relates to expected future increases in salaries, which are estimated on an annual basis taking into account factors such as inflation and the overall economic situation.
The mortality rates used in the calculation are based on published country-specific statistics and empirical values. Since 31 December 2009, the modified Heubeck 2005 G mortality tables have been used in Germany as the biometric basis; the modified tables include a somewhat higher life expectancy for males than the unmodified
tables. The actuarial assumptions not listed in the table above, such as employee turnover, invalidity, etc., are deter-
mined in accordance with recognised forecasts in each country, taking into account the circumstances and fore-casts of the companies concerned.
Assumptions underlying provisions for pensions and other postemployment benefits
2012 2011 2012 2011 2012 2011
Discount rate 3.50% 5.65% 4.35% 4.85% 2.57% 4.01%
Rate of remuneration increase 2.75% 2.75% 4.17% 4.18% 2.36% 2.31%
Rate of pension increase 1.75% 1.75% 2.94% 3.18% 0.26% 0.38%
Germany UK Other

KION Holding 1 GmbH Notes to the consolidated financial statements for the year ended 31 December 2012
Page 44 of 88
The assumptions applied in calculating the defined benefit obligation as at the valuation date (31 December of the previous year) also apply to the calculation of the interest cost and the cost of pension entitlements arising in the current year (current service cost).
Differences between the forecast and actual change in the defined benefit obligation and changes in related plan assets (actuarial gains and losses) are recognised immediately in other comprehensive income in accordance
with IAS 19. This ensures that the pension liability on the face of the statement of financial position is always the actuarial present value of obligations not covered by assets.
In the case of external financed pension funds, the actuarial present value of the pension obligations as calculat-ed in accordance with the projected unit credit method is reduced by the fair value of the assets of the external pension plan. If the assets of the external pension funds exceed the pension obligations, a corresponding asset is
recognised in accordance with IAS 19. IAS 19.58 in conjunction with the supplementary explanatory information in IFRIC 14 states that the recognition of an asset for this excess of pension plan assets over pension obligations is only permitted if the company concerned is entitled to receive a refund of this excess or a reduction in future
contributions in its function as the employer responsible for the benefits under the plan. If pension obligations are not covered by the assets of an external pension funds, the net obligation is reported in pension provisions.
In the defined benefit plans in the UK, plan assets exceed the pension obligations. However the pension asset ceiling prescribed under IFRS limiting the asset to be recognised on the statement of financial position did not have an impact on these plans.

KION Holding 1 GmbH Notes to the consolidated financial statements for the year ended 31 December 2012
Page 45 of 88
Statement of financial position
The change in the present value of the defined benefit obligation is as follows:
The significant increase in the present value of the obligation caused by actuarial losses is largely attributable to the low discount rates for German pension plans compared with the previous year.
Changes in defined benefit obligation
€ thousand 2012 2011 2012 2011 2012 2011 2012 2011
Present value of defined benefitobligation as at January 1 389,271 381,913 390,396 362, 716 79,362 75,681 859,029 820,310Group changes -67,354 − -6,866 − -247 284 -74,467 284
Exchange differences − − 10,265 10,769 197 973 10,462 11,742
Current service cost 11,881 11,894 1,443 1,245 2,919 3,103 16,243 16,242
Interest cost 21,680 20,526 19,061 19,132 3,068 2,778 43,809 42,436
Employee contributions − − 84 135 834 781 918 916
Actuarial gains (-) and losses (+) 201,473 -14,150 21,707 12,665 17,471 103 240,651 -1,382
Pension benefits paid by the Company -11,306 -10,697 − − -2,255 -1,946 -13,561 -12,643
Pension benefits paid from plan assets − − -16,947 -16,312 -2,972 -1,584 -19,919 -17,896
Liability transfer out to third parties -232 -215 − − − − -232 -215
Past service cost (+) and income (-) − − 327 46 − − 327 46
Gains (-) / losses (+) on the curtailment of a plan − − − − − -811 − -811
Present value of defined benefitobligation as at December 31 545,413 389,271 419,470 39 0,396 98,377 79,362 1,063,260 859,029
thereof unfunded 231,397 177,739 − − 28,186 22,148 259,583 199,887
thereof funded 314,016 211,532 419,470 390,396 70,191 57,214 803,677 659,142
Germany UK Other Total

KION Holding 1 GmbH Notes to the consolidated financial statements for the year ended 31 December 2012
Page 46 of 88
The following table shows the change in the fair value of plan assets:
In 2012 employer's contributions in the United Kingdom, which amounted to €7,299 thousand, included payments
of €4,931 thousand into pension funds on the basis of contractual agreements. Decisions on additions to plan assets take into account the change in plan assets and pension obligations. For companies outside Germany, decisions also take into account the statutory minimum coverage requirements and the amounts deductible under
local tax rules. The payments expected for the following year amount to €24,501 thousand (2012: €21,845 thousand), which
include expected employers' contributions of €11,195 thousand to plan assets (2012: €8,831 thousand) and expected direct payments of pension benefits amounting to €13,306 thousand (2012: €13,014 thousand) that are not covered by corresponding reimbursements from plan assets. According to local measurement rules, there
continue to be gaps in the coverage of four plans in the United Kingdom and as a result the expected employer's contributions in 2013 include payments of €7,595 thousand in line with the agreements reached with the trustees. Moreover, KION GROUP GmbH, Wiesbaden, gave an unsecured guarantee for these four UK plans in 2012. This
guarantee covers the future contractual payments of the KION Group and employees up to an upper limit of around €75,000 thousand. This upper limit will be reduced by the payments made by the KION Group. At the reporting date, the upper limit for the guarantee had therefore decreased to €58,067 thousand. The likelihood of
the guarantee being used is deemed low in view of the position of the individual companies against the backdrop of their current and future financial and earnings situations.
Changes in plan assets
€ thousand 2012 2011 2012 2011 2012 2011 2012 2011
Fair value of plan assets as at 1 January 38,217 34,956 406,404 369,270 50,309 50,9 07 494,930 455,133Group changes -1,834 − -4,093 − − − -5,927 −
Exchange differences − − 10,680 11,309 185 842 10,865 12,151
Expected return on plan assets 2,184 1,936 18,296 18,736 2,251 2,060 22,731 22,732
Actuarial gains (+) and losses (-) 1,449 1,325 17,786 17,364 6,077 -4,975 25,312 13,714
Employer contributions − − 7,299 5,902 2,219 2,278 9,518 8,180
Employee contributions − − 84 135 834 781 918 916
Pension benefits paid by funds − − -16,947 -16,312 -2,972 -1,584 -19,919 -17,896
Fair value of plan assets as at 31 December 40,016 38,217 439,509 406,404 58,903 50 ,309 538,428 494,930
Germany UK Other Total

KION Holding 1 GmbH Notes to the consolidated financial statements for the year ended 31 December 2012
Page 47 of 88
The reconciliation of funded status and net defined benefit obligation to the amounts reported on the face of the consolidated statement of financial position as at 31 December is shown in the following table:
In addition, the KION pension plan for employees of the KION Group in Germany holds plan assets of
€19,486 thousand (2011: €18,474 thousand) which are wholly offset by corresponding liabilities relating to the direct pension entitlement plan.
Statement of cash flows
In the case of obligations not covered by external assets, payments to beneficiaries are made directly by the Company and therefore have an impact on cash flows from operating activities. If the benefit obligations are backed by external assets, the payments are made from existing plan assets and have no effect on the Compa-
ny's cash flow. Instead, any contributions made to the external pension fund by the Company result in net cash used for operating activities.
During the reporting year, pension benefits of €33,480 thousand (2011: €30,539 thousand) were paid in connec-tion with the main pension entitlements in the KION Group, of which €13,561 thousand (2011: €12,643 thousand) was paid directly by the Company and €19,919 thousand (2011: €17,896 thousand) was paid from plan assets.
Cash contributions to plan assets in 2012 amounted to €9,518 thousand (2011: €8,180 thousand). Furthermore, pension benefit payments totalling €232 thousand (2011: €215 thousand) were transferred to external pension funds.
Income statement
In accordance with IAS 19, actuarial computations are performed for benefit obligations in order to determine the amount to be expensed in each period in a systematic way. The expenses recognised in the income statement for
pensions and similar obligations consist of a number of components that are calculated and disclosed separately.
Funded status and net defined benefit obligation
€ thousand 2012 2011 2012 2011 2012 2011 2012 2011
Present value of the partially or fully funded defined benefit obligation 314,016 211,532 419,470 390,396 70,191 57,214 803,677 659,142
Fair value of plan assets 40,016 38,217 439,509 406,404 58,903 50,309 538,428 494,930
Surplus (-) / deficit (+) 274,000 173,315 -20,039 -16, 008 11,288 6,905 265,249 164,212
Present value of the unfunded defined benefit obligation 231,397 177,739 − − 28,186 22,148 259,583 199,887
Surplus (-) / deficit (+) total 505,397 351,054 -20,03 9 -16,008 39,474 29,053 524,832 364,099
Unrecognised past service cost (-) and income (+) − − − − -1,071 -1,143 -1,071 -1,143
Net defined benefit obligation as at 31 December 505,397 351,054 -20,039 -16,008 38,4 03 27,910 523,761 362,956
Reported as “retirement benefit obligation“ 505,397 351,054 2,720 3,950 38,403 27,910 546,520 382,914
Reported as “Other non-current f inancial assets“ − − -22,759 -19,958 − − -22,759 -19,958
Germany UK Other Total

KION Holding 1 GmbH Notes to the consolidated financial statements for the year ended 31 December 2012
Page 48 of 88
The service cost is the new pension entitlement arising in the financial year and is recognised in the income statement. It is calculated as the actuarial present value of that proportion of the expected defined benefit obliga-tion when the pension is paid attributable to the year under review on the basis of the maximum length of service
achievable by each employee. The interest cost, i.e. the expense arising from the increase in the defined benefit obligation at the end of the
previous year using the discount rate assumed for the year under review, is recognised in the income statement, as is the expected return on plan assets in the case of benefits covered by external assets.
An unrecognised past service cost arises if there is a change to the pension entitlement. The breakdown of the net cost of the defined benefit obligation (expenses less income) recognised in the income
statement for 2012 is as follows:
Overall, the KION Group reported an expense of €21,078 thousand (2011: €19,704 thousand) under net financial income/expenses. This amount comprised the interest cost and the expected return on plan assets. All other
components of pension expenses are recognised under the functional costs. The actual total return on plan assets in 2012 was €48,043 thousand (2011: €36,446 thousand).
Cost of defined benefit obligation
€ thousand 2012 2011 2012 2011 2012 2011 2012 2011
Current service cost 11,881 11,894 1,443 1,245 2,919 3,103 16,243 16,242
Interest cost 21,680 20,526 19,061 19,132 3,068 2,778 43,809 42,436
Expected return on plan assets -2,184 -1,936 -18,296 -18,736 -2,251 -2,060 -22,731 -22,732
Past service cost (+) and income (-) − − 327 46 72 131 399 177
Gains (-) or losses (+) on the curtailment of a plan − − − − − -708 − -708
Total cost of defined benefit obligation 31,377 30,484 2,535 1,687 3,8 08 3,244 37,720 35,415
Germany UK Other Total

KION Holding 1 GmbH Notes to the consolidated financial statements for the year ended 31 December 2012
Page 49 of 88
Other comprehensive income (loss)
The breakdown of actuarial gains and losses on the defined benefit obligation recognised in the statement of comprehensive income in 2012 are as follows:
The changes in estimates relating to defined benefit pension entitlements resulted in a €151,311 thousand de-
crease in equity as at 31 December 2012 (after deferred taxes). Of this decrease, €151,267 thousand related to shares held by the shareholders of KION Holding 1 GmbH and €44 thousand to non controlling interests.
Additional disclosures
The plan assets of the main pension plans consist of the following components:
The plan assets do not include any real estate or other assets used by the KION Group itself. The Other category largely comprises inflation-linked UK government bonds for the four large plans in the United Kingdom.
Accumulated other comprehensive income (loss)
€ thousand 2012 2011 2012 2011 2012 2011 2012 2011
Accumulated other comprehensive income/loss as at 1 January 81,458 65,983 -37,014 -40, 769 -10,160 -4,925 34,284 20,289Group changes − − 2,235 − − − 2,235 −
Gains(-) and losses(+) on the measurement of defined benefit obligation -201,473 14,150 -21,707 -12,665 -17,471 -103 -240,651 1,382
Gains (+) and losses (-) on plan assets 1,449 1,325 17,786 17,364 6,077 -4,975 25,312 13,714
Exchange dif ferences − − -965 -944 -40 -157 -1,005 -1,101
Accumulated other comprehensive income/loss as at 31 December -118,566 81,458 -39,665 -37,014 -21,594 -10,160 -179,825 34,284
Germany UK Other Total
Fair value of plan assets
€ thousand 2012 2011 2012 2011 2012 2011 2012 2011
Securities 7,134 6,862 86,922 73,583 8,462 7,187 102,518 87,632
Fixed-income securities 18,301 12,580 259,556 267,739 11,743 11,499 289,600 291,818
Real estate 1,551 2,859 − 331 3,888 3,593 5,439 6,783
Insurance policies − − − − 32,600 26,353 32,600 26,353
Other 13,030 15,916 93,031 64,751 2,210 1,677 108,271 82,344
Total plan assets 40,016 38,217 439,509 406,404 58,903 50 ,309 538,428 494,930
Germany UK Other Total

KION Holding 1 GmbH Notes to the consolidated financial statements for the year ended 31 December 2012
Page 50 of 88
The expected return in 2012 and 2011 for the main investment categories of plan assets are as follows:
The expected return on plan assets was determined on the basis of the plan's policy regarding the asset classes in which it invests. Expected returns are based on the current yields on government bonds with corresponding maturities, adjusted for specific credit spreads for the different asset classes. The expected return on plan assets
is recognised as income in the relevant period. The differences between expected and actual income on plan assets represent experience adjustments and are recognised in other comprehensive income in the year in which they arise.
The present value of the defined benefit obligation is based on the assumptions detailed above. If the discount rate were to increase or decrease by a quarter of one percentage point (rising to 3.75 per cent or falling to 3.25
per cent in the case of Germany as at 31 December 2012), pension entitlements would be €43,458 thousand (2011: €35,632 thousand) lower or €45,463 thousand (2011: €35,747 thousand) higher, respectively. Other com-prehensive loss (2011: gain) after tax would be €31,611 thousand (2011: €25,999 thousand) higher or
€33,081 thousand (2011: €26,036 thousand) lower.
Expected return on plan assets
2012 2011 2012 2011 2012 2011
Securities 7.35% 7.45% 5.77% 6.73% 6.80% 7.10%
Fixed-income securities 3.74% 3.50% 4.31% 4.81% 2.40% 2.90%
Real estate 5.10% 5.20% 6.50% 6.50% 4.60% 4.60%
Insurance policies − − − − 4.69% 3.88%
Other 6.68% 6.68% 3.19% 4.17% 6.00% 6.40%
Weighted average expected return 5.71% 5.54% 4.43% 5.21 % 4.51% 4.26%
Germany UK Other

KION Holding 1 GmbH Notes to the consolidated financial statements for the year ended 31 December 2012
Page 51 of 88
Five-year overview
The following table shows a five-year overview of experience adjustments arising from the differences between actuarial assumptions and actual circumstances:
While the actuarial gains and losses on the present value of the obligation only partially result in part from experi-ence adjustments, the actuarial gains or losses on the fair value of the plan asset are entirely attributable to experience adjustments.
Five-year overview
€ thousand 2012 2011 2010 2009 2008
Present value of defined benefit obligation as at 31 December 1,063,260 859,029 820,310 722,779 629,198
Experience adjustments arising on the plan liabilities 6,566 144 -76 4,858 39
Fair value of plan assets as at 31 December 538,428 494,930 455,133 401,510 320,248
Experience adjustments arising on the plan assets 25,312 13,714 17,350 51,763 -107,388
Surplus (-) / deficit (+) in total 524,832 364,099 365 ,177 321,269 308,950
Unrecognised past service cost (-) and income (+) -1,071 -1,143 -1,377 40 −
Net defined benefit obligation as at 31 December 523,761 362,956 363,800 321,309 308,950

KION Holding 1 GmbH Notes to the consolidated financial statements for the year ended 31 December 2012
Page 52 of 88
[ 30 ] Financial liabilities and shareholder loan
The financial liabilities reported by the KION Group essentially comprise interest-bearing liabilities to banks and capital market liabilities in connection with the corporate bond that was issued. The liabilities to banks stem large-
ly from a loan agreement. The table below shows the contractual maturity structure of the financial liabilities and the shareholder loan.
Loan agreement
In connection with its acquisition of Linde AG's material-handling business the KION Group signed a loan agree-ment (a senior facilities agreement and a subordinated facility agreement, referred to below as 'SFA') for a total original amount of €3,300,000 thousand with the lead banks Barclays Bank Plc, Bayerische Hypo- und Vereins-
bank AG, Credit Suisse (London branch), Goldman Sachs International Bank, Lehman Commercial Paper Inc. (UK branch) and Mizuho Corporate Bank Ltd. on 23 December 2006. The loans provided under the SFA carry variable interest rates. Transaction costs of €23,637 thousand (2011: €20,175 thousand) reduced the carrying
amount of the loans as at the reporting date. These costs have been allocated pro rata to each of the tranches and expensed over their respective terms.
Maturity structure of financial liabilities and sha reholder loan
€ thousand 2012 2011
Liabilities to banks 1,858,448 2,509,889 due within one year 51,152 223,979 due in one to five years 1,692,072 2,285,910 due in more than five years 115,224 0
Corporate bond 489,495 487,508 due within one year 0 0 due in one to five years 0 0 due in more than five years 489,495 487,508
Other financial liabilities 4,488 7,333 due within one year 623 3,397 due in one to five years 0 0 due in more than five years 3,865 3,936
Total current financial liabilities 51,775 227,376
Total non-current financial liabilities 2,300,656 2,777,354
Liabilities from shareholder loan 0 643,132 due within one year 0 0 due in one to five years 0 0 due in more than five years 0 643,132

KION Holding 1 GmbH Notes to the consolidated financial statements for the year ended 31 December 2012
Page 53 of 88
The following material amendments were made to the SFA in subsequent years: • Under amendments made to the SFA on 8 March 2007 the subordinated facility agreement was totally re-
placed by a senior facilities agreement and unused credit lines totalling €200,000 thousand were returned, thereby reducing the total amount of the SFA to €3,100,000 thousand.
• Under amendments made to the SFA on 23 September 2009 the financial covenants applicable during the
term of the loan were modified. At the same time, an additional credit line of €100,000 thousand and an in-crease in the collateral security provided for this facility were agreed. Furthermore, the interest rates payable on existing credit lines were raised by between 0.25 and 1.50 percentage points. The amounts of these inter-
est-rate increases primarily fall due in the form of bullet payments at maturity (payments in kind, or PIKs). All the interest payable on the new credit line of €100,000 thousand falls due in the form of a bullet payment at maturity. The company making this credit line available is Superlift Funding S.à r.l., Luxembourg, which is a
related party to the KION Group.
In July 2012 the KION Group amended its SFA loan again and extended it, thereby improving the maturity profile
of existing loans. This included a significant part (€186,677 thousand) of the existing revolving credit line, whose maturity was extended from December 2013 to December 2016, and €966,638 thousand of loans under Loan Facilities B and C, whose maturities were extended from December 2014 (Loan Facility B) and December 2015
(Loan Facility C) to December 2017. In addition, the maturity of the €114,097 thousand loan agreed as part of Loan Facility G was extended from December 2016 to June 2018.
In connection with the extension of the loan facilities, additional lines of €113,323 thousand were granted for the revolving credit facility due in December 2016.
Under the terms of the extension of the loan facilities, it was also agreed to increase the interest margins by 1.0 to 1.5 percentage points. The accrued and unpaid interest (payment in kind, PIK) was capitalized for the extended loan facilities. In future, interest will be paid immediately for the extended loans under term loan facilities B2 and
C2. Until 31 December 2012 transaction costs of €12,899 thousand were incurred. These costs have been allocated
pro rata to each of the tranches and expensed over their respective new terms. There were also transaction costs of €1,433 thousand in connection with the revolving credit facility. These are reported as prepaid expenses under current financial assets and are released over the residual term of the revolving credit facility, which is currently
not being utilised.
Corporate bond
The KION Group issued a corporate bond for €500,000 thousand through the consolidated subsidiary KION
Finance S.A., Luxembourg, in April 2011. Of the bond's total par value of €500,000 thousand, €325,000 thousand is repayable at a fixed interest rate of 7.875 per cent p.a., while €175,000 thousand carries a floating interest rate based on the three-month EURIBOR plus a margin of 4.25 percentage points. Interest on the fixed-rate tranche is
paid semi-annually, while interest on the floating-rate tranche is paid quarterly. The bond's principal amount is redeemed as a bullet payment on maturity. Borrowing costs of €10,505 thousand (2011: €12,492 thousand) reduced the carrying amount of the bond as at the reporting date. These costs have been allocated pro rata to
each of the tranches and are expensed over their respective terms. The corresponding liability is reported as a capital market liability.

KION Holding 1 GmbH Notes to the consolidated financial statements for the year ended 31 December 2012
Page 54 of 88
Shareholder loan
KION Holding 1 GmbH and Superlift Holding S.à r.l., Luxembourg, signed an agreement on a shareholder loan for the amount of €500,000 thousand on 27 December 2006. The shareholder loan, amounting to €670,784 thousand
(including accrued interest), was converted into equity with effect from 27 December 2012.
Changes in net financial debt
The KION Group uses “net financial debt” as a key performance indicator for analysing the changes in its financial
liabilities. Net financial debt is defined as the difference between financial liabilities (excluding lease liabilities) and cash and cash equivalents.
The table below gives a breakdown of the KION Group's net financial debt as at 31 December 2012.
The Multicurrency Revolving Credit Facility (€137,604 thousand) drawn down in November 2011 was repaid in 2012. In addition, the Multicurrency Capex Restructuring and Acquisition Facility was reduced by €56,142 thousand. Term Loan Facility D was repaid in full (€202,252 thousand) in December 2012. The financial debt
under Term Loan Facility B1 (denominated in euros) was reduced by €147,897 thousand and the financial debt under term loan facility B1 (denominated in US dollars) was reduced by €123,485 thousand. Repayment of Term Loan Facility B1 (denominated in US dollars) generated foreign currency exchange rate gains of €2,803
thousand, as a result of which the KION Group's total repayments in 2012 amounted to €664,577 thousand.
Net financial debt
€ thousand 2012 2011
Corporate bond - fixed rate (2011/2018) - gross 325,000 325,000Corporate bond - floating rate (2011/2018) - gross 175,000 175,000Liabilities to banks (gross) 1,882,085 2,530,064Liabilities to non-banks (gross) 4,488 7,333./. Capitalized borrowing costs -34,142 -32,667 Financial debt 2,352,431 3,004,730./. Cash and cash equivalents 562,357 373,451Net financial debt 1,790,074 2,631,279
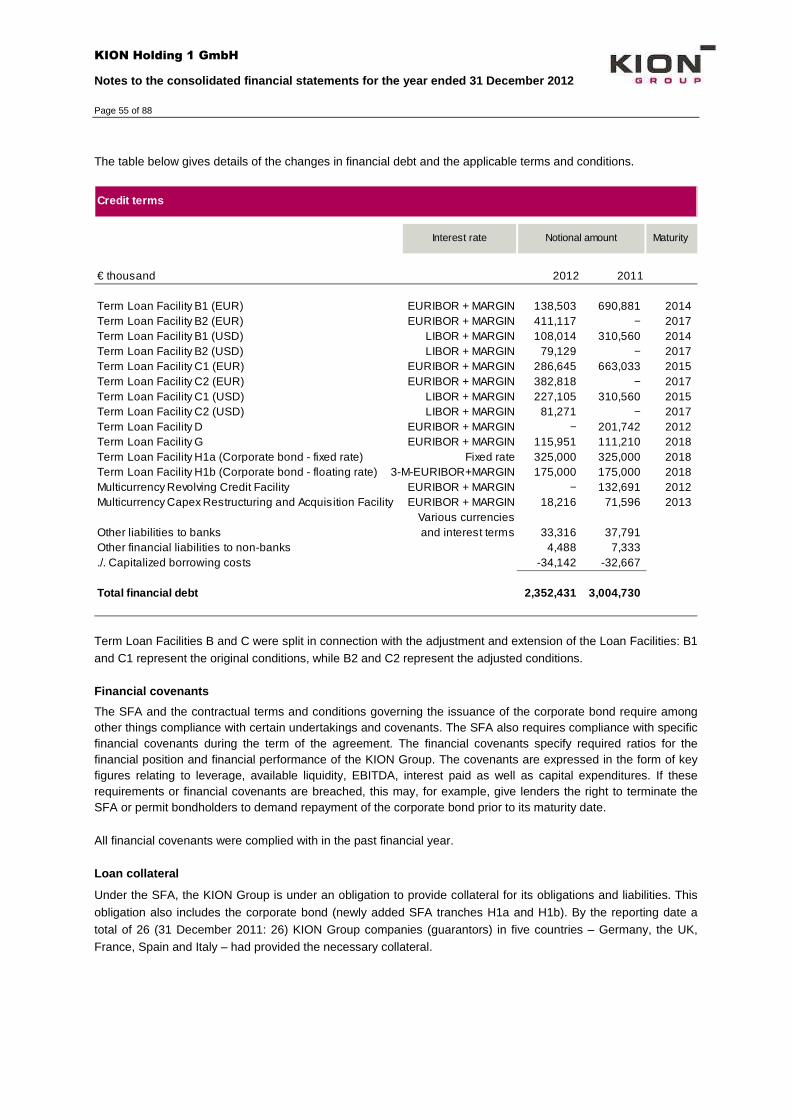
KION Holding 1 GmbH Notes to the consolidated financial statements for the year ended 31 December 2012
Page 55 of 88
The table below gives details of the changes in financial debt and the applicable terms and conditions.
Term Loan Facilities B and C were split in connection with the adjustment and extension of the Loan Facilities: B1 and C1 represent the original conditions, while B2 and C2 represent the adjusted conditions.
Financial covenants
The SFA and the contractual terms and conditions governing the issuance of the corporate bond require among other things compliance with certain undertakings and covenants. The SFA also requires compliance with specific financial covenants during the term of the agreement. The financial covenants specify required ratios for the financial position and financial performance of the KION Group. The covenants are expressed in the form of key figures relating to leverage, available liquidity, EBITDA, interest paid as well as capital expenditures. If these requirements or financial covenants are breached, this may, for example, give lenders the right to terminate the SFA or permit bondholders to demand repayment of the corporate bond prior to its maturity date. All financial covenants were complied with in the past financial year.
Loan collateral
Under the SFA, the KION Group is under an obligation to provide collateral for its obligations and liabilities. This
obligation also includes the corporate bond (newly added SFA tranches H1a and H1b). By the reporting date a total of 26 (31 December 2011: 26) KION Group companies (guarantors) in five countries – Germany, the UK, France, Spain and Italy – had provided the necessary collateral.
Credit terms
Maturity
€ thousand 2012 2011
Term Loan Facility B1 (EUR) EURIBOR + MARGIN 138,503 690,881 2014Term Loan Facility B2 (EUR) EURIBOR + MARGIN 411,117 − 2017Term Loan Facility B1 (USD) LIBOR + MARGIN 108,014 310,560 2014Term Loan Facility B2 (USD) LIBOR + MARGIN 79,129 − 2017Term Loan Facility C1 (EUR) EURIBOR + MARGIN 286,645 663,033 2015Term Loan Facility C2 (EUR) EURIBOR + MARGIN 382,818 − 2017Term Loan Facility C1 (USD) LIBOR + MARGIN 227,105 310,560 2015Term Loan Facility C2 (USD) LIBOR + MARGIN 81,271 − 2017Term Loan Facility D EURIBOR + MARGIN − 201,742 2012Term Loan Facility G EURIBOR + MARGIN 115,951 111,210 2018Term Loan Facility H1a (Corporate bond - fixed rate) Fixed rate 325,000 325,000 2018Term Loan Facility H1b (Corporate bond - floating rate) 3-M-EURIBOR+MARGIN 175,000 175,000 2018Multicurrency Revolving Credit Facility EURIBOR + MARGIN − 132,691 2012Multicurrency Capex Restructuring and Acquisition Facility EURIBOR + MARGIN 18,216 71,596 2013
Other liabilities to banks 33,316 37,791Other financial liabilities to non-banks 4,488 7,333./. Capitalized borrowing costs -34,142 -32,667
Total financial debt 2,352,431 3,004,730
Interest rate Notional amount
Various currencies and interest terms

KION Holding 1 GmbH Notes to the consolidated financial statements for the year ended 31 December 2012
Page 56 of 88
The collateral includes guarantees, the assignment of shares in the guarantors (with the exception of shares in KION GROUP GmbH), the assignment of bank accounts and guarantor receivables, the assignment of claims arising from and in connection with the share purchase agreement between Linde Material Handling GmbH and
Linde AG dated November 5, 2006, relating to the shares in the former KION GROUP GmbH, the assignment of shares in KION Information Management Services GmbH and assignments and transfers of title to intellectual property rights by guarantors in Germany. The statutory provisions in the United Kingdom and the agreements
entered into require that all the assets of the UK guarantors are pledged as security. The carrying amounts of the financial assets pledged as collateral amounted to €600,713 thousand as at the
reporting date (31 December 2011: €791,985 thousand). As had been the case at the end of 2011, no liabilities to banks were secured by pledges of real property at the
end of 2012.
[ 31 ] Lease liabilities
Lease liabilities relate solely to finance lease obligations arising from sale-and-leaseback transactions for the
funding of long-term leases with customers. The amounts recognised as lease liabilities are based on the following data:
Minimum lease payments
€ thousand 2012 2011
Total minimum lease payments (gross) 524,389 490,156 due within one year 166,802 165,739 due in one to five years 344,613 312,512 due in more than five years 12,974 11,905
Present value of minimum lease payments 475,015 446,789 due within one year 145,830 146,728 due in one to five years 316,761 288,506 due in more than five years 12,424 11,555
Interest included in minimum lease payments 49,374 43,367

KION Holding 1 GmbH Notes to the consolidated financial statements for the year ended 31 December 2012
Page 57 of 88
[ 32 ] Other provisions
Other provisions relate to the following items:
The provisions for product warranties include contractual and statutory obligations arising from the sale of indus-
trial trucks and spare parts. It is expected that the majority of the costs will be incurred within the next two years after the reporting date.
The provisions for personnel comprise provisions for partial retirement obligations, long-service awards, annual bonuses, severance pay and redundancy payments. The provision for partial retirement obligations is recognised on the basis of individual contractual arrangements.
Other obligations largely comprise restructuring provisions, provisions for litigations, guarantees and expected losses from onerous contracts.
The KION Group had recognised restructuring provisions (including redundancy payments) of €74,465 thousand in 2011, predominantly in connection with the relocation of production sites. In 2012 it was possible to reverse
€20,083 thousand of this amount following finalisation of the negotiations on the redundancy scheme. In 2012 restructuring provisions (including redundancy payments) amounting to €28,883 thousand were recognised, predominantly in connection with the planned closure of production sites. As a result, total restructuring provisions
(including redundancy payments) came to €65,006 thousand as at 31 December 2012.
Other provisions
Provisions for product warranties
Provisions for personnel
Other obligations
Total other provisions
€ thousand
Balance as at 1/1/2012 74,949 148,103 56,794 279,846 thereof non-current 69,729 16,935 9,504 96,168 thereof current 5,220 131,168 47,290 183,678Changes in group of consolidated entities -454 -4,906 5,644 284Additions 18,001 27,498 33,402 78,901Utilisations -21,590 -40,935 -23,792 -86,317Reversals -6,846 -30,078 -11,053 -47,977Additions to accrued interest 0 2,166 2 2,168Exchange differences 278 0 25 303Other adjustments 43 -11,865 11,622 -200
Balance as at 12/31/2012 64,381 89,983 72,644 227,008 thereof non-current 61,356 18,369 9,395 89,120 thereof current 3,025 71,614 63,249 137,888

KION Holding 1 GmbH Notes to the consolidated financial statements for the year ended 31 December 2012
Page 58 of 88
[ 33 ] Other financial liabilities
Other financial liabilities include the following items:
The current derivative financial instruments include, among other things, two call options on the remaining shares
in Linde Hydraulics amounting to €16,520 thousand (2011: €0 thousand). Other financial liabilities include non-derivative liabilities of €159,202 thousand (31 December 2011: €180,226
thousand) that fall within the scope of IFRS 7. Other financial liabilities also include liabilities arising from the financing of industrial trucks for short-term rental
(reported under liabilities from finance leases) amounting to €263,745 thousand (2011: €222,246 thousand) and residual value obligations amounting to €21,379 thousand (2011: €15,765 thousand). The KION Group has rec-ognised other financial liabilities amounting to €15,216 thousand (31 December 2011: €16,712 thousand) arising
from procurement leases, which are classified as finance leases due to their terms and conditions.
Other financial liabilities
€ thousand 2012 2011
Liabilities from finance leases 208,136 171,070Deferred income 132,662 118,455Sundry other liabilities 4,323 14,264Derivative financial instruments 9,957 −
Other non-current financial liabilities 355,078 303,789
Liabilities from finance leases 92,204 83,653Deferred income 84,357 86,551Personnel liabilities 161,637 128,349Derivative financial instruments 33,613 17,742Social security liabilities 40,460 38,894Tax liabilities 65,857 50,269Advances received from third parties 37,596 41,981Liabilities on bills of exchange 2,295 3,799Liabilities from accrued interest 9,588 10,360Sundry current financial liabilities 29,423 42,490
Other current financial liabilities 557,030 504,088
Total other financial liabilities 912,108 807,877

KION Holding 1 GmbH Notes to the consolidated financial statements for the year ended 31 December 2012
Page 59 of 88
The liabilities from finance leases are based on the following future minimum lease payments:
Minimum lease payments
€ thousand 2012 2011
Total minimum lease payments (gross) 331,558 279,447 due within one year 105,466 94,491 due in one to five years 217,889 178,168 due in more than five years 8,203 6,788
Present value of minimum lease payments 300,340 254,723 due within one year 92,204 83,653 due in one to five years 200,280 164,482 due in more than five years 7,856 6,588
Interest included in minimum lease payments 31,218 24,724

KION Holding 1 GmbH Notes to the consolidated financial statements for the year ended 31 December 2012
Page 60 of 88
[ 34 ] Contingent liabilities and other financial o bligations
Contingent liabilities
Guarantees amounting to €797 thousand (2011: €2,129 thousand) relate to contingent liabilities assumed jointly
with another shareholder of a joint venture.
Litigation
The legal risks arising from the KION Group's business are typical of those faced by any company operating in
this sector. The Company is a party in a number of pending lawsuits in various countries. It cannot assume with any degree of certainty that it will win any of the lawsuits or that the existing risk provision in the form of insurance or provisions will be sufficient in each individual case. However, the Company believes it is remote that these
ongoing lawsuits will result in additional provisions.
Other financial commitments
Contingent liabilities
€ thousand 2012 2011
Liabilities on bills of exchange 4,445 3,516Liabilities on guarantees 3,197 2,129Collateral security for third-party liabilities 65 69
Total contingent liabilities 7,707 5,714
Other financial commitments
€ thousand 2012 2011
Liabilities under non-cancellable operating leases 194,216 205,394Capital expenditure commitments in property, plant and equipment 7,191 6,109Capital expenditure commitments in intangible assets 2,597 1,630Other financial commitments 18,530 16,958
Total other financial commitments 222,534 230,091

KION Holding 1 GmbH Notes to the consolidated financial statements for the year ended 31 December 2012
Page 61 of 88
The maturity structure of the total future minimum lease payments under non-cancellable operating leases is as follows:
The minimum lease payments relate to payments for leased buildings, machinery, office furniture and equipment
(procurement leases) as well as payments for industrial trucks refinanced with a sale-and-leaseback and sub-leased to end customers (sale-and-leaseback sub-leases).
The future minimum lease payments for sale-and-leaseback transactions not recognised on the statement of
financial position amounting to €52,142 thousand are partially offset by payments received under non-cancellable sub-leases amounting to €6,843 thousand. The future payments also include obligations arising from the refinanc-ing of industrial trucks for which there are no offsetting receipts under short-term sub-leases.
Minimum lease payments
€ thousand 2012 2011
Nominal minimum lease payments 194,216 205,394 due within one year 38,808 58,856 due in one to five years 90,394 104,634 due in more than five years 65,014 41,904
Minimum lease payments broken down into procurement leases & sale-and-leaseback subleases
€ thousand 2012 2011 2012 2011
Minimum lease payments (cash out) 142,074 151,486 52,1 42 53,908 due within one year 21,329 38,134 17,479 20,722 due in one to five years 55,745 71,452 34,649 33,182 due in more than five years 65,000 41,900 14 4
Minimum lease payments (cash in) − − 6,843 11,257 due within one year − − 3,572 5,813 due in one to five years − − 3,268 5,440 due in more than five years − − 3 4
Procurement leasesSale-and-Leaseback-
Subleases

KION Holding 1 GmbH Notes to the consolidated financial statements for the year ended 31 December 2012
Page 62 of 88
Other disclosures
[ 35 ] Consolidated statement of cash flows
The consolidated statement of cash flows shows the changes in cash and cash equivalents in the KION Group
resulting from cash inflows and outflows in the year under review, broken down into cash flow from operating, investing and financing activities. The effects on cash from changes in exchange rates are shown separately. Cash flow from operating activities is presented using the indirect method in which the profit or loss for the year is
adjusted for non-cash operating items. The non-cash income of €142,530 thousand essentially comprises the income arising from the remeasurement of
the remaining shares (30 per cent) in Linde Hydraulics at fair value (€108,692 thousand), the gain from the re-measurement of the existing, formerly equity-accounted investment in Linde Creighton Ltd. (€ 8,015 thousand) and the income arising on the remeasurement of purchase price obligations (€4,557 thousand).
Cash flow from operating activities increased by 7.0 per cent to €414,008 thousand in 2012 (2011: €386,810 thousand). The underlying reason for this improvement was that earnings before interest and taxes (EBIT) in-
creased to €550,113 thousand in the reporting year (2011: €213,160 thousand). The net cash provided by investing activities of €104,052 thousand (2011: outflow of €152,580 thousand) was
mainly attributable to the sale of the 70 per cent controlling interest in Linde Hydraulics for a purchase considera-tion of €271,000 thousand including the options. Of the total purchase consideration, €262,870 thousand was paid in cash and €8,130 thousand was paid into a trust account. Cash payments for capital expenditures on non-
current assets and property, plant and equipment amounted to €155,101 thousand (2011: €133,005 thousand). The net cash used for acquisitions totalled €9,703 thousand (2011: €32,916 thousand) and essentially related to the acquisition of the outstanding shares (51 per cent) in Linde Creighton Ltd., Basingstoke, United Kingdom. The
proceeds from the disposal of non-current assets primarily related to disposals of assets no longer required for the Group's operating activities.
The net cash used for financing activities amounted to €330,130 thousand (2011: €114,715 thousand). Whereas the main factors affecting this cash flow in 2011 were the net inflows resulting from the issuance of a corporate bond (inflow of €500,000 thousand), the funds drawn down under a revolving SFA credit line (inflow of €132,691
thousand) and the repayment of SFA liabilities (outflow of €537,018 thousand), the net outflow of cash in 2012 was largely attributable to the repayment of SFA liabilities (outflow of €664,577 thousand) and the inflow of funds from the capital contribution made by Weichai Power for the approved capital increase (inflow of
€467,000 thousand). Interest payments decreased by €17,743 thousand to €129,712 thousand as a result of the declined interest rates. In 2012 there were also receipts of €20,490 thousand from currency hedges (2011: pay-ments of €13,714 thousand).
Following its consolidation for the first time in 2011, on 2 November 2012 the KION Group acquired the remaining shares (34 per cent) in Voltas Material Handling Private Limited, Pune, India, for a purchase consideration of
€8,304 thousand. The cash used for this transaction is reported in cash flow from financing activities as required by IAS 7.

KION Holding 1 GmbH Notes to the consolidated financial statements for the year ended 31 December 2012
Page 63 of 88
The amount of cash and cash equivalents for the year ended 31 December 2012 increased by a total of €188,906 thousand, €976 thousand of which was attributable to exchange-rate movements. This substantial increase was largely the result of the net cash provided by the sale of the 70 per cent controlling interest in Linde
Hydraulics (inflow of €262,870 thousand). Cash and cash equivalents amounted to €562,357 thousand as at the reporting date.

KION Holding 1 GmbH Notes to the consolidated financial statements for the year ended 31 December 2012
Page 64 of 88
[ 36 ] Information on financial instruments
The KION Group uses both primary and derivative financial instruments. The following section summarises the relevance of these financial instruments for the KION Group.
The following table shows the measurement categories defined by IAS 39. In line with IFRS 7, the table shows the carrying amounts and fair values of financial assets and liabilities:
Carrying amounts broken down by class and category
Categories
Classes FAHfT AfS LaR HtM FLaC FLHfT
€ thousand 2012
Financial assets
Loans receivable 730 730 730Financial receivables 9,587 9,587 9,587Available-for-sale investments 768 768 768Lease receivables* 399,269 398,229Trade receivables 625,462 625,462 625,462Other receivables 59,178 59,178
thereof non-derivative receivables 35,236 35,236 35,236
thereof derivative financial instruments 23,942 21,077 23,942
Cash and cash equivalents 562,357 562,357
Financial liabilities
Liabilities to banks 1,858,448 1,858,448 1,858,448Corporate bond 489,495 489,495 530,906Other financial liabilities 4,488 4,488 4,488Shareholder loan 0 0 0Lease liabilities* 475,015 475,806Trade payables 646,044 646,044 646,044Other liabilities 503,112 503,612
thereof non-derivative liabilities 159,202 159,202 159,202
thereof liabilities from finance leases* 300,340 300,840
thereof derivative financial instruments 43,570 23,968 43,570
* as defined by IAS 17
Carrying amount
Fair value

KION Holding 1 GmbH Notes to the consolidated financial statements for the year ended 31 December 2012
Page 65 of 88
The change in valuation allowances for lease receivables and trade receivables was as follows:
Carrying amounts broken down by class and category
Categories
Classes FAHfT AfS LaR HtM FLaC FLHfT
€ thousand 2011
Financial assets
Loan receivable 795 795 795Financial receivables 5,351 5,351 5,351Available-for-sale investments 768 768 768Lease receivables* 361,221 362,319Trade receivables 676,553 676,553 676,553Other receivables 59,514 59,514
thereof non-derivative receivables 36,237 36,237 36,237
thereof derivative financial instruments 23,277 21,500 23,277
Cash and cash equivalents 373,451 373,451
Financial liabilities
Liabilities to banks 2,509,889 2,509,889 2,509,889Corporate bond 487,508 487,508 388,750Other financial liabilities 7,333 7,333 7,333Shareholder loan 643,132 643,132 530,045Lease liabilities* 446,789 446,326Trade payables 634,092 634,092 634,092Other liabilities 452,691 452,427
thereof non-derivative liabilities 180,226 180,226 180,226
thereof liabilities from finance leases* 254,723 254,459
thereof derivative financial instruments 17,742 2,471 17,742
* as defined by IAS 17
Carrying amount
Fair value
Change in valuation allowances
€ thousand 2012 2011
Valuation allowances as at 1 January 49,565 47,125Group changes -483 626Additions (cost of valuation allowances) 12,010 10,547Reversals -2,829 -3,092 Utilisations -7,573 -5,425 Currency translation adjustments -158 -216
Valuation allowances as at 31 December 50,532 49,565
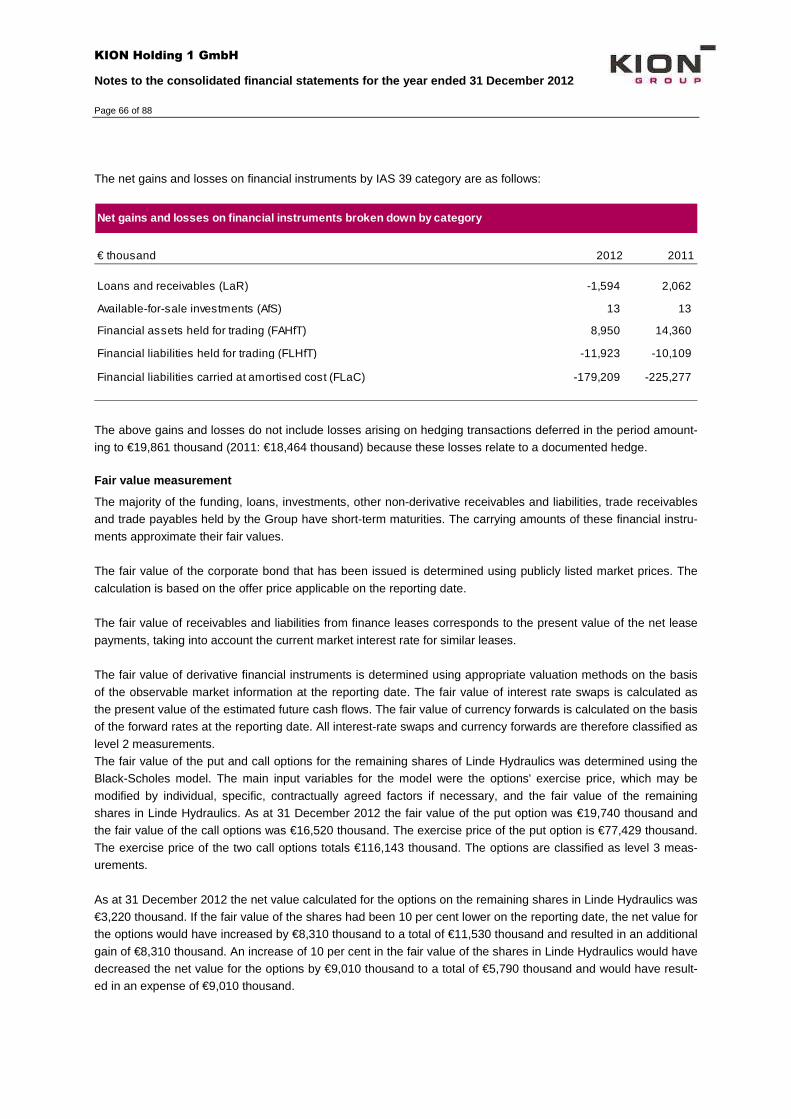
KION Holding 1 GmbH Notes to the consolidated financial statements for the year ended 31 December 2012
Page 66 of 88
The net gains and losses on financial instruments by IAS 39 category are as follows:
The above gains and losses do not include losses arising on hedging transactions deferred in the period amount-ing to €19,861 thousand (2011: €18,464 thousand) because these losses relate to a documented hedge.
Fair value measurement
The majority of the funding, loans, investments, other non-derivative receivables and liabilities, trade receivables and trade payables held by the Group have short-term maturities. The carrying amounts of these financial instru-
ments approximate their fair values. The fair value of the corporate bond that has been issued is determined using publicly listed market prices. The
calculation is based on the offer price applicable on the reporting date. The fair value of receivables and liabilities from finance leases corresponds to the present value of the net lease
payments, taking into account the current market interest rate for similar leases. The fair value of derivative financial instruments is determined using appropriate valuation methods on the basis
of the observable market information at the reporting date. The fair value of interest rate swaps is calculated as the present value of the estimated future cash flows. The fair value of currency forwards is calculated on the basis of the forward rates at the reporting date. All interest-rate swaps and currency forwards are therefore classified as
level 2 measurements. The fair value of the put and call options for the remaining shares of Linde Hydraulics was determined using the Black-Scholes model. The main input variables for the model were the options' exercise price, which may be
modified by individual, specific, contractually agreed factors if necessary, and the fair value of the remaining shares in Linde Hydraulics. As at 31 December 2012 the fair value of the put option was €19,740 thousand and the fair value of the call options was €16,520 thousand. The exercise price of the put option is €77,429 thousand.
The exercise price of the two call options totals €116,143 thousand. The options are classified as level 3 meas-urements.
As at 31 December 2012 the net value calculated for the options on the remaining shares in Linde Hydraulics was €3,220 thousand. If the fair value of the shares had been 10 per cent lower on the reporting date, the net value for the options would have increased by €8,310 thousand to a total of €11,530 thousand and resulted in an additional
gain of €8,310 thousand. An increase of 10 per cent in the fair value of the shares in Linde Hydraulics would have decreased the net value for the options by €9,010 thousand to a total of €5,790 thousand and would have result-ed in an expense of €9,010 thousand.
Net gains and losses on financial instruments broke n down by category
€ thousand 2012 2011
Loans and receivables (LaR) -1,594 2,062
Available-for-sale investments (AfS) 13 13
8,950 14,360
-11,923 -10,109
Financial liabilities carried at amortised cost (FLaC) -179,209 -225,277
Financial assets held for trading (FAHfT)
Financial liabilities held for trading (FLHfT)

KION Holding 1 GmbH Notes to the consolidated financial statements for the year ended 31 December 2012
Page 67 of 88
In order to eliminate default risk to the greatest possible extent, the KION Group only enters into derivatives with counterparties holding a good credit rating.
With the exception of derivative financial instruments and available-for-sale assets, all financial assets and liabili-ties are measured at amortised cost.
The fair value of available-for-sale assets is determined on the basis of data in an active market and is classified as level 1.
The following table shows the assignment of the fair values to the individual classification levels.
Financial instruments measured at fair value
Fair Value Hierarchy
Level 1 Level 2 Level 3 2012
€ thousand
Financial assets 24,710 thereof available-for-sale 768 768 thereof derivative instruments 4,202 19,740 23,942
Financial liabilities 43,570 thereof derivative instruments 27,050 16,520 43,570
Financial instruments measured at fair value
Fair Value Hierarchy
Level 1 Level 2 Level 3 2011
€ thousand
Financial assets 24,045 thereof available-for-sale 768 768 thereof derivative instruments 23,277 23,277
Financial liabilities 17,742 thereof derivative instruments 17,742 17,742

KION Holding 1 GmbH Notes to the consolidated financial statements for the year ended 31 December 2012
Page 68 of 88
[ 37 ] Financial risk reporting
Capital management
One of the prime objectives of capital management is to ensure liquidity at all times. Measures aimed at achieving
these objectives include the optimisation of the capital structure, the reduction of liabilities and ongoing Group cash flow planning and management. Following the amendment and extension of the SFA loan in July 2012, a further corporate bond was issued in February 2013 (see 'Credit terms' table in note [ 30 ]) in order to meet long-
term financing requirements. Close cooperation between local units and the Group head office ensures that the local legal and regulatory
requirements faced by foreign group companies are considered in the capital management process. Net financial debt – defined as the difference between financial liabilities (excluding lease liabilities) and cash and
cash equivalents – is the key performance indicator used in liquidity planning at Group level and amounted to €1,790,074 thousand in 2012 (2011: 2,631,279).
Credit risk
In certain finance and operating activities, the KION Group is subject to credit risk, i.e. the risk that partners will fail to meet their contractual obligations. This risk is limited by diversifying business partners based on certain credit ratings. The Group only enters into transactions with business partners and banks holding a good credit
rating and subject to fixed limits. Counterparty risks involving our customers are managed by the individual Group companies.

KION Holding 1 GmbH Notes to the consolidated financial statements for the year ended 31 December 2012
Page 69 of 88
The following table shows the age structure of receivables as at the reporting date.
Impairment losses are based on the credit risk related to the receivables and are assessed primarily using factors such as a customer’s credit rating and historical pattern of meeting payment terms.
For certain receivables that were overdue as at the reporting date, but for which no impairment losses had been reported, the Company considered trade payables or collateral with the same counterparties. Apart from this item,
the Group did not hold any significant collateral.
Liquidity risk
Based on IFRS 7, a liquidity risk arises if a company is unable to meet its financial liabilities. The KION Group
maintains a liquidity reserve in the form of lines of credit and cash in order to ensure financial flexibility and sol-vency. The age structure of financial liabilities is reviewed continuously and was improved by amending and extending the SFA loan in July 2012 as well as issuing a further corporate bond in February 2013 (see 'Credit
terms' table in note [ 30 ]).
Age structure analysis of receivables
Carrying amount
up to and including90 days overdue
more than90 daysoverdue
€ thousand 2012
Financial receivables 9,587 9,587Lease receivables 399,269 399,269 − − − Trade receivables 625,462 485,621 16,835 110,210 5,499Other non-derivative receivables 35,236 34,492 734 1 9
€ thousand 2011
Financial receivables 5,351 5,351Lease receivables 361,221 361,221 − − − Trade receivables 676,553 539,560 4,286 117,666 10,727Other non-derivative receivables 36,237 35,189 643 − 41
Thereof: Neither
overdue nor impaired at
the reporting date
Thereof: Overdue and impaired at the reporting
date
Thereof: Not impaired at the reporting
date, but

KION Holding 1 GmbH Notes to the consolidated financial statements for the year ended 31 December 2012
Page 70 of 88
The following table shows all of the contractually agreed payments under recognised financial liabilities as at 31 December 2012, including derivative financial instruments with negative fair values.
Liquidity analysis of financial liabilities and der ivatives
€ thousand 2012
Carrying amount 2012
Cash flow 2013
Cash flow 2014 - 2017
Cash flow from 2018
Primary financial liabilities
Gross liabilities to banks 1,882,085 -124,369 -1,994,386 -149,793Borrowing costs -23,637Net liabilities to banks 1,858,448
Corporate bond 500,000 -33,677 -138,368 -517,912Borrowing costs -10,505
489,495
Other financial liabilities 4,488 -623 − -5,269 Shareholder loan − − − − Trade payables 646,044 -646,044 − − Lease liabilities 475,015 -166,802 -344,613 -12,974 Other financial liabilities 459,542 -264,668 -217,889 -8,203
Derivative financial liabilitiesDerivatives with negative fair value 27,050 + Cash in 438,150 5,005 − - Cash out -452,648 -13,751 −

KION Holding 1 GmbH Notes to the consolidated financial statements for the year ended 31 December 2012
Page 71 of 88
The calculation of future cash flows for derivative financial liabilities includes all currency forwards and interest-rate swaps that have negative fair values as at the reporting date.
Bank guarantee lines (e.g. sureties, performance bonds) had been issued under the ancillary facility agreements for a total amount in the low double-digit millions as at 31 December 2012. They included guarantees payable 'on first demand'. No guarantees were utilised in 2012.
The volume of business for which factoring was used in 2012 was €20,024 thousand (2011: €17,844 thousand). Because all material risks and rewards are assigned to the purchaser, these assets are derecognised in full.
Liquidity analysis of financial liabilities and der ivatives
€ thousand 2011
Carrying amount 2011
Cash flow 2012
Cash flow 2013 - 2016
Cash flow from 2017
Primary financial liabilities
Liabilities to banks 2,530,064 -307,224 -2,643,650 − Borrowing costs -20,175Net liabilities to banks 2,509,889
Corporate bond 500,000 -34,864 -143,062 -556,723 Borrowing costs -12,492
487,508
Other financial liabilities 7,333 -3,397 − -6,090 Shareholder loan 643,132 − − -928,194 Trade payables 634,092 -634,092 − − Lease liabilities 446,789 -165,739 -312,512 -11,905 Other financial liabilities 434,948 -274,716 -178,168 -6,788
Derivative financial liabilitiesDerivatives with negative fair value 17,742 + Cash in 295,698 32,127 − - Cash out -291,278 -36,919 −

KION Holding 1 GmbH Notes to the consolidated financial statements for the year ended 31 December 2012
Page 72 of 88
Default risk
For financial assets, default risk is defined as the risk that a counterparty will default, and therefore is limited to a maximum of the carrying amount of the assets relating to the counterparty involved. The potential default risk
attaching to financial assets is mitigated by secured forms of lending such as reservation of title, credit insurance and guarantees.
Specific valuation allowances for defaults are recognised to reflect the risk arising from primary financial instru-ments. Financial transactions are only entered into with selected partners holding good credit ratings. Investments in interest-bearing securities are limited to investment-grade securities.
Risks from financial services
The KION Group's leasing activities mean that it may be exposed to residual value risks from the marketing of machinery and equipment that is returned by the lessee at the end of a long-term lease and subsequently sold or
re-leased. Residual values in the markets for used trucks are therefore constantly monitored and forecasted. KION regularly assesses its overall risk position arising from financial services, recognising write-downs, impair-
ments or provisions to cover the risks it identifies. It immediately takes into account of any changes in residual values when calculating new leases.
In addition, residual values are mainly based on remarketing agreements that continued to achieve positive outcomes in 2012. Under these agreements, any residual-value risk is transferred to the leasing company con-cerned. Group-wide standards to ensure that residual values are calculated conservatively reduce risk and pro-
vide the basis on which to create the transparency required. KION also has an IT system for residual-value risk management.
The KION Group mitigates its liquidity risk and interest-rate risk by ensuring that most of its transactions and funding loans have comparable maturities. Long-term leases are primarily based on fixed-interest agreements. The credit facilities provided by various banks ensure that the Group has sufficient liquidity.
In order to eliminate exchange-rate risk, KION generally funds its leasing business in the local currency used in each market.
Because of low default rates, counterparty risk has not been significant to date in the KION Group. The Company did not identify any material year-over-year changes in 2012. KION's losses from defaults are also mitigated by its
proceeds from the sale of repossessed trucks. In addition, it primarily offers financial services indirectly via select-ed funding partners, and KION bears the counterparty risk in less than 5 per cent of cases. The credit risk man-agement system was refined as part of the work involved in transferring financial services activities to a separate
segment. In particular, this involved revising procedures on operational and organisational structure as well as processes for risk management and control.
Exchange rate risk
In accordance with its treasury risk policy, the KION Group hedges exchange rate risks both locally at the level of the individual companies and centrally via KION GROUP GmbH in order to meet the prescribed minimum hedging ratios.
The main hedging instruments employed are foreign-currency forwards, provided that there are no country-specific restrictions on their use.

KION Holding 1 GmbH Notes to the consolidated financial statements for the year ended 31 December 2012
Page 73 of 88
At company level, hedges are entered into for highly probable future transactions on the basis of a rolling 15-month forecast, as well as for firm obligations not reported in the statement of financial position. In accordance with IAS 39, these hedges are generally classified as cash flow hedges for accounting purposes (see note [ 38 ]).
Foreign-currency forwards are also employed to hedge the exchange rate risks resulting from internal financing.
The following table shows an overview of the foreign-currency forwards entered into by the KION Group.
Significant exchange rate risks from financial instruments are measured on the basis of value at risk (VaR) as part
of internal Group management. VaR figures are calculated using historical variance-covariance analyses. Correla-tions and volatilities are calculated on the basis of the 250 working days prior to the reporting date (unweighted).
Exchange rate risks from financial instruments as defined by IFRS 7, are only included in calculating value at risk if the financial instruments are denominated in a currency other than the functional currency of the reporting entity concerned. This means that exchange rate risks resulting from the translation of the separate financial statements
of subsidiaries into the Group reporting currency, i.e. currency translation risk, are not included.
Foreign-currency forwards
€ thousand 2012 2011 2012 2011
Foreign-currency forwards (assets) Hedge 2,865 1,765 89,240 73,758Trading 1,337 21,500 103,671 363,277
Foreign-currency forwards (liabilities) Hedge 1,006 8,650 29,765 189,351Trading 7,448 2,471 414,160 103,018
Fair value Notional amount

KION Holding 1 GmbH Notes to the consolidated financial statements for the year ended 31 December 2012
Page 74 of 88
The value at risk in respect of currency risk as at 31 December 2012 was €30,343 thousand (31 December 2011: €54,676 thousand). Value at risk is the gain or loss that is not expected to be exceeded over a holding period of
one year with a confidence level of 97.7 per cent (2011: 97.7 per cent).
Interest-rate risk
Interest-rate risk within the KION Group is managed centrally. The basis for decision-making includes sensitivity
analyses of interest-rate risk positions in key currencies. The table below shows the cumulative effect of an increase or decrease of 100 basis points (bps) in the relevant
interest-rate curves, with a rate of 0 per cent constituting the lower limit of the calculation.
The Group essentially funds itself by drawing down loans under its agreed credit facilities. Interest-rate derivatives
– mainly interest-rate swaps – are used to hedge the resulting interest-rate risk.
Value-at-Risk
€ thousand 2012 2011
Currency risk 30,343 54,676
Interest-rate sensitivity
+100 bps -100 bps +100 bps -100 bps
€ thousand 2012 2012 2011 2011
Other comprehensive income (loss) 16,020 -1,627 28,702 -18,031 Net income (loss) -8,469 8,469 -9,358 9,358
Interest-rate swaps
Fair value Notional amount
€ thousand 2012 2011 2012 2011
Interest-rate swaps (assets) Hedge − − − − Trading − − − −
Interest-rate swaps (liabilities) Hedge 18,596 6,621 1,670,000 2,070,000Trading − − − −

KION Holding 1 GmbH Notes to the consolidated financial statements for the year ended 31 December 2012
Page 75 of 88
[ 38 ] Hedge accounting
Hedging currency risk
In accordance with its treasury risk policy, the KION Group applies hedge accounting in hedging the exchange
rate risks arising from highly probable future revenues in various currencies. Foreign-currency derivatives with settlement dates in the same month as the expected cash flows from the Group's operating activities are used as hedges.
The effectiveness of the Group's hedging transactions is assessed on the basis of forward rates using the hypo-thetical derivative approach under the cumulative dollar-offset method. The effective portion of the changes in the
fair value of foreign-currency derivatives is recognised in accumulated other comprehensive income (loss) and only reversed when the corresponding hedged item is recognised in income.
Because of the short-term nature of the Group's payment terms, reclassifications to the income statement and the recognition of the corresponding cash flows generally take place in the same reporting period. A foreign-currency receivable or liability is recognised when goods are shipped or received. Hedge accounting continues until the
corresponding payment is received, with the changes in the fair value of the derivative being recognised in the income statement, thereby largely offsetting the effect of the measurement of the receivable at the reporting date.
The changes in fair value recognised and reclassified in other comprehensive income in 2012 are shown in the consolidated statement of comprehensive income. The ineffective portion of the changes in the fair value of the hedging transactions is recognised directly in the income statement. There were no significant ineffective portions
in 2012. In total, foreign-currency cash flows with a notional amount of €114,329 thousand (2011: €263,109 thousand)
were hedged and designated as hedged items, of which €99,744 thousand is expected by 30 September 2013 (2011: €187,298 thousand by 30 September 2012). The remaining cash flows designated as hedged items fall due in the period up to 24 February 2014.
Hedging of interest-rate risk
The KION Group uses hedge accounting in connection with the hedging of interest-rate risk.
The KION Group is essentially financed by the utilisation of loans with variable interest rates and in different currencies. Interest-rate derivatives denominated in various currencies were used to hedge the resulting interest-rate risk in 2012. Because the KION Group used interest-rate swaps to convert 48 per cent of its variable-rate
exposure into fixed-rate obligations as at the reporting date (31 December 2011: 51 per cent), it is not fully bene-fiting from the low level of market interest rates. These swaps were designated as hedges at inception.
The effective portion of the hedges was recognised in other comprehensive income (loss). As in the previous year, the cumulative effectiveness of the hedging transactions was almost 100 per cent. As in 2011, there were no ineffective portions.
In total, variable portions of future interest payments amounting to €6,340 thousand (2011: €27,196 thousand) were designated as hedged items, of which €2,365 thousand are due by 30 September 2013 (2011:
€8,126 thousand fell due by 30 September 2012). The remaining cash flows designated as hedged items are due by 31 December 2014.

KION Holding 1 GmbH Notes to the consolidated financial statements for the year ended 31 December 2012
Page 76 of 88
[ 39 ] Segment report
The chief-operating decision makers divide the KION Group into the two brands Linde Material Handling (LMH) and STILL, as well as the financial services (FS) activities for management purposes. Segment reporting follows
the same breakdown, taking into account the relevant organisational structures and corporate strategy of the KION Group.
Since 2011 the chief-operating decision makers divided the KION Group into the LMH and STILL brands for management purposes and therefore for segment reporting. Starting in 2011 the KION Group had put in place the organisational structures required under the German Commercial Code (HGB) to enable it to manage and report
the Group's financial services activities as a separate segment in 2012. The segment reporting in the notes to the 2011 financial statements included additional voluntary disclosures based on the future reporting model. These additional disclosures provide the basis for the comparative data. The new segment structure has been used for
management purposes since the end of 2012. In this context, separate financial services companies have been established in the core markets of Germany,
France, United Kingdom, Italy and Spain. Further companies will be gradually introduced in countries with a high proportion of finance and leasing business. In countries with lower levels of FS activity, the sales and service companies will continue to run the financial services operations.
Description of the segments
The Linde Material Handling (LMH) segment encompasses the Linde, Fenwick and Baoli brands. The remaining 30 per cent held in Linde Hydraulics is allocated to the LMH segment at fair value and will be accounted for using
the equity method on a going-forward basis. The STILL segment comprises the STILL and OM-STILL brands.
FS activities include the financing of long-term leasing business for KION Group customers and risk management. When long-term leasing business is being conducted, FS operates as a contractual partner to external customers
and provides the necessary refinancing in conjunction with external financial partners. Besides management of residual-value risk, risk management also includes the management of credit risk. In addition, FS provides the financing for short-term rental fleets on behalf of the LMH and STILL brand segments.
The 'Other' segment comprises the companies operating under the Voltas brand as well as holding and service companies in the KION Group. Voltas is a KION Group brand company whose manufacturing is based in India
and whose business activities focus primarily on this market. The service companies perform cross-segment services for the KION Group. The bulk of the revenue in this segment is generated by internal IT and logistics services rendered by the service companies.
Segment management
The key performance indicator used to manage the brand segments is 'adjusted EBIT'. Segment reporting there-fore includes a reconciliation of externally reported consolidated earnings before interest and tax (EBIT) – includ-
ing KION acquisition items and non-recurring items – to the adjusted EBIT of the segments ('adjusted EBIT'). The key performance indicator used to manage the FS segment is earnings before tax (EBT).

KION Holding 1 GmbH Notes to the consolidated financial statements for the year ended 31 December 2012
Page 77 of 88
Intra-group transactions are generally conducted on an arm's-length basis. The regular (interest) margin income that FS generates from its business activities reflects prevailing market conditions. Surpluses from the leasing business that exceed this interest margin are reflected in the producer margin within the operating profit generat-
ed by the LMH and STILL brand segments. Segment reports are prepared in accordance with the same accounting policies as the consolidated financial
statements, as described in note [ 8 ]. Contrary to these policies, however, the LMH and STILL brands' interseg-ment sales to FS are always treated as revenue for the brand segments, irrespective of the possible remain of opportunities and risks. These sales always take place at market price.
Assets and liabilities associated with the long-term leasing business are assigned to the FS segment. The ex-penses in the FS segment's income statement therefore reflect, in particular, depreciation/amortisation of the
assets, interest expenses relating to the financing of these assets as well as operating expenses. These expens-es correspond to income by the finance instalments paid by the customer (lease payments excluding service portion).
Whereas the main feature of long-term leasing business is the provision of a financial service to the external lessee, the focus in short-term leasing is on the service function. External customers are offered rental trucks from
a rental pool – including associated services – for short-term use. Unlike the situation in long-term leasing, finan-cial performance in the short-term business is largely dependent on the achieved level of utilisation of the rental fleet, management of which lies entirely within the responsibility of the brand segments. Given this structure, the
assets associated with the short-term business and the related income and expenses remain on the brand seg-ments' income statement or statement of financial position.
In an indirect leasing arrangement ('sale with risk'), the otherwise typical financing function of the FS segment as a lender for the leasing transaction no longer applies. As a result of the sale of the leased asset to the external finance provider in such transactions, the brand segments view the transactions in the same way as a sale to an
end-user. Consequently, these transactions and all the revenue that they generate are recognised in the LMH and STILL brand segments.

KION Holding 1 GmbH Notes to the consolidated financial statements for the year ended 31 December 2012
Page 78 of 88
The following tables show information on the KION Group's operating segments for 2012 and 2011:
Segment report
LMH STILLFinancial Services
OtherConsolidation/Reconciliation
Total
€ thousand 2012
Revenue from external customers 2,903,163 1,483,832 296,755 42,914 − 4,726,664Intersegment revenue 229,084 192,758 212,571 208,023 -842,436 − Total revenue 3,132,247 1,676,590 509,326 250,937 -842,436 4,726,664
Earnings before taxes 505,338 70,067 4,798 -205,643 -63,932 310,628
Financial income 28,180 6,054 44,704 21,747 -38,601 62,084Financial expense -46,258 -34,089 -41,308 -215,224 35,310 -301,569 = Financial result -18,078 -28,035 3,396 -193,477 -3,291 -239,485
EBIT 523,416 98,102 1,402 -12,166 -60,641 550,113
+ Non-recurring items -226,053 17,113 − 55,533 − -153,407 + KION acquisition items 32,994 7,394 − 1,065 − 41,453
= Adjusted EBIT 330,357 122,609 1,402 44,432 -60,641 438,159
Segment assets 4,513,827 2,068,249 1,040,559 902,292 -2,311,687 6,213,240Segment liabilities 1,461,278 1,191,605 998,854 4,205,982 -2,304,814 5,552,905
135,499 6,148 13,188 − − 154,835Equity result 13,477 1,226 1,209 − − 15,912Capital expenditures* 89,139 51,115 53 14,794 − 155,101Depreciation** 102,503 42,661 9 17,735 − 162,908Order intake 2,977,674 1,576,810 509,326 250,937 -614,671 4,700,076Number of employees*** 13,148 7,253 112 702 − 21,215
* Excluding leased assets and rental assets** Omitted on intangible assets and property, plant and equipment excl. leased and rental assets*** Number of employees in full-time equivalents as at 31 December
Carrying amount of equity investments

KION Holding 1 GmbH Notes to the consolidated financial statements for the year ended 31 December 2012
Page 79 of 88
The table below gives a breakdown of revenue from external customers by region.
There are no relationships with individual customers that generate revenue deemed to be significant as a propor-
tion of total consolidated revenue. Financial income and expenses including all interest income and expenses are described in notes [ 14 ] and
[ 15 ].
Segment report
LMH STILLFinancial Services
OtherConsolidation/Reconciliation
Total
€ thousand 2011
Revenue from external customers 2,601,587 1,461,968 264,896 39,944 − 4,368,395Intersegment revenue 251,927 204,836 214,864 183,365 -854,992 − Total revenue 2,853,514 1,666,804 479,760 223,309 -854,992 4,368,395
Earnings before taxes 246,450 -30,586 6,160 -191,729 -89,180 -58,885
Financial income 29,380 5,804 45,360 32,371 -39,251 73,664Financial expense -40,651 -31,302 -41,901 -267,529 35,674 -345,709 = Financial result -11,271 -25,498 3,459 -235,158 -3,577 -272,045 0
EBIT 257,721 -5,088 2,701 43,429 -85,603 213,160
+ Non-recurring items -4,830 97,308 − 23,005 − 115,483+ KION acquisition items 26,468 7,960 − 1,537 − 35,965
= Adjusted EBIT 279,359 100,180 2,701 67,971 -85,603 364,608
Segment assets 4,425,263 1,983,278 840,005 708,616 -1,890,876 6,066,286Segment liabilities 1,495,301 1,064,798 798,845 5,043,405 -1,848,476 6,553,873
19,244 4,647 12,654 − − 36,545Equity result 5,074 1,557 459 − − 7,090Capital expenditures* 75,952 43,270 0 13,783 − 133,005Depreciation** 100,563 48,152 0 16,321 − 165,036Order intake 2,929,844 1,694,941 479,760 223,153 -645,842 4,681,856Number of employees*** 13,786 7,292 96 688 − 21,862
* Excluding leased assets and rental assets**Omitted on intangible assets and property, plant and equipment excl. leased and rental assets*** Number of employees in full-time equivalents as at 31 December
Carrying amount of equity investments
Segment revenue broken down by customer location
€ thousand 2012 2011
Germany 1,225,236 1,174,777EU excl. Germany 2,253,227 2,114,588Rest of Europe 247,648 203,530America 324,175 280,611Asia 485,636 434,814Rest of world 190,742 160,075
Total segment revenue 4,726,664 4,368,395

KION Holding 1 GmbH Notes to the consolidated financial statements for the year ended 31 December 2012
Page 80 of 88
The non-recurring items mainly comprised costs incurred in connection with severance payments, social plan costs, costs relating to the relocation and closure of production sites and consultancy costs. They totalled €70,928 thousand in 2012 (2011: €115,483 thousand). Also included for 2012 are the gain from the disposal of the control-
ling interest (70 per cent) in Linde Hydraulics (€-103,071 thousand), the gain from the remeasurement of the remaining shares (30 per cent) in Linde Hydraulics (€-108,692 thousand), the gain from the remeasurement of the shares already held in Linde Creighton Ltd., which were previously accounted for using the equity method, (€-
8,015 thousand) and the gain from the remeasurement of purchase price obligations (€-4,557 thousand). In 2012 material non-recurring items amounting to €-107,092 thousand were non-cash items. In the segment LMH the non-cash items result in an income of €-109,397 thousand and in the segment STILL €-5,825 thousand. The
segment other includes non-cash expenses amounting to €8,130 thousand. The KION acquisition items comprise depreciation, amortisation and impairment charges on the fair value adjustments identified as part of the purchase price allocation (PPA).
The assets attributable to the Financial Services segment include long-term leases which were reported as either leased assets or lease receivables, depending on the type of lease. At the reporting date, lease receivables due
from unrelated third parties amounted to €379,946 thousand (31 December 2011: €361,225 thousand). There were also intra-group lease receivables of €373,354 thousand (31 December 2011: €300,046 thousand), which primarily resulted from the funding of the short-term rental business of LMH and STILL.
KION Group’s consolidated statement of financial position include liabilities to leasing companies arising from procurement leases, from financing of the rental fleet and from agreements classified as ‘sale with risk’ in the
amount of €300,340 thousand (2011: €254,723 thousand), which are reported as other financial liabilities. Thereof €260,154 thousand (2011: €222,245 thousand) are allocated to the liabilities of Financial Services. The segment liabilities attributable to the financial services business also include liabilities to external leasing companies of
€470,180 thousand (2011: €446,789 thousand) arising from finance lease obligations from sale-and-leaseback transactions for the funding of long-term leases with customers, which are reported as lease liabilities in the consolidated financial statements. Moreover, they include net financial debt of €174,853 thousand (2011:
€127,337 thousand) arising from general financing of the Financial Services segment. The equity-accounted investment (45 per cent) in Linde Leasing GmbH, Wiesbaden, was allocated to the FS
segment when the new segment reporting model was introduced. The purpose of Linde Leasing GmbH is to provide financial services and it is therefore assigned to the FS segment.
Capital expenditures of the Financial Services segment includes additions to intangible assets and property, plant and equipment. Leased assets are described in note [ 19 ].
Capital expenditures broken down by company locatio n (excl. leased and rental assets)
€ thousand 2012 2011
Germany 104,966 92,340EU excl. Germany 30,452 27,796Rest of Europe 733 233America 8,411 5,849Asia 9,915 5,378Rest of world 624 1,409
Total capital expenditures 155,101 133,005

KION Holding 1 GmbH Notes to the consolidated financial statements for the year ended 31 December 2012
Page 81 of 88
Depreciation/amortisation relates to intangible assets with finite useful lives and property, plant and equipment. The regional breakdown of non-current assets excluding financial assets, financial instruments, deferred tax assets and post-employment benefits is as follows:
[ 40 ] Employees
The KION Group employed an average of 22,232 people in the reporting year (2011: 20,797). The number of
employees (including part-time employees expressed as a proportion of full-time equivalents) is broken down by region as follows:
The number of employees increased by 300 due to the first-time consolidation of Linde Creighton Ltd., Basing-
stoke, United Kingdom.
Non-current assets broken down by company location
€ thousand 2012 2011
Germany 2,552,611 2,703,550EU excl. Germany 695,537 665,590Rest of Europe 27,858 24,492America 46,240 34,672Asia 122,176 116,428Rest of world 49,544 48,671
Total non-current assets (IFRS 8) 3,493,966 3,593,403
Employees (average)
2012 2011
Germany 8,497 8,145France 3,245 3,196UK 1,807 1,423Italy 884 1,030Rest of Europe 3,443 3,194Asia 3,243 2,816Rest of world 1,113 993
Total employees 22,232 20,797

KION Holding 1 GmbH Notes to the consolidated financial statements for the year ended 31 December 2012
Page 82 of 88
[ 41 ] Related party disclosures
In addition to the subsidiaries included in the consolidated financial statements, the KION Group has direct or indirect business relationships with a number of unconsolidated subsidiaries, joint ventures and associates in the
course of its ordinary business activities. The related parties that are controlled by the KION Group, that are able to exert a significant influence over the KION Group, or are members of the Superlift group are either included in the list of shareholdings (annex to these notes) or in the table below.
Superlift Funding S.à r.l., Luxembourg
Under a supplementary loan agreement dated 23 September 2009, investment funds advised by Kohlberg Kravis Roberts & Co. L.P. ('KKR') and Goldman Sachs Capital Partners extended the SFA to include an additional loan of €100,000 thousand to be paid via Superlift Funding S.à r.l., Luxembourg. The purpose of the supplementary
loan was to further strengthen the operational and strategic options for the KION Group. Both the loan amount and the associated interest are repayable as a bullet payment on maturity (payment in kind, 'PIK'). The carrying amount of the loan including accrued interests was €115,951 thousand as at 31 December 2012 (31 December
2011: €111,210 thousand).
Shareholder loan agreement
On 27 December 2006, KION Holding 1 GmbH (then Neggio Holding 1 GmbH) entered into a shareholder loan
agreement with Superlift Holding S.à r.l., Luxembourg, for €500,000 thousand of principal. The shareholder loan, amounting to €670,784 thousand (including accrued interest), was converted into equity with effect from 27 De-cember 2012.
Disposal of a significant part of the hydraulics bu siness
The KION Group sold its controlling interest of 70 per cent in Linde Hydraulics to Weichai Power Co., Ltd., Wei-fang, China, for a consideration of €271,000 thousand with effect from 27 December 2012. As part of the transac-
tion, Weichai Power granted LMH GmbH a put option on the remaining shares in Linde Hydraulics. LMH GmbH also granted Weichai Power two call options relating to the shares. For further information, please refer to note [ 6 ].
Advisory agreement
On 8 May 2007, KION GROUP GmbH, Kohlberg, Kravis Roberts & Co. L.P. ('KKR') and Goldman, Sachs & Co. entered into an advisory agreement under the terms of which KKR and Goldman Sachs undertook to perform
advisory services for the KION Group. These advisory services relate, in particular, to financial and strategic issues. The annual advisory fee payable to KKR and Goldman, Sachs & Co. is €4,763 thousand (2011: €4,624 thousand) and it has been recognised as an expense.
Related parties
Superlift Holding S.à r.l., Luxembourg Parent companyKohlberg Kravis Roberts & Co. L.P., New York, USA Entity with significant influence Goldman, Sachs & Co., New York, USA Entity with significant influenceSuperlift Funding S.à r.l., Luxembourg Affiliated companyWeichai Power Co., Ltd., Weifang, China Entity with significant influence

KION Holding 1 GmbH Notes to the consolidated financial statements for the year ended 31 December 2012
Page 83 of 88
Under the terms of the adjustment and extension of the SFA loan, an advisory fee totalling €2,015 thousand was paid to KKR and Goldman, Sachs & Co. This fee has been allocated pro rata as transaction costs to each of the tranches and is expensed over their respective new terms.
Goldman & Sachs AG, Frankfurt am Main, also provided additional advisory services totalling €11,500 thousand in connection with the new shareholder Weichai Power and the sale of the hydraulics business.
As at the reporting date, the receivables due from related parties were as follows:
As at the reporting date, liabilities to related parties were as follows:
[ 42 ] KION management partnership plan ('MPP')
Arrangements for management to invest in the Company have been in place since 2007. These arrangements are governed by the 'Shareholders' and co-investment agreement on the implementation of the management
partnership plan for the KION Group' (the co-invest agreement) dated 14 June 2007, entered into by Superlift Holding S.à r.l., KION Holding 1 GmbH and KION Management Beteiligungs GmbH & Co. KG. The managers who have joined the management partnership plan also became parties to the co-invest agreement in 2007,
2008, 2010 and 2011.
Receivables from related parties
€ thousand 2012 2011
Non-consolidated subsidiaries 7,421 4,403Associates 10,845 17,262Joint ventures 2,622 2,964Other related parties 5,901 4,825
Total receivables from related parties 26,789 29,454
Liabilities to related parties
€ thousand 2012 2011
Non-consolidated subsidiaries 4,845 4,188Associates 35,861 39,955Joint ventures 6,051 4,719Other related parties 132,529 769,255
Total liabilities to related parties 179,286 818,117

KION Holding 1 GmbH Notes to the consolidated financial statements for the year ended 31 December 2012
Page 84 of 88
Taking account of the approved capital increase and the conversion of the shareholder loan, KION Management Beteiligungs GmbH & Co. KG holds an equity interest of 5.711 per cent (2011: 14.61 per cent) in KION Holding 1 GmbH. In total, the Executive Board holds an interest of €2,800 thousand in the limited partner capital of KION
Management Beteiligungs GmbH & Co. KG, which equals to an indirect interest of 1.066 per cent (2011: 3.31 per cent) in the share capital of KION Holding 1 GmbH. In addition to the KION Group's Executive Board, around 300 executives around the world have purchased shares in KION Management Beteiligungs GmbH & Co. KG. The
shares are sold at their fair value and shareholdings are divided into virtual 'A', 'B', and 'C' shares. Different terms and conditions concerning payment of the purchase price and rights to purchase attach to these virtual shares. The purchase price for 'A' shares became payable when participants joined the programme, while KION Man-
agement Beteiligungs GmbH granted participants interest-bearing loans for the purchase price of the 'B' and 'C' shares. The vesting conditions and resulting purchase rights for 'B' shares accrue to participants in equal, annual tranches over a period of five years. By contrast, managers become eligible to purchase 'C' shares if the targets
for revenue, EBITA and operating cash flow set in the business plan are achieved over a five-year period or predefined target returns are achieved if the Group is sold or there is a change of control.
In 2010, the performance-related vesting conditions for the 'C' shares relating to the 2009–2012 bonus period were adjusted to take into account of the revised long-term KION business plan, which is in turn based on the amended loan terms in the supplementary agreement to the SFA dated 23 September 2009. The change in
vesting conditions affects a total of 1,034 shares with an expected exercise price of €16 thousand each. The articles of association expire on 31 December 2016. The vesting period ended on 31 December 2012. The total fair value of this adjustment was €1,044 thousand. The fair value of the individual purchase rights amounted to €1
thousand. The number of purchase options outstanding as at the reporting date remained unchanged at 1,034, of which 876 (31 December 2011: 584) were exercisable.
Expenses of €159 thousand were incurred by the management partnership plan in 2012 (2011: €295 thousand).
[ 43 ] Remuneration of key management
Executive Board
Gordon Riske, Chief Executive Officer (CEO), is responsible, among other things, for the strategic management of the Group, communications, governance and compliance. On 11 January 2013 he also took over responsibility for KION Warehouse Systems and internal audit.
On 31 December 2012 Otmar Hauck, until then Chief Operating Officer (COO) of KION GROUP GmbH, Wiesba-den, stepped down from the Executive Board of the KION Group. He had been responsible for quality and central
operations (operational excellence & production control), purchasing, logistics, health & safety and environmental issues in the Group.
Klaus Hofer stepped down from the Executive Board of the KION Group on 10 January 2013. As Chief Human Resources Officer (CHRO), he had been responsible for human resources, legal affairs and internal audit.
Bert-Jan Knoef is CEO of the brand company STILL GmbH and, since 11 January 2013, has also overseen all cross-brand logistics activities and managed the intra-group logistics service provider, Urban.
Theodor Maurer is CEO of the brand company Linde Material Handling GmbH and, since 11 January 2013, has also held cross-brand responsibility for quality, facility management, health, safety and the environment.

KION Holding 1 GmbH Notes to the consolidated financial statements for the year ended 31 December 2012
Page 85 of 88
Harald Pinger, who had been Chief Financial Officer (CFO), stepped down from the Executive Board of the KION Group on 31 August 2012.
Ching Pong Quek was appointed Chief Asia Pacific Officer with effect from 11 January 2013 and heads up the KION Group's entire Asia business.
Dr Thomas Toepfer, who has been Chief Financial Officer (CFO) since 1 September 2012, is responsible, among other things, for finance (including financial services) and IT activities. On 11 January 2013 he also took over responsibility for purchasing and the role of Labour Relations Director.
The remuneration paid to the Executive Board comprises a fixed salary and non-cash benefits, pension entitle-ments and performance-related components. The variable performance-related components are paid each year
on the basis of the Group's performance. The pension entitlements consist of retirement, invalidity and surviving dependants' benefits.
The total remuneration paid to the members of the Executive Board in 2012 amounted to €12,026 thousand (2011: €5,209 thousand). This consisted of short-term remuneration amounting to €5,551 thousand (2011: €4,755 thousand), post-employment benefits totalling €436 thousand (2011: €386 thousand), termination benefits of
€6,000 thousand (2011: €0 thousand) and share-based payments of €39 thousand (2011: €68 thousand). The current service cost resulting from pension provisions for the Executive Board is reported under the retirement benefit obligation. No loans or advances were made to members of the Executive Board in 2012 (2011: loans and
advances totalling €0 thousand). The total remuneration paid to former members of the Executive Board in 2012 amounted to €165 thousand
(2011: €162 thousand). Provisions for pension obligations to former members of the Executive Board or their surviving dependants amounting to €3,636 thousand (2011: €2,819 thousand) were recognised in accordance with IAS 19.
Supervisory Board
The total remuneration paid to the members of the Supervisory Board for the performance of their duties at the
parent company and subsidiaries in 2012 amounted to €953 thousand including VAT (2011: €1,071 thousand). There were no loans or advances to members of the Supervisory Board in 2012. Furthermore, the members of the Supervisory Board did not receive any remuneration or benefits for services provided as individuals, such as
consulting or brokerage activities. In addition the members of the Supervisory Board receive for services short-term employee benefits totalled €550 thousand in 2012 (2011: €539 thousand).

KION Holding 1 GmbH Notes to the consolidated financial statements for the year ended 31 December 2012
Page 86 of 88
[ 44 ] Members of the Executive Board and Superviso ry Board
Executive Board
Gordon Riske
CEO Klaus Hofer
(until 10 January 2013) CHRO
Bert-Jan Knoef (since 11 January 2013) Member of the Executive Board / CEO, STILL
Theodor Maurer (since 11 January 2013)
Member of the Executive Board / CEO, LMH Harald Pinger
(until 31 August 2012) CFO
Ching Pong Quek (since 11 January 2013) Chief Asia Pacific Officer
Dr Thomas Toepfer (since 1 September 2012)
CFO Supervisory Board
Dr John Feldmann
(Chairman of the Supervisory Board) Chief executive officer of the non-profit Hertie Foundation, Frankfurt am Main, member of the Supervisory Board and member of the Supervisory Board's Presiding Committee at Bilfinger Berger SE, Mannheim
Joachim Hartig1 Deputy Chairman of the Supervisory Board
Chairman of the Plant I & II Works Council, Linde Material Handling GmbH, Aschaffenburg Holger Brandt1
(since 19 March 2012) Head of After Sales STILL Group, STILL GmbH, Hamburg
Dr Alexander Dibelius Chief Executive Officer of Goldman Sachs AG, Frankfurt am Main

KION Holding 1 GmbH Notes to the consolidated financial statements for the year ended 31 December 2012
Page 87 of 88
Denis Heljic1 (until 19 March 2012) Deputy Chairman of the Works Council of STILL GmbH, Dortmund plant
Service Technician at STILL, Dortmund plant Dr Martin Hintze
Managing Director of Goldman Sachs Capital Partners, London Johannes P. Huth
Member of Kohlberg Kravis Roberts & Co. L.P., New York Jiang Kui
(since 27 December 2012) President of Shandong Heavy Industry Group Co., Ltd., Jinan, China
Thilo Kämmerer1 Trade Union Secretary, IG Metall, Bamberg Administrative Office
Dr Roland Köstler1 Head of Business Law at Hans-Böckler-Stiftung, Düsseldorf
Peter Kolb1 (until 19 March 2012) Head of Facility Management, Linde Material Handling GmbH, Aschaffenburg
Kay Pietsch1 Chairman of the KION Group Works Council and Chairman of the Works Council of STILL GmbH, Hamburg
Silke Scheiber Member of Kohlberg Kravis Roberts & Co. L.P., New York
Dr Michael Süß (until 26 December 2012)
Member of the Managing Board and CEO of the Energy Sector of Siemens AG, Munich Hans-Peter Weiß1
(since 19 March 2012) Chairman of the Plant III Works Council, Linde Material Handling GmbH, Kahl 1 Employee representatives
[ 45 ] Auditors' fees
The fees recognised as an expense and paid to the auditors of the consolidated financial statements in 2012
amounted to €960 thousand (2011: €970 thousand) for the audit of the financial statements, €650 thousand (2011: €892 thousand) for other attestation services, €444 thousand (2011: €206 thousand) for tax consultancy services and €45 thousand (2011: €63 thousand) for other services.
KION Holding 1 GmbH Notes to the consolidated financial statements for the year ended 31 December 2012
Page 88 of 88
[ 46 ] Events after the reporting date
The KION Group issued a corporate bond for €650,000 thousand through the consolidated subsidiary KION Finance S.A., Luxembourg, in February 2013. Of the bond's total par value of €650,000 thousand,
€450,000 thousand is repayable at a fixed interest rate of 6.75 per cent p.a., while €200,000 thousand carries a floating interest rate based on three-month Euribor plus a margin of 4.5 percentage points. The payout amount for the variable portion was €1,000 thousand below the par value (discount). The interest on the fixed-rate tranche is
paid semi-annually, while interest on the floating-rate tranche is paid once a quarter. The bond's principal is redeemed as a bullet payment on maturity. Of the total proceeds of €649,000 thousand, €636,000 thousand was used to repay existing senior facility agreement (SFA) liabilities and €13,000 thousand will be used to pay the
expected transaction costs.
[ 47 ] Information on preparation and approval
The Executive Board of KION Holding 1 GmbH prepared the consolidated financial statements on 13 March 2013
and approved them for forwarding to the Supervisory Board. The Supervisory Board has the task of examining and deciding whether to approve the consolidated financial statements.
Wiesbaden, 13 March 2013
The Executive Board
Gordon Riske Bert-Jan Knoef Theodor Maurer
Ching Pong Quek Dr Thomas Toepfer

KION Holding 1 GmbH List of shareholdings for the year ended 31 December 2012
Annex to the notes
List of shareholdings as of December 31, 2012
according to section 313 para. 2 No. 1-4 Commercial Code (HGB)
No. Name Registered office CountryParent
companyHolding
in (%)
Equity, Local
GAAP, TEUR
Earnings,Local GAAP,
TEUR Note
1 KION Holding 1 GmbH Wiesbaden Germany 1,299,794 -33,574
Consolidated affiliated companiesDomestic
2 BlackForxx GmbH Stuhr Germany 19 100.00% 757 0 [B]
3 Eisenwerk Weilbach GmbH Wiesbaden Germany 11 100.00% 288 0 [A]
4 Fahrzeugbau GmbH Geisa Geisa Germany 19 100.00% 7,329 0 [B]
5 KION Financial Services GmbH Wiesbaden Germany 11 100.00% 1,558 0 [A]
6 KION GROUP GmbH Wiesbaden Germany 7 100.00% 485,611 -57,802
7 KION Holding 2 GmbH Wiesbaden Germany 1 100.00% 1,115,331 0 [E]
8 KION Information Management Services GmbH Wiesbaden Germany 6 100.00% 129 0 [D]
9 KION Warehouse Systems GmbH Reutlingen Germany 19 100.00% 22,670 0 [B]
10 Klaus Pahlke GmbH & Co. Fördertechnik KG Haan Germany 11 100.00% 12,177 2,502
11 Linde Material Handling GmbH Aschaffenburg Germany 6 100.00% 461,786 180,264
12 LMH Immobilien GmbH & Co. KG Aschaffenburg Germany 11 & 13 99.64% 42,361 14,196
13 LMH Immobilien Holding GmbH & Co. KG Aschaffenburg Germany 11 94.00% 247 67
14 LMH Immobilien Holding Verwaltungs-GmbH Aschaffenburg Germany 11 100.00% 29 2
15 LMH Immobilien Verwaltungs-GmbH Aschaffenburg Germany 11 100.00% 29 1
16 OM Deutschland GmbH Neuhausen a.d. Fildern Germany 65 100.00% -2,041 -876 [R]
17 Schrader Industriefahrzeuge GmbH & Co. KG Essen Germany 11 100.00% 2,322 2,378
18 STILL Financial Services GmbH Hamburg Germany 5 100.00% 1,533 0 [C]
19 STILL Gesellschaft mit beschränkter Haftung Hamburg Germany 11 100.00% 206,247 0 [A]
20 Urban-Transporte Gesellschaft mit beschränkter Haftung Unterschleißheim Germany 11 100.00% 3,181 0 [A]
Foreign
21 Linde Material Handling Pty. Ltd. Huntingwood Australia 11 100.00% 42,965 3,519
22 STILL N.V. Wijnegem Belgium 19 & 69 100.00% 7,373 1,911
23 KION South America Fabricação de Equipamentos para Armazenagem Rio de Janeiro Brazil 19 100.00% 19,730 1,451
Ltda.
24 KION Baoli (Jiangsu) Forklift Co., Ltd. Jiangjiang China 58 100.00% 23,242 -3,518
25 Linde (China) Forklift Truck Corporation Ltd. Xiamen China 11 100.00% 149,653 39,518
26 STILL DANMARK A/S Kolding Denmark 19 100.00% 4,890 437
27 BARTHELEMY MANUTENTION SAS Vitrolles France 31 88.40% 3,265 1,229
28 Bastide Manutention SAS Toulouse France 31 100.00% 2,517 689
29 Bretagne Manutention S.A. Pacé France 31 54.27% 7,226 3,689
30 FENWICK FINANCIAL SERVICES SAS Elancourt France 32 100.00% 2,336 0
31 FENWICK-LINDE S.A.R.L. Elancourt France 32 & 11 100.00% 183,867 22,570
32 KION France SERVICES SAS Elancourt France 11 100.00% 122,828 9,193
33 LOIRE OCEAN MANUTENTION SAS Saint-Herblain France 31 87.81% 4,725 2,842
34 Manuchar S.A. Gond Pontouvre France 31 100.00% 3,416 1,613
35 MANUSOM SAS Rivery France 40 50.13% 676 193
36 OM PIMESPO FRANCE S.A.S. Mitry Mory France 65 100.00% -384 -156 [R]
37 SAS Société Angoumoisine de Manutention - SAMA Champniers France 40 100.00% 14,332 777
38 SM Rental SAS Roissy Charles de Gaulle France 31 100.00% 1,447 870
39 STILL Location Services SAS Marne la Vallée France 32 100.00% 869 48
40 STILL SAS Marne la Vallée France 32 100.00% 22,319 28,660
41 KION FINANCIAL SERVICES Ltd. Basingstoke U.K. 56 100.00% 3,783 586
42 Linde Castle Ltd. Basingstoke U.K. 47 100.00% 4,927 1,119
43 Linde Creighton Ltd. Basingstoke U.K. 47 100.00% 10,722 3,050
44 Linde Heavy Truck Division Ltd. Basingstoke U.K. 47 100.00% 49,910 -16,583
45 Linde Holdings Ltd. Basingstoke U.K. 56 100.00% 272,483 4,102
46 Linde Jewsbury’s Ltd. Basingstoke U.K. 47 100.00% 8,442 2,131
47 Linde Material Handling (UK) Ltd. Basingstoke U.K. 45 100.00% 86,909 5,811
48 Linde Material Handling East Ltd. Basingstoke U.K. 47 100.00% 477 1,928
49 Linde Material Handling Scotland Ltd. Basingstoke U.K. 47 100.00% 7,956 1,325
50 Linde Material Handling South East Ltd. Basingstoke U.K. 47 100.00% 2,497 -277
51 Linde Severnside Ltd. Basingstoke U.K. 47 100.00% 8,112 854
52 Linde Sterling Ltd. Basingstoke U.K. 47 100.00% 9,686 1,828
53 McLEMAN FORK LIFT SERVICES LTD. Basingstoke U.K. 43 100.00% 1,552 153 [1]
54 OM PIMESPO (UK) Ltd. Basingstoke U.K. 65 100.00% -226 -23 [R]
55 STILL Materials Handling Ltd. Exeter U.K. 56 100.00% -21,676 -3,027
56 Superlift UK Ltd. Basingstoke U.K. 11 100.00% 45,616 -8,320
57 Trifik Services Ltd. Basingstoke U.K. 47 100.00% 0 0 [R]
58 KION ASIA (HONG KONG) Ltd. Kwai Chung Hong-Kong 11 100.00% 29,085 -433
59 Linde Material Handling Hong Kong Ltd. Kwai Chung Hong-Kong 11 100.00% 3,171 803
60 Voltas Material Handling Private Limited Pune India 83 100.00% 15,416 -1,697
61 Linde Material Handling (Ireland) Ltd. Walkinstown Ireland 45 100.00% 5,905 -376
62 COMMERCIALE CARRELLI S.r.l. Lainate Italy 67 & 63 100.00% 483 -42
63 KION Rental Services S.p.A. Milan Italy 64 & 65 & 67 100.00% 6,662 -84
64 Linde Material Handling Italia S.p.A. Buguggiate Italy 11 100.00% 16,209 417
65 OM Carrelli Elevatori S.p.A. Lainate Italy 11 & 67 100.00% 45,161 -10,618

KION Holding 1 GmbH List of shareholdings for the year ended 31 December 2012
Annex to the notes
No. Name Registered office CountryParent
companyHolding
in (%)
Equity, Local
GAAP, TEUR
Earnings,Local GAAP,
TEUR Note
Consolidated affiliated companiesForeign
66 QUALIFT S.p.A. (formerly: Cailotto Carrelli S.p.A.) Verona Italy 64 100.00% 1,097 -436
67 STILL ITALIA S.p.A. Lainate Italy 19 100.00% 8,240 -105
68 KION Finance S.A. Luxembourg Luxembourg - - 27 -2 [4]
69 STILL Intern Transport B.V. Hendrik Ido Ambacht Netherlands 19 100.00% 15,908 4,377
70 AUSTRO OM PIMESPO Fördertechnik GmbH Linz Austria 65 100.00% 9,845 -26
71 Linde Fördertechnik GmbH Linz Austria 11 & 70 100.00% 10,130 919
72 STILL Ges.m.b.H. Wiener Neudorf Austria 19 100.00% 4,710 957
73 Linde Material Handling Polska Sp. z o.o. Warsaw Poland 11 100.00% 15,907 3,117
74 STILL POLSKA Spólka z o.o. Gadki Poland 19 100.00% 13,131 2,475
75 OOO "Linde Material Handling Rus" Moscow Russia 11 & 3 100.00% 5,125 303
76 OOO "STILL Forklifttrucks" Moscow Russia 11 & 19 100.00% 1,659 434
77 STILL MOTOSTIVUITOARE S.R.L. Giurgiu Romania 11 & 19 100.00% 664 131
78 Linde Material Handling AB Örebro Sweden 11 100.00% 39,818 8,162
79 STILL Sverige AB Stockamöllan Sweden 19 100.00% 2,208 20
80 Linde Lansing Fördertechnik AG Dietlikon Switzerland 11 100.00% 13,585 3,082
81 STILL AG Otelfingen Switzerland 19 100.00% 7,829 2,837
82 KION South Asia Pte. Ltd. Singapore Singapore 11 100.00% -58 -58 [3]
83 Linde Material Handling Asia Pacific Pte. Ltd. Singapore Singapore 11 100.00% 30,545 1,461
84 Linde Material Handling Slovenska republika s.r.o. Trencin Slovakia 11 & 94 100.00% 2,467 416
85 STILL SR, spol. s r.o. Nitra Slovakia 19 & 96 100.00% 1,360 136
86 Linde Vilicar d.o.o. Celje Slovenia 11 100.00% 1,396 32
87 IBER-MICAR S.L. Gava Spain 11 100.00% 3,102 58
88 Islavista Spain S.A.U. L’Hospitalet de Llobregat Spain 11 100.00% 26,895 -5,506
89 KION Rental Services S.A.U. L’Hospitalet de Llobregat Spain 88 100.00% 3,060 378
90 Linde Holding de Inversiones S.R.L. Pallejá Spain 88 100.00% 31,079 6
91 Linde Material Handling Ibérica, S.A.U. Pallejá Spain 90 100.00% 47,517 1,355
92 STILL, S.A.U. L’Hospitalet de Llobregat Spain 88 100.00% 15,101 -791
93 Linde Material Handling (Pty) Ltd. Linbro Park South Africa 11 100.00% 19,543 1,939
94 Linde Material Handling Ceská republika s r.o. Prague Czech Republic 11 & 19 100.00% 8,736 2,098
95 Linde Pohony s r.o. Ceský Krumlov Czech Republic 11 100.00% 37,665 9,836
96 STILL CR spol. s r.o. Prague Czech Republic 11 & 19 100.00% 5,778 1,635
97 Linde Magyarország Anyagmozgatási Kft. Dunaharaszti Hungary 11 100.00% 1,409 172
98 STILL Kft. Környe Hungary 19 100.00% 1,349 310
99 Linde Material Handling North America Corporation Summerville United States 11 100.00% -2,701 1,817
Non-consolidated affiliated companiesDomestic
100 Klaus Pahlke Betriebsführungs-GmbH Haan Germany 11 100.00% 46 1 [1]
101 proplan Transport- und Lagersysteme GmbH Aschaffenburg Germany 1 100.00% 573 0 [E]
102 Schrader Industriefahrzeuge Verwaltung GmbH Essen Germany 11 100.00% 72 4 [1]
Foreign
103 Lansing Bagnall (Aust.) Pty. Ltd. Huntingwood Australia 47 & 11 100.00% 2,194 0 [1]
104 Baoli France SAS Elancourt France 32 100.00% 131 -166 [3]
105 SCI Champ Lagarde Elancourt France 31 100.00% 104 0 [1]
106 URBAN LOGISTIQUE SAS Elancourt France 20 100.00% 1,437 227 [1]
107 Castle Lift Trucks Ltd. Basingstoke U.K. 47 100.00% 846 1,046 [1]
108 Creighton Materials Handling Ltd. Basingstoke U.K. 47 100.00% 0 0 [1], [R]
109 D.B.S. Brand Factors Ltd. Basingstoke U.K. 52 100.00% 0 0 [1], [R]
110 Fork Truck Rentals Ltd. Basingstoke U.K. 47 100.00% 356 0 [1], [R]
111 Fork Truck Training Ltd. Basingstoke U.K. 47 100.00% 0 0 [1], [R]
112 Lancashire (Fork Truck) Services Ltd. Basingstoke U.K. 52 100.00% 0 0 [1], [R]
113 Stephensons Enterprise Fork Trucks Ltd. Basingstoke U.K. 52 100.00% 0 0 [1], [R]
114 Sterling Mechanical Handling Ltd. Basingstoke U.K. 47 100.00% 1,240 0 [1], [R]
115 Urban Logistics (UK) Ltd. Basingstoke U.K. 20 100.00% 473 127 [1]
116 Handling & Storage Equipment (Ireland) Ltd. Walkinstown Ireland 61 100.00% 0 0 [1], [R]
117 Carest SRL Lainate Italy 65 100.00% 10 -1 [1], [R]
118 Milano Carrelli Elevatori S.r.l. Monza Italy 65 100.00% 14 -7 [1], [R]
119 URBAN LOGISTIKA S.R.L. Lainate Italy 20 100.00% 48 6 [1]

KION Holding 1 GmbH List of shareholdings for the year ended 31 December 2012
Annex to the notes
No. Name Registered office CountryParent
companyHolding
in (%)
Equity, Local
GAAP, TEUR
Earnings,Local GAAP,
TEUR Note
Non-consolidated affiliated companiesForeign
120 TOO "Linde Material Handling Kazakhstan" Almaty Kazakhstan 11 & 3 100.00% 117 -31
121 Linde Viljuskari d.o.o. Belgrade Serbia 71 100.00% 86 15 [1]
122 STILL VILICAR d.o.o. Ljubljana Slovenia 19 100.00% -1,087 -91 [1]
123 Baoli Material Handling Ceská republika s r.o. Teplice Czech Republic 94 100.00% -58 -65
124 Urban Transporte spol. s.r.o. Moravany u Brna Czech Republic 20 100.00% 1,666 812 [1]
125 TOV "Linde Material Handling Ukraine" Kiev Ukraine 11 & 3 100.00% 783 -261
Associates (at-equity investments)Domestic
126 Beutlhauser-Bassewitz GmbH & Co. KG Hagelstadt Germany 11 25.00% 8,470 3,126 [1]
127 Hans Joachim Jetschke Industriefahrzeuge (GmbH & Co.) KG Hamburg Germany 11 21.00% 5,604 3,504 [1]
128 Linde Leasing GmbH Wiesbaden Germany 11 45.00% 30,805 2,687 [1]
129 Linde Hydraulics GmbH & Co. KG Aschaffenburg Germany 11 30.00% - - [3]
130 MV Fördertechnik GmbH Blankenhain Germany 11 25.00% 1,017 71 [1]
131 Pelzer Fördertechnik GmbH Kerpen Germany 11 24.96% 16,048 290 [1]
132 Willenbrock Fördertechnik Holding GmbH Bremen Germany 11 23.00% 11,862 4,025 [1]
Foreign
133 Linde High Lift Chile S.A. Santiago de Chile Chile 11 45.00% 12,653 1,353 [1]
Joint Ventures (at-equity investments)Domestic
134 Eisengießerei Dinklage GmbH Dinklage Germany 19 50.00% 4,126 140 [1]
Foreign
135 JULI Motorenwerk s.r.o. Moravany Czech Republic 11 & 19 50.00% 25,952 5,513
Associates (accounted at cost)Domestic
136 JETSCHKE GmbH Hamburg Germany 11 22.00% 70 3 [1]
137 Linde Hydraulics Verwaltungs GmbH Aschaffenburg Germany 11 30.00% - - [3]
138 Supralift Beteiligungs- und Kommunikationsgesellschaft mbH Hofheim am Taunus Germany 11 50.00% 19 1 [1]
139 Supralift GmbH & Co. KG Hofheim am Taunus Germany 11 50.00% 805 8
Foreign
140 Labrosse Equipement S.A. Saint-Peray France 31 34.00% 6,327 1,736 [1]
141 Normandie Manutention S.A. Le Grand Quevilly France 31 34.00% 17,264 3,389 [1]
142 Chadwick Materials Handling Ltd. Corsham U.K. 47 48.00% 1,316 24 [1]
143 EUROPA CARRELLI S.R.L. Bastia Umbra Italy 67 40.00% 562 -14 [2]
144 Nordtruck AB Örnsköldsvik Sweden 78 25.00% 721 324 [2]
145 Carretillas Elevadoras Sudeste S.A. Murcia Spain 91 38.53% 4,014 289
146 CAYSA MANUTENCION S.L. Valladolid Spain 91 & 145 46.71% 143 -1
147 Motorové závody JULI CZ s r.o. Moravany Czech Republic 11 50.00% 8 0 [2]
Other investmentsForeign
148 TPZ Linde Vilicari Hrvatska d.o.o. (formerly: Linde Vilicari Hrvatska Zagreb Croatia 11 20.00% 168 20 [1]
d.o.o.)
[1] Financial figures as of 31 December 2011
[2] Last provided financial statement
[3] New during 2012
[4] Consolidated as required by IAS 27 in conjunction with SIC-12 (''Consolidation - special purpose entities'')
[A] Profit and loss transfer agreement with Linde Material Handling GmbH [R] Dormant company
[B] Profit and loss transfer agreement with STILL Gesellschaft mit beschränkter Haftung
[C] Profit and loss transfer agreement with KION Financial Services GmbH
[D] Profit and loss transfer agreement with KION GROUP GmbH
[E] Profit and loss transfer agreement with KION Holding 1 GmbH

The following auditor’s report (Bestätigungsvermerk) has been issued in accordance with § 322 German
Commercial Code (Handelsgesetzbuch) in German language on the German version of the consolidated financial statements of KION Holding 1 GmbH as of and for the fiscal year ended December 31, 2012 and the group management report.
Independent Auditors’ Report We have audited the consolidated financial statements prepared by KION Holding 1 GmbH,
Wiesbaden/Germany, - comprising the consolidated income statement, consolidated statement of comprehensive income, consolidated statement of financial position, consolidated statement of cash flows, consolidated statement of changes in equity and the notes to the consolidated financial statements - and the group
management report for the business year from 1 January to 31 December 2012. The preparation of the consolidated financial statements and the group management report in accordance with IFRS, as adopted by the EU, as well as the regulations under German commercial law complementarily applicable under § 315a (1)
German Commercial Code (HGB) are the responsibility of the parent company's management. Our responsibility is to express an opinion on the consolidated financial statements and on the group management report based on our audit.
We conducted our audit of the consolidated financial statements in accordance with § 317 HGB ("German Commercial Code") and German generally accepted standards for the audit of financial statements promulgated
by the Institut der Wirtschaftsprüfer. Those standards require that we plan and perform the audit such that misstatements materially affecting the presentation of the net assets, financial position and results of operations in the consolidated financial statements in accordance with the applicable financial reporting framework and in the
group management report are detected with reasonable assurance. Knowledge of the business activities and the economic and legal environment of the Group and expectations as to possible misstatements are taken into account in the determination of audit procedures. The effectiveness of the accounting-related internal control
system and the evidence supporting the disclosures in the consolidated financial statements and the group management report are examined primarily on a test basis within the framework of the audit. The audit includes assessing the annual financial statements of those entities included in consolidation, the determination of entities
to be included in consolidation, the accounting and consolidation principles used and significant estimates made by management, as well as evaluating the overall presentation of the consolidated financial statements and the group management report. We believe that our audit provides a reasonable basis for our opinion.
Our audit has not led to any reservations.
In our opinion, based on the findings of our audit, the consolidated financial statements of KION Holding 1 GmbH, Wiesbaden/Germany, comply with IFRS, as adopted by the EU, as well as the regulations under German commercial law complementarily applicable under § 315a (1) German Commercial Code (HGB) and give a true
and fair view of the net assets, financial position and results of operations of the Group in accordance with these requirements. The group management report is consistent with the consolidated financial statements and as a whole provides a suitable view of the Group's position and suitably presents the opportunities and risks of future
development. Frankfurt am Main/Germany, 13 March 2013
Deloitte & Touche GmbH Wirtschaftsprüfungsgesellschaft
Signed: Kompenhans Signed: J. Löffler Wirtschaftsprüfer Wirtschaftsprüfer
[German Public Auditor] [German Public Auditor]