Embed Size (px)
Citation preview

King’s Christian College Chambers Flat
Traffic Impact Assessment HRP16055
Prepared for King’s Christian College
16 May 2016
King’s Christian College Chambers Flat
Traffic Impact Assessment HRP16055

King’s Christian College Chambers Flat Traffic Impact Assessment
HRP16055 16 May 2016Cardno 16 May 2016 Prepared for King’s Christian College ii
Document Information Prepared for King’s Christian College
Project Name Traffic Impact Assessment
File Reference HRP16055 King's Christian College TIA Report 20160511.docx
Job Reference HRP16055
Date 16 May 2016
Contact Information Cardno (Qld) Pty Ltd
ABN 57 051 074 992
Level 11 Green Square North Tower
515 St Paul’s Terrace
Locked Bag 4006
Fortitude Valley Qld 4006
Telephone: 07 3369 9822
Facsimile: 07 3369 9722
International: +61 7 3369 9822
www.cardno.com.au
Document Control
Ve
rsio
n
Date Description of Revision
Au
tho
r
Init
ials
Author
Signature
Rev
iew
er
Init
ials
Reviewed Signature
01 16/05/16 Draft Issue JZ/ALW
ASJ
Ve
rsio
n
Reason for Issue / Stage of Deliverable
Ap
pro
ve
r
Init
ials
Approved
Signature
Approved Release Date
01 Team Review ASJ
© Cardno 2016. Copyright in the whole and every part of this document belongs to Cardno and may not be used, sold, transferred, copied or reproduced in whole or in part in any manner or form or in or on any media to any person other than by agreement with Cardno.
This document is produced by Cardno solely for the benefit and use by the client in accordance with the terms of the engagement. Cardno does not and shall not assume any responsibility or liability whatsoever to any third party arising out of any use or reliance by any third party on the content of this document.

King’s Christian College Chambers Flat Traffic Impact Assessment
HRP16055 16 May 2016Cardno 16 May 2016 Prepared for King’s Christian College iii
Table of Contents
1 Introduction 1
1.1 Overview 1
1.2 Previous Studies 1
2 Existing Conditions 2
2.1 Site Location 2
2.2 Road Network 2
2.3 Existing Traffic Volumes 3
2.4 Public Transport Network 4
2.5 Active Transport Network 5
3 Proposed development 7
3.1 Development Yields 7
3.2 Proposed Access Arrangement 7
3.3 Proposed Parking Arrangement 7
4 Design Considerations 8
4.1 Car Parking 8
4.2 Bicycle Parking 8
4.3 Car Parking Configuration 9
5 Traffic Demands 11
5.1 Assessment Scenarios 11
5.2 Background Traffic Volumes 11
5.3 Development Generated Volumes 13
5.4 Post Development Volumes 17
6 Traffic Impact Assessment 20
6.1 Assessment Criteria 20
7 Traffic Impact Assessment 21
7.1 Waterford-Tamborine Road/Anzac Avenue 21
7.2 Chambers Flat Road/Kenny Road 22
7.3 Anzac Avenue/School Access (East) 22
7.4 Anzac Avenue/School Access (West) 23
7.5 Signal Installation Timing 24
8 Conclusions 26
Tables
Road Network Summary 2
School Bus Route 4
Student Summary 7
Access Arrangement Summary 7
Parking Requirements 8
Car Parking Provision 8
Bicycle Parking Requirement 9
Design Summary 9
School Development Summary 13

King’s Christian College Chambers Flat Traffic Impact Assessment
HRP16055 16 May 2016Cardno 16 May 2016 Prepared for King’s Christian College iv
Travel Assumptions 13
Peak Hour Trip Generation Summary 14
GARID Thresholds for Intersection Performance 20
RMS Level of Service (LOS) Criteria for Intersections 20
Waterford-Tamborine Road/Anzac Avenue Intersection Operation 22
Chambers Flat Road/Kenny Road Intersection Operation 22
Anzac Avenue/Eastern Site Access Intersection Operation 23
Anzac Avenue/Western Site Access Intersection Operation 24
Figures
Figure 1-1 Proposed school site 1
Figure 2-1 Existing Road Network 2
Figure 2-2 Existing Volumes – AM School Peak Period 3
Figure 2-3 Existing Volumes – PM School Peak Period 4
Figure 2-4 School Bus Route No. 21 5
Figure 2-5 Proposed Future Cycle Network 6
Figure 5-1 2026 Base Volumes – Am Peak 11
Figure 5-2 2026 Base Volumes – Pm Peak 12
Figure 5-3 2036 Base Volumes – Am Peak 12
Figure 5-4 2036 Base Volumes – Pm Peak 12
Figure 5-5 AM Peak Distribution 14
Figure 5-6 PM Peak Distribution 15
Figure 5-7 2026 Development Traffic Volumes – AM Peak 15
Figure 5-8 2026 Development Traffic Volumes – PM Peak 16
Figure 5-9 2036 Development Traffic Volumes – AM Peak 16
Figure 5-10 2036 Development Traffic Volumes – PM Peak 17
Figure 5-11 2026 Post Development Volumes – AM Peak 17
Figure 5-12 2026 Post Development Volumes – PM Peak 18
Figure 5-13 2036 Post Development Volumes – AM Peak 18
Figure 5-14 2036 Post Development Volumes – PM Peak 19
Figure 7-1 Waterford-Tamborine Road/Anzac Avenue Upgrade Layout 21
Figure 7-2 Eastern Site Access Configuration 23
Figure 7-3 Western Site Access Configuration 24
Figure 7-4 Eastern Access Point 25
Figure 7-5 Western Access Point 25
Appendices
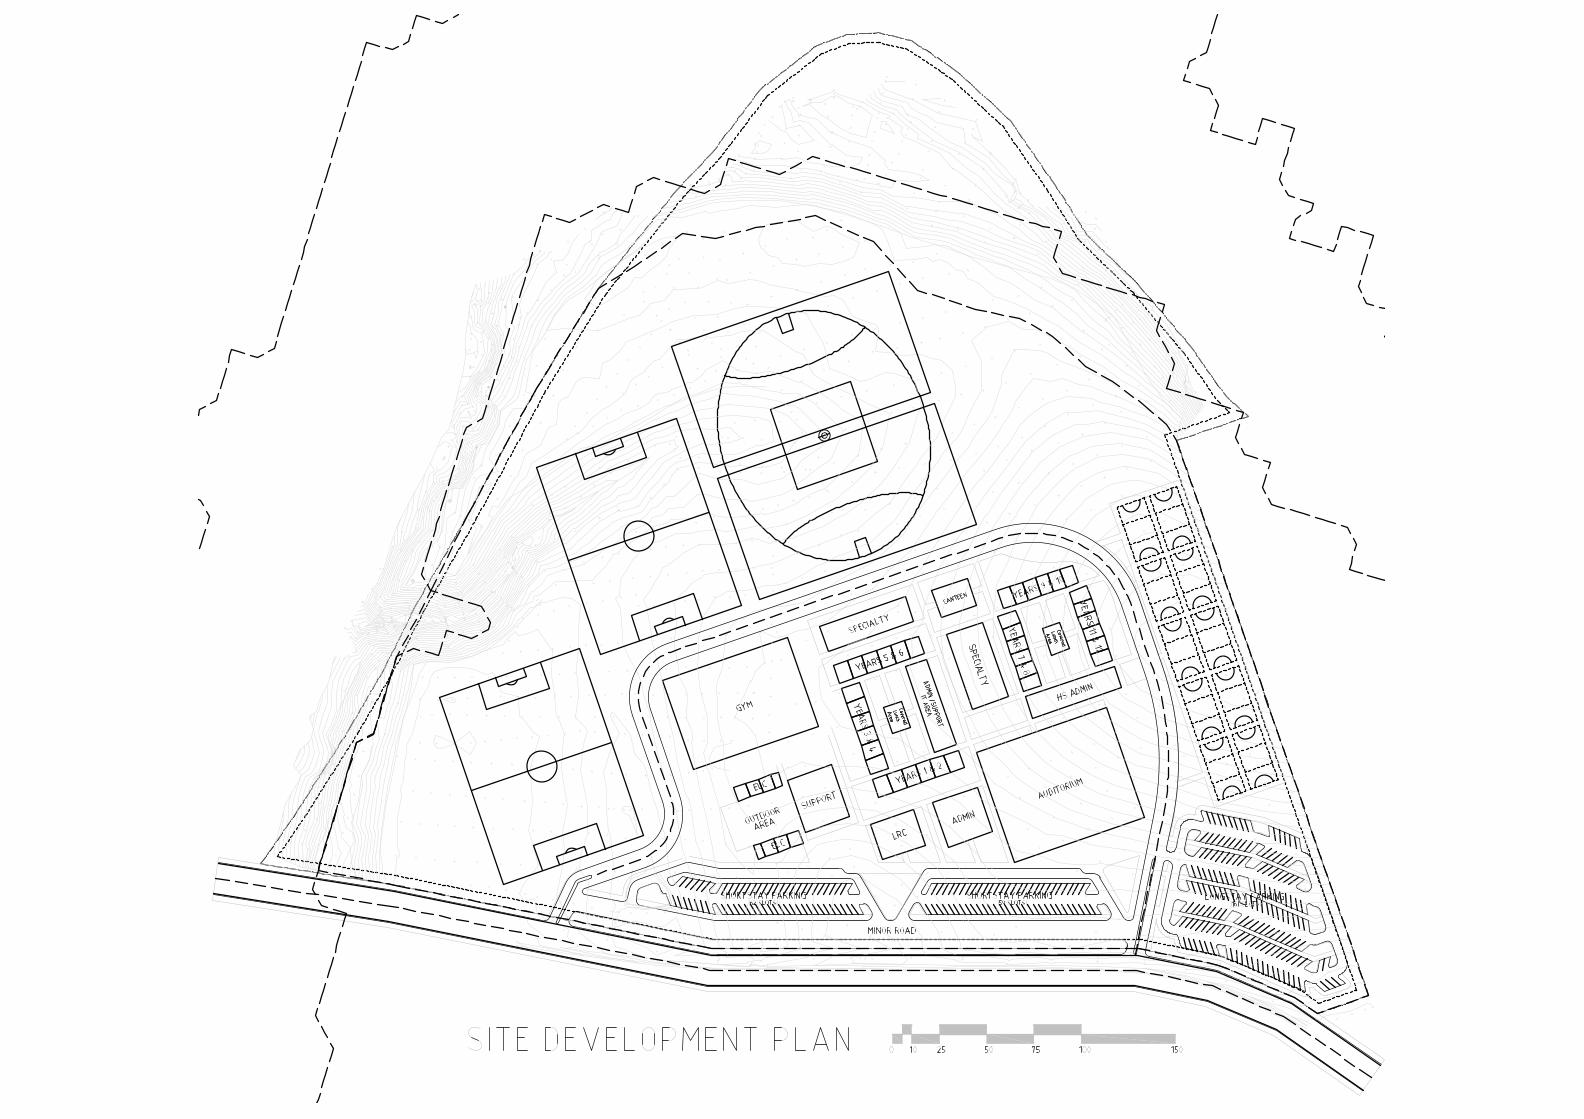
Appendix A Development Plans
Appendix B Waterford-Tamborine Road Upgrade DTMR Summary
Appendix C SIDRA Intersection Results

King’s Christian College Chambers Flat Traffic Impact Assessment
HRP1605516 May 2016 Cardno 16 May 2016 Prepared for King’s Christian College Page 1
1 Introduction
1.1 Overview
Cardno has been commissioned by King’s Christian College (King’s) to provide traffic engineering advice in
relation to the proposed school development located at 38-112 Anzac Avenue, Chambers Flat.
King’s is proposing to construct a new Prep to Grade 12 Educational establishment, with an estimated
maximum capacity of 2,045 students and 230 staff in 2026. A copy of the proposed development plan is
included in Appendix A. The purpose of this Traffic Impact Assessment (TIA) is to identify potential traffic
impacts on the surrounding transport network.
Figure 1-1 Proposed school site
1.2 Previous Studies
A due diligence assessment was undertaken by Cardno on behalf of King’s for the subject site dated January
2016. This document identified traffic and transport constraints affecting the site.

King’s Christian College Chambers Flat Traffic Impact Assessment
HRP1605516 May 2016 Cardno 16 May 2016 Prepared for King’s Christian College Page 2
2 Existing Conditions
2.1 Site Location
The proposed school site is located in the Logan Village area, on Anzac Avenue just west of Waterford-
Tamborine Road. The site is bordered by Anzac Ave in the north, Logan River in the south and east, and rural
property on the west. The site is only accessible from Anzac Avenue. The Logan Village area includes
residential, retail and rural land uses.
2.2 Road Network
2.2.1 Existing Road Network
The proposed location for the school is adjacent to Anzac Avenue, which is an arterial road. Immediately east
of the proposed school site Anzac Avenue Bridge crosses the Logan River. Major connections to Anzac Ave
include Waterford-Tamborine Road (Strategic Arterial Road), Chambers Flat Road (Arterial Road), and Mount
Lindesay Highway (Motorway/Highway). Table 2-1 below describes the function, form and posted speed of
each road mentioned above.
Road Network Summary
Road Function Form Posted Speed
Authority
Anzac Avenue Arterial Road Two lane, two-way 80km/h (60km/h) LCC
Anzac Ave Bridge Arterial Road Two lane, two-way 80km/h LCC
Waterford-Tamborine Road Strategic Arterial Road Two lane, two-way 80km/h TMR
Chambers Flat Road Arterial Road Two lane, two-way 80km/h LCC
Mt Lindesay Hwy Motorway/Highway Two lane, two-way 90km/h TMR
Figure 2-1 Existing Road Network
King’s Christian College Chambers Flat Traffic Impact Assessment
HRP1605516 May 2016 Cardno 16 May 2016 Prepared for King’s Christian College Page 3
2.2.2 Proposed Road Network
2.2.2.1 Logan City Council Proposals
Logan Planning Scheme 2015 (‘planning scheme’) maps show no proposed local government trunk road
infrastructure in the vicinity of the proposed school site.
2.2.2.2 Department of Transport and Main Roads Proposals
The Department of Transport and Main Roads (DTMR) has proposed future works for Waterford – Tamborine
Road, a strategic arterial road. From Anzac Avenue to Hotz Road, Waterford – Tamborine Road will be
upgraded from 2 lanes to 4 lanes with the Anzac Avenue/Waterford-Tamborine Road intersection to be
signalised. A copy of the DTMR information pamphlet outlining the upgrades is provided at Appendix B.
2.2.3 Conclusion
The existing road network provides major connections to the proposed school site, via Mt Lindsay Hwy and
Waterford-Tamborine Road. The upgrade of Waterford-Tamborine Road south of the proposed school site will
provide additional benefits for students and staff travelling from the south. Anzac Avenue provides direct
access to the proposed school site.
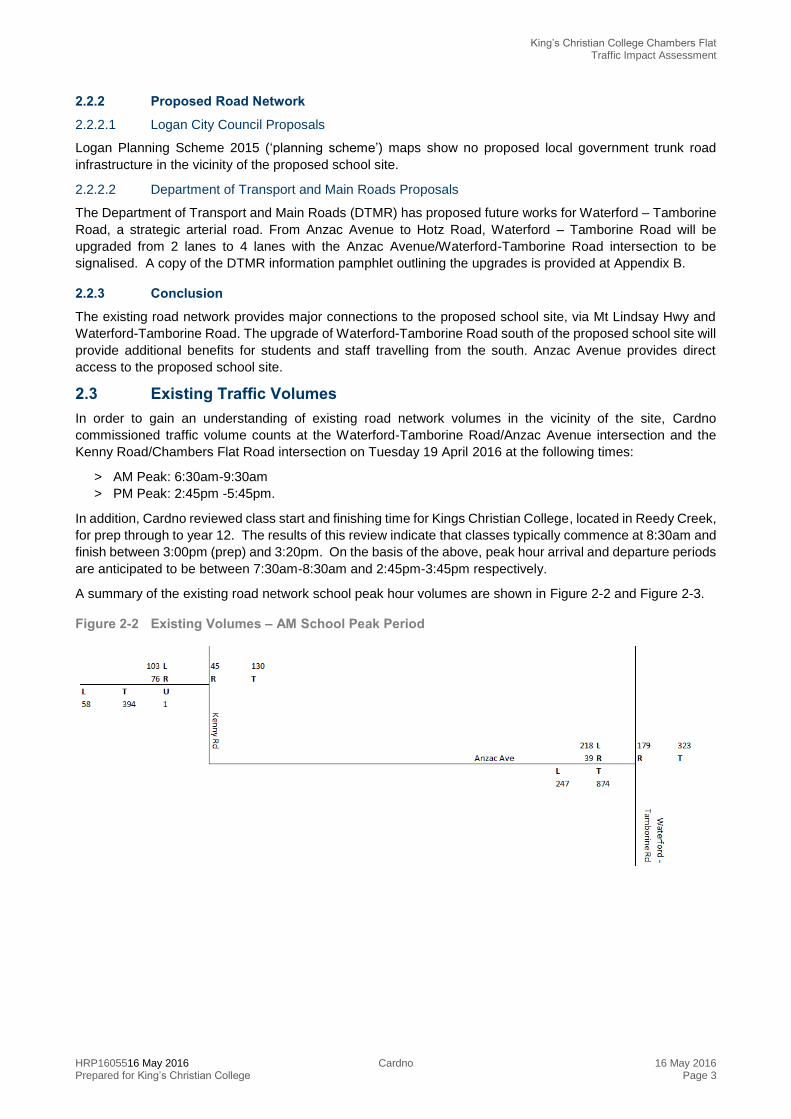
2.3 Existing Traffic Volumes
In order to gain an understanding of existing road network volumes in the vicinity of the site, Cardno
commissioned traffic volume counts at the Waterford-Tamborine Road/Anzac Avenue intersection and the
Kenny Road/Chambers Flat Road intersection on Tuesday 19 April 2016 at the following times:
> AM Peak: 6:30am-9:30am
> PM Peak: 2:45pm -5:45pm.
In addition, Cardno reviewed class start and finishing time for Kings Christian College, located in Reedy Creek,
for prep through to year 12. The results of this review indicate that classes typically commence at 8:30am and
finish between 3:00pm (prep) and 3:20pm. On the basis of the above, peak hour arrival and departure periods
are anticipated to be between 7:30am-8:30am and 2:45pm-3:45pm respectively.
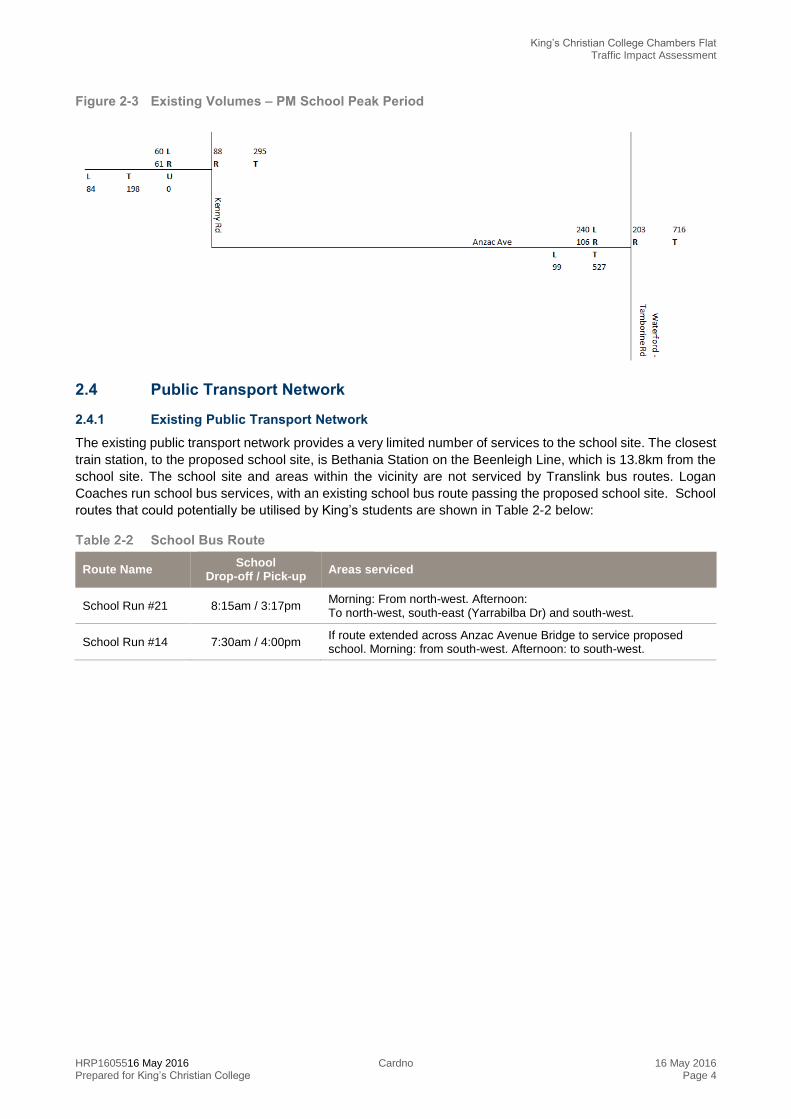
A summary of the existing road network school peak hour volumes are shown in Figure 2-2 and Figure 2-3.
Figure 2-2 Existing Volumes – AM School Peak Period
King’s Christian College Chambers Flat Traffic Impact Assessment
HRP1605516 May 2016 Cardno 16 May 2016 Prepared for King’s Christian College Page 4
Figure 2-3 Existing Volumes – PM School Peak Period
2.4 Public Transport Network
2.4.1 Existing Public Transport Network
The existing public transport network provides a very limited number of services to the school site. The closest
train station, to the proposed school site, is Bethania Station on the Beenleigh Line, which is 13.8km from the
school site. The school site and areas within the vicinity are not serviced by Translink bus routes. Logan
Coaches run school bus services, with an existing school bus route passing the proposed school site. School
routes that could potentially be utilised by King’s students are shown in Table 2-2 below:
School Bus Route
Route Name School
Drop-off / Pick-up Areas serviced
School Run #21 8:15am / 3:17pm Morning: From north-west. Afternoon: To north-west, south-east (Yarrabilba Dr) and south-west.
School Run #14 7:30am / 4:00pm If route extended across Anzac Avenue Bridge to service proposed school. Morning: from south-west. Afternoon: to south-west.

King’s Christian College Chambers Flat Traffic Impact Assessment
HRP1605516 May 2016 Cardno 16 May 2016 Prepared for King’s Christian College Page 5
Figure 2-4 School Bus Route No. 21
Source: Nearmap, Logan Coaches
2.4.2 Proposed Public Transport Network
According to the planning scheme, a Park ‘n’ Ride facility and secondary transit hub are planned for Logan
Village. The planning scheme maps also show a proposed long distance public transport corridor along Anzac
Ave, adjacent to the school site.
2.4.3 Conclusion
The existing public transport network provides very limited access to the proposed school, with one school bus
route currently servicing the proposed site. Future public transport infrastructure may provide increased
services to the proposed school, however the delivery timeline for this infrastructure is uncertain. It is likely that
further school bus services may be required to serve the proposed school.
2.5 Active Transport Network
2.5.1 Existing Active Transport Network
2.5.1.1 Walking
An existing footpath is provided over Anzac Avenue Bridge, however this footpath does not continue on either
side of the bridge. There is also no pedestrian link to the nearby My Home and The River Estate and other
residential areas.
2.5.1.2 Cycling
There is no existing cycling infrastructure provided in the vicinity of the school, or in the wider Logan Village
area.
2.5.2 Proposed Active Transport Network
2.5.2.1 Logan City Council (LCC) Proposals
The planning scheme proposes future infrastructure to facilitate active transport. For cycling, a major future
cycle network is planned along Anzac Avenue and a neighbourhood future cycle network between Anzac
Avenue, Mollenhagen Road and Logan Street.
King’s Christian College Chambers Flat Traffic Impact Assessment
HRP1605516 May 2016 Cardno 16 May 2016 Prepared for King’s Christian College Page 6
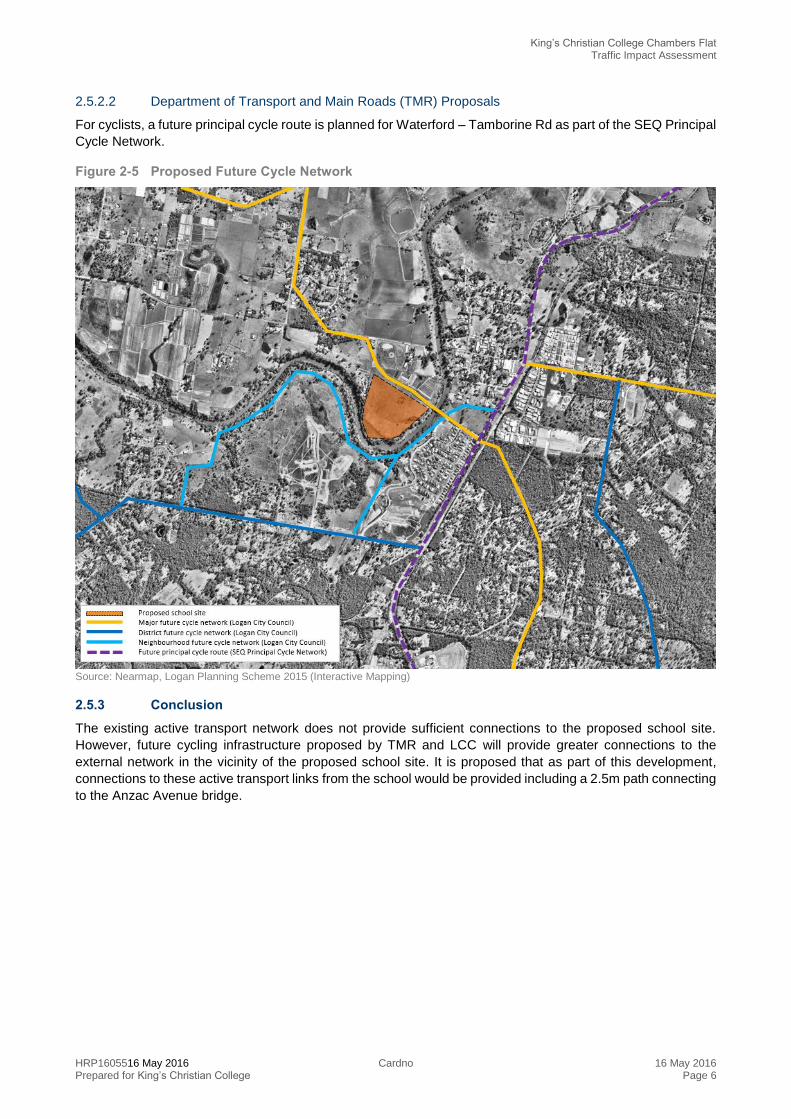
2.5.2.2 Department of Transport and Main Roads (TMR) Proposals
For cyclists, a future principal cycle route is planned for Waterford – Tamborine Rd as part of the SEQ Principal
Cycle Network.
Figure 2-5 Proposed Future Cycle Network
Source: Nearmap, Logan Planning Scheme 2015 (Interactive Mapping)
2.5.3 Conclusion
The existing active transport network does not provide sufficient connections to the proposed school site.
However, future cycling infrastructure proposed by TMR and LCC will provide greater connections to the
external network in the vicinity of the proposed school site. It is proposed that as part of this development,
connections to these active transport links from the school would be provided including a 2.5m path connecting
to the Anzac Avenue bridge.

King’s Christian College Chambers Flat Traffic Impact Assessment
HRP1605516 May 2016 Cardno 16 May 2016 Prepared for King’s Christian College Page 7
3 Proposed development
3.1 Development Yields
The proposed development is a Prep to Grade 12 Educational establishment, with an estimated maximum
capacity of 2,045 students and 230 staff in 2026 (based on advice from King’s). The proposed school will
include early learning, primary and secondary education and trade training. Along with a central administration,
student services, auditorium, canteen and library to serve all students. A summary of the student breakdown
by year is provided in Table 3-1.
Student Summary
Grade No. of Students
Early Learning 125 students
Primary 840 students
Secondary 1,080 students
Total 2,045 students
3.2 Proposed Access Arrangement
Two vehicle access points are proposed to be provided including an eastern full-turning movement intersection
and a western full-turning movement intersection. A summary of the vehicle access arrangement is provided
in Table 3-2.
Access Arrangement Summary
Access Point Drop-off/Pick-up Staff Buses
Eastern Access Entry trips only - Exit Only
Western Access Exit trips only Entry and Exit trips Entry Only
It is noted that the internal circulation road, south of the car parking entrance points, will service buses only,
providing a level of separation between bus and vehicular traffic.
3.3 Proposed Parking Arrangement
A total of 286 car parking spaces are proposed to be provided on-site including:
> 132 short stay parking spaces
> 154 long-term (staff) parking spaces.
Short stay and drop-off parking is to be located between the eastern and western access points to the site
while the long-term (staff) parking will be located to the west of the western access point, providing a level of
separation between short and long term parking demands.
Three bus set-down areas have also been provided on-site within the internal circulation road. It is noted that
the configuration of the bus set-down areas have been designed to ensure that students do not have to cross
the internal circulation road to access the main school buildings.
The suitability of the proposed car and bus parking arrangement is discussed in greater detail at Section 4 of
this report.

King’s Christian College Chambers Flat Traffic Impact Assessment
HRP1605516 May 2016 Cardno 16 May 2016 Prepared for King’s Christian College Page 8
4 Design Considerations
4.1 Car Parking
4.1.1 Planning Scheme Requirement
The parking requirements of the Logan Planning Scheme are provided within the Servicing, access and
parking code. A summary of the parking requirement specified by the Code is provided in Table 4-1.
Parking Requirements
Use Size
Car Parking Rate
Car Parking Requirement
Educational Establishment
2,045 students
1 space per 5 students for year 12 students and above; plus 1 visitor space per 10 students and 1 bus
space per 50 students
36 spaces for year 12 students[1]
205 visitor spaces
41 bus spaces
230 staff 1 space per employee 230 spaces
[1] Assuming that year 12 students represent 16.7% of the secondary student population (i.e. 180 students).
Further to the above, reference has been made to the parking requirements specified within TMR’s Safe
Transport Infrastructure at Schools document.
4.1.2 TMR Rates
TMR’s Safe Transport Infrastructure at Schools document provides guidance on the provision of transport
infrastructure at schools and incorporates a thorough breakdown of recommended car parking rates
specifically for school uses. A summary of the car parking provision specified by the TMR document is
provided in Table 4-2.
Car Parking Provision
Car Parking Type
Size/No. Car Parking
Rate Car Parking Requirement
Staff Parking 230 staff 0.7 spaces per staff member 161 spaces
Short-Term 1,920 (2,045-125 Prep) students 1 space per 15 students 128 spaces
Drop-Off 1,920 (2,045-125 Prep) students 20% of short-term provision 26 spaces
Prep 125 students 1 space per 8 students 16 spaces
As outlined above, the development generates a requirement to incorporate 161 staff spaces on-site, 128
short-term spaces, 26 drop-off spaces and 16 spaces for prep students.
4.1.3 Adequacy of Car Parking
Development plans indicate that a total of 286 car parking spaces are proposed on-site including 154 staff
parking spaces and 132 short-term spaces. Given that this provision exceeds the planning scheme rate and
is only 45 spaces short of the car parking guidance provided by TMR, the proposed car parking provision is
considered to be acceptable.
While the number of drop-off spaces is yet to be specified on development plans, the proposed provision which
accords with the TMR guidelines and car space dimensions, should be clearly shown on development plans.
4.2 Bicycle Parking
4.2.1 Planning Scheme Requirement
The Servicing, access and parking code does not specify a bicycle parking rate for educational establishments.
In this regard, reference has been made to TMR’s Safe Transport Infrastructure at Schools document.

King’s Christian College Chambers Flat Traffic Impact Assessment
HRP1605516 May 2016 Cardno 16 May 2016 Prepared for King’s Christian College Page 9
4.2.2 TMR Rates
A summary of the bicycle parking required to accord with TMR’s Safe Transport Infrastructure at Schools is
provided below.
Bicycle Parking Requirement
User Parking End of trip Facilities
Long term Short term Class Lockers Showers Toilet Wash Basin
Students 1 per 3
students - 1 or 2 -
Gymnasium and locker room use recommended
Staff 1 per 10
staff - 1 or 2
2 per bicycle space1
1 per 10 bicycle spaces
1 per 2 showers w/
minimum of 1 per
male/female
1 per shower
Visitors - 1 per 10% of
student parking 3 - - - -
Based on the rates outlined in Table 4-2, the development generates a requirement to provide:
> 682 student bicycle spaces
> 23 staff spaces
> 69 visitor spaces1.
Given the location of the site, it is anticipated that a bicycle parking provision of 1 space per 20 students will
be appropriate to accommodate bicycle parking demands generated by the development. It is recommended
that the provision of bicycle parking be monitored by the school as student numbers and bicycle parking
demands increase.
4.3 Car Parking Configuration
The car parking and access configuration has been assessed against the requirements of the Planning Scheme, the Australian Standards and the Department of Transport and Main Roads (TMR) Safe Transport Infrastructure at Schools document. A summary of the car parking design review is provided in Table 4-4.
Design Summary
Design Element
Proposed Design Design Requirement Compliance
Car Bay Dimensions
Car spaces are 3.0m wide by 5.7m (measured perpendicular to the kerb) and accessed via a 5.1m aisle
TMR’s document requires short term and drop-off parking to accord with the AS2890.1:2004 requirement for User Class 3/3A which requires a 3.0m wide by 5.7m long bay accessed via a 5.1m aisle for 60 degree parking.
The proposed car space dimensions accord with the requirements of AS2890.1:2004 for user class 3/3A
Disabled Parking
No accessible car spaces have been provided.
1 space per 100 spaces provided Three accessible parking spaces should be provided on-site. The design of these spaces should accord with Figure 2.3 of AS2890.6.
Pedestrian Connectivity
2.5m pedestrian paths have been provided
All internal pedestrian connections should be 4.5m to accord with the requirements of Schedule 1 of TMR’s document
Pedestrian path widths of 2.5m are proposed within the car parking area which is considered to be satisfactory. Pedestrian connections to the external road network should be shown on development plans and accord with the width requirements specified by TMR.
1 Interpreted to be 10% of the student bicycle parking rate.

King’s Christian College Chambers Flat Traffic Impact Assessment
HRP1605516 May 2016 Cardno 16 May 2016 Prepared for King’s Christian College Page 10
Design Element
Proposed Design Design Requirement Compliance
Vehicle Queuing
Internal queueing in the order of 10 vehicles is provided on-site (measured from the property boundary to the first kerb side drop-off space)
10 vehicle for short-term / drop off
2 vehicles to staff
The on-site queueing provision is considered to be satisfactory.
On the basis of the above, the proposed car parking configuration generally accords with the Australian
Standards and TMR guidelines and is considered to be satisfactory.

King’s Christian College Chambers Flat Traffic Impact Assessment
HRP1605516 May 2016 Cardno 16 May 2016 Prepared for King’s Christian College Page 11
5 Traffic Demands
5.1 Assessment Scenarios
TMR’s ‘Guidelines for Assessment of Road Impacts of Development’ states that for a traffic impact
assessment, the design horizon (i.e. year of assessment) should be 10 years after the opening of the
development. For the purpose of this report, it has been assumed that the proposed development could
reasonably be constructed and operational (80% student capacity) by 2026). As a result, the following design
horizons have been adopted:
> 2016 ‘Background’ – To establish existing operational conditions
> 2026 ‘Background’ – To establish baseline operational performance without development
> 2026 ‘With Development’ – To identify potential impacts associated with the development 10 years from
opening
> 2036 ‘Background’ – To establish future baseline operational performance without development
> 2036 ‘With Development’ – To identify potential impacts associated with the development 10 years from
first assessment.
5.2 Background Traffic Volumes
5.2.1 2026 Base Volumes
It is anticipated that the development will be constructed and will be operating with 80% student capacity at
2026. In order to gain an understanding of future traffic volumes, prior to construction of the development, a
3% growth rate per annum has been applied to existing traffic volumes on Waterford-Tamborine Road while a
2% growth rate has been applied to traffic volumes on Anzac Avenue, Kenny Road and Chambers Flat Road.
A summary of AM and PM peak hour 2026 base case traffic volumes is provided in Figure 5-1 and Figure 5-
2.
Figure 5-1 2026 Base Volumes – Am Peak

King’s Christian College Chambers Flat Traffic Impact Assessment
HRP1605516 May 2016 Cardno 16 May 2016 Prepared for King’s Christian College Page 12
Figure 5-2 2026 Base Volumes – Pm Peak
5.2.2 2036 Base Volumes
A summary 2036 base case traffic volumes for the AM and PM peak hours is provided in Figure 5-3 and Figure
5-4
Figure 5-3 2036 Base Volumes – Am Peak
Figure 5-4 2036 Base Volumes – Pm Peak
King’s Christian College Chambers Flat Traffic Impact Assessment
HRP1605516 May 2016 Cardno 16 May 2016 Prepared for King’s Christian College Page 13
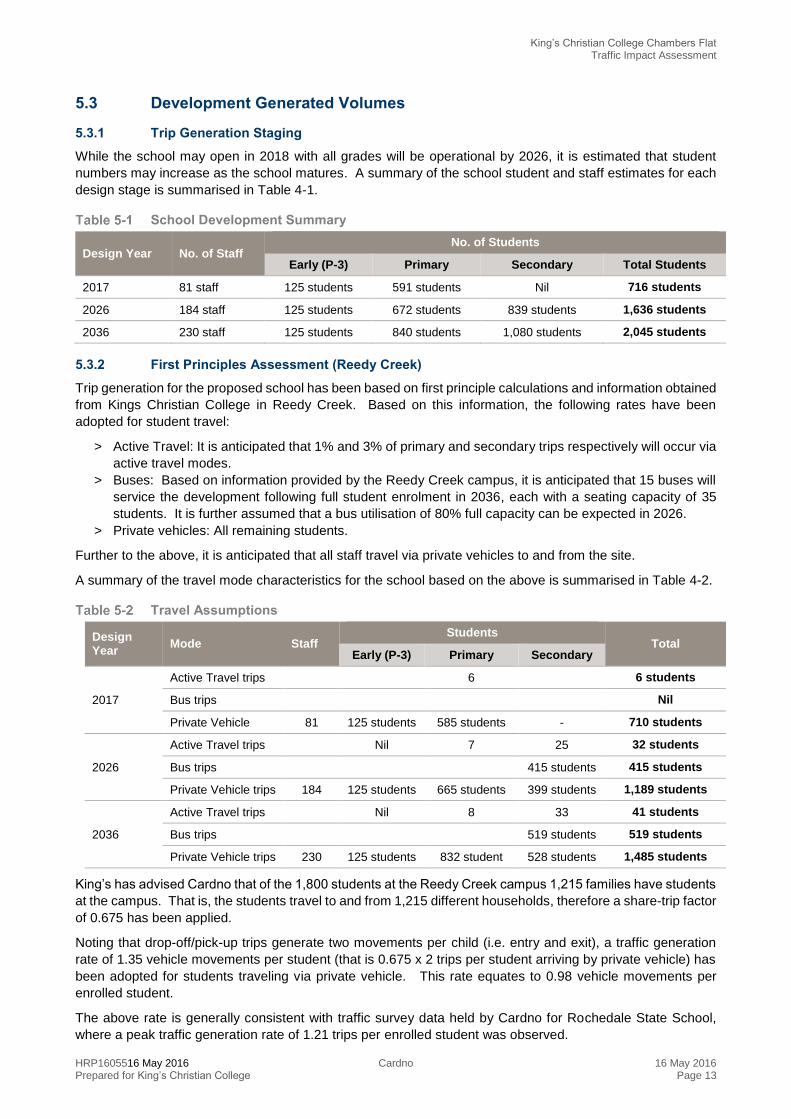
5.3 Development Generated Volumes
5.3.1 Trip Generation Staging
While the school may open in 2018 with all grades will be operational by 2026, it is estimated that student
numbers may increase as the school matures. A summary of the school student and staff estimates for each
design stage is summarised in Table 4-1.
School Development Summary
Design Year No. of Staff No. of Students
Early (P-3) Primary Secondary Total Students
2017 81 staff 125 students 591 students Nil 716 students
2026 184 staff 125 students 672 students 839 students 1,636 students
2036 230 staff 125 students 840 students 1,080 students 2,045 students
5.3.2 First Principles Assessment (Reedy Creek)
Trip generation for the proposed school has been based on first principle calculations and information obtained
from Kings Christian College in Reedy Creek. Based on this information, the following rates have been
adopted for student travel:
> Active Travel: It is anticipated that 1% and 3% of primary and secondary trips respectively will occur via
active travel modes.
> Buses: Based on information provided by the Reedy Creek campus, it is anticipated that 15 buses will
service the development following full student enrolment in 2036, each with a seating capacity of 35
students. It is further assumed that a bus utilisation of 80% full capacity can be expected in 2026.
> Private vehicles: All remaining students.
Further to the above, it is anticipated that all staff travel via private vehicles to and from the site.
A summary of the travel mode characteristics for the school based on the above is summarised in Table 4-2.
Travel Assumptions
Design Year
Mode Staff Students
Total Early (P-3) Primary Secondary
2017
Active Travel trips 6 6 students
Bus trips Nil
Private Vehicle 81 125 students 585 students - 710 students
2026
Active Travel trips Nil 7 25 32 students
Bus trips 415 students 415 students
Private Vehicle trips 184 125 students 665 students 399 students 1,189 students
2036
Active Travel trips Nil 8 33 41 students
Bus trips 519 students 519 students
Private Vehicle trips 230 125 students 832 student 528 students 1,485 students
King’s has advised Cardno that of the 1,800 students at the Reedy Creek campus 1,215 families have students
at the campus. That is, the students travel to and from 1,215 different households, therefore a share-trip factor
of 0.675 has been applied.
Noting that drop-off/pick-up trips generate two movements per child (i.e. entry and exit), a traffic generation
rate of 1.35 vehicle movements per student (that is 0.675 x 2 trips per student arriving by private vehicle) has
been adopted for students traveling via private vehicle. This rate equates to 0.98 vehicle movements per
enrolled student.
The above rate is generally consistent with traffic survey data held by Cardno for Rochedale State School,
where a peak traffic generation rate of 1.21 trips per enrolled student was observed.

King’s Christian College Chambers Flat Traffic Impact Assessment
HRP1605516 May 2016 Cardno 16 May 2016 Prepared for King’s Christian College Page 14
Based on the student mode share outlined in Table 5-2, the student and staff generated traffic volumes can
be determined.
Peak Hour Trip Generation Summary
Design Year Staff Trips Student Numbers Traffic Generation Rate per Student Student Trips
2018 81 trips 710 students 1.35 trips per student 958 trips per hour
2026 184 trips 1,189 students 1.35 trips per student 1,605 trips per hour
2036 230 trips 1,485 students 1.35 trips per student 2,005 trips per hour
It is noted that the following assessment has assumed that 100% of drop-off and pick-up trips occur within the
designated on-site car parking area with no student drop-off/pick-up occurring on the external road network.
5.3.3 Trip Distribution
To determine the distribution of school trips across the network a gravity model was produced. The surrounding
areas serviced by the school were analysed as SA2s. The gravity model takes into account the population,
distance from the proposed school, and no. of schools for each SA2. Population (N) of each SA2 was sourced
from ABS data. The distance (T) from each SA2 to the proposed school site was measured using google maps.
An N/T gravity model was employed, with additional factors applied to account for the number of schools in
each SA2.
The trip attraction of a given area was increased by the following factors depending on the number of schools
within that SA2:
> No schools, add 50%
> 1 to 4 schools, add 30%
> 5 to 8 schools, add 10%
> 9 or greater, no increase
Overall, SA2s with higher trip attraction were areas with relatively large populations, shorter distance to the
proposed school and fewer schools in the SA2.
Based on this review, it is anticipated that 52% of students and staff will access the site from the east via
Waterford-Tamborine Road with 48% accessing the site to/from the west via the Kenny Road/Chambers Flat
Road intersection. Distributions on the wider network have been derived from existing traffic volume survey
data. Further to the above, parents and staff will access the site as follows:
> Student drop-off/pick-up: enter via the eastern crossover and exit via the western crossover only; and
> Staff: entry and exit via the western crossover only.
A summary of the adopted AM and PM distributions is shown in Figure 5-5 and Figure 5-6 respectively.
Figure 5-5 AM Peak Distribution
King’s Christian College Chambers Flat Traffic Impact Assessment
HRP1605516 May 2016 Cardno 16 May 2016 Prepared for King’s Christian College Page 15
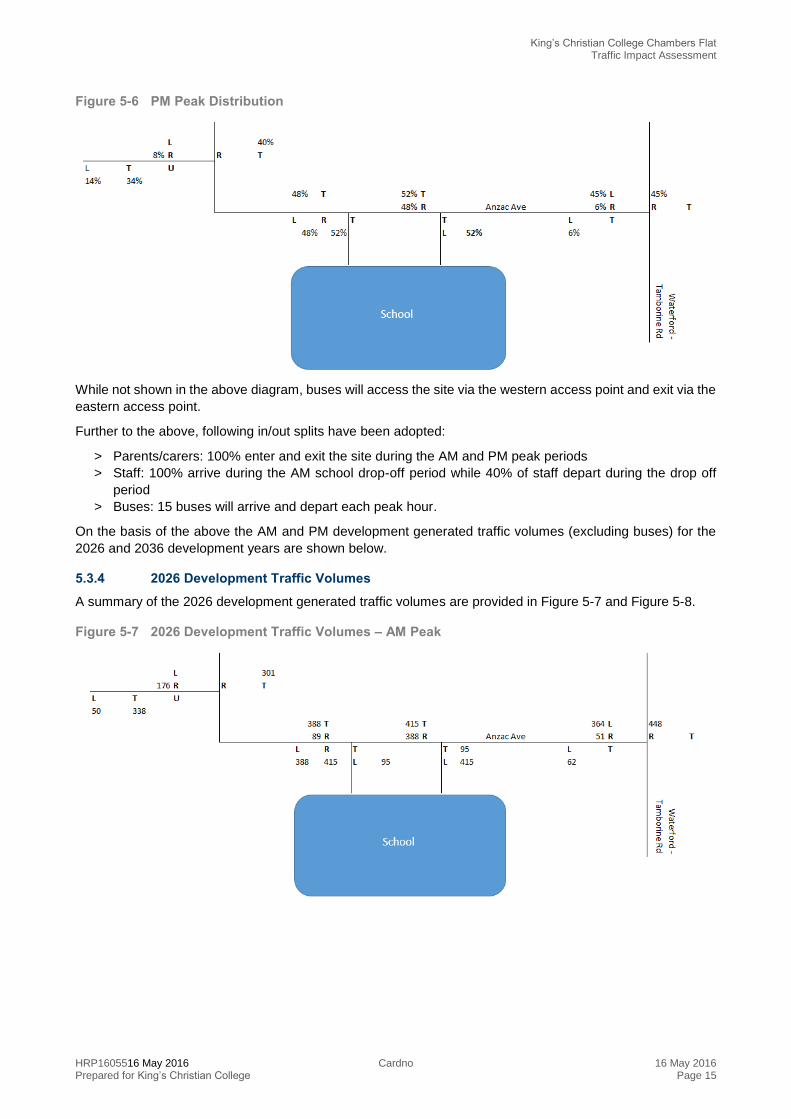
Figure 5-6 PM Peak Distribution
While not shown in the above diagram, buses will access the site via the western access point and exit via the
eastern access point.
Further to the above, following in/out splits have been adopted:
> Parents/carers: 100% enter and exit the site during the AM and PM peak periods
> Staff: 100% arrive during the AM school drop-off period while 40% of staff depart during the drop off
period
> Buses: 15 buses will arrive and depart each peak hour.
On the basis of the above the AM and PM development generated traffic volumes (excluding buses) for the
2026 and 2036 development years are shown below.
5.3.4 2026 Development Traffic Volumes
A summary of the 2026 development generated traffic volumes are provided in Figure 5-7 and Figure 5-8.
Figure 5-7 2026 Development Traffic Volumes – AM Peak
King’s Christian College Chambers Flat Traffic Impact Assessment
HRP1605516 May 2016 Cardno 16 May 2016 Prepared for King’s Christian College Page 16
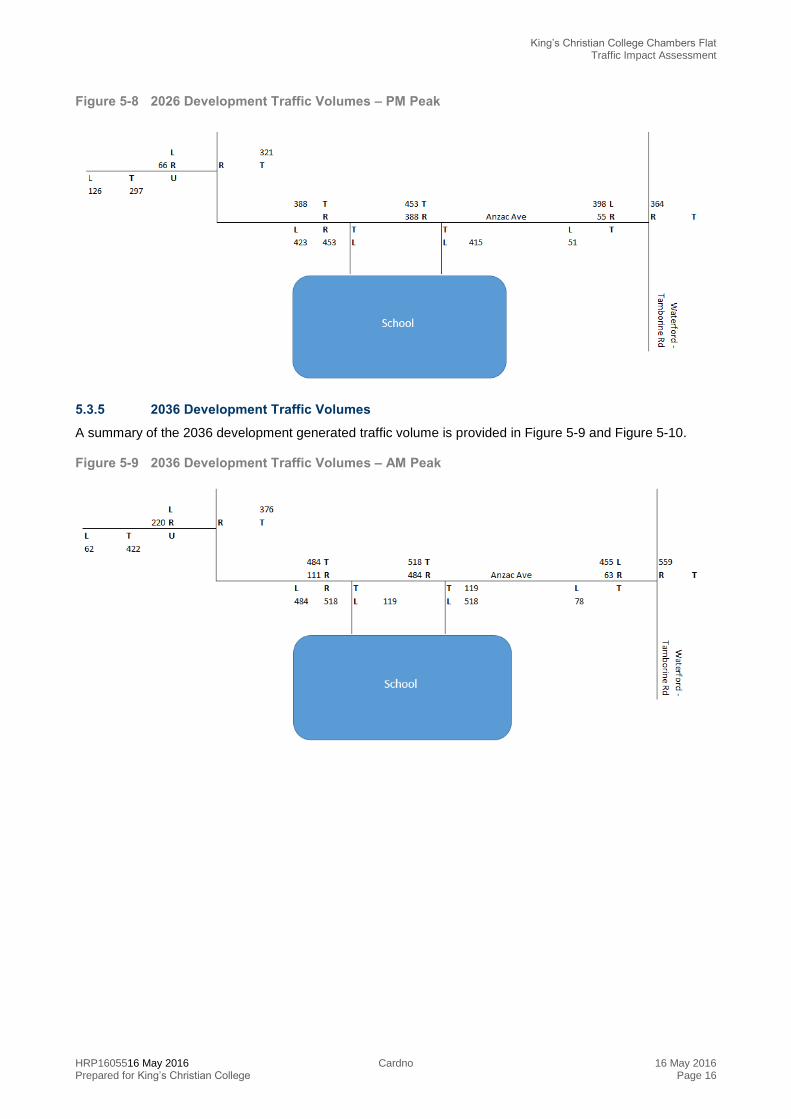
Figure 5-8 2026 Development Traffic Volumes – PM Peak
5.3.5 2036 Development Traffic Volumes
A summary of the 2036 development generated traffic volume is provided in Figure 5-9 and Figure 5-10.
Figure 5-9 2036 Development Traffic Volumes – AM Peak

King’s Christian College Chambers Flat Traffic Impact Assessment
HRP1605516 May 2016 Cardno 16 May 2016 Prepared for King’s Christian College Page 17
Figure 5-10 2036 Development Traffic Volumes – PM Peak
5.4 Post Development Volumes
5.4.1 2026 Post Development Volumes
By adding the 2026 base case and the development generated volumes, the 2026 post development volumes
can be derived. A summary of the 2026 AM and PM post development volumes is provided in Figure 5-11
and Figure 5-12.
Figure 5-11 2026 Post Development Volumes – AM Peak
King’s Christian College Chambers Flat Traffic Impact Assessment
HRP1605516 May 2016 Cardno 16 May 2016 Prepared for King’s Christian College Page 18
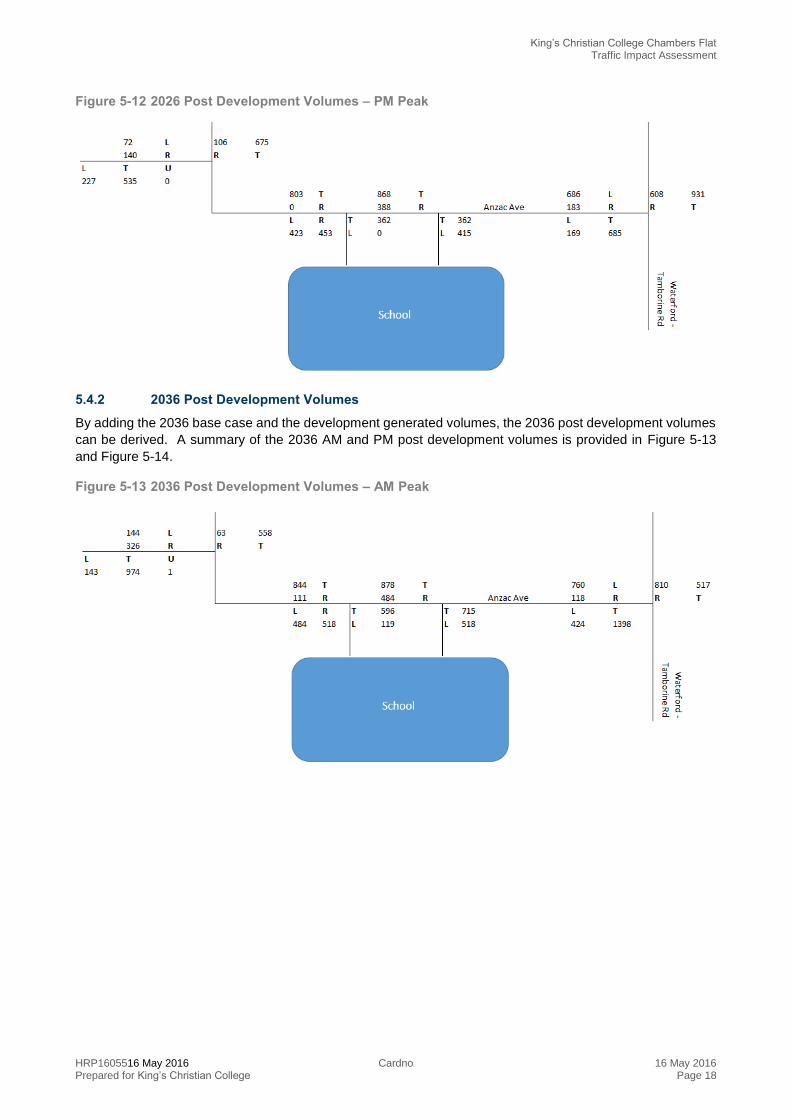
Figure 5-12 2026 Post Development Volumes – PM Peak
5.4.2 2036 Post Development Volumes
By adding the 2036 base case and the development generated volumes, the 2036 post development volumes
can be derived. A summary of the 2036 AM and PM post development volumes is provided in Figure 5-13
and Figure 5-14.
Figure 5-13 2036 Post Development Volumes – AM Peak
King’s Christian College Chambers Flat Traffic Impact Assessment
HRP1605516 May 2016 Cardno 16 May 2016 Prepared for King’s Christian College Page 19
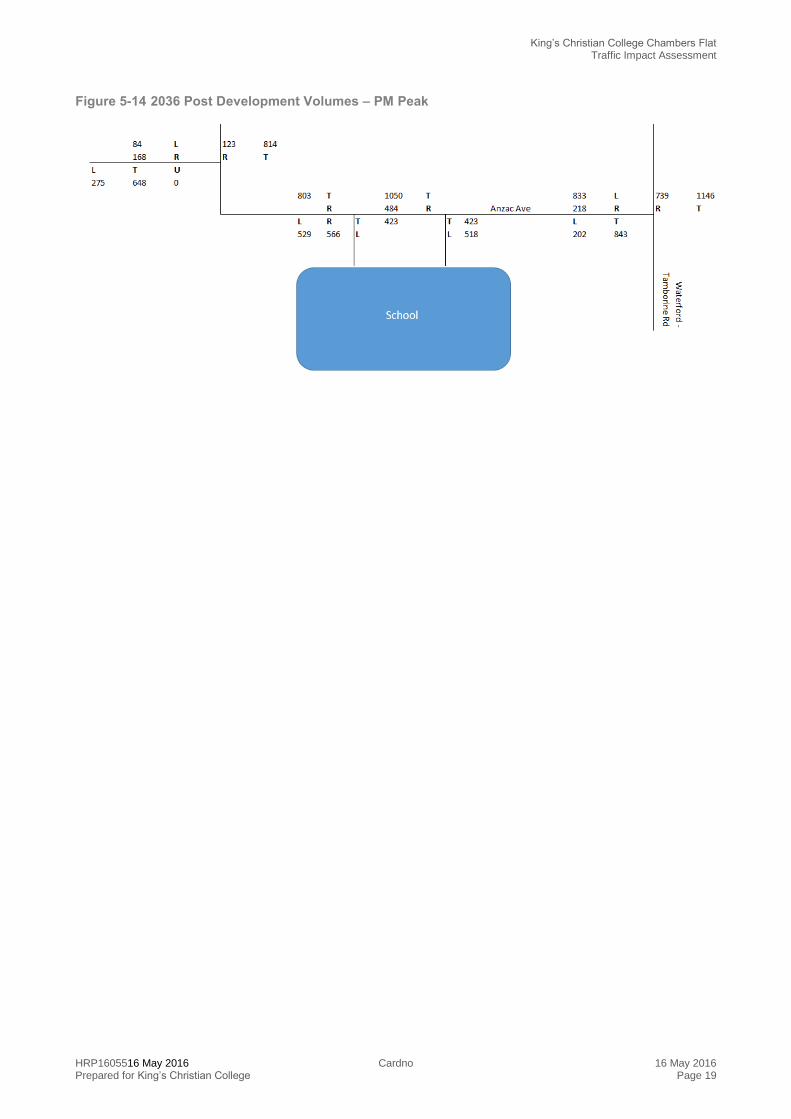
Figure 5-14 2036 Post Development Volumes – PM Peak

King’s Christian College Chambers Flat Traffic Impact Assessment
HRP1605516 May 2016 Cardno 16 May 2016 Prepared for King’s Christian College Page 20
6 Traffic Impact Assessment
6.1 Assessment Criteria
6.1.1 Intersection Degree of Saturation
The performance of each study intersection has been analysed using SIDRA Intersection 6.1 (SIDRA). SIDRA
is an industry recognised analysis tool that estimates the capacity and performance of intersections based on
input parameters, including geometry and traffic volumes, and provides estimates of an intersection’s Degree
of Saturation (DOS), queues and delays. Simplistically, DOS is a measure of the proportion of traffic entering
an intersection relative to the intersection’s capacity. Table 6-1 provides the TMR-defined DOS thresholds.
GARID Thresholds for Intersection Performance
Level of Service Description DOS Threshold
Priority controlled intersections less than or equal to 0.80
Roundabouts less than or equal to 0.85
Signalised intersections less than or equal to 0.90
Source: TMR Guidelines for Assessment of Road Impacts of Development
The GARID notes that a DOS exceeding these values indicate that an intersection is nearing its practical
capacity and upgrade works may be required. Above these thresholds, users of an intersection are likely to
experience rapidly increasing delays and queuing.
6.1.2 Intersection Critical Delay and Level of Service Guidelines
Importantly, it is noted that DOS is not the only performance indicator and that other measures such as critical
delay should also be considered when assessing the performance of an intersection. Other authorities such
as the NSW Roads and Maritime Services (RMS) recommend the use of the critical movement delay for
assessing the performance of intersections.
The RMS Guide to Traffic Generating Developments states that the average delay statistic for the critical
movement provides a better indication of intersection performance and safety for intersections than DOS. A
summary of the delay thresholds recommended by the RMS is provided in Table 6-2. Although these
thresholds are not documented within Queensland guidelines, they are still considered to provide another
informative performance indicator and are therefore considered in this assessment.
RMS Level of Service (LOS) Criteria for Intersections
LOS Level of Service Description Critical Delay per Vehicle (sec/veh)
A Good operation less than 14 sec
B Acceptable delays and spare capacity 15 to 28 sec
C Satisfactory 29 to 42 sec
D Near capacity 43 to 56 sec
E At capacity, requires other control mode 57 to 70 sec

King’s Christian College Chambers Flat Traffic Impact Assessment
HRP1605516 May 2016 Cardno 16 May 2016 Prepared for King’s Christian College Page 21
7 Traffic Impact Assessment
7.1 Waterford-Tamborine Road/Anzac Avenue
7.1.1 TMR Upgrades
It is understood that the Waterford-Tamborine Road/Anzac Avenue intersection is to be upgraded by TMR to
a signalised intersection incorporating two through lanes in each direction and additional storage capacity on
the north, south and west approaches.
It is further understood that the upgrade is currently in the design stage which will be completed by mid-2016.
Construction of the upgrade is expected to be completed by 2018.
On the basis of the above, Cardno has assessed the operation of the Waterford-Tamborine Road/Anzac
Avenue intersection using an upgraded signalised configuration for the 2026 and 2036 design scenarios. The
assessed layout is shown in Table 7-1.
Figure 7-1 Waterford-Tamborine Road/Anzac Avenue Upgrade Layout

King’s Christian College Chambers Flat Traffic Impact Assessment
HRP1605516 May 2016 Cardno 16 May 2016 Prepared for King’s Christian College Page 22
7.1.2 Intersection Operation
The operation of the intersection has been assessed using SIDRA Intersection. A summary of the results is
provided in Table 7-1 with full results provided at Appendix C.
Waterford-Tamborine Road/Anzac Avenue Intersection Operation
Scenarios
AM Peak PM Peak
DOS Delay 95th %ile
Queue DOS Delay
95th %ile
Queue
2026 Background 0.51 18sec 170m 0.39 21sec 117m
2026 With Development 0.68 29sec 245m 0.56 25sec 143m
2036 Background 0.62 19sec 231m 0.46 22sec 150m
2036 With Development 0.88 38sec 397m 0.69 24sec 157m
As outlined in Table 6-1, the Waterford-Tamborine Road/Anzac Avenue intersection is expected to operate
within acceptable levels following development of the site under the 2026 and 2036 design scenarios.
It is noted however that the intersection configuration assessed is based on an indicative intersection
configuration provided on TMR’s website. The ultimate configuration adopted by TMR, as determined by the
design phase of the upgrade, should give consideration to traffic volumes likely to be generated by additional
development on Anzac Avenue including the proposed development.
7.2 Chambers Flat Road/Kenny Road
The operation of the Chambers Flat Road/Kenny Road intersection has been assessed using SIDRA
Intersection with results summarised in Table 6-2 with full results provided in Appendix C.
Chambers Flat Road/Kenny Road Intersection Operation
Scenarios
AM Peak PM Peak
DOS Delay 95th %ile
Queue DOS Delay
95th %ile
Queue
2026 Background 0.41 6sec 25m 0.35 6sec 19m
2026 With Development 0.71 10sec 74m 0.65 7sec 54m
2036 Background 0.49 6sec 33m 0.41 6sec 25m
2036 With Development 1.26 65secc 598m 0.81 8sec 98m
As shown in Table 6-2, the Chambers Flat Road/Kenny Road intersection is expected to exceed its theoretical
capacity during the 2036 design year.
Given that this assessment scenario is based on road network projections for 20 years, it is anticipated that
Logan City Council will undertake a review of the operation of the intersection as the area develops. Such
developments may alter the necessary upgrade configuration of the intersection in 2036, which can’t be
anticipated by this assessment at this time.
7.3 Anzac Avenue/School Access (East)
Noting the anticipated traffic volumes on Anzac Avenue under the 2026 and 2036 design year, and the number
of trips anticipated to enter the site, the Anzac Avenue/Site Access (east) intersection is to be a signalised
intersection incorporating additional right and left turn storage lanes on Anzac Avenue.
The operation of eastern site access intersection has been assessed using SIDRA intersection. As noted
previously this intersection accommodates student drop-off/pick-up entry trips and bus exit trips (15 buses
during peak periods) only. The layout configuration assessed is shown in Figure 7-2.
King’s Christian College Chambers Flat Traffic Impact Assessment
HRP1605516 May 2016 Cardno 16 May 2016 Prepared for King’s Christian College Page 23
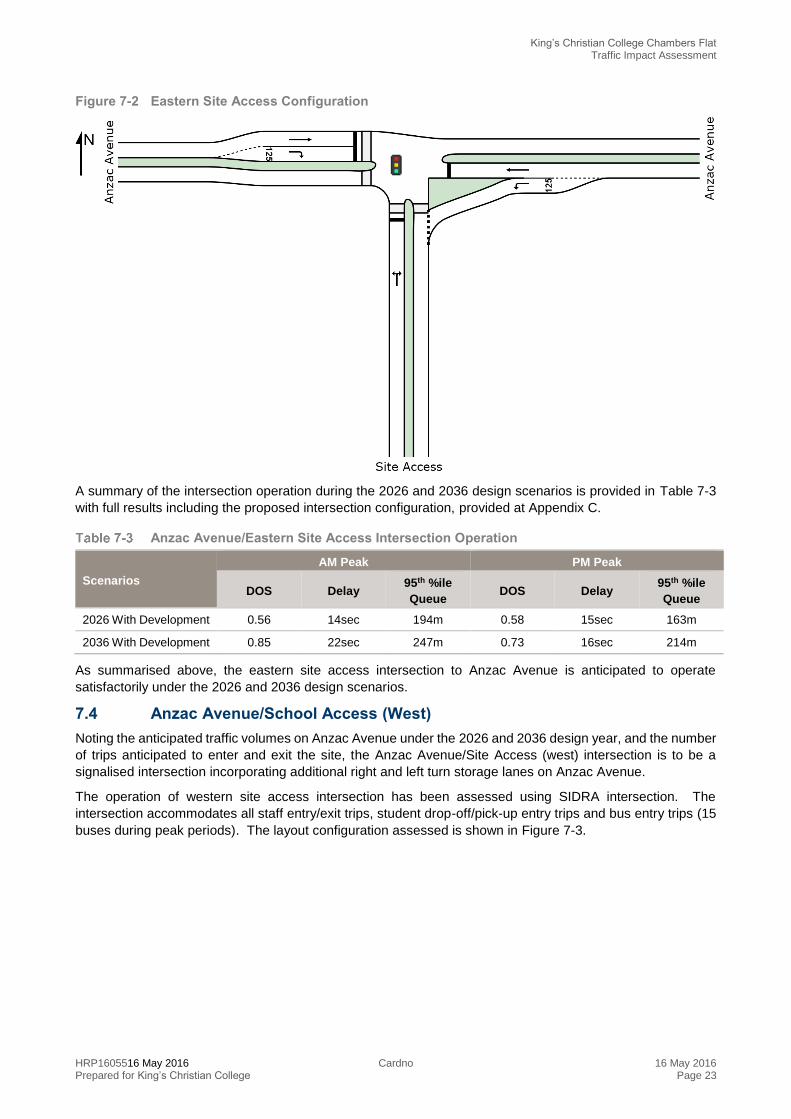
Figure 7-2 Eastern Site Access Configuration
A summary of the intersection operation during the 2026 and 2036 design scenarios is provided in Table 7-3
with full results including the proposed intersection configuration, provided at Appendix C.
Anzac Avenue/Eastern Site Access Intersection Operation
Scenarios
AM Peak PM Peak
DOS Delay 95th %ile
Queue DOS Delay
95th %ile
Queue
2026 With Development 0.56 14sec 194m 0.58 15sec 163m
2036 With Development 0.85 22sec 247m 0.73 16sec 214m
As summarised above, the eastern site access intersection to Anzac Avenue is anticipated to operate
satisfactorily under the 2026 and 2036 design scenarios.
7.4 Anzac Avenue/School Access (West)
Noting the anticipated traffic volumes on Anzac Avenue under the 2026 and 2036 design year, and the number
of trips anticipated to enter and exit the site, the Anzac Avenue/Site Access (west) intersection is to be a
signalised intersection incorporating additional right and left turn storage lanes on Anzac Avenue.
The operation of western site access intersection has been assessed using SIDRA intersection. The
intersection accommodates all staff entry/exit trips, student drop-off/pick-up entry trips and bus entry trips (15
buses during peak periods). The layout configuration assessed is shown in Figure 7-3.

King’s Christian College Chambers Flat Traffic Impact Assessment
HRP1605516 May 2016 Cardno 16 May 2016 Prepared for King’s Christian College Page 24
Figure 7-3 Western Site Access Configuration
A summary of the intersection operation during the 2026 and 2036 design scenarios is provided in Table 7-4
with full results including the proposed intersection configuration, provided at Appendix C.
Anzac Avenue/Western Site Access Intersection Operation
Scenarios
AM Peak PM Peak
DOS Delay 95th %ile
Queue DOS Delay
95th %ile
Queue
2026 With Development 0.70 25sec 207m 0.79 24sec 259m
2036 With Development 0.88 33sec 307m 0.90 30sec 303m
As outlined in Table 7-4, the west site access intersection to Anzac Avenue is anticipated to operate
satisfactorily under the 2026 and 2036 design scenarios. It is noted however that the intersection is anticipated
to approach its theoretical capacity during the 2036 design scenario.
7.5 Signal Installation Timing
In order to gain an understanding of the necessary timing of signalisation at the site access points, a trigger
assessment has been undertaken. The assessment has assumed a linear increase in student and staff
numbers per year (i.e. an increase of approximately 60 students and 13 staff members per year). The layouts
assessed for the east and west site access points are shown in Figure 7-4 and Figure 7-5.
King’s Christian College Chambers Flat Traffic Impact Assessment
HRP1605516 May 2016 Cardno 16 May 2016 Prepared for King’s Christian College Page 25
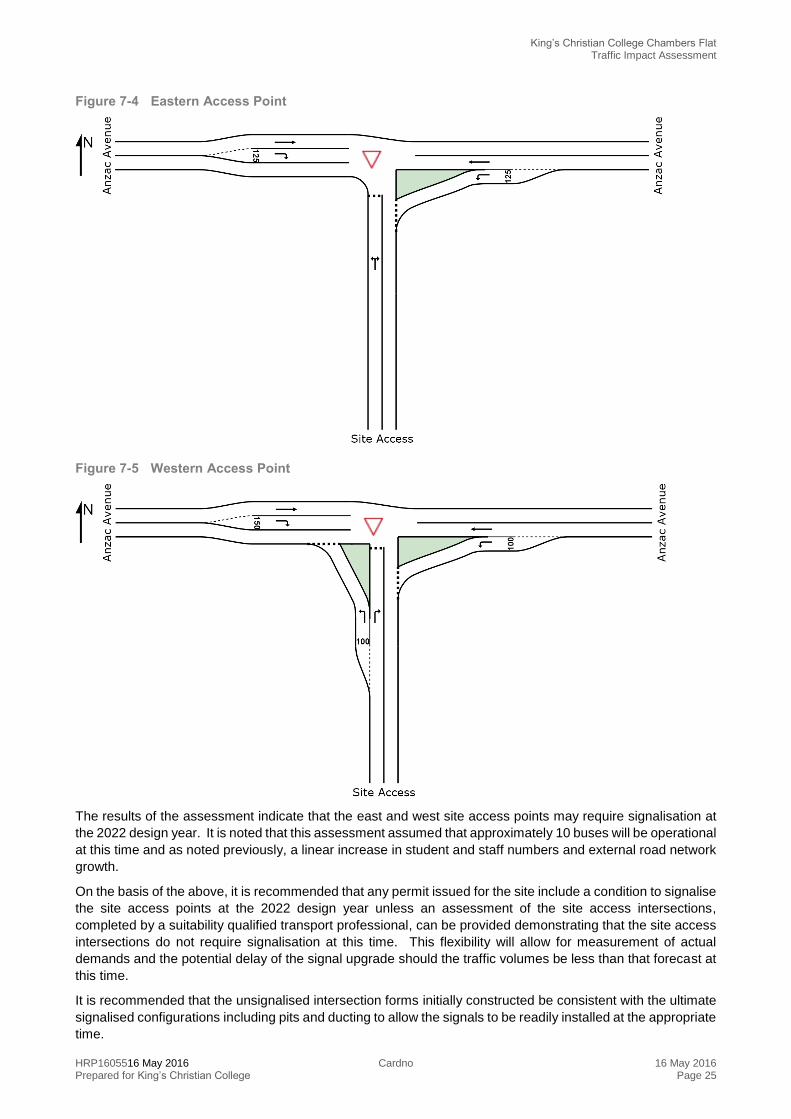
Figure 7-4 Eastern Access Point
Figure 7-5 Western Access Point
The results of the assessment indicate that the east and west site access points may require signalisation at
the 2022 design year. It is noted that this assessment assumed that approximately 10 buses will be operational
at this time and as noted previously, a linear increase in student and staff numbers and external road network
growth.
On the basis of the above, it is recommended that any permit issued for the site include a condition to signalise
the site access points at the 2022 design year unless an assessment of the site access intersections,
completed by a suitability qualified transport professional, can be provided demonstrating that the site access
intersections do not require signalisation at this time. This flexibility will allow for measurement of actual
demands and the potential delay of the signal upgrade should the traffic volumes be less than that forecast at
this time.
It is recommended that the unsignalised intersection forms initially constructed be consistent with the ultimate
signalised configurations including pits and ducting to allow the signals to be readily installed at the appropriate
time.
King’s Christian College Chambers Flat Traffic Impact Assessment
HRP1605516 May 2016 Cardno 16 May 2016 Prepared for King’s Christian College Page 26
8 Conclusions
Based on the findings and discussion contained within this report, the following conclusions are made:
> The proposed development will accommodate 2,045 students and 230 staff on-site with 282 car parking
spaces.
> The development is expected to generate up to 2,005 AM trips and 2,097 PM trips during the 2036
ultimate design scenario.
> The proposed signalised site access intersections to Anzac Avenue are anticipated to operate
satisfactorily at the 2026 and 2036 design scenarios.
> The Waterford-Tamborine Road/Anzac Avenue intersection is expected to operate satisfactory at the
2026 and 2036 design scenarios, following the construction of upgrades proposed by DTMR. It is noted
that the ultimate configuration adopted by DTMR should give consideration to traffic volumes likely to
be generated by additional development on Anzac Avenue, including the proposed development.
> The operation of the Chambers Flat Road/Kenny Road intersection is expected to exceed its theoretical
capacity during the 2036 design scenario. Notwithstanding, it is anticipated that Logan City Council will
undertake a review of the operation of the intersection as the area develops. Such developments may
alter the necessary upgrade configuration of the intersection in 2036. As such, it is recommended that
any upgrades be reviewed at a later stage.
> The on-site car park has been designed to provide a dedicated drop-off/pick-up area which is separated
from staff (long-term) parking.
> The proposed car parking provision accords with the planning scheme requirement and is considered
to be satisfactory to accommodate the short and long term car parking demands likely to be generated
by the proposed development.
> An internal circulation road has been provided to accommodate internal bus set down areas. Bus
circulation movements, south of the car parking access points, will be separated from vehicle
movements.
> The bus set down configuration has been designed to ensure that students can safely access the school
campus.

King’s Christian College Chambers Flat Traffic Impact Assessment
HRP1605516 May 2016 Cardno 16 May 2016 Prepared for King’s Christian College Page 27
Traffic Impact Assessment
APPENDIX A DEVELOPMENT PLANS

King’s Christian College Chambers Flat Traffic Impact Assessment
HRP1605516 May 2016 Cardno 16 May 2016 Prepared for King’s Christian College Page 29
Traffic Impact Assessment
APPENDIX B WATERFORD-TAMBORINE ROAD UPGRADE DTMR SUMMARY
Stay up-to-date
Information about the project will be available during the design and construction phases of the project.
Phone: 07 5563 6600* during business hours (select option 3)
13 19 40* outside of business hours
Email: [email protected]
Website: www.tmr.qld.gov.au
Post: Department of Transport and Main Roads
PO Box 442
Nerang QLD 4211
*Check with your service provider for call costs.
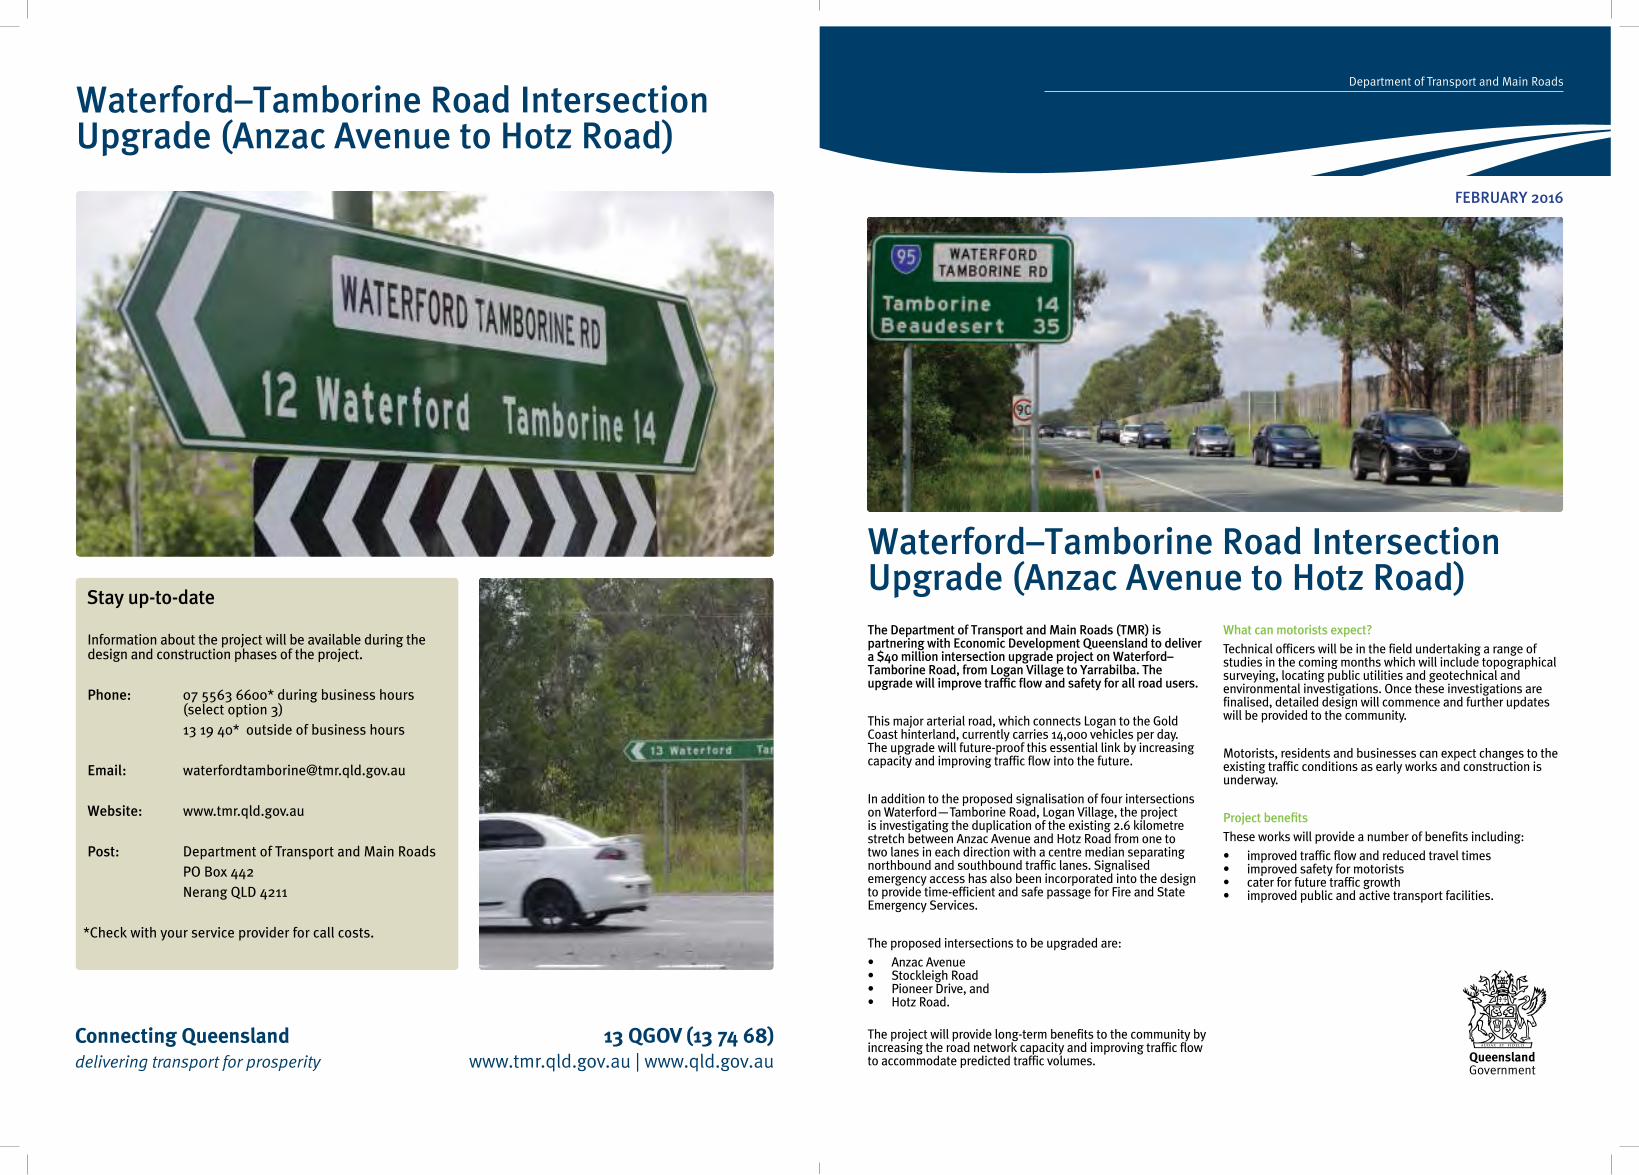
Waterford–Tamborine Road Intersection Upgrade (Anzac Avenue to Hotz Road)
The Department of Transport and Main Roads (TMR) is partnering with Economic Development Queensland to deliver a $40 million intersection upgrade project on Waterford–Tamborine Road, from Logan Village to Yarrabilba. The upgrade will improve trafic low and safety for all road users.
This major arterial road, which connects Logan to the Gold Coast hinterland, currently carries 14,000 vehicles per day. The upgrade will future-proof this essential link by increasing capacity and improving traffic flow into the future.
In addition to the proposed signalisation of four intersections on Waterford—Tamborine Road, Logan Village, the project is investigating the duplication of the existing 2.6 kilometre stretch between Anzac Avenue and Hotz Road from one to two lanes in each direction with a centre median separating northbound and southbound traffic lanes. Signalised emergency access has also been incorporated into the design to provide time-efficient and safe passage for Fire and State Emergency Services.
The proposed intersections to be upgraded are:
• Anzac Avenue• Stockleigh Road• Pioneer Drive, and• Hotz Road.
The project will provide long-term benefits to the community by increasing the road network capacity and improving traffic flow to accommodate predicted traffic volumes.
What can motorists expect?
Technical officers will be in the field undertaking a range of studies in the coming months which will include topographical surveying, locating public utilities and geotechnical and environmental investigations. Once these investigations are finalised, detailed design will commence and further updates will be provided to the community.
Motorists, residents and businesses can expect changes to the existing traffic conditions as early works and construction is underway.
Project beneits
These works will provide a number of benefits including:
• improved traffic flow and reduced travel times• improved safety for motorists• cater for future traffic growth• improved public and active transport facilities.
Waterford–Tamborine Road IntersectionUpgrade (Anzac Avenue to Hotz Road)
FEBRUARY 2016
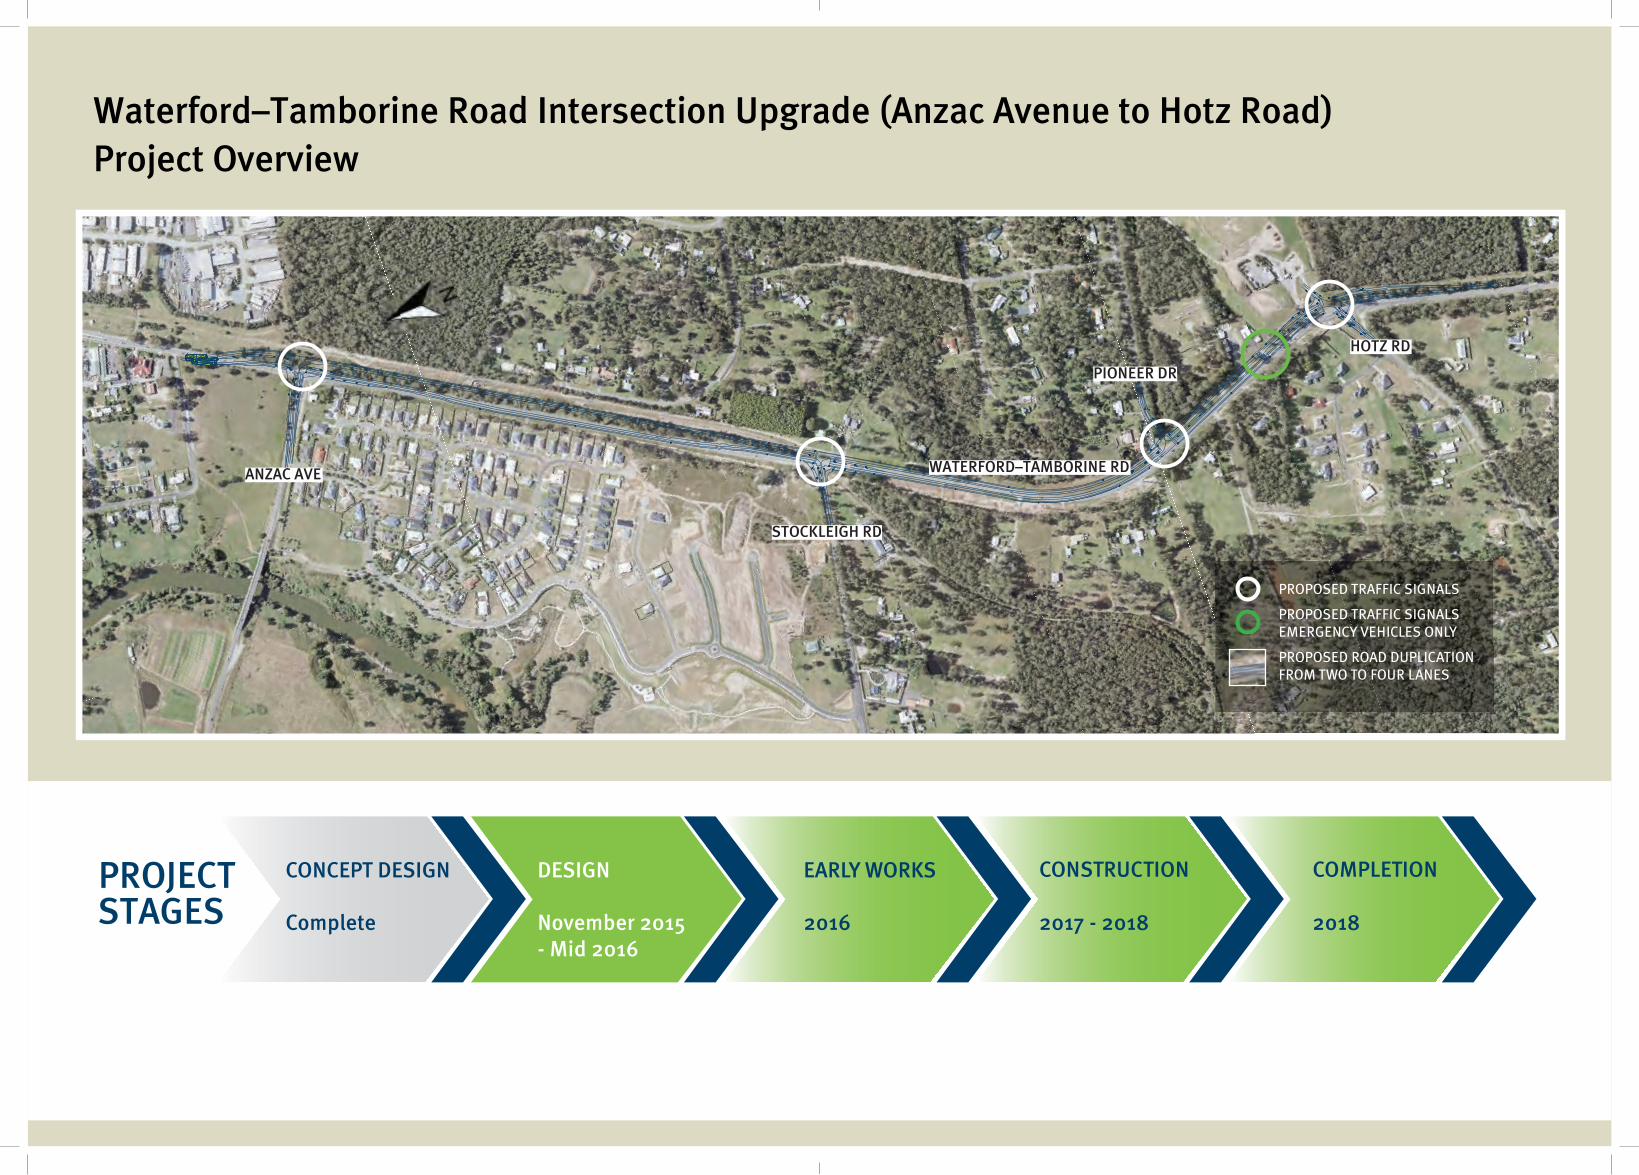
Waterford–Tamborine Road Intersection Upgrade (Anzac Avenue to Hotz Road)
Project Overview
CONCEPT DESIGN DESIGN EARLY WORKS CONSTRUCTION COMPLETION
Complete November 2015
- Mid 2016
2016 2017 - 2018 2018
PROJECTSTAGES
ANZAC AVE
STOCKLEIGH RD
PIONEER DR
HOTZ RD
WATERFORD–TAMBORINE RD
PROPOSED TRAFFIC SIGNALS
PROPOSED TRAFFIC SIGNALS EMERGENCY VEHICLES ONLY
PROPOSED ROAD DUPLICATION FROM TWO TO FOUR LANES

King’s Christian College Chambers Flat Traffic Impact Assessment
HRP1605516 May 2016 Cardno 16 May 2016 Prepared for King’s Christian College Page 31
Traffic Impact Assessment
APPENDIX C SIDRA INTERSECTION RESULTS

LANE SUMMARY
Site: 2026 AM Base Waterford-Tamborine Rd/Anzac Ave - TMR Layout
King's Christian CollegeSignals - Fixed Time Isolated Cycle Time = 150 seconds (Optimum Cycle Time - Minimum Degree of Saturation)
Lane Use and Performance
Demand Flows 95% Back of QueueCap.
Deg.Satn
LaneUtil.
AverageDelay
Level ofService
Lane Config
Lane Length
Cap.Adj.
Prob. Block.Total HV Veh Dist
veh/h % veh/h v/c % sec m m % %South: Waterford-Tamborine Rd (S)
Lane 1 312 5.0 1367 0.228 100 8.0 LOS A 4.3 31.5 Short 150 0.0 NA
Lane 2 598 5.0 1045 0.572 100 23.1 LOS B 28.0 204.5 Full 500 0.0 0.0
Lane 3 598 5.0 1045 0.572 100 23.1 LOS B 28.0 204.5 Full 500 0.0 0.0
Approach 1507 5.0 0.572 20.0 LOS B 28.0 204.5
North: Waterford-Tamborine Rd (N)
Lane 1 221 5.0 1536 0.144 100 3.1 LOS A 3.3 24.1 Full 500 0.0 0.0
Lane 2 221 5.0 1536 0.144 100 3.1 LOS A 3.3 24.1 Full 500 0.0 0.0
Lane 3 226 5.0 395 0.574 100 62.0 LOS E 14.8 108.3 Short 100 0.0 NA
Approach 668 5.0 0.574 23.0 LOS B 14.8 108.3
West: Anzac Ave
Lane 1 276 5.0 743 0.371 100 12.9 LOS A 7.1 52.1 Short 50 0.0 NA
Lane 2 49 5.0 191 0.259 100 73.3 LOS F 3.4 24.8 Full 500 0.0 0.0
Approach 325 5.0 0.371 22.0 LOS B 7.1 52.1
Intersection 2501 5.0 0.574 21.1 LOS B 28.0 204.5
Level of Service (LOS) Method: Delay (RTA NSW).
Lane LOS values are based on average delay per lane.
Intersection and Approach LOS values are based on average delay for all lanes.
SIDRA Standard Delay Model is used. Control Delay includes Geometric Delay.
Gap-Acceptance Capacity: SIDRA Standard (Akçelik M3D).
HV (%) values are calculated for All Movement Classes of All Heavy Vehicle Model Designation.
SIDRA INTERSECTION 6.1 | Copyright © 2000-2015 Akcelik and Associates Pty Ltd | sidrasolutions.comOrganisation: CARDNO | Processed: Friday, 6 May 2016 12:47:21 PMProject: G:\HRP16055 - Chambers Flat, Anzac Av 36-112\16055 - Analysis\SIDRA\Anzac Avenue Waterford Tamborine Rd.sip6

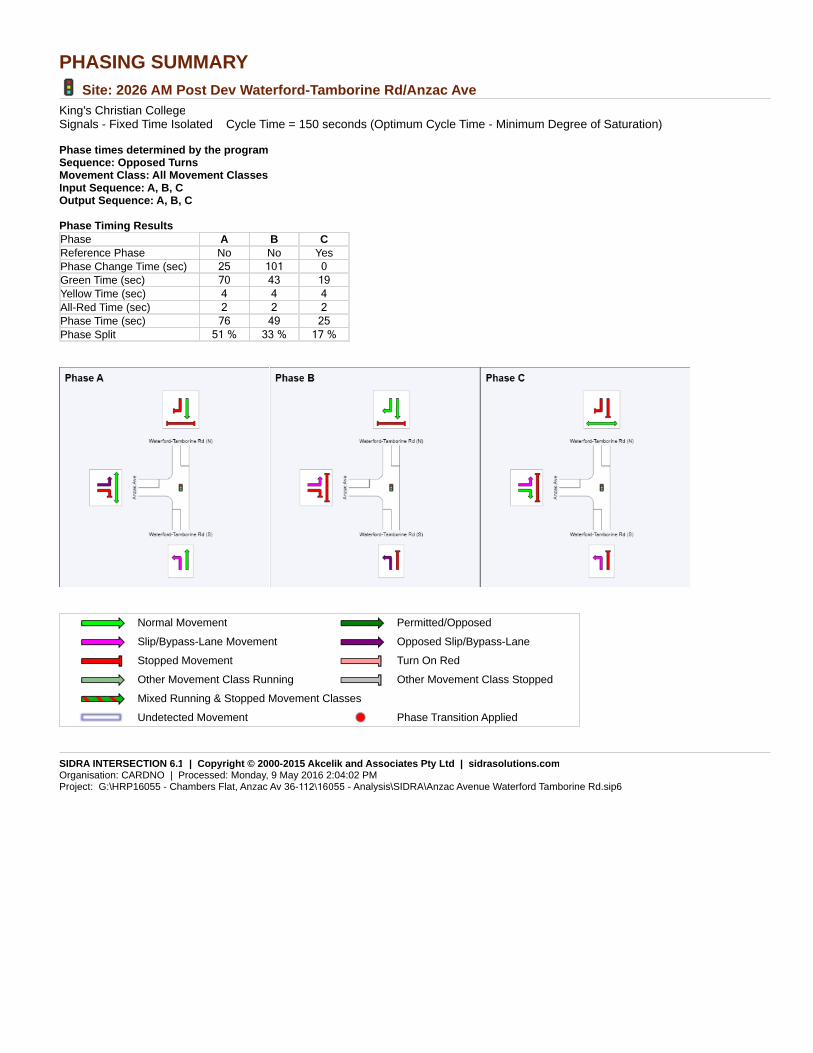
PHASING SUMMARY
Site: 2026 AM Base Waterford-Tamborine Rd/Anzac Ave
King's Christian CollegeSignals - Fixed Time Isolated Cycle Time = 150 seconds (Optimum Cycle Time - Minimum Degree of Saturation)
Phase times determined by the programSequence: Opposed TurnsMovement Class: All Movement ClassesInput Sequence: A, B, COutput Sequence: A, B, C
Phase Timing Results
Phase A B C
Reference Phase No No Yes
Phase Change Time (sec) 25 125 0Green Time (sec) 94 19 19Yellow Time (sec) 4 4 4All-Red Time (sec) 2 2 2Phase Time (sec) 100 25 25Phase Split 67 % 17 % 17 %
Normal Movement Permitted/Opposed
Slip/Bypass-Lane Movement Opposed Slip/Bypass-Lane
Stopped Movement Turn On Red
Other Movement Class Running Other Movement Class Stopped
Mixed Running & Stopped Movement Classes
Undetected Movement Phase Transition Applied
SIDRA INTERSECTION 6.1 | Copyright © 2000-2015 Akcelik and Associates Pty Ltd | sidrasolutions.comOrganisation: CARDNO | Processed: Friday, 6 May 2016 12:47:17 PMProject: G:\HRP16055 - Chambers Flat, Anzac Av 36-112\16055 - Analysis\SIDRA\Anzac Avenue Waterford Tamborine Rd.sip6

LANE SUMMARY
Site: 2026 PM Base Waterford-Tamborine Rd/Anzac Ave
King's Christian CollegeSignals - Fixed Time Isolated Cycle Time = 150 seconds (Optimum Cycle Time - Minimum Degree of Saturation)
Lane Use and Performance
Demand Flows 95% Back of QueueCap.
Deg.Satn
LaneUtil.
AverageDelay
Level ofService
Lane Config
Lane Length
Cap.Adj.
Prob. Block.Total HV Veh Dist
veh/h % veh/h v/c % sec m m % %South: Waterford-Tamborine Rd (S)
Lane 1 125 5.0 1415 0.089 100 6.7 LOS A 1.0 7.3 Short 150 0.0 NA
Lane 2 361 5.0 944 0.382 100 24.4 LOS B 16.0 116.6 Full 500 0.0 0.0
Lane 3 361 5.0 944 0.382 100 24.4 LOS B 16.0 116.6 Full 500 0.0 0.0
Approach 846 5.0 0.382 21.8 LOS B 16.0 116.6
North: Waterford-Tamborine Rd (N)
Lane 1 490 5.0 1372 0.357 100 7.9 LOS A 12.9 93.9 Full 500 0.0 0.0
Lane 2 490 5.0 1372 0.357 100 7.9 LOS A 12.9 93.9 Full 500 0.0 0.0
Lane 3 128 5.0 335 0.384 100 63.5 LOS E 8.3 60.4 Short 150 0.0 NA
Lane 4 128 5.0 335 0.384 100 63.5 LOS E 8.3 60.4 Short 120 0.0 NA
Approach 1237 5.0 0.384 19.5 LOS B 12.9 93.9
West: Anzac Ave
Lane 1 152 5.0 991 0.153 100 8.0 LOS A 2.0 14.3 Short 25 0.0 NA
Lane 2 152 5.0 991 0.153 100 8.0 LOS A 2.0 14.3 Short 50 0.0 NA
Lane 3 134 5.0 347 0.386 100 62.6 LOS E 8.6 62.5 Full 500 0.0 0.0
Approach 437 5.0 0.386 24.7 LOS B 8.6 62.5
Intersection 2520 5.0 0.386 21.2 LOS B 16.0 116.6
Level of Service (LOS) Method: Delay (RTA NSW).
Lane LOS values are based on average delay per lane.
Intersection and Approach LOS values are based on average delay for all lanes.
SIDRA Standard Delay Model is used. Control Delay includes Geometric Delay.
Gap-Acceptance Capacity: SIDRA Standard (Akçelik M3D).
HV (%) values are calculated for All Movement Classes of All Heavy Vehicle Model Designation.
SIDRA INTERSECTION 6.1 | Copyright © 2000-2015 Akcelik and Associates Pty Ltd | sidrasolutions.comOrganisation: CARDNO | Processed: Friday, 6 May 2016 12:47:18 PMProject: G:\HRP16055 - Chambers Flat, Anzac Av 36-112\16055 - Analysis\SIDRA\Anzac Avenue Waterford Tamborine Rd.sip6

PHASING SUMMARY
Site: 2026 PM Base Waterford-Tamborine Rd/Anzac Ave
King's Christian CollegeSignals - Fixed Time Isolated Cycle Time = 150 seconds (Optimum Cycle Time - Minimum Degree of Saturation)
Phase times determined by the programSequence: Opposed TurnsMovement Class: All Movement ClassesInput Sequence: A, B, COutput Sequence: A, B, C
Phase Timing Results
Phase A B C
Reference Phase No No Yes
Phase Change Time (sec) 35 116 0
Green Time (sec) 75 28 29
Yellow Time (sec) 4 4 4
All-Red Time (sec) 2 2 2
Phase Time (sec) 81 34 35
Phase Split 54 % 23 % 23 %
Normal Movement Permitted/Opposed
Slip/Bypass-Lane Movement Opposed Slip/Bypass-Lane
Stopped Movement Turn On Red
Other Movement Class Running Other Movement Class Stopped
Mixed Running & Stopped Movement Classes
Undetected Movement Phase Transition Applied
SIDRA INTERSECTION 6.1 | Copyright © 2000-2015 Akcelik and Associates Pty Ltd | sidrasolutions.comOrganisation: CARDNO | Processed: Friday, 6 May 2016 12:47:18 PMProject: G:\HRP16055 - Chambers Flat, Anzac Av 36-112\16055 - Analysis\SIDRA\Anzac Avenue Waterford Tamborine Rd.sip6
LANE SUMMARY
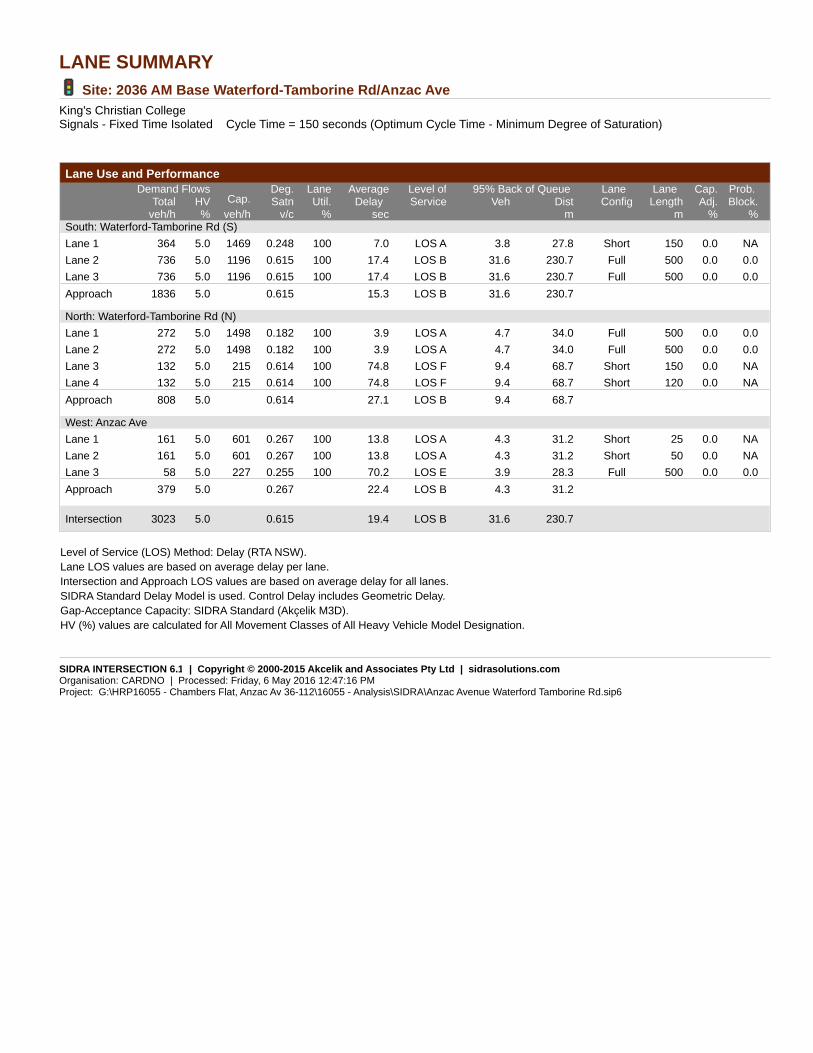
Site: 2036 AM Base Waterford-Tamborine Rd/Anzac Ave
King's Christian CollegeSignals - Fixed Time Isolated Cycle Time = 150 seconds (Optimum Cycle Time - Minimum Degree of Saturation)
Lane Use and Performance
Demand Flows 95% Back of QueueCap.
Deg.Satn
LaneUtil.
AverageDelay
Level ofService
Lane Config
Lane Length
Cap.Adj.
Prob. Block.Total HV Veh Dist
veh/h % veh/h v/c % sec m m % %South: Waterford-Tamborine Rd (S)
Lane 1 364 5.0 1469 0.248 100 7.0 LOS A 3.8 27.8 Short 150 0.0 NA
Lane 2 736 5.0 1196 0.615 100 17.4 LOS B 31.6 230.7 Full 500 0.0 0.0
Lane 3 736 5.0 1196 0.615 100 17.4 LOS B 31.6 230.7 Full 500 0.0 0.0
Approach 1836 5.0 0.615 15.3 LOS B 31.6 230.7
North: Waterford-Tamborine Rd (N)
Lane 1 272 5.0 1498 0.182 100 3.9 LOS A 4.7 34.0 Full 500 0.0 0.0
Lane 2 272 5.0 1498 0.182 100 3.9 LOS A 4.7 34.0 Full 500 0.0 0.0
Lane 3 132 5.0 215 0.614 100 74.8 LOS F 9.4 68.7 Short 150 0.0 NA
Lane 4 132 5.0 215 0.614 100 74.8 LOS F 9.4 68.7 Short 120 0.0 NA
Approach 808 5.0 0.614 27.1 LOS B 9.4 68.7
West: Anzac Ave
Lane 1 161 5.0 601 0.267 100 13.8 LOS A 4.3 31.2 Short 25 0.0 NA
Lane 2 161 5.0 601 0.267 100 13.8 LOS A 4.3 31.2 Short 50 0.0 NA
Lane 3 58 5.0 227 0.255 100 70.2 LOS E 3.9 28.3 Full 500 0.0 0.0
Approach 379 5.0 0.267 22.4 LOS B 4.3 31.2
Intersection 3023 5.0 0.615 19.4 LOS B 31.6 230.7
Level of Service (LOS) Method: Delay (RTA NSW).
Lane LOS values are based on average delay per lane.
Intersection and Approach LOS values are based on average delay for all lanes.
SIDRA Standard Delay Model is used. Control Delay includes Geometric Delay.
Gap-Acceptance Capacity: SIDRA Standard (Akçelik M3D).
HV (%) values are calculated for All Movement Classes of All Heavy Vehicle Model Designation.
SIDRA INTERSECTION 6.1 | Copyright © 2000-2015 Akcelik and Associates Pty Ltd | sidrasolutions.comOrganisation: CARDNO | Processed: Friday, 6 May 2016 12:47:16 PMProject: G:\HRP16055 - Chambers Flat, Anzac Av 36-112\16055 - Analysis\SIDRA\Anzac Avenue Waterford Tamborine Rd.sip6

PHASING SUMMARY
Site: 2036 AM Base Waterford-Tamborine Rd/Anzac Ave
King's Christian CollegeSignals - Fixed Time Isolated Cycle Time = 150 seconds (Optimum Cycle Time - Minimum Degree of Saturation)
Phase times determined by the programSequence: Opposed TurnsMovement Class: All Movement ClassesInput Sequence: A, B, COutput Sequence: A, B, C
Phase Timing Results
Phase A B C
Reference Phase No No Yes
Phase Change Time (sec) 25 126 0
Green Time (sec) 95 18 19
Yellow Time (sec) 4 4 4
All-Red Time (sec) 2 2 2
Phase Time (sec) 101 24 25
Phase Split 67 % 16 % 17 %
Normal Movement Permitted/Opposed
Slip/Bypass-Lane Movement Opposed Slip/Bypass-Lane
Stopped Movement Turn On Red
Other Movement Class Running Other Movement Class Stopped
Mixed Running & Stopped Movement Classes
Undetected Movement Phase Transition Applied
SIDRA INTERSECTION 6.1 | Copyright © 2000-2015 Akcelik and Associates Pty Ltd | sidrasolutions.comOrganisation: CARDNO | Processed: Friday, 6 May 2016 12:47:16 PMProject: G:\HRP16055 - Chambers Flat, Anzac Av 36-112\16055 - Analysis\SIDRA\Anzac Avenue Waterford Tamborine Rd.sip6

LANE SUMMARY
Site: 2036 PM Base Waterford-Tamborine Rd/Anzac Ave
King's Christian CollegeSignals - Fixed Time Isolated Cycle Time = 150 seconds (Optimum Cycle Time - Minimum Degree of Saturation)
Lane Use and Performance
Demand Flows 95% Back of QueueCap.
Deg.Satn
LaneUtil.
AverageDelay
Level ofService
Lane Config
Lane Length
Cap.Adj.
Prob. Block.Total HV Veh Dist
veh/h % veh/h v/c % sec m m % %South: Waterford-Tamborine Rd (S)
Lane 1 146 5.0 1400 0.104 100 6.9 LOS A 1.3 9.8 Short 150 0.0 NA
Lane 2 444 5.0 957 0.464 100 25.2 LOS B 20.5 149.8 Full 500 0.0 0.0
Lane 3 444 5.0 957 0.464 100 25.2 LOS B 20.5 149.8 Full 500 0.0 0.0
Approach 1034 5.0 0.464 22.6 LOS B 20.5 149.8
North: Waterford-Tamborine Rd (N)
Lane 1 603 5.0 1372 0.439 100 8.6 LOS A 17.2 125.9 Full 500 0.0 0.0
Lane 2 603 5.0 1372 0.439 100 8.6 LOS A 17.2 125.9 Full 500 0.0 0.0
Lane 3 149 5.0 323 0.463 100 65.3 LOS E 9.9 72.0 Short 150 0.0 NA
Lane 4 149 5.0 323 0.463 100 65.3 LOS E 9.9 72.0 Short 120 0.0 NA
Approach 1505 5.0 0.463 19.9 LOS B 17.2 125.9
West: Anzac Ave
Lane 1 177 5.0 915 0.193 100 9.2 LOS A 2.9 21.4 Short 25 0.0 NA
Lane 2 177 5.0 915 0.193 100 9.2 LOS A 2.9 21.4 Short 50 0.0 NA
Lane 3 156 5.0 347 0.449 100 63.5 LOS E 10.1 73.9 Full 500 0.0 0.0
Approach 509 5.0 0.449 25.8 LOS B 10.1 73.9
Intersection 3048 5.0 0.464 21.8 LOS B 20.5 149.8
Level of Service (LOS) Method: Delay (RTA NSW).
Lane LOS values are based on average delay per lane.
Intersection and Approach LOS values are based on average delay for all lanes.
SIDRA Standard Delay Model is used. Control Delay includes Geometric Delay.
Gap-Acceptance Capacity: SIDRA Standard (Akçelik M3D).
HV (%) values are calculated for All Movement Classes of All Heavy Vehicle Model Designation.
SIDRA INTERSECTION 6.1 | Copyright © 2000-2015 Akcelik and Associates Pty Ltd | sidrasolutions.comOrganisation: CARDNO | Processed: Friday, 6 May 2016 12:47:17 PMProject: G:\HRP16055 - Chambers Flat, Anzac Av 36-112\16055 - Analysis\SIDRA\Anzac Avenue Waterford Tamborine Rd.sip6
PHASING SUMMARY
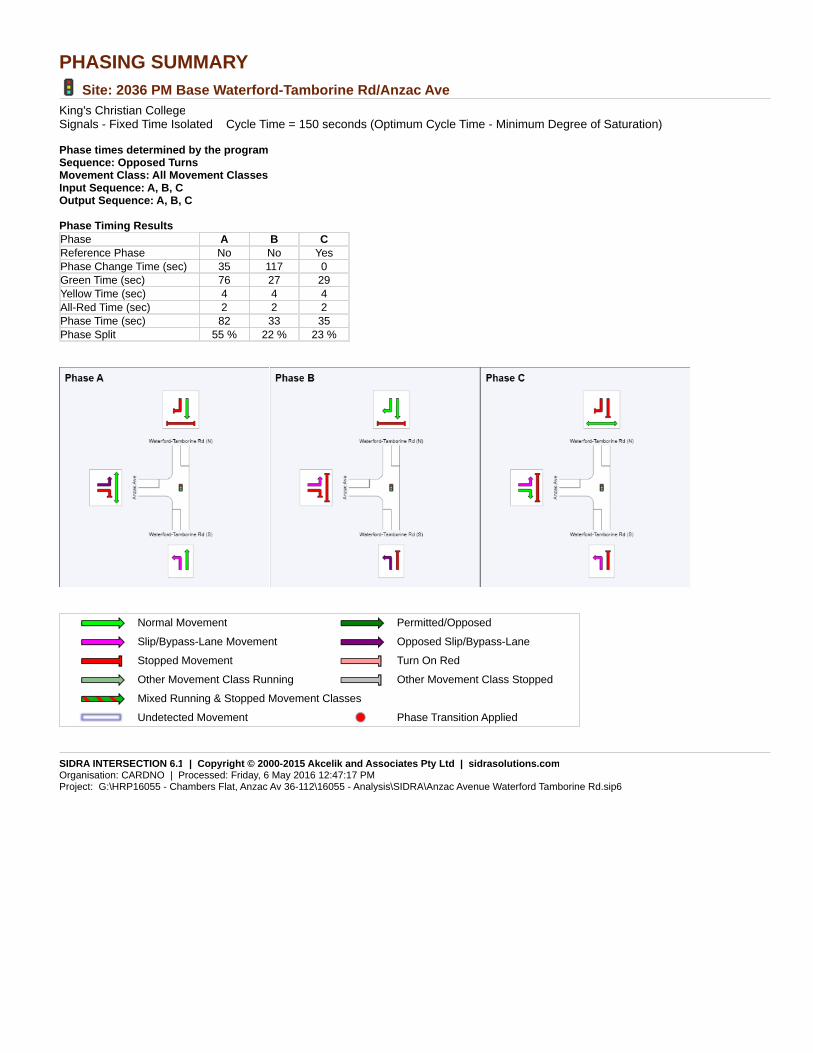
Site: 2036 PM Base Waterford-Tamborine Rd/Anzac Ave
King's Christian CollegeSignals - Fixed Time Isolated Cycle Time = 150 seconds (Optimum Cycle Time - Minimum Degree of Saturation)
Phase times determined by the programSequence: Opposed TurnsMovement Class: All Movement ClassesInput Sequence: A, B, COutput Sequence: A, B, C
Phase Timing Results
Phase A B C
Reference Phase No No Yes
Phase Change Time (sec) 35 117 0
Green Time (sec) 76 27 29
Yellow Time (sec) 4 4 4
All-Red Time (sec) 2 2 2
Phase Time (sec) 82 33 35
Phase Split 55 % 22 % 23 %
Normal Movement Permitted/Opposed
Slip/Bypass-Lane Movement Opposed Slip/Bypass-Lane
Stopped Movement Turn On Red
Other Movement Class Running Other Movement Class Stopped
Mixed Running & Stopped Movement Classes
Undetected Movement Phase Transition Applied
SIDRA INTERSECTION 6.1 | Copyright © 2000-2015 Akcelik and Associates Pty Ltd | sidrasolutions.comOrganisation: CARDNO | Processed: Friday, 6 May 2016 12:47:17 PMProject: G:\HRP16055 - Chambers Flat, Anzac Av 36-112\16055 - Analysis\SIDRA\Anzac Avenue Waterford Tamborine Rd.sip6

LANE SUMMARY
Site: 2026 AM Post Dev Waterford-Tamborine Rd/Anzac Ave
King's Christian CollegeSignals - Fixed Time Isolated Cycle Time = 150 seconds (Optimum Cycle Time - Minimum Degree of Saturation)
Lane Use and Performance
Demand Flows 95% Back of QueueCap.
Deg.Satn
LaneUtil.
AverageDelay
Level ofService
Lane Config
Lane Length
Cap.Adj.
Prob. Block.Total HV Veh Dist
veh/h % veh/h v/c % sec m m % %South: Waterford-Tamborine Rd (S)
Lane 1 378 5.0 1201 0.315 100 10.8 LOS A 8.3 60.2 Short 150 0.0 NA
Lane 2 598 5.0 881 0.678 100 33.1 LOS C 33.6 245.2 Full 500 0.0 0.0
Lane 3 598 5.0 881 0.678 100 33.1 LOS C 33.6 245.2 Full 500 0.0 0.0
Approach 1574 5.0 0.678 27.7 LOS B 33.6 245.2
North: Waterford-Tamborine Rd (N)
Lane 1 221 5.0 1498 0.148 100 3.8 LOS A 3.7 26.7 Full 500 0.0 0.0
Lane 2 221 5.0 1498 0.148 100 3.8 LOS A 3.7 26.7 Full 500 0.0 0.0
Lane 3 348 5.0 514 0.678 100 56.5 LOS D 22.5 164.4 Short 150 0.0 NA8
Lane 4 348 5.0 514 0.678 100 56.5 LOS D 22.5 164.4 Short 120 0.0 NA
Approach 1139 5.0 0.678 36.0 LOS C 22.5 164.4
West: Anzac Ave
Lane 1 329 5.0 6181
0.533 100 15.3 LOS B 9.8 71.8 Short 25 0.0 NA
Lane 2 329 5.0 6181
0.533 100 15.3 LOS B 9.8 71.8 Short 50 0.0 NA8
Lane 3 102 5.0 227 0.450 100 72.2 LOS F 7.1 51.5 Full 500 0.0 0.0
Approach 761 5.0 0.533 22.9 LOS B 9.8 71.8
Intersection 3474 5.0 0.678 29.4 LOS C 33.6 245.2
Level of Service (LOS) Method: Delay (RTA NSW).
Lane LOS values are based on average delay per lane.
Intersection and Approach LOS values are based on average delay for all lanes.
SIDRA Standard Delay Model is used. Control Delay includes Geometric Delay.
Gap-Acceptance Capacity: SIDRA Standard (Akçelik M3D).
HV (%) values are calculated for All Movement Classes of All Heavy Vehicle Model Designation.
1 Reduced capacity due to a short lane effect. Short lane queues may extend into the adjacent full-length lanes. Some upstream delays at entry to short lanes are not included.
8 Probability of Blockage has been set on the basis of a queue that overflows from an adjacent short lane.
SIDRA INTERSECTION 6.1 | Copyright © 2000-2015 Akcelik and Associates Pty Ltd | sidrasolutions.comOrganisation: CARDNO | Processed: Monday, 9 May 2016 2:04:02 PMProject: G:\HRP16055 - Chambers Flat, Anzac Av 36-112\16055 - Analysis\SIDRA\Anzac Avenue Waterford Tamborine Rd.sip6
PHASING SUMMARY
Site: 2026 AM Post Dev Waterford-Tamborine Rd/Anzac Ave
King's Christian CollegeSignals - Fixed Time Isolated Cycle Time = 150 seconds (Optimum Cycle Time - Minimum Degree of Saturation)
Phase times determined by the programSequence: Opposed TurnsMovement Class: All Movement ClassesInput Sequence: A, B, COutput Sequence: A, B, C
Phase Timing Results
Phase A B C
Reference Phase No No Yes
Phase Change Time (sec) 25 101 0Green Time (sec) 70 43 19Yellow Time (sec) 4 4 4All-Red Time (sec) 2 2 2Phase Time (sec) 76 49 25Phase Split 51 % 33 % 17 %
Normal Movement Permitted/Opposed
Slip/Bypass-Lane Movement Opposed Slip/Bypass-Lane
Stopped Movement Turn On Red
Other Movement Class Running Other Movement Class Stopped
Mixed Running & Stopped Movement Classes
Undetected Movement Phase Transition Applied
SIDRA INTERSECTION 6.1 | Copyright © 2000-2015 Akcelik and Associates Pty Ltd | sidrasolutions.comOrganisation: CARDNO | Processed: Monday, 9 May 2016 2:04:02 PMProject: G:\HRP16055 - Chambers Flat, Anzac Av 36-112\16055 - Analysis\SIDRA\Anzac Avenue Waterford Tamborine Rd.sip6
LANE SUMMARY
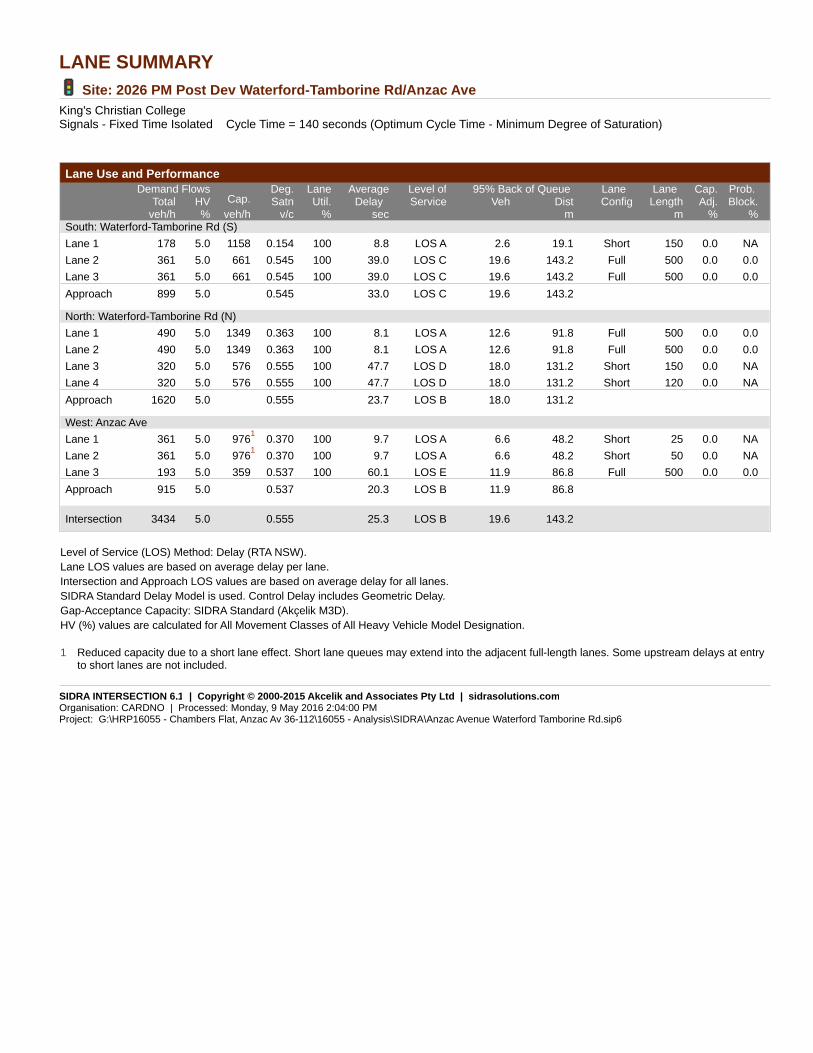
Site: 2026 PM Post Dev Waterford-Tamborine Rd/Anzac Ave
King's Christian CollegeSignals - Fixed Time Isolated Cycle Time = 140 seconds (Optimum Cycle Time - Minimum Degree of Saturation)
Lane Use and Performance
Demand Flows 95% Back of QueueCap.
Deg.Satn
LaneUtil.
AverageDelay
Level ofService
Lane Config
Lane Length
Cap.Adj.
Prob. Block.Total HV Veh Dist
veh/h % veh/h v/c % sec m m % %South: Waterford-Tamborine Rd (S)
Lane 1 178 5.0 1158 0.154 100 8.8 LOS A 2.6 19.1 Short 150 0.0 NA
Lane 2 361 5.0 661 0.545 100 39.0 LOS C 19.6 143.2 Full 500 0.0 0.0
Lane 3 361 5.0 661 0.545 100 39.0 LOS C 19.6 143.2 Full 500 0.0 0.0
Approach 899 5.0 0.545 33.0 LOS C 19.6 143.2
North: Waterford-Tamborine Rd (N)
Lane 1 490 5.0 1349 0.363 100 8.1 LOS A 12.6 91.8 Full 500 0.0 0.0
Lane 2 490 5.0 1349 0.363 100 8.1 LOS A 12.6 91.8 Full 500 0.0 0.0
Lane 3 320 5.0 576 0.555 100 47.7 LOS D 18.0 131.2 Short 150 0.0 NA
Lane 4 320 5.0 576 0.555 100 47.7 LOS D 18.0 131.2 Short 120 0.0 NA
Approach 1620 5.0 0.555 23.7 LOS B 18.0 131.2
West: Anzac Ave
Lane 1 361 5.0 9761
0.370 100 9.7 LOS A 6.6 48.2 Short 25 0.0 NA
Lane 2 361 5.0 9761
0.370 100 9.7 LOS A 6.6 48.2 Short 50 0.0 NA
Lane 3 193 5.0 359 0.537 100 60.1 LOS E 11.9 86.8 Full 500 0.0 0.0
Approach 915 5.0 0.537 20.3 LOS B 11.9 86.8
Intersection 3434 5.0 0.555 25.3 LOS B 19.6 143.2
Level of Service (LOS) Method: Delay (RTA NSW).
Lane LOS values are based on average delay per lane.
Intersection and Approach LOS values are based on average delay for all lanes.
SIDRA Standard Delay Model is used. Control Delay includes Geometric Delay.
Gap-Acceptance Capacity: SIDRA Standard (Akçelik M3D).
HV (%) values are calculated for All Movement Classes of All Heavy Vehicle Model Designation.
1 Reduced capacity due to a short lane effect. Short lane queues may extend into the adjacent full-length lanes. Some upstream delays at entry to short lanes are not included.
SIDRA INTERSECTION 6.1 | Copyright © 2000-2015 Akcelik and Associates Pty Ltd | sidrasolutions.comOrganisation: CARDNO | Processed: Monday, 9 May 2016 2:04:00 PMProject: G:\HRP16055 - Chambers Flat, Anzac Av 36-112\16055 - Analysis\SIDRA\Anzac Avenue Waterford Tamborine Rd.sip6

PHASING SUMMARY
Site: 2026 PM Post Dev Waterford-Tamborine Rd/Anzac Ave
King's Christian CollegeSignals - Fixed Time Isolated Cycle Time = 140 seconds (Optimum Cycle Time - Minimum Degree of Saturation)
Phase times determined by the programSequence: Opposed TurnsMovement Class: All Movement ClassesInput Sequence: A, B, COutput Sequence: A, B, C
Phase Timing Results
Phase A B C
Reference Phase No No Yes
Phase Change Time (sec) 34 89 0Green Time (sec) 49 45 28Yellow Time (sec) 4 4 4All-Red Time (sec) 2 2 2Phase Time (sec) 55 51 34Phase Split 39 % 36 % 24 %
Normal Movement Permitted/Opposed
Slip/Bypass-Lane Movement Opposed Slip/Bypass-Lane
Stopped Movement Turn On Red
Other Movement Class Running Other Movement Class Stopped
Mixed Running & Stopped Movement Classes
Undetected Movement Phase Transition Applied
SIDRA INTERSECTION 6.1 | Copyright © 2000-2015 Akcelik and Associates Pty Ltd | sidrasolutions.comOrganisation: CARDNO | Processed: Monday, 9 May 2016 2:04:00 PMProject: G:\HRP16055 - Chambers Flat, Anzac Av 36-112\16055 - Analysis\SIDRA\Anzac Avenue Waterford Tamborine Rd.sip6

LANE SUMMARY
Site: 2036 AM Post Dev Waterford-Tamborine Rd/Anzac Ave
King's Christian CollegeSignals - Fixed Time Isolated Cycle Time = 150 seconds (Optimum Cycle Time - Minimum Degree of Saturation)
Lane Use and Performance
Demand Flows 95% Back of QueueCap.
Deg.Satn
LaneUtil.
AverageDelay
Level ofService
Lane Config
Lane Length
Cap.Adj.
Prob. Block.Total HV Veh Dist
veh/h % veh/h v/c % sec m m % %South: Waterford-Tamborine Rd (S)
Lane 1 446 5.0 1160 0.385 100 14.1 LOS A 12.8 93.8 Short 150 0.0 NA
Lane 2 689 5.0 7871
0.876 100 42.4 LOS C 45.6 332.9 Full 500 0.0 0.0
Lane 3 783 5.0 894 0.876 100 43.1 LOS D 54.4 397.3 Full 500 0.0 0.0
Approach 1918 5.0 0.876 36.1 LOS C 54.4 397.3
North: Waterford-Tamborine Rd (N)
Lane 1 272 5.0 1498 0.182 100 3.9 LOS A 4.7 34.0 Full 500 0.0 0.0
Lane 2 272 5.0 1498 0.182 100 3.9 LOS A 4.7 34.0 Full 500 0.0 0.0
Lane 3 426 5.0 4881
0.874 100 70.4 LOS E 32.8 239.2 Short 150 0.0 NA8
Lane 4 426 5.0 4881
0.874 100 70.4 LOS E 32.8 239.2 Short 120 0.0 NA
Approach 1397 5.0 0.874 44.5 LOS D 32.8 239.2
West: Anzac Ave
Lane 1 400 5.0 5311
0.753 100 26.7 LOS B 18.0 131.6 Short 25 0.0 NA
Lane 2 400 5.0 5311
0.753 100 26.7 LOS B 18.0 131.6 Short 50 0.0 NA
Lane 3 124 5.0 227 0.547 100 73.2 LOS F 8.7 63.6 Full 500 0.0 0.0
Approach 924 5.0 0.753 33.0 LOS C 18.0 131.6
Intersection 4239 5.0 0.876 38.2 LOS C 54.4 397.3
Level of Service (LOS) Method: Delay (RTA NSW).
Lane LOS values are based on average delay per lane.
Intersection and Approach LOS values are based on average delay for all lanes.
SIDRA Standard Delay Model is used. Control Delay includes Geometric Delay.
Gap-Acceptance Capacity: SIDRA Standard (Akçelik M3D).
HV (%) values are calculated for All Movement Classes of All Heavy Vehicle Model Designation.
1 Reduced capacity due to a short lane effect. Short lane queues may extend into the adjacent full-length lanes. Some upstream delays at entry to short lanes are not included.
8 Probability of Blockage has been set on the basis of a queue that overflows from an adjacent short lane.
SIDRA INTERSECTION 6.1 | Copyright © 2000-2015 Akcelik and Associates Pty Ltd | sidrasolutions.comOrganisation: CARDNO | Processed: Friday, 6 May 2016 12:47:14 PMProject: G:\HRP16055 - Chambers Flat, Anzac Av 36-112\16055 - Analysis\SIDRA\Anzac Avenue Waterford Tamborine Rd.sip6

PHASING SUMMARY
Site: 2036 AM Post Dev Waterford-Tamborine Rd/Anzac Ave
King's Christian CollegeSignals - Fixed Time Isolated Cycle Time = 150 seconds (Optimum Cycle Time - Minimum Degree of Saturation)
Phase times determined by the programSequence: Opposed TurnsMovement Class: All Movement ClassesInput Sequence: A, B, COutput Sequence: A, B, C
Phase Timing Results
Phase A B C
Reference Phase No No Yes
Phase Change Time (sec) 25 102 0
Green Time (sec) 71 42 19
Yellow Time (sec) 4 4 4
All-Red Time (sec) 2 2 2
Phase Time (sec) 77 48 25
Phase Split 51 % 32 % 17 %
Normal Movement Permitted/Opposed
Slip/Bypass-Lane Movement Opposed Slip/Bypass-Lane
Stopped Movement Turn On Red
Other Movement Class Running Other Movement Class Stopped
Mixed Running & Stopped Movement Classes
Undetected Movement Phase Transition Applied
SIDRA INTERSECTION 6.1 | Copyright © 2000-2015 Akcelik and Associates Pty Ltd | sidrasolutions.comOrganisation: CARDNO | Processed: Friday, 6 May 2016 12:47:14 PMProject: G:\HRP16055 - Chambers Flat, Anzac Av 36-112\16055 - Analysis\SIDRA\Anzac Avenue Waterford Tamborine Rd.sip6

LANE SUMMARY
Site: 2036 PM Post Dev Waterford-Tamborine Rd/Anzac Ave
King's Christian CollegeSignals - Fixed Time Isolated Cycle Time = 115 seconds (Optimum Cycle Time - Minimum Degree of Saturation)
Lane Use and Performance
Demand Flows 95% Back of QueueCap.
Deg.Satn
LaneUtil.
AverageDelay
Level ofService
Lane Config
Lane Length
Cap.Adj.
Prob. Block.Total HV Veh Dist
veh/h % veh/h v/c % sec m m % %South: Waterford-Tamborine Rd (S)
Lane 1 213 5.0 1092 0.195 100 10.0 LOS A 3.4 24.7 Short 150 0.0 NA
Lane 2 444 5.0 640 0.693 100 35.3 LOS C 21.5 157.0 Full 500 0.0 0.0
Lane 3 444 5.0 640 0.693 100 35.3 LOS C 21.5 157.0 Full 500 0.0 0.0
Approach 1100 5.0 0.693 30.4 LOS C 21.5 157.0
North: Waterford-Tamborine Rd (N)
Lane 1 603 5.0 1330 0.453 100 7.8 LOS A 14.4 105.2 Full 500 0.0 0.0
Lane 2 603 5.0 1330 0.453 100 7.8 LOS A 14.4 105.2 Full 500 0.0 0.0
Lane 3 389 5.0 561 0.693 100 43.1 LOS D 19.2 140.4 Short 150 0.0 NA
Lane 4 389 5.0 561 0.693 100 43.1 LOS D 19.2 140.4 Short 120 0.0 NA
Approach 1984 5.0 0.693 21.6 LOS B 19.2 140.4
West: Anzac Ave
Lane 1 438 5.0 7741
0.566 100 11.8 LOS A 9.4 68.3 Short 25 0.0 NA
Lane 2 438 5.0 7741
0.566 100 11.8 LOS A 9.4 68.3 Short 50 0.0 NA8
Lane 3 229 5.0 343 0.669 100 53.3 LOS D 12.3 89.5 Full 500 0.0 0.0
Approach 1106 5.0 0.669 20.4 LOS B 12.3 89.5
Intersection 4191 5.0 0.693 23.6 LOS B 21.5 157.0
Level of Service (LOS) Method: Delay (RTA NSW).
Lane LOS values are based on average delay per lane.
Intersection and Approach LOS values are based on average delay for all lanes.
SIDRA Standard Delay Model is used. Control Delay includes Geometric Delay.
Gap-Acceptance Capacity: SIDRA Standard (Akçelik M3D).
HV (%) values are calculated for All Movement Classes of All Heavy Vehicle Model Designation.
1 Reduced capacity due to a short lane effect. Short lane queues may extend into the adjacent full-length lanes. Some upstream delays at entry to short lanes are not included.
8 Probability of Blockage has been set on the basis of a queue that overflows from an adjacent short lane.
SIDRA INTERSECTION 6.1 | Copyright © 2000-2015 Akcelik and Associates Pty Ltd | sidrasolutions.comOrganisation: CARDNO | Processed: Friday, 6 May 2016 12:47:15 PMProject: G:\HRP16055 - Chambers Flat, Anzac Av 36-112\16055 - Analysis\SIDRA\Anzac Avenue Waterford Tamborine Rd.sip6

PHASING SUMMARY
Site: 2036 PM Post Dev Waterford-Tamborine Rd/Anzac Ave
King's Christian CollegeSignals - Fixed Time Isolated Cycle Time = 115 seconds (Optimum Cycle Time - Minimum Degree of Saturation)
Phase times determined by the programSequence: Opposed TurnsMovement Class: All Movement ClassesInput Sequence: A, B, COutput Sequence: A, B, C
Phase Timing Results
Phase A B C
Reference Phase No No Yes
Phase Change Time (sec) 28 73 0
Green Time (sec) 39 36 22
Yellow Time (sec) 4 4 4
All-Red Time (sec) 2 2 2
Phase Time (sec) 45 42 28
Phase Split 39 % 37 % 24 %
Normal Movement Permitted/Opposed
Slip/Bypass-Lane Movement Opposed Slip/Bypass-Lane
Stopped Movement Turn On Red
Other Movement Class Running Other Movement Class Stopped
Mixed Running & Stopped Movement Classes
Undetected Movement Phase Transition Applied
SIDRA INTERSECTION 6.1 | Copyright © 2000-2015 Akcelik and Associates Pty Ltd | sidrasolutions.comOrganisation: CARDNO | Processed: Friday, 6 May 2016 12:47:15 PMProject: G:\HRP16055 - Chambers Flat, Anzac Av 36-112\16055 - Analysis\SIDRA\Anzac Avenue Waterford Tamborine Rd.sip6
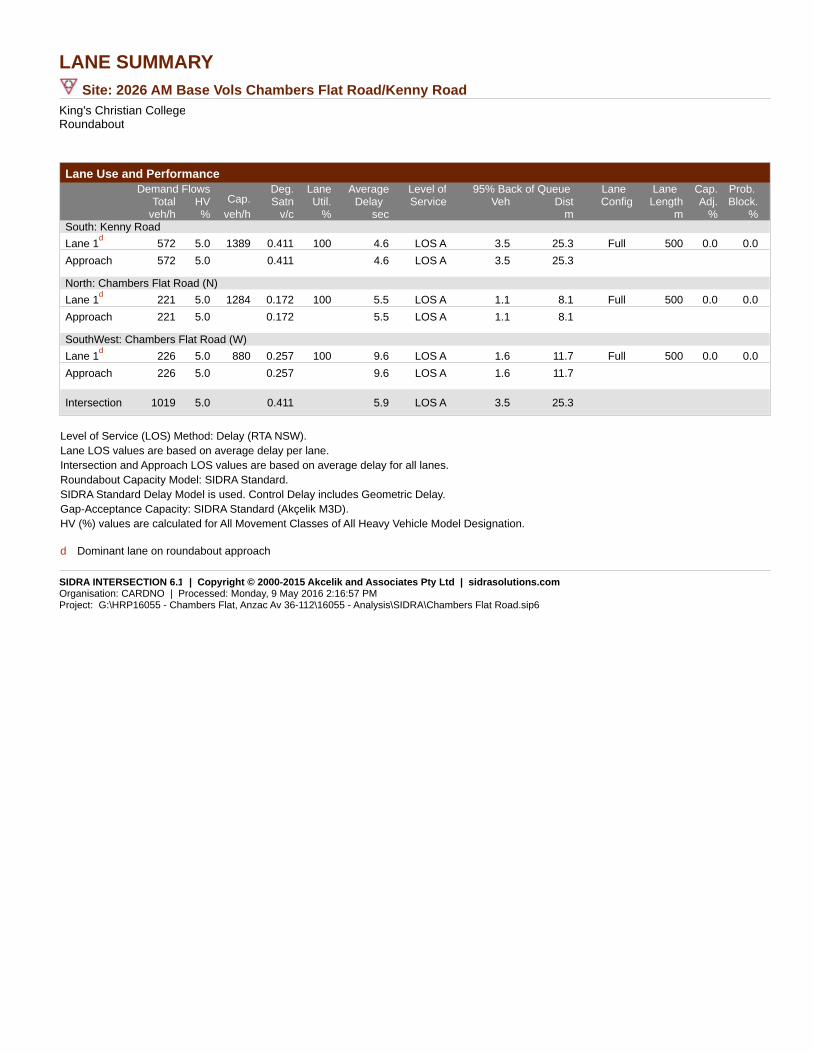
LANE SUMMARY
Site: 2026 AM Base Vols Chambers Flat Road/Kenny Road
King's Christian CollegeRoundabout
Lane Use and Performance
Demand Flows 95% Back of QueueCap.
Deg.Satn
LaneUtil.
AverageDelay
Level ofService
Lane Config
Lane Length
Cap.Adj.
Prob. Block.Total HV Veh Dist
veh/h % veh/h v/c % sec m m % %South: Kenny Road
Lane 1d
572 5.0 1389 0.411 100 4.6 LOS A 3.5 25.3 Full 500 0.0 0.0
Approach 572 5.0 0.411 4.6 LOS A 3.5 25.3
North: Chambers Flat Road (N)
Lane 1d
221 5.0 1284 0.172 100 5.5 LOS A 1.1 8.1 Full 500 0.0 0.0
Approach 221 5.0 0.172 5.5 LOS A 1.1 8.1
SouthWest: Chambers Flat Road (W)
Lane 1d
226 5.0 880 0.257 100 9.6 LOS A 1.6 11.7 Full 500 0.0 0.0
Approach 226 5.0 0.257 9.6 LOS A 1.6 11.7
Intersection 1019 5.0 0.411 5.9 LOS A 3.5 25.3
Level of Service (LOS) Method: Delay (RTA NSW).
Lane LOS values are based on average delay per lane.
Intersection and Approach LOS values are based on average delay for all lanes.
Roundabout Capacity Model: SIDRA Standard.
SIDRA Standard Delay Model is used. Control Delay includes Geometric Delay.
Gap-Acceptance Capacity: SIDRA Standard (Akçelik M3D).
HV (%) values are calculated for All Movement Classes of All Heavy Vehicle Model Designation.
d Dominant lane on roundabout approach
SIDRA INTERSECTION 6.1 | Copyright © 2000-2015 Akcelik and Associates Pty Ltd | sidrasolutions.comOrganisation: CARDNO | Processed: Monday, 9 May 2016 2:16:57 PMProject: G:\HRP16055 - Chambers Flat, Anzac Av 36-112\16055 - Analysis\SIDRA\Chambers Flat Road.sip6

LANE SUMMARY
Site: 2026 PM Base Vols Chambers Flat Road/Kenny Road
King's Christian CollegeRoundabout
Lane Use and Performance
Demand Flows 95% Back of QueueCap.
Deg.Satn
LaneUtil.
AverageDelay
Level ofService
Lane Config
Lane Length
Cap.Adj.
Prob. Block.Total HV Veh Dist
veh/h % veh/h v/c % sec m m % %South: Kenny Road
Lane 1d
357 5.0 1221 0.292 100 5.0 LOS A 2.1 15.1 Full 500 0.0 0.0
Approach 357 5.0 0.292 5.0 LOS A 2.1 15.1
North: Chambers Flat Road (N)
Lane 1d
484 5.0 1386 0.349 100 5.4 LOS A 2.6 19.1 Full 500 0.0 0.0
Approach 484 5.0 0.349 5.4 LOS A 2.6 19.1
SouthWest: Chambers Flat Road (W)
Lane 1d
153 5.0 1078 0.142 100 8.2 LOS A 0.8 5.9 Full 500 0.0 0.0
Approach 153 5.0 0.142 8.2 LOS A 0.8 5.9
Intersection 994 5.0 0.349 5.7 LOS A 2.6 19.1
Level of Service (LOS) Method: Delay (RTA NSW).
Lane LOS values are based on average delay per lane.
Intersection and Approach LOS values are based on average delay for all lanes.
Roundabout Capacity Model: SIDRA Standard.
SIDRA Standard Delay Model is used. Control Delay includes Geometric Delay.
Gap-Acceptance Capacity: SIDRA Standard (Akçelik M3D).
HV (%) values are calculated for All Movement Classes of All Heavy Vehicle Model Designation.
d Dominant lane on roundabout approach
SIDRA INTERSECTION 6.1 | Copyright © 2000-2015 Akcelik and Associates Pty Ltd | sidrasolutions.comOrganisation: CARDNO | Processed: Monday, 9 May 2016 2:16:58 PMProject: G:\HRP16055 - Chambers Flat, Anzac Av 36-112\16055 - Analysis\SIDRA\Chambers Flat Road.sip6

LANE SUMMARY
Site: 2036 AM Base Vols Chambers Flat Road/Kenny Road
King's Christian CollegeRoundabout
Lane Use and Performance
Demand Flows 95% Back of QueueCap.
Deg.Satn
LaneUtil.
AverageDelay
Level ofService
Lane Config
Lane Length
Cap.Adj.
Prob. Block.Total HV Veh Dist
veh/h % veh/h v/c % sec m m % %South: Kenny Road
Lane 1d
666 5.0 1374 0.485 100 4.7 LOS A 4.5 33.1 Full 500 0.0 0.0
Approach 666 5.0 0.485 4.7 LOS A 4.5 33.1
North: Chambers Flat Road (N)
Lane 1d
258 5.0 1260 0.205 100 5.7 LOS A 1.4 10.0 Full 500 0.0 0.0
Approach 258 5.0 0.205 5.7 LOS A 1.4 10.0
SouthWest: Chambers Flat Road (W)
Lane 1d
263 5.0 809 0.325 100 10.5 LOS A 2.2 15.8 Full 500 0.0 0.0
Approach 263 5.0 0.325 10.5 LOS A 2.2 15.8
Intersection 1187 5.0 0.485 6.2 LOS A 4.5 33.1
Level of Service (LOS) Method: Delay (RTA NSW).
Lane LOS values are based on average delay per lane.
Intersection and Approach LOS values are based on average delay for all lanes.
Roundabout Capacity Model: SIDRA Standard.
SIDRA Standard Delay Model is used. Control Delay includes Geometric Delay.
Gap-Acceptance Capacity: SIDRA Standard (Akçelik M3D).
HV (%) values are calculated for All Movement Classes of All Heavy Vehicle Model Designation.
d Dominant lane on roundabout approach
SIDRA INTERSECTION 6.1 | Copyright © 2000-2015 Akcelik and Associates Pty Ltd | sidrasolutions.comOrganisation: CARDNO | Processed: Monday, 9 May 2016 2:16:58 PMProject: G:\HRP16055 - Chambers Flat, Anzac Av 36-112\16055 - Analysis\SIDRA\Chambers Flat Road.sip6
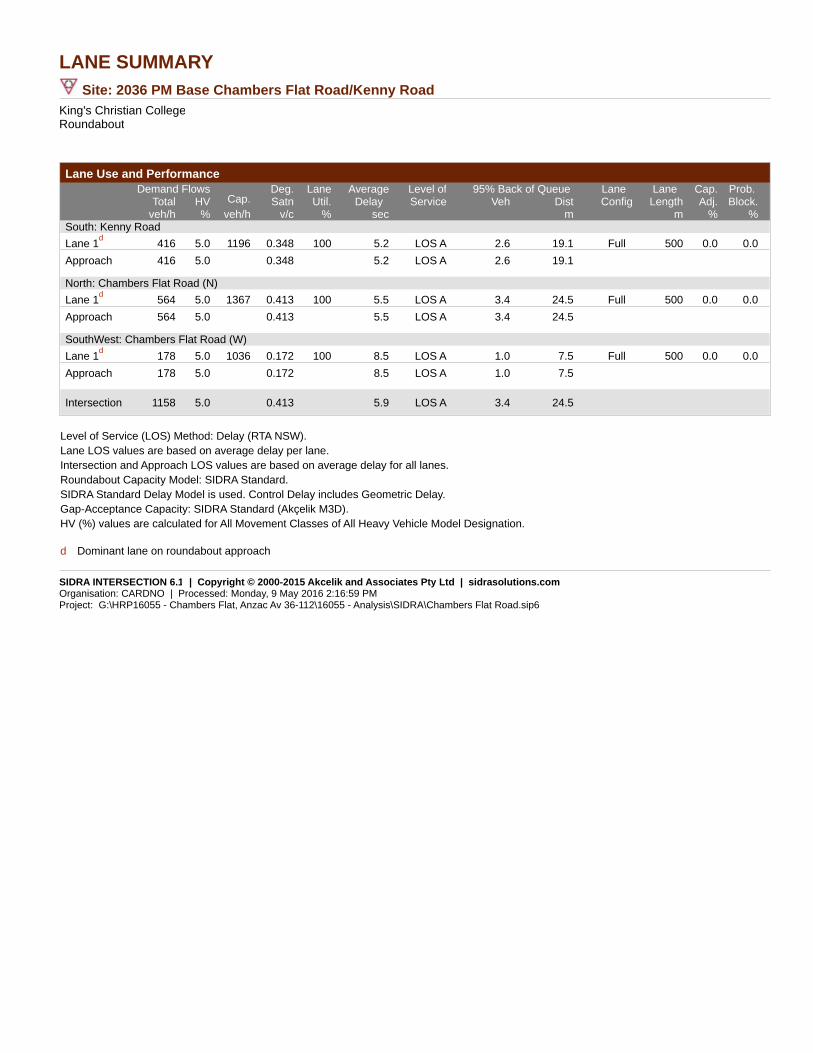
LANE SUMMARY
Site: 2036 PM Base Chambers Flat Road/Kenny Road
King's Christian CollegeRoundabout
Lane Use and Performance
Demand Flows 95% Back of QueueCap.
Deg.Satn
LaneUtil.
AverageDelay
Level ofService
Lane Config
Lane Length
Cap.Adj.
Prob. Block.Total HV Veh Dist
veh/h % veh/h v/c % sec m m % %South: Kenny Road
Lane 1d
416 5.0 1196 0.348 100 5.2 LOS A 2.6 19.1 Full 500 0.0 0.0
Approach 416 5.0 0.348 5.2 LOS A 2.6 19.1
North: Chambers Flat Road (N)
Lane 1d
564 5.0 1367 0.413 100 5.5 LOS A 3.4 24.5 Full 500 0.0 0.0
Approach 564 5.0 0.413 5.5 LOS A 3.4 24.5
SouthWest: Chambers Flat Road (W)
Lane 1d
178 5.0 1036 0.172 100 8.5 LOS A 1.0 7.5 Full 500 0.0 0.0
Approach 178 5.0 0.172 8.5 LOS A 1.0 7.5
Intersection 1158 5.0 0.413 5.9 LOS A 3.4 24.5
Level of Service (LOS) Method: Delay (RTA NSW).
Lane LOS values are based on average delay per lane.
Intersection and Approach LOS values are based on average delay for all lanes.
Roundabout Capacity Model: SIDRA Standard.
SIDRA Standard Delay Model is used. Control Delay includes Geometric Delay.
Gap-Acceptance Capacity: SIDRA Standard (Akçelik M3D).
HV (%) values are calculated for All Movement Classes of All Heavy Vehicle Model Designation.
d Dominant lane on roundabout approach
SIDRA INTERSECTION 6.1 | Copyright © 2000-2015 Akcelik and Associates Pty Ltd | sidrasolutions.comOrganisation: CARDNO | Processed: Monday, 9 May 2016 2:16:59 PMProject: G:\HRP16055 - Chambers Flat, Anzac Av 36-112\16055 - Analysis\SIDRA\Chambers Flat Road.sip6

LANE SUMMARY
Site: 2026 AM Post Dev Chambers Flat Road/Kenny Road
King's Christian CollegeRoundabout
Lane Use and Performance
Demand Flows 95% Back of QueueCap.
Deg.Satn
LaneUtil.
AverageDelay
Level ofService
Lane Config
Lane Length
Cap.Adj.
Prob. Block.Total HV Veh Dist
veh/h % veh/h v/c % sec m m % %South: Kenny Road
Lane 1d
979 5.0 1422 0.688 100 4.9 LOS A 10.2 74.3 Full 500 0.0 0.0
Approach 979 5.0 0.688 4.9 LOS A 10.2 74.3
North: Chambers Flat Road (N)
Lane 1d
538 5.0 1031 0.522 100 6.7 LOS A 4.6 33.5 Full 500 0.0 0.0
Approach 538 5.0 0.522 6.7 LOS A 4.6 33.5
SouthWest: Chambers Flat Road (W)
Lane 1d
414 5.0 580 0.713 100 26.0 LOS B 8.8 64.5 Full 500 0.0 0.0
Approach 414 5.0 0.713 26.0 LOS B 8.8 64.5
Intersection 1931 5.0 0.713 9.9 LOS A 10.2 74.3
Level of Service (LOS) Method: Delay (RTA NSW).
Lane LOS values are based on average delay per lane.
Intersection and Approach LOS values are based on average delay for all lanes.
Roundabout Capacity Model: SIDRA Standard.
SIDRA Standard Delay Model is used. Control Delay includes Geometric Delay.
Gap-Acceptance Capacity: SIDRA Standard (Akçelik M3D).
HV (%) values are calculated for All Movement Classes of All Heavy Vehicle Model Designation.
d Dominant lane on roundabout approach
SIDRA INTERSECTION 6.1 | Copyright © 2000-2015 Akcelik and Associates Pty Ltd | sidrasolutions.comOrganisation: CARDNO | Processed: Monday, 9 May 2016 2:16:59 PMProject: G:\HRP16055 - Chambers Flat, Anzac Av 36-112\16055 - Analysis\SIDRA\Chambers Flat Road.sip6

LANE SUMMARY
Site: 2026 PM Post Dev Chambers Flat Road/Kenny Road
King's Christian CollegeRoundabout
Lane Use and Performance
Demand Flows 95% Back of QueueCap.
Deg.Satn
LaneUtil.
AverageDelay
Level ofService
Lane Config
Lane Length
Cap.Adj.
Prob. Block.Total HV Veh Dist
veh/h % veh/h v/c % sec m m % %South: Kenny Road
Lane 1d
802 5.0 1267 0.633 100 5.4 LOS A 7.5 54.4 Full 500 0.0 0.0
Approach 802 5.0 0.633 5.4 LOS A 7.5 54.4
North: Chambers Flat Road (N)
Lane 1d
822 5.0 1269 0.648 100 6.1 LOS A 7.2 52.9 Full 500 0.0 0.0
Approach 822 5.0 0.648 6.1 LOS A 7.2 52.9
SouthWest: Chambers Flat Road (W)
Lane 1d
223 5.0 786 0.284 100 11.6 LOS A 1.9 14.0 Full 500 0.0 0.0
Approach 223 5.0 0.284 11.6 LOS A 1.9 14.0
Intersection 1847 5.0 0.648 6.5 LOS A 7.5 54.4
Level of Service (LOS) Method: Delay (RTA NSW).
Lane LOS values are based on average delay per lane.
Intersection and Approach LOS values are based on average delay for all lanes.
Roundabout Capacity Model: SIDRA Standard.
SIDRA Standard Delay Model is used. Control Delay includes Geometric Delay.
Gap-Acceptance Capacity: SIDRA Standard (Akçelik M3D).
HV (%) values are calculated for All Movement Classes of All Heavy Vehicle Model Designation.
d Dominant lane on roundabout approach
SIDRA INTERSECTION 6.1 | Copyright © 2000-2015 Akcelik and Associates Pty Ltd | sidrasolutions.comOrganisation: CARDNO | Processed: Monday, 9 May 2016 2:17:00 PMProject: G:\HRP16055 - Chambers Flat, Anzac Av 36-112\16055 - Analysis\SIDRA\Chambers Flat Road.sip6

LANE SUMMARY
Site: 2036 AM Post Dev Chambers Flat Road/Kenny Road
King's Christian CollegeRoundabout
Lane Use and Performance
Demand Flows 95% Back of QueueCap.
Deg.Satn
LaneUtil.
AverageDelay
Level ofService
Lane Config
Lane Length
Cap.Adj.
Prob. Block.Total HV Veh Dist
veh/h % veh/h v/c % sec m m % %South: Kenny Road
Lane 1d
1176 5.0 1406 0.836 100 5.5 LOS A 18.4 134.6 Full 500 0.0 0.0
Approach 1176 5.0 0.836 5.5 LOS A 18.4 134.6
North: Chambers Flat Road (N)
Lane 1d
654 5.0 1055 0.620 100 7.4 LOS A 6.5 47.6 Full 500 0.0 0.0
Approach 654 5.0 0.620 7.4 LOS A 6.5 47.6
SouthWest: Chambers Flat Road (W)
Lane 1d
495 5.0 393 1.258 100 284.3 LOS F 81.9 597.7 Full 500 0.0 10.5
Approach 495 5.0 1.258 284.3 LOS F 81.9 597.7
Intersection 2324 5.0 1.258 65.4 LOS E 81.9 597.7
Level of Service (LOS) Method: Delay (RTA NSW).
Lane LOS values are based on average delay per lane.
Intersection and Approach LOS values are based on average delay for all lanes.
Roundabout Capacity Model: SIDRA Standard.
SIDRA Standard Delay Model is used. Control Delay includes Geometric Delay.
Gap-Acceptance Capacity: SIDRA Standard (Akçelik M3D).
HV (%) values are calculated for All Movement Classes of All Heavy Vehicle Model Designation.
d Dominant lane on roundabout approach
SIDRA INTERSECTION 6.1 | Copyright © 2000-2015 Akcelik and Associates Pty Ltd | sidrasolutions.comOrganisation: CARDNO | Processed: Monday, 9 May 2016 2:17:00 PMProject: G:\HRP16055 - Chambers Flat, Anzac Av 36-112\16055 - Analysis\SIDRA\Chambers Flat Road.sip6
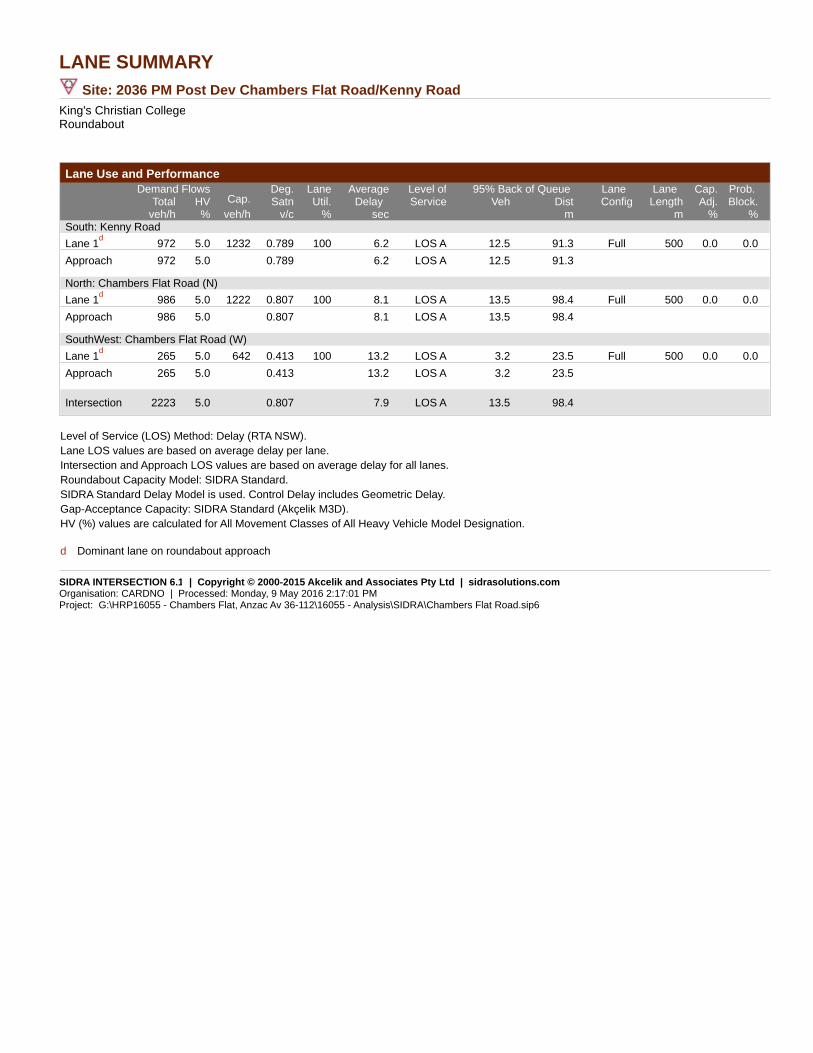
LANE SUMMARY
Site: 2036 PM Post Dev Chambers Flat Road/Kenny Road
King's Christian CollegeRoundabout
Lane Use and Performance
Demand Flows 95% Back of QueueCap.
Deg.Satn
LaneUtil.
AverageDelay
Level ofService
Lane Config
Lane Length
Cap.Adj.
Prob. Block.Total HV Veh Dist
veh/h % veh/h v/c % sec m m % %South: Kenny Road
Lane 1d
972 5.0 1232 0.789 100 6.2 LOS A 12.5 91.3 Full 500 0.0 0.0
Approach 972 5.0 0.789 6.2 LOS A 12.5 91.3
North: Chambers Flat Road (N)
Lane 1d
986 5.0 1222 0.807 100 8.1 LOS A 13.5 98.4 Full 500 0.0 0.0
Approach 986 5.0 0.807 8.1 LOS A 13.5 98.4
SouthWest: Chambers Flat Road (W)
Lane 1d
265 5.0 642 0.413 100 13.2 LOS A 3.2 23.5 Full 500 0.0 0.0
Approach 265 5.0 0.413 13.2 LOS A 3.2 23.5
Intersection 2223 5.0 0.807 7.9 LOS A 13.5 98.4
Level of Service (LOS) Method: Delay (RTA NSW).
Lane LOS values are based on average delay per lane.
Intersection and Approach LOS values are based on average delay for all lanes.
Roundabout Capacity Model: SIDRA Standard.
SIDRA Standard Delay Model is used. Control Delay includes Geometric Delay.
Gap-Acceptance Capacity: SIDRA Standard (Akçelik M3D).
HV (%) values are calculated for All Movement Classes of All Heavy Vehicle Model Designation.
d Dominant lane on roundabout approach
SIDRA INTERSECTION 6.1 | Copyright © 2000-2015 Akcelik and Associates Pty Ltd | sidrasolutions.comOrganisation: CARDNO | Processed: Monday, 9 May 2016 2:17:01 PMProject: G:\HRP16055 - Chambers Flat, Anzac Av 36-112\16055 - Analysis\SIDRA\Chambers Flat Road.sip6

LANE SUMMARY
Site: 2026 Post Dev AM Peak
Site Access/Anzac AvenueSignals - Fixed Time Isolated Cycle Time = 150 seconds (Optimum Cycle Time - Minimum Degree of Saturation)
Lane Use and Performance
Demand Flows 95% Back of QueueCap.
Deg.Satn
LaneUtil.
AverageDelay
Level ofService
Lane Config
Lane Length
Cap.Adj.
Prob. Block.Total HV Veh Dist
veh/h % veh/h v/c % sec m m % %South: Site Access
Lane 1 16 100.0 94 0.168 100 78.0 LOS F 1.1 14.6 Full 500 0.0 0.0
Approach 16 100.0 0.168 78.0 LOS F 1.1 14.6
East: Anzac Avenue
Lane 1 437 0.0 1032 0.423 100 16.2 LOS B 13.3 93.1 Short 125 0.0 NA
Lane 2 638 5.0 1158 0.551 100 17.8 LOS B 26.6 194.4 Full 500 0.0 0.0
Approach 1075 3.0 0.551 17.1 LOS B 26.6 194.4
West: Anzac Avenue
Lane 1 761 5.0 1574 0.484 100 3.6 LOS A 15.1 110.2 Full 500 0.0 0.0
Lane 2 408 0.0 735 0.556 100 24.1 LOS B 19.0 133.3 Short 125 0.0 NA
Approach 1169 3.3 0.556 10.8 LOS A 19.0 133.3
Intersection 2260 3.8 0.556 14.3 LOS A 26.6 194.4
Level of Service (LOS) Method: Delay (RTA NSW).
Lane LOS values are based on average delay per lane.
Intersection and Approach LOS values are based on average delay for all lanes.
SIDRA Standard Delay Model is used. Control Delay includes Geometric Delay.
Gap-Acceptance Capacity: SIDRA Standard (Akçelik M3D).
HV (%) values are calculated for All Movement Classes of All Heavy Vehicle Model Designation.
SIDRA INTERSECTION 6.1 | Copyright © 2000-2015 Akcelik and Associates Pty Ltd | sidrasolutions.comOrganisation: CARDNO | Processed: Friday, 13 May 2016 7:56:30 AMProject: G:\HRP16055 - Chambers Flat, Anzac Av 36-112\16055 - Analysis\SIDRA\Eastern Access Point Anzac Avenue.sip6
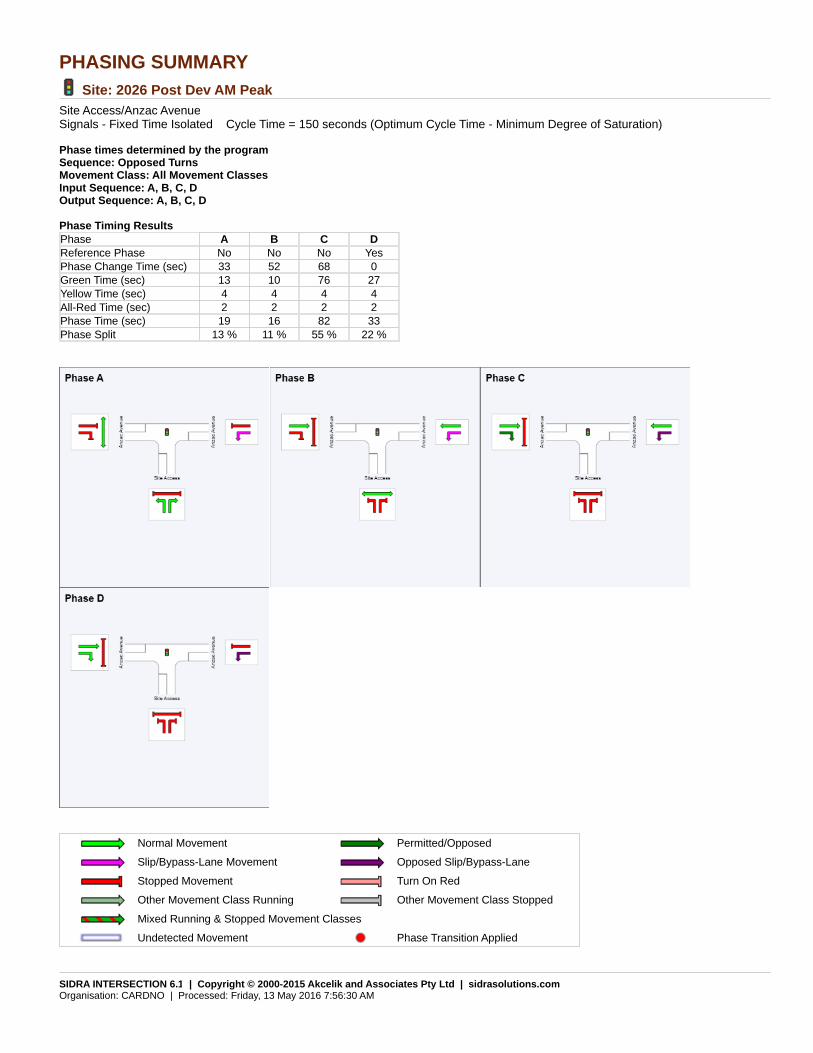
PHASING SUMMARY
Site: 2026 Post Dev AM Peak
Site Access/Anzac AvenueSignals - Fixed Time Isolated Cycle Time = 150 seconds (Optimum Cycle Time - Minimum Degree of Saturation)
Phase times determined by the programSequence: Opposed TurnsMovement Class: All Movement ClassesInput Sequence: A, B, C, DOutput Sequence: A, B, C, D
Phase Timing Results
Phase A B C D
Reference Phase No No No Yes
Phase Change Time (sec) 33 52 68 0
Green Time (sec) 13 10 76 27
Yellow Time (sec) 4 4 4 4
All-Red Time (sec) 2 2 2 2
Phase Time (sec) 19 16 82 33
Phase Split 13 % 11 % 55 % 22 %
Normal Movement Permitted/Opposed
Slip/Bypass-Lane Movement Opposed Slip/Bypass-Lane
Stopped Movement Turn On Red
Other Movement Class Running Other Movement Class Stopped
Mixed Running & Stopped Movement Classes
Undetected Movement Phase Transition Applied
SIDRA INTERSECTION 6.1 | Copyright © 2000-2015 Akcelik and Associates Pty Ltd | sidrasolutions.comOrganisation: CARDNO | Processed: Friday, 13 May 2016 7:56:30 AM

LANE SUMMARY
Site: 2026 Post Dev PM Peak
Site Access/Anzac AvenueSignals - Fixed Time Isolated Cycle Time = 150 seconds (Optimum Cycle Time - Minimum Degree of Saturation)
Lane Use and Performance
Demand Flows 95% Back of QueueCap.
Deg.Satn
LaneUtil.
AverageDelay
Level ofService
Lane Config
Lane Length
Cap.Adj.
Prob. Block.Total HV Veh Dist
veh/h % veh/h v/c % sec m m % %South: Site Access
Lane 1 16 100.0 94 0.168 100 78.0 LOS F 1.1 14.6 Full 500 0.0 0.0
Approach 16 100.0 0.168 78.0 LOS F 1.1 14.6
East: Anzac Avenue
Lane 1 437 0.0 1165 0.375 100 9.3 LOS A 7.7 53.6 Short 125 0.0 NA
Lane 2 381 5.0 667 0.571 100 41.8 LOS C 22.3 163.1 Full 500 0.0 0.0
Approach 818 2.3 0.571 24.5 LOS B 22.3 163.1
West: Anzac Avenue
Lane 1 914 5.0 1574 0.581 100 4.2 LOS A 21.0 153.2 Full 500 0.0 0.0
Lane 2 408 0.0 1079 0.378 100 18.3 LOS B 14.4 100.6 Short 125 0.0 NA
Approach 1322 3.5 0.581 8.6 LOS A 21.0 153.2
Intersection 2156 3.7 0.581 15.1 LOS B 22.3 163.1
Level of Service (LOS) Method: Delay (RTA NSW).
Lane LOS values are based on average delay per lane.
Intersection and Approach LOS values are based on average delay for all lanes.
SIDRA Standard Delay Model is used. Control Delay includes Geometric Delay.
Gap-Acceptance Capacity: SIDRA Standard (Akçelik M3D).
HV (%) values are calculated for All Movement Classes of All Heavy Vehicle Model Designation.
SIDRA INTERSECTION 6.1 | Copyright © 2000-2015 Akcelik and Associates Pty Ltd | sidrasolutions.comOrganisation: CARDNO | Processed: Friday, 13 May 2016 7:58:21 AMProject: G:\HRP16055 - Chambers Flat, Anzac Av 36-112\16055 - Analysis\SIDRA\Eastern Access Point Anzac Avenue.sip6

PHASING SUMMARY
Site: 2026 Post Dev PM Peak
Site Access/Anzac AvenueSignals - Fixed Time Isolated Cycle Time = 150 seconds (Optimum Cycle Time - Minimum Degree of Saturation)
Phase times determined by the programSequence: Opposed TurnsMovement Class: All Movement ClassesInput Sequence: A, B, C, DOutput Sequence: A, B, C, D
Phase Timing Results
Phase A B C D
Reference Phase No No No Yes
Phase Change Time (sec) 72 91 107 0
Green Time (sec) 13 10 37 66
Yellow Time (sec) 4 4 4 4
All-Red Time (sec) 2 2 2 2
Phase Time (sec) 19 16 43 72
Phase Split 13 % 11 % 29 % 48 %
Normal Movement Permitted/Opposed
Slip/Bypass-Lane Movement Opposed Slip/Bypass-Lane
Stopped Movement Turn On Red
Other Movement Class Running Other Movement Class Stopped
Mixed Running & Stopped Movement Classes
Undetected Movement Phase Transition Applied
SIDRA INTERSECTION 6.1 | Copyright © 2000-2015 Akcelik and Associates Pty Ltd | sidrasolutions.comOrganisation: CARDNO | Processed: Friday, 13 May 2016 7:58:21 AM

LANE SUMMARY
Site: 2036 Post Dev AM Peak
Site Access/Anzac AvenueSignals - Fixed Time Isolated Cycle Time = 150 seconds (Optimum Cycle Time - Minimum Degree of Saturation)
Lane Use and Performance
Demand Flows 95% Back of QueueCap.
Deg.Satn
LaneUtil.
AverageDelay
Level ofService
Lane Config
Lane Length
Cap.Adj.
Prob. Block.Total HV Veh Dist
veh/h % veh/h v/c % sec m m % %South: Site Access
Lane 1 16 100.0 94 0.168 100 78.0 LOS F 1.1 14.6 Full 500 0.0 0.0
Approach 16 100.0 0.168 78.0 LOS F 1.1 14.6
East: Anzac Avenue
Lane 1 545 0.0 786 0.694 100 30.8 LOS C 25.6 178.9 Short 125 0.0 NA
Lane 2 761 5.0 8971
0.848 100 18.6 LOS B 33.5 244.3 Full 500 0.0 0.0
Approach 1306 2.9 0.848 23.7 LOS B 33.5 244.3
West: Anzac Avenue
Lane 1 924 5.0 1574 0.587 100 4.3 LOS A 21.5 156.6 Full 500 0.0 0.0
Lane 2 509 0.0 601 0.848 100 49.2 LOS D 35.2 246.5 Short 125 0.0 NA
Approach 1434 3.2 0.848 20.3 LOS B 35.2 246.5
Intersection 2756 3.6 0.848 22.2 LOS B 35.2 246.5
Level of Service (LOS) Method: Delay (RTA NSW).
Lane LOS values are based on average delay per lane.
Intersection and Approach LOS values are based on average delay for all lanes.
SIDRA Standard Delay Model is used. Control Delay includes Geometric Delay.
Gap-Acceptance Capacity: SIDRA Standard (Akçelik M3D).
HV (%) values are calculated for All Movement Classes of All Heavy Vehicle Model Designation.
1 Reduced capacity due to a short lane effect. Short lane queues may extend into the adjacent full-length lanes. Some upstream delays at entry to short lanes are not included.
SIDRA INTERSECTION 6.1 | Copyright © 2000-2015 Akcelik and Associates Pty Ltd | sidrasolutions.comOrganisation: CARDNO | Processed: Friday, 13 May 2016 7:56:28 AMProject: G:\HRP16055 - Chambers Flat, Anzac Av 36-112\16055 - Analysis\SIDRA\Eastern Access Point Anzac Avenue.sip6

PHASING SUMMARY
Site: 2036 Post Dev AM Peak
Site Access/Anzac AvenueSignals - Fixed Time Isolated Cycle Time = 150 seconds (Optimum Cycle Time - Minimum Degree of Saturation)
Phase times determined by the programSequence: Opposed TurnsMovement Class: All Movement ClassesInput Sequence: A, B, C, DOutput Sequence: A, B, C, D
Phase Timing Results
Phase A B C D
Reference Phase No No No Yes
Phase Change Time (sec) 27 46 62 0
Green Time (sec) 13 10 82 21
Yellow Time (sec) 4 4 4 4
All-Red Time (sec) 2 2 2 2
Phase Time (sec) 19 16 88 27
Phase Split 13 % 11 % 59 % 18 %
Normal Movement Permitted/Opposed
Slip/Bypass-Lane Movement Opposed Slip/Bypass-Lane
Stopped Movement Turn On Red
Other Movement Class Running Other Movement Class Stopped
Mixed Running & Stopped Movement Classes
Undetected Movement Phase Transition Applied
SIDRA INTERSECTION 6.1 | Copyright © 2000-2015 Akcelik and Associates Pty Ltd | sidrasolutions.comOrganisation: CARDNO | Processed: Friday, 13 May 2016 7:56:28 AM
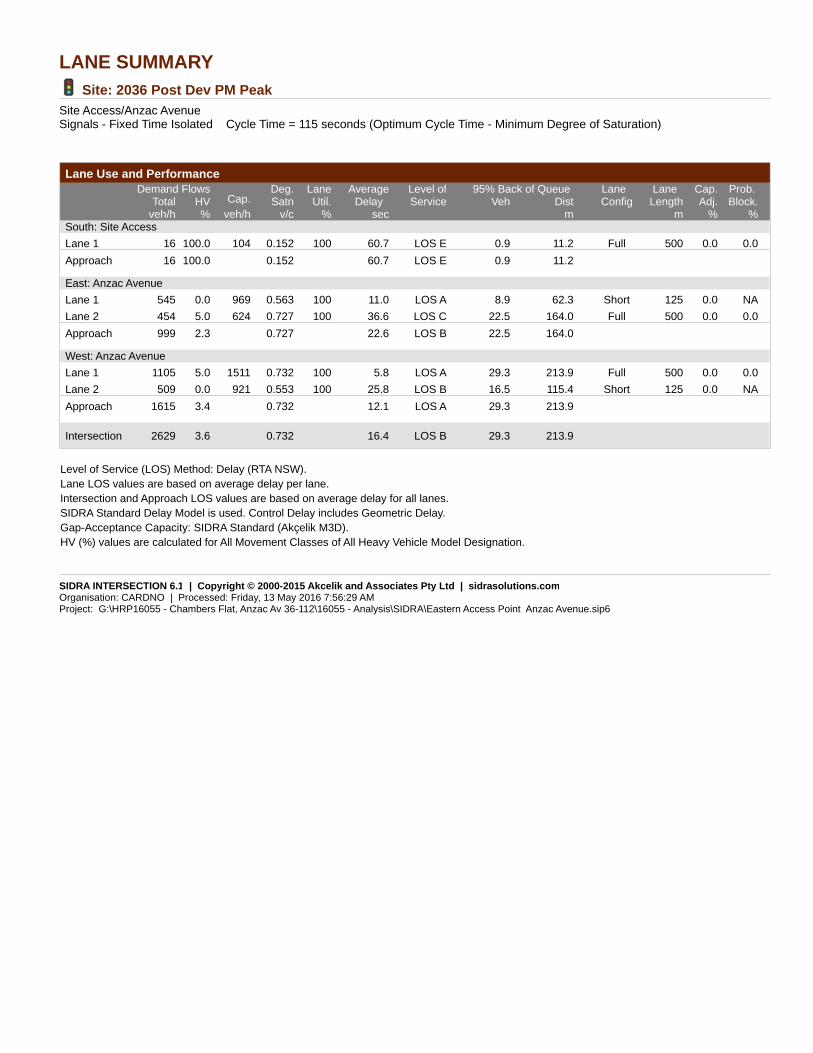
LANE SUMMARY
Site: 2036 Post Dev PM Peak
Site Access/Anzac AvenueSignals - Fixed Time Isolated Cycle Time = 115 seconds (Optimum Cycle Time - Minimum Degree of Saturation)
Lane Use and Performance
Demand Flows 95% Back of QueueCap.
Deg.Satn
LaneUtil.
AverageDelay
Level ofService
Lane Config
Lane Length
Cap.Adj.
Prob. Block.Total HV Veh Dist
veh/h % veh/h v/c % sec m m % %South: Site Access
Lane 1 16 100.0 104 0.152 100 60.7 LOS E 0.9 11.2 Full 500 0.0 0.0
Approach 16 100.0 0.152 60.7 LOS E 0.9 11.2
East: Anzac Avenue
Lane 1 545 0.0 969 0.563 100 11.0 LOS A 8.9 62.3 Short 125 0.0 NA
Lane 2 454 5.0 624 0.727 100 36.6 LOS C 22.5 164.0 Full 500 0.0 0.0
Approach 999 2.3 0.727 22.6 LOS B 22.5 164.0
West: Anzac Avenue
Lane 1 1105 5.0 1511 0.732 100 5.8 LOS A 29.3 213.9 Full 500 0.0 0.0
Lane 2 509 0.0 921 0.553 100 25.8 LOS B 16.5 115.4 Short 125 0.0 NA
Approach 1615 3.4 0.732 12.1 LOS A 29.3 213.9
Intersection 2629 3.6 0.732 16.4 LOS B 29.3 213.9
Level of Service (LOS) Method: Delay (RTA NSW).
Lane LOS values are based on average delay per lane.
Intersection and Approach LOS values are based on average delay for all lanes.
SIDRA Standard Delay Model is used. Control Delay includes Geometric Delay.
Gap-Acceptance Capacity: SIDRA Standard (Akçelik M3D).
HV (%) values are calculated for All Movement Classes of All Heavy Vehicle Model Designation.
SIDRA INTERSECTION 6.1 | Copyright © 2000-2015 Akcelik and Associates Pty Ltd | sidrasolutions.comOrganisation: CARDNO | Processed: Friday, 13 May 2016 7:56:29 AMProject: G:\HRP16055 - Chambers Flat, Anzac Av 36-112\16055 - Analysis\SIDRA\Eastern Access Point Anzac Avenue.sip6

PHASING SUMMARY
Site: 2036 Post Dev PM Peak
Site Access/Anzac AvenueSignals - Fixed Time Isolated Cycle Time = 115 seconds (Optimum Cycle Time - Minimum Degree of Saturation)
Phase times determined by the programSequence: Opposed TurnsMovement Class: All Movement ClassesInput Sequence: A, B, C, DOutput Sequence: A, B, C, D
Phase Timing Results
Phase A B C D
Reference Phase No No No Yes
Phase Change Time (sec) 54 71 86 0
Green Time (sec) 11 9 23 48
Yellow Time (sec) 4 4 4 4
All-Red Time (sec) 2 2 2 2
Phase Time (sec) 17 15 29 54
Phase Split 15 % 13 % 25 % 47 %
Normal Movement Permitted/Opposed
Slip/Bypass-Lane Movement Opposed Slip/Bypass-Lane
Stopped Movement Turn On Red
Other Movement Class Running Other Movement Class Stopped
Mixed Running & Stopped Movement Classes
Undetected Movement Phase Transition Applied
SIDRA INTERSECTION 6.1 | Copyright © 2000-2015 Akcelik and Associates Pty Ltd | sidrasolutions.comOrganisation: CARDNO | Processed: Friday, 13 May 2016 7:56:29 AM

LANE SUMMARY
Site: 2026 Post Dev AM Peak
Site Access/Anzac AvenueSignals - Fixed Time Isolated Cycle Time = 110 seconds (Optimum Cycle Time - Minimum Degree of Saturation)
Lane Use and Performance
Demand Flows 95% Back of QueueCap.
Deg.Satn
LaneUtil.
AverageDelay
Level ofService
Lane Config
Lane Length
Cap.Adj.
Prob. Block.Total HV Veh Dist
veh/h % veh/h v/c % sec m m % %South: Site Access
Lane 1 408 0.0 1109 0.368 100 13.4 LOS A 10.0 70.1 Short 100 0.0 NA
Lane 2 437 0.0 625 0.699 100 39.7 LOS C 20.4 142.8 Full 500 0.0 0.0
Approach 845 0.0 0.699 27.0 LOS B 20.4 142.8
East: Anzac Avenue
Lane 1 108 7.8 1498 0.072 100 6.7 LOS A 0.7 5.4 Short 100 0.0 NA
Lane 2 538 5.0 773 0.696 100 28.8 LOS C 23.8 173.5 Full 500 0.0 0.0
Approach 646 5.5 0.696 25.1 LOS B 23.8 173.5
West: Anzac Avenue
Lane 1 733 5.0 1047 0.700 100 19.0 LOS B 28.3 206.6 Full 500 0.0 0.0
Lane 2 101 7.3 160 0.630 100 60.8 LOS E 5.6 41.4 Short 150 0.0 NA
Approach 834 5.3 0.700 24.1 LOS B 28.3 206.6
Intersection 2325 3.4 0.700 25.4 LOS B 28.3 206.6
Level of Service (LOS) Method: Delay (RTA NSW).
Lane LOS values are based on average delay per lane.
Intersection and Approach LOS values are based on average delay for all lanes.
SIDRA Standard Delay Model is used. Control Delay includes Geometric Delay.
Gap-Acceptance Capacity: SIDRA Standard (Akçelik M3D).
HV (%) values are calculated for All Movement Classes of All Heavy Vehicle Model Designation.
SIDRA INTERSECTION 6.1 | Copyright © 2000-2015 Akcelik and Associates Pty Ltd | sidrasolutions.comOrganisation: CARDNO | Processed: Friday, 13 May 2016 8:16:06 AMProject: G:\HRP16055 - Chambers Flat, Anzac Av 36-112\16055 - Analysis\SIDRA\Western Access Point Anzac Avenue.sip6

PHASING SUMMARY
Site: 2026 Post Dev AM Peak
Site Access/Anzac AvenueSignals - Fixed Time Isolated Cycle Time = 110 seconds (Optimum Cycle Time - Minimum Degree of Saturation)
Phase times determined by the programSequence: Opposed TurnsMovement Class: All Movement ClassesInput Sequence: A, B, COutput Sequence: A, B, C
Phase Timing Results
Phase A B C
Reference Phase No No Yes
Phase Change Time (sec) 51 94 0
Green Time (sec) 37 10 45
Yellow Time (sec) 4 4 4
All-Red Time (sec) 2 2 2
Phase Time (sec) 43 16 51
Phase Split 39 % 15 % 46 %
Normal Movement Permitted/Opposed
Slip/Bypass-Lane Movement Opposed Slip/Bypass-Lane
Stopped Movement Turn On Red
Other Movement Class Running Other Movement Class Stopped
Mixed Running & Stopped Movement Classes
Undetected Movement Phase Transition Applied
SIDRA INTERSECTION 6.1 | Copyright © 2000-2015 Akcelik and Associates Pty Ltd | sidrasolutions.comOrganisation: CARDNO | Processed: Friday, 13 May 2016 8:16:06 AMProject: G:\HRP16055 - Chambers Flat, Anzac Av 36-112\16055 - Analysis\SIDRA\Western Access Point Anzac Avenue.sip6

LANE SUMMARY
Site: 2026 Post Dev PM Peak
Site Access/Anzac AvenueSignals - Fixed Time Isolated Cycle Time = 110 seconds (Optimum Cycle Time - Minimum Degree of Saturation)
Lane Use and Performance
Demand Flows 95% Back of QueueCap.
Deg.Satn
LaneUtil.
AverageDelay
Level ofService
Lane Config
Lane Length
Cap.Adj.
Prob. Block.Total HV Veh Dist
veh/h % veh/h v/c % sec m m % %South: Site Access
Lane 1 445 0.0 1203 0.370 100 9.3 LOS A 7.3 51.2 Short 100 0.0 NA
Lane 2 477 0.0 608 0.785 100 44.0 LOS D 24.2 169.7 Full 500 0.0 0.0
Approach 922 0.0 0.785 27.2 LOS B 24.2 169.7
East: Anzac Avenue
Lane 1 8 100.0 990 0.009 100 6.5 LOS A 0.0 0.3 Short 100 0.0 NA
Lane 2 381 5.0 858 0.444 100 21.9 LOS B 13.8 101.1 Full 500 0.0 0.0
Approach 389 7.1 0.444 21.5 LOS B 13.8 101.1
West: Anzac Avenue
Lane 1 845 5.0 1064 0.794 100 20.2 LOS B 35.4 258.8 Full 500 0.0 0.0
Lane 2 7 100.0 59 0.125 100 64.5 LOS E 0.4 5.4 Short 150 0.0 NA
Approach 853 5.8 0.794 20.6 LOS B 35.4 258.8
Intersection 2164 3.6 0.794 23.6 LOS B 35.4 258.8
Level of Service (LOS) Method: Delay (RTA NSW).
Lane LOS values are based on average delay per lane.
Intersection and Approach LOS values are based on average delay for all lanes.
SIDRA Standard Delay Model is used. Control Delay includes Geometric Delay.
Gap-Acceptance Capacity: SIDRA Standard (Akçelik M3D).
HV (%) values are calculated for All Movement Classes of All Heavy Vehicle Model Designation.
SIDRA INTERSECTION 6.1 | Copyright © 2000-2015 Akcelik and Associates Pty Ltd | sidrasolutions.comOrganisation: CARDNO | Processed: Friday, 13 May 2016 8:16:07 AMProject: G:\HRP16055 - Chambers Flat, Anzac Av 36-112\16055 - Analysis\SIDRA\Western Access Point Anzac Avenue.sip6

PHASING SUMMARY
Site: 2026 Post Dev PM Peak
Site Access/Anzac AvenueSignals - Fixed Time Isolated Cycle Time = 110 seconds (Optimum Cycle Time - Minimum Degree of Saturation)
Phase times determined by the programSequence: Opposed TurnsMovement Class: All Movement ClassesInput Sequence: A, B, COutput Sequence: A, B, C
Phase Timing Results
Phase A B C
Reference Phase No No Yes
Phase Change Time (sec) 56 98 0
Green Time (sec) 36 6 50
Yellow Time (sec) 4 4 4
All-Red Time (sec) 2 2 2
Phase Time (sec) 42 12 56
Phase Split 38 % 11 % 51 %
Normal Movement Permitted/Opposed
Slip/Bypass-Lane Movement Opposed Slip/Bypass-Lane
Stopped Movement Turn On Red
Other Movement Class Running Other Movement Class Stopped
Mixed Running & Stopped Movement Classes
Undetected Movement Phase Transition Applied
SIDRA INTERSECTION 6.1 | Copyright © 2000-2015 Akcelik and Associates Pty Ltd | sidrasolutions.comOrganisation: CARDNO | Processed: Friday, 13 May 2016 8:16:07 AMProject: G:\HRP16055 - Chambers Flat, Anzac Av 36-112\16055 - Analysis\SIDRA\Western Access Point Anzac Avenue.sip6
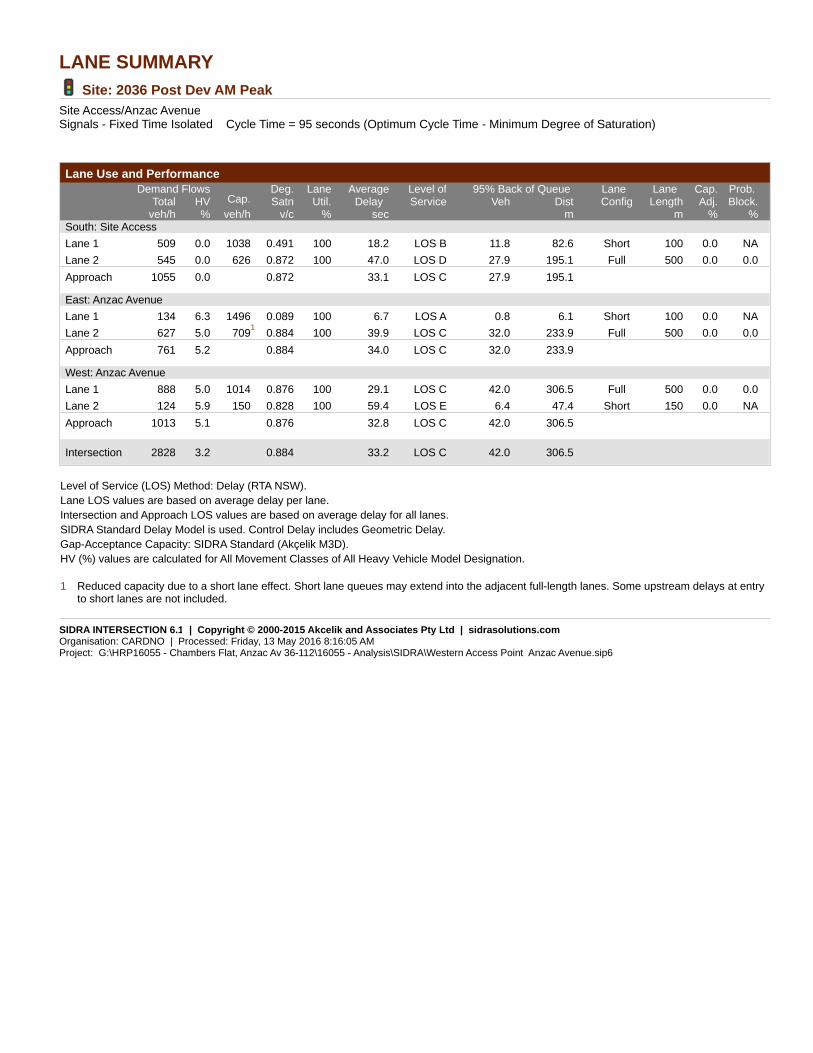
LANE SUMMARY
Site: 2036 Post Dev AM Peak
Site Access/Anzac AvenueSignals - Fixed Time Isolated Cycle Time = 95 seconds (Optimum Cycle Time - Minimum Degree of Saturation)
Lane Use and Performance
Demand Flows 95% Back of QueueCap.
Deg.Satn
LaneUtil.
AverageDelay
Level ofService
Lane Config
Lane Length
Cap.Adj.
Prob. Block.Total HV Veh Dist
veh/h % veh/h v/c % sec m m % %South: Site Access
Lane 1 509 0.0 1038 0.491 100 18.2 LOS B 11.8 82.6 Short 100 0.0 NA
Lane 2 545 0.0 626 0.872 100 47.0 LOS D 27.9 195.1 Full 500 0.0 0.0
Approach 1055 0.0 0.872 33.1 LOS C 27.9 195.1
East: Anzac Avenue
Lane 1 134 6.3 1496 0.089 100 6.7 LOS A 0.8 6.1 Short 100 0.0 NA
Lane 2 627 5.0 7091
0.884 100 39.9 LOS C 32.0 233.9 Full 500 0.0 0.0
Approach 761 5.2 0.884 34.0 LOS C 32.0 233.9
West: Anzac Avenue
Lane 1 888 5.0 1014 0.876 100 29.1 LOS C 42.0 306.5 Full 500 0.0 0.0
Lane 2 124 5.9 150 0.828 100 59.4 LOS E 6.4 47.4 Short 150 0.0 NA
Approach 1013 5.1 0.876 32.8 LOS C 42.0 306.5
Intersection 2828 3.2 0.884 33.2 LOS C 42.0 306.5
Level of Service (LOS) Method: Delay (RTA NSW).
Lane LOS values are based on average delay per lane.
Intersection and Approach LOS values are based on average delay for all lanes.
SIDRA Standard Delay Model is used. Control Delay includes Geometric Delay.
Gap-Acceptance Capacity: SIDRA Standard (Akçelik M3D).
HV (%) values are calculated for All Movement Classes of All Heavy Vehicle Model Designation.
1 Reduced capacity due to a short lane effect. Short lane queues may extend into the adjacent full-length lanes. Some upstream delays at entry to short lanes are not included.
SIDRA INTERSECTION 6.1 | Copyright © 2000-2015 Akcelik and Associates Pty Ltd | sidrasolutions.comOrganisation: CARDNO | Processed: Friday, 13 May 2016 8:16:05 AMProject: G:\HRP16055 - Chambers Flat, Anzac Av 36-112\16055 - Analysis\SIDRA\Western Access Point Anzac Avenue.sip6

PHASING SUMMARY
Site: 2036 Post Dev AM Peak
Site Access/Anzac AvenueSignals - Fixed Time Isolated Cycle Time = 95 seconds (Optimum Cycle Time - Minimum Degree of Saturation)
Phase times determined by the programSequence: Opposed TurnsMovement Class: All Movement ClassesInput Sequence: A, B, COutput Sequence: A, B, C
Phase Timing Results
Phase A B C
Reference Phase No No Yes
Phase Change Time (sec) 43 81 0
Green Time (sec) 32 8 37
Yellow Time (sec) 4 4 4
All-Red Time (sec) 2 2 2
Phase Time (sec) 38 14 43
Phase Split 40 % 15 % 45 %
Normal Movement Permitted/Opposed
Slip/Bypass-Lane Movement Opposed Slip/Bypass-Lane
Stopped Movement Turn On Red
Other Movement Class Running Other Movement Class Stopped
Mixed Running & Stopped Movement Classes
Undetected Movement Phase Transition Applied
SIDRA INTERSECTION 6.1 | Copyright © 2000-2015 Akcelik and Associates Pty Ltd | sidrasolutions.comOrganisation: CARDNO | Processed: Friday, 13 May 2016 8:16:05 AMProject: G:\HRP16055 - Chambers Flat, Anzac Av 36-112\16055 - Analysis\SIDRA\Western Access Point Anzac Avenue.sip6

LANE SUMMARY
Site: 2036 Post Dev PM Peak
Site Access/Anzac AvenueSignals - Fixed Time Isolated Cycle Time = 90 seconds (Optimum Cycle Time - Minimum Degree of Saturation)
Lane Use and Performance
Demand Flows 95% Back of QueueCap.
Deg.Satn
LaneUtil.
AverageDelay
Level ofService
Lane Config
Lane Length
Cap.Adj.
Prob. Block.Total HV Veh Dist
veh/h % veh/h v/c % sec m m % %South: Site Access
Lane 1 557 0.0 1167 0.477 100 11.7 LOS A 11.3 79.2 Short 100 0.0 NA
Lane 2 596 0.0 681 0.875 100 44.1 LOS D 29.1 203.5 Full 500 0.0 0.0
Approach 1153 0.0 0.875 28.5 LOS B 29.1 203.5
East: Anzac Avenue
Lane 1 8 100.0 970 0.009 100 6.6 LOS A 0.0 0.3 Short 100 0.0 NA
Lane 2 445 5.0 692 0.643 100 25.6 LOS B 16.3 119.0 Full 500 0.0 0.0
Approach 454 6.8 0.643 25.2 LOS B 16.3 119.0
West: Anzac Avenue
Lane 1 845 5.0 944 0.895 100 34.0 LOS C 41.4 302.5 Full 500 0.0 0.0
Lane 2 7 100.0 72 0.102 100 52.7 LOS D 0.3 4.3 Short 150 0.0 NA
Approach 853 5.8 0.895 34.2 LOS C 41.4 302.5
Intersection 2459 3.3 0.895 29.9 LOS C 41.4 302.5
Level of Service (LOS) Method: Delay (RTA NSW).
Lane LOS values are based on average delay per lane.
Intersection and Approach LOS values are based on average delay for all lanes.
SIDRA Standard Delay Model is used. Control Delay includes Geometric Delay.
Gap-Acceptance Capacity: SIDRA Standard (Akçelik M3D).
HV (%) values are calculated for All Movement Classes of All Heavy Vehicle Model Designation.
SIDRA INTERSECTION 6.1 | Copyright © 2000-2015 Akcelik and Associates Pty Ltd | sidrasolutions.comOrganisation: CARDNO | Processed: Friday, 13 May 2016 8:16:05 AMProject: G:\HRP16055 - Chambers Flat, Anzac Av 36-112\16055 - Analysis\SIDRA\Western Access Point Anzac Avenue.sip6

PHASING SUMMARY
Site: 2036 Post Dev PM Peak
Site Access/Anzac AvenueSignals - Fixed Time Isolated Cycle Time = 90 seconds (Optimum Cycle Time - Minimum Degree of Saturation)
Phase times determined by the programSequence: Opposed TurnsMovement Class: All Movement ClassesInput Sequence: A, B, COutput Sequence: A, B, C
Phase Timing Results
Phase A B C
Reference Phase No No Yes
Phase Change Time (sec) 39 78 0
Green Time (sec) 33 6 33
Yellow Time (sec) 4 4 4
All-Red Time (sec) 2 2 2
Phase Time (sec) 39 12 39
Phase Split 43 % 13 % 43 %
Normal Movement Permitted/Opposed
Slip/Bypass-Lane Movement Opposed Slip/Bypass-Lane
Stopped Movement Turn On Red
Other Movement Class Running Other Movement Class Stopped
Mixed Running & Stopped Movement Classes
Undetected Movement Phase Transition Applied
SIDRA INTERSECTION 6.1 | Copyright © 2000-2015 Akcelik and Associates Pty Ltd | sidrasolutions.comOrganisation: CARDNO | Processed: Friday, 13 May 2016 8:16:05 AMProject: G:\HRP16055 - Chambers Flat, Anzac Av 36-112\16055 - Analysis\SIDRA\Western Access Point Anzac Avenue.sip6