Embed Size (px)
Citation preview

King Saud University
College of Engineering
IE – 341: “Human Factors”
Fall – 2015 (1st Sem. 1436-7H)Human Capabilities
Part – C. Vision (Chapter 4)Prepared by: Ahmed M. El-Sherbeeny, PhD
1

Lesson Overview: Vision• Process of Seeing (Vision)• Visual Capabilities
o Accommodationo Visual Acuityo Convergenceo Color Discriminationo Dark Adaptationo Perception
• Factors Affecting Visual Discriminationo Luminance Levelo Contrasto Exposure Timeo Target Motiono Ageo Training
2

Cont. Lesson Overview: Vision• Alphanumeric Displays
o Characteristicso Typographyo Typography Features
• Hardcopy• Visual Display Terminals (VDT)
• Graphic Representations• Symbols• Codes
3
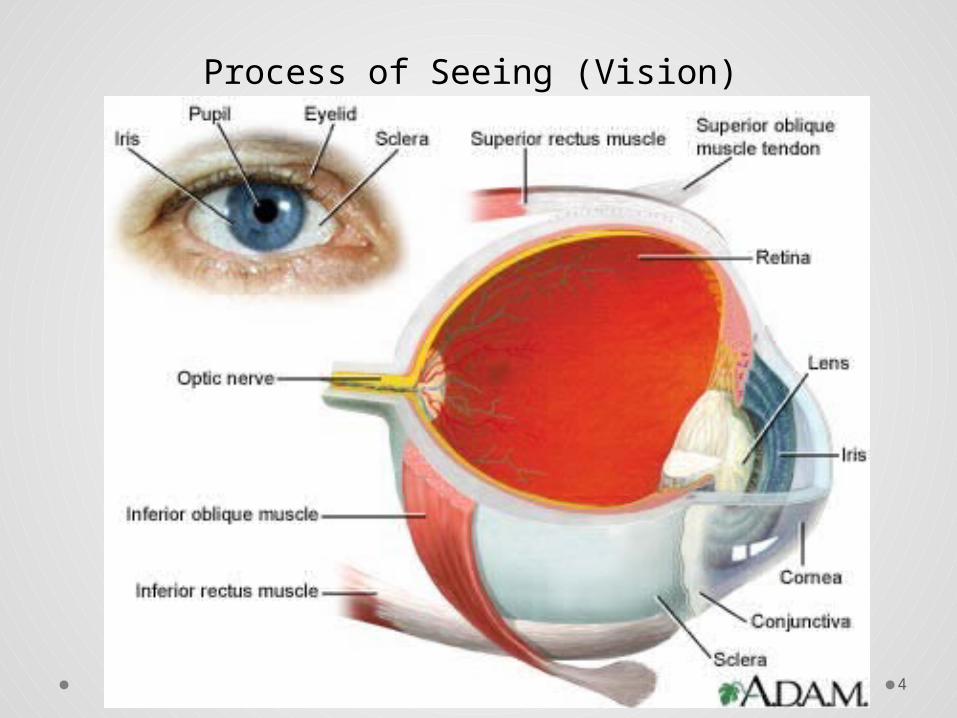
Process of Seeing (Vision)
4
5

Process of Seeing (Vision)• The human eye works like a camera.• Light rays reflected from object
o enter the transparent cornea o pass through
• clear fluid (aqueous humor) that fills the space between the cornea
• and the pupil (a circular variable aperture)• and adjustable lens behind the cornea (light rays are transmitted
and focused)o Close objects: lens bulgeso Distant objects: lens relaxes (flattens)
• Muscles of the iris change size of pupil:o larger in the dark, (about 8 mm diameter; dilation)o smaller in bright conditions (2 mm; constriction)
6

Cont. Process of Seeing (Vision)• Light rays transmitted through pupil to lens
o refracted by adjustable lenso then transverse the vitreous humor (a clear jellylike fluid filling the
eyeball, behind the lens).
• In normal or corrected vision personso light rays are focused exactly on the sensitive retina
• The retina consists ofo about 6 to 7 million cones
• receive daytime, color vision• concentrated near center of
retina (fovea)o and about 130 million rods
• rods important in dim light, night.• distributed in the outer retina,
around the sides of the eyeball.
7

Cont. Process of Seeing (Vision)• Greatest sensitivity is in the fovea
o the “dead center” of the retinao For clear vision, the eye must be directed so that the image of the
object is focused on the fovea.
• The image on the retina is inverted.• Cones and rods connected to optic nerve
o Transmits neural impulses to the brain which integrates impulses, giving visual impression of object
o process also corrects inverted image on the retina.
8

Visual Capabilities: 1.
Accommodation• Accommodation: ability of the lens to focus light
rays on the retina• Near point: closest distance possible for focus
(i.e. any closer will be blurry)• Far point: farthest dist. for focus (usu. = ∞)• Diopter: measure of focus (for eye, camera)
o Diopter [D] = 1 / target distanceo e.g. 1 D = 1 m; 2 D = 0.5 m; 3 D = 0.33 m; 0 D =∞o More powerful lens ⇒ higher diopters
• Dark focus: eye accommod. in dark (=1D)• Nearsightedness (myopia):far point: too close;
i.e. lens remains bulged with far objects• Farsightedness: near point: too far (i.e. can’t
see close objects); lens: flat for close objects
9
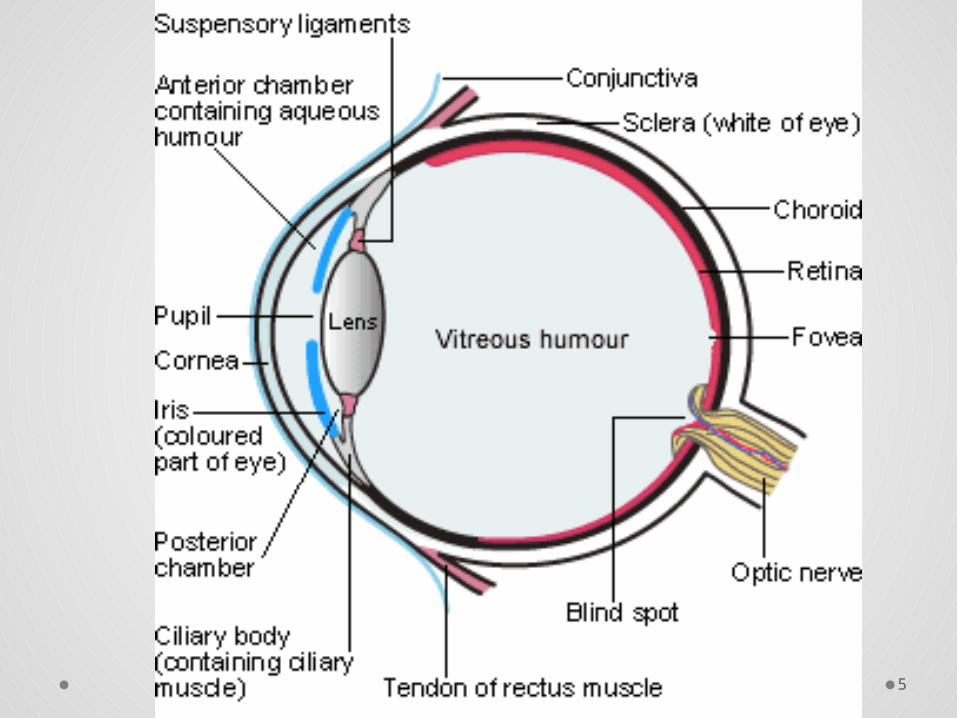
Visual Capabilities: 2. Visual Acuity• Visual Acuity:
o ability of eye to discriminate fine detailso depends largely on accommodation
• Minimum separable acuity:o most common measure of VAo Defn: smallest feature or space between the parts of a target (e.g.
letter ‘E’ below) that eye can detect
• Visual angle: (<10º):o H = stimulus heighto D = dist. from eyeo H,D: same unitso Normal VA = 1 min.o Note, 1º = 60 min.
10
D
H3438 (minutes)VA
Visual Capabilities: 2. Visual Acuity• Cont. Visual angle (VA):
o reciprocal of VA (for smallest detail that eye can see) is used as measure for visual acuity
o i.e. Visual Acuity = [1 / VA]• e.g. VA = 1.5 min. ⇒ Acuity = 0.67• e.g. VA = 0.8 min. ⇒ Acuity = 1.25• Note, as acuity ↑ ⇒ detail that can be resolved is ↓
o Clinical testing: D = 20 ft (i.e. 6 m) from chart• e.g. Snellen acuity: 20/30 (6/9) ⇒ person barely reads @ 20 ft
what normal (20/20, 6/6) person reads @ 30 ft• e.g. 20/10 ⇒ person reads @ 20 ft what normal person must bring
to 10 ft to read (far- or near-sightedness?)• e.g. 20/20 ⇒ resolving 1 min. arc of detail @ 20 ft (normal vision)• e.g. Given VA = 1.75 min. ⇒ Snellen Acuity = 20 / x
i.e. x = (20) (1.75) = 35 ⇒ Snellen Acuity = 20 / 35
11

Visual Capabilities: 2. Visual Acuity• Other types of visual acuity measures:
o Vernier acuity: ability to differentiate the lateral displacement of one line from anotherMinimum perceptible acuity: ability to detect a spot from its backgroundStereoscopic acuity: ability to differentiate different images received by the retinas of the two eyes of a single object with depth (i.e. converting 2D → 3D).• Most difference is when the object is near the eyes.• Try the following game to see if you have Stereo vision
o Center your nose over the brown eye and focus on the eye o Put a free thumb in front of your noseo Continue to focus on the eyeo If both eyes are on, you see two thumbs framing one eye. o Now, switch your focus to your thumbo You should see two eyes framing one thumbo Source: http://www.vision3d.com/frame.html
12

Visual Capabilities: 3. Convergence• Two eyes must converge on an object ⇒
o images of the object on the two retinas are in corresponding positions to get the impression of a single object (the images are fused).
• Convergence is controlled by muscles surrounding the eyeball.o Some individuals converge too mucho others tend not to converge enougho These two conditions are called phoriaso This cause double images which are visually uncomfortable and may
cause muscular stresses and strains
• Orthoptics:o aims to strengthen eye muscles to correct common eye problems (e.g.
convergence insufficiency)
13

Visual Capabilities: 4. Color
Discrimination• Cones
o Located in fovea (center of retina)o basis for color discriminationo 3 types of cones, each sensitive to light wavelengths corresponding to
primary colors:Red, Green, Blue
o In dark: cones not activated ⇒ no color is visible
• Color vision:o Trichromats: people distinguishing different colorso Color deficiency (color blind):
• Monochromats (v. v. rare): non-color vision• Dichromats: deficiency in red or green cones
o Inherted or acquired (e.g. accident or disease)o Existent in ~ 8% males and 0.5% femaleso Poorer performance in practical tasks vs. trichromats
(e.g. traffic signals)
14
Visual Capabilities: 4. Color
Discrimination
15
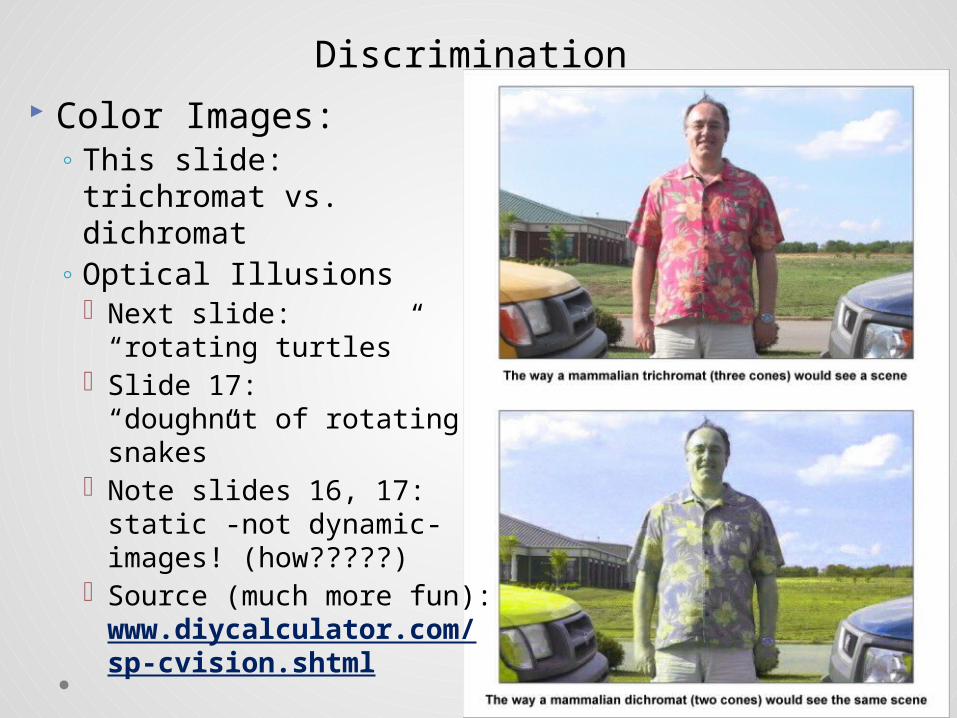
Color Images:◦ This slide:
trichromat vs.dichromat
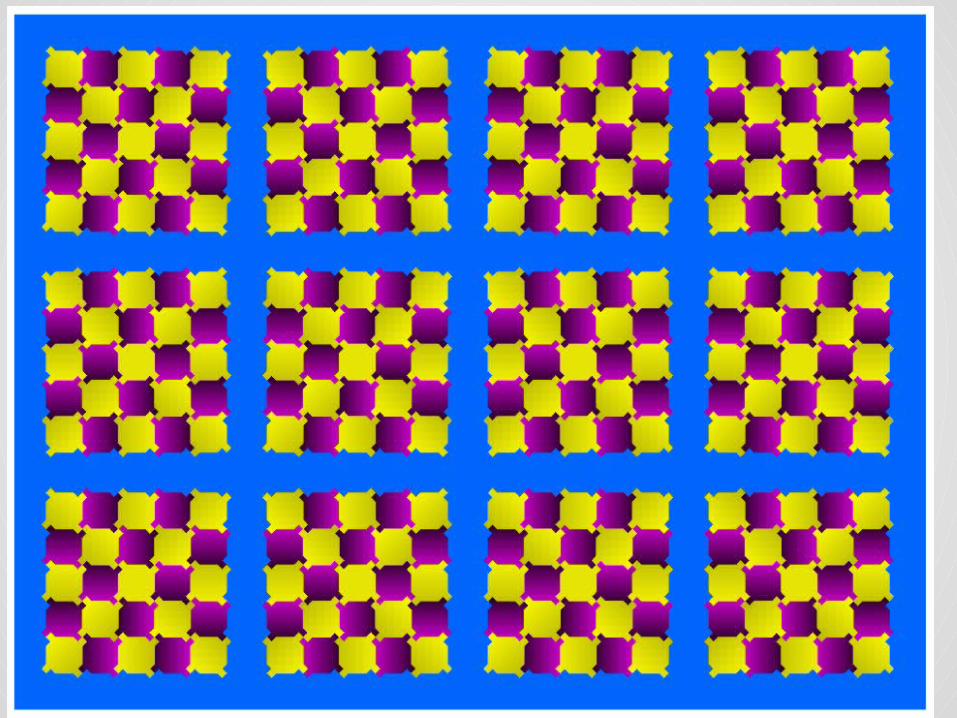
◦ Optical Illusions Next slide:
“rotating turtles” Slide 17:
“doughnut of rotatingsnakes”
Note slides 16, 17:static -not dynamic-images! (how?????)
Source (much more fun):www.diycalculator.com/sp-cvision.shtml
Visual Capabilities: 4. Color
Discrimination
16

17
Visual Capabilities: 5. Adaptation• Adaptation: changes in sensitivity to light• Entering dark room:
o This is dark adaptationo Pupil increases in size ⇒ more light enter eyeso Sensitivity of eye ↑ gradually (up to 30-35 mins.)o Cones lose most sensitivity in dark (mostly rods)
• Exiting dark room to lighto This is light adaptationo Pupil contracts to limit light entering eyeso Adaptation requires about 1 min. (why faster?)o More light ⇒ cones are activated
18

Visual Capabilities: 6. Perception• When viewing visual displays
o Displayed features and information may not be enough to make appropriate decisions
o Meaning of displayed information must also be understood
• Perception: interpreting sensed information• The interpretation process
o sometimes straightforwardo most displays: depends on previous learning (experience or training)
• Visual displays design must meet 2 objectiveso display must be seen clearlyo design must help viewer to correctly perceive/understand meaning of
display
19

Factors Affecting Visual
Discrimination• Visual discrimination depends mostly on visual
acuity.• Some factors external to the individual affect
visual discrimination:1. Luminance Level:
o As light or background light levels ↑o ⇒ cones are activated ⇒ visual acuity ↑o This is required for complex, intricate tasks
2. Contrast (AKA brightness contrast):o Refers to difference in luminance of viewed objectso Most important consideration: difference in luminance between: object
(target) and backgroundo When contrast is low, target must be larger to be equally discriminable
to target with greater contrast
20
Cont. Factors Affecting Vis.
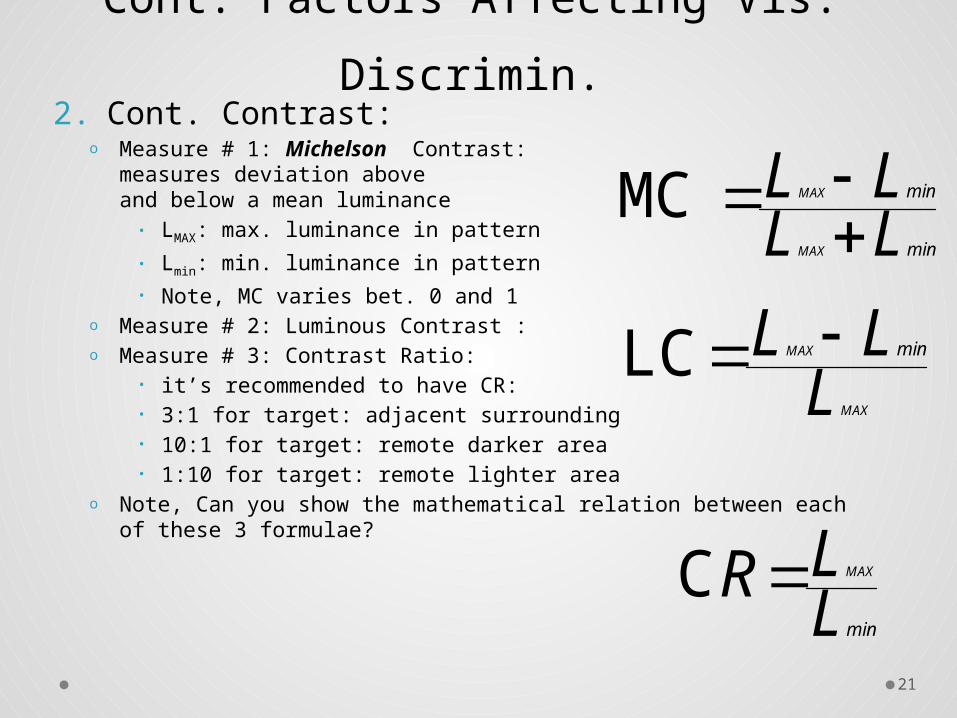
Discrimin.2. Cont. Contrast:
o Measure # 1: Michelson Contrast:measures deviation aboveand below a mean luminance• LMAX: max. luminance in pattern
• Lmin: min. luminance in pattern• Note, MC varies bet. 0 and 1
o Measure # 2: Luminous Contrast : o Measure # 3: Contrast Ratio:
• it’s recommended to have CR:• 3:1 for target: adjacent surrounding• 10:1 for target: remote darker area• 1:10 for target: remote lighter area
o Note, Can you show the mathematical relation between each of these 3 formulae?
21
min
min
LLLL
MAX
MAX
MC
MAX
MAX
LLL minLC
minLLR MAXC
Cont. Factors Affecting Vis.
Discrimin.3. Exposure Time:
o Under high illumination• As exposure time ↑ ⇒ Acuity ↑ for first 100-200 ms.• After that acuity levels off
4. Target Motion: o Acuity ↓ with motion of:
• Target• Observer• or Both
o Dynamic visual acuity:• Ability to make visual discriminations under such conditions (e.g.
driver looking at objects on sidewalk)• This acuity rapidly ↓ as rate of motion ↑
22

Cont. Factors Affecting Vis.
Discrimin.5. Age:
o Visual acuity, contrast sensitivity (ability to see details at low contrast levels) ↓ with age
o Decline starts at age 40o At age 75: acuity = 20/30o ⇒ visual displays for old people must provide:
• Large targets• Adequate illumination
6. Training: o Besides contacts, glasses, eye surgery, vision can be improved by:o Training to improve focus
• Improves Snellen acuity by 14%• Improves contrast sensitivity by 32%
o Dynamic visual acuity can be improved with practice
23
Alphanumeric DisplaysMost important characteristics:• Visibility:
o quality of the character that makes it separately visible from its surroundings (i.e. detectability)
• Legibility:o attribute that makes a character identifiable from others (i.e.
discriminability)o depends on stroke width, form of characters, contrast, and
illumination
• Readability o ability to recognize information content of material when represented
by alphanumeric characters, words, sentences (i.e. meaningfulness)o depends more on spacing between lines and letters, etc. than on
specific features of characters
24

Alphanumeric Displays: Typography• Typography≡ various features of
alphanumeric displays• Circumstances when it is important to use
preferred forms of typography:o Viewing conditions are unfavorable
(e.g. low illumination, limited viewing time)o Information is important/critical
(e.g. emergency labels, important instructions)o Viewing occurs at a distanceo Displays for low vision people
• Note, above forms must still satisfy all conditions mentioned in last slide
• When faced with ≥ 1 of these conditions, typography features must be considered: 25

A-N Displays: Typography FeaturesA. Hardcopy
1. Stroke Width2. Width-height Ratio3. Styles of Type4. Size of Characters
a) at Reading Distanceb) at a Distance
5. Layout of Characters
B. VDT Screens6. Illuminated Alphanumeric Characters7. Character Distance and Size
26

A-N Displays: 1. Stroke Width• Stroke-Width-to-height-ratio ≡ ratio of
the thickness of the stroke (s) to the height (h) of the letter/number(stroke ratio for short)
• Example (right):o Stroke width-to-height:1:5 = 0.2o Note, width-to-height: 3:5 = 0.6
• Stroke Width is affected by:o Background• black on white or• white on black
o Illumination
27
A-N Displays: 1. Stroke Width (Cont.)• Irradiation:o causes white features on a black background
to appear to ‘spread’ into adjacent dark areaso But reverse (black on white) isn’t true (no
spread)o Thus, black-on-white letters should be thicker i.e.
lower ratios than white-on-black letterso With good illumination, stroke width ratios:• Black on white: 1:6 to 1:8• White on black: 1:8 to 1:10
o With reduced illumination:• Thick letters become more readable (both types
above)• Letters should be: boldface with low stroke ratios (e.g. 1:5)
o For highly luminous letters, ratios: 1:12 to 1:20.o For black letters on a very highly luminous
background, very thick strokes are needed
28

A-N Displays: 1. Stroke Width (Cont.)
29
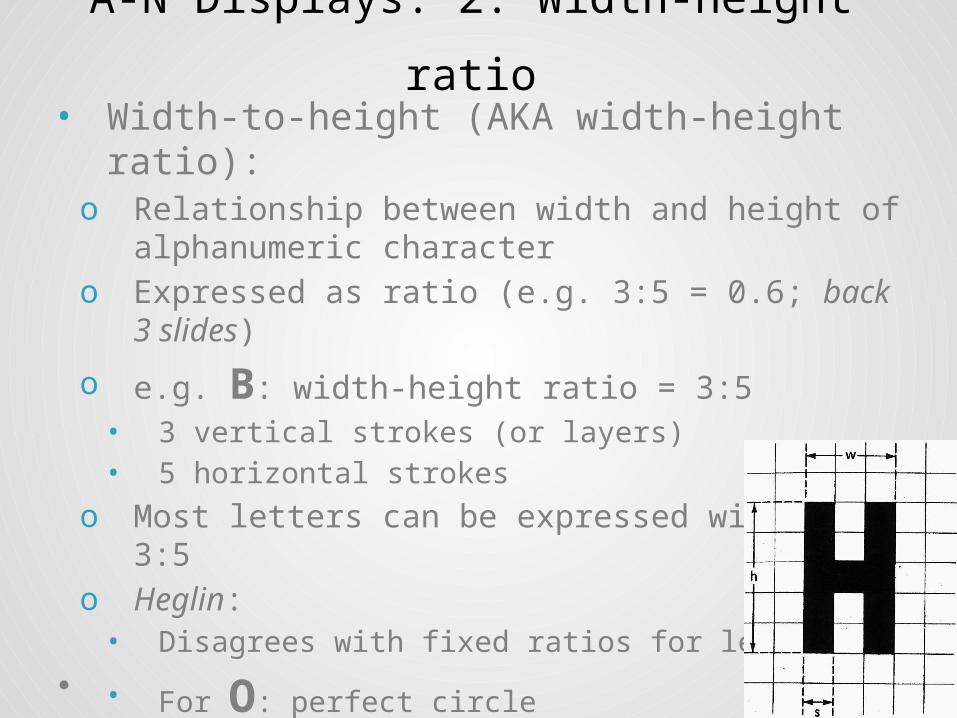
A-N Displays: 2. Width-height ratio• Width-to-height (AKA width-height ratio):o Relationship between width and height of
alphanumeric charactero Expressed as ratio (e.g. 3:5 = 0.6; back 3
slides)
o e.g. B: width-height ratio = 3:5• 3 vertical strokes (or layers)• 5 horizontal strokes
o Most letters can be expressed with ratio 3:5o Heglin:• Disagrees with fixed ratios for letters:
• For O: perfect circle
• For A and V: equilateral triangles 30

A-N Displays: 2. Width-height Cont.• Cont. width-height ratioo 3:5 satisfactory for most purposeso wider letters: appropriate certain
circumstances:• e.g. engraved legends• such cases 1:1 ratios are more appropriate• Below: letters: 1:1 (except?); numbers: 3:5
(except?)
31

A-N Displays: 3. Styles of Type• Styles (AKA typefaces, fonts of type)o > 30,000 exist!o 4 major classes (each including many types)
I. Roman: most common class;letters have serifs (little flourishes, embellishments)
II. Sans serif (AKA Gothic): uniform stroke width;
III. Script: simulate modern handwriting. (eg wedding cards)
IV. Block Letter: resembles German manuscript handwriting used in the fifteenth century (above)
• Roman: most used styles for conventional text• Italics: emphasis, titles, names, special words, etc• Boldface: headings, labels, special emphasis,
legibility in poor reading conditions• Last slide: style used for military (non-standard) 32
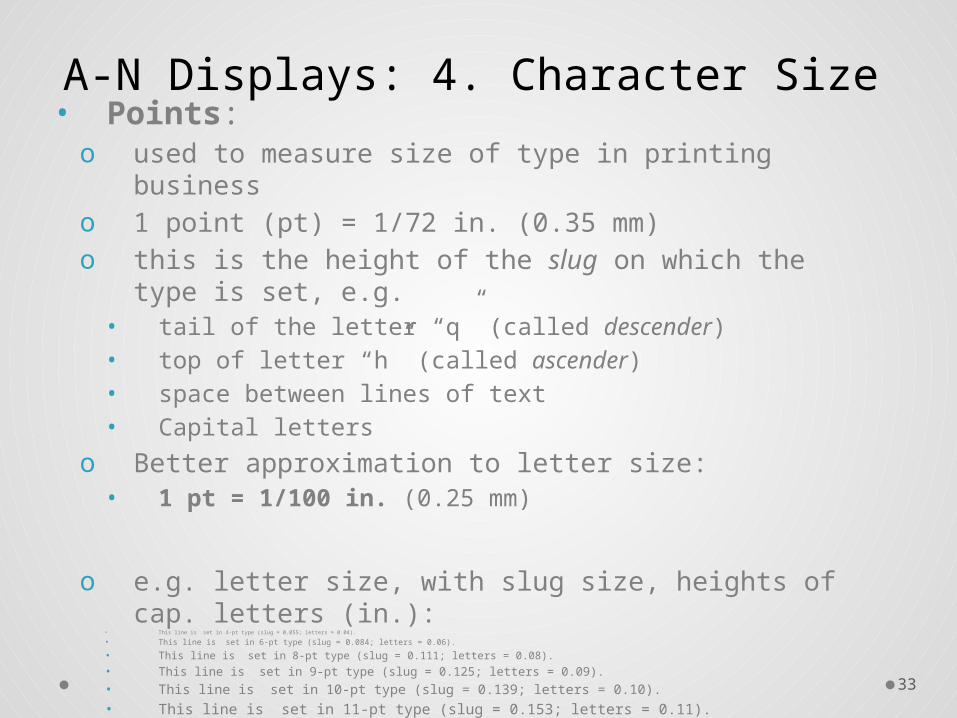
A-N Displays: 4. Character Size• Points:o used to measure size of type in printing businesso 1 point (pt) = 1/72 in. (0.35 mm)o this is the height of the slug on which the type is set,
e.g.• tail of the letter “q” (called descender)• top of letter “h” (called ascender)• space between lines of text• Capital letters
o Better approximation to letter size:• 1 pt = 1/100 in. (0.25 mm)
o e.g. letter size, with slug size, heights of cap. letters (in.):
• This line is set in 4-pt type (slug = 0.055; letters = 0.04).
• This line is set in 6-pt type (slug = 0.084; letters = 0.06).
• This line is set in 8-pt type (slug = 0.111; letters = 0.08).
• This line is set in 9-pt type (slug = 0.125; letters = 0.09).
• This line is set in 10-pt type (slug = 0.139; letters = 0.10).• This line is set in 11-pt type (slug = 0.153; letters = 0.11).• This line is set in 12-pt type (slug = 0.167; letters = 0.12). 33
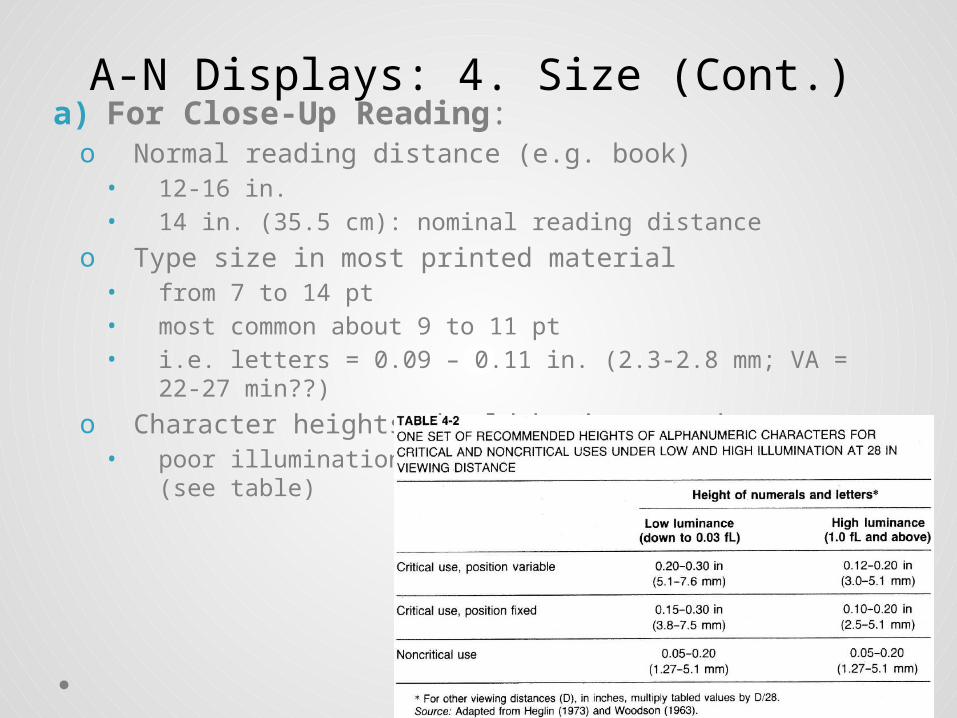
A-N Displays: 4. Size (Cont.)a) For Close-Up Reading:o Normal reading distance (e.g. book)• 12-16 in.• 14 in. (35.5 cm): nominal reading distance
o Type size in most printed material• from 7 to 14 pt• most common about 9 to 11 pt• i.e. letters = 0.09 – 0.11 in. (2.3-2.8 mm; VA = 22-27 min??)
o Character heights should be increased:• poor illumination
(see table)
34
A-N Displays: 4. Size (Cont.)b) For Distance Reading:o Readability and legibility of alphanumeric characters
are equal at various distances, provided that:• As viewing distance ↑ ⇒• Characters size ↑ (and vice versa) ⇒• VA (visual angle) subtended at the eye stays the same
o Formula: letter height as function of distance and Snellen visual acuity:
• Ws= 1.45 * 10-5 * S * d
• HL = Ws/Ro Ws, d, HL must be in same units (mm, in.)
o Ws: stroke widtho S: denom. of Snellen visual acuity (e.g. acuity = 20/40 ⇒ S = 40)o d: reading distanceo HL: letter heighto R: stroke width-to-height ratio of font (e.g. R = 0.20 for ratio:
1:5)
o For low illumination, low contrast ⇒ use large letterso Design signs for people with at best: Snellen
acuity:20/40
35

A-N Displays: 5. Layout of Characters• Previous discussion: design of characters• Layout of characters can influence
reading:o Interletter Spacing:• i.e. how “tight” are letters packed (i.e. density)• High-density letters: read faster than low density• Reason: more characters viewable in quality
visual field (i.e. fovea) at each fixation (see figure below)
o Interline Spacing:• More spacing ⇒
↑ text clarity• Less spacing ⇒
eye strain,headache 36

A-N Displays: 6. Illuminated AN
Characters• Characters also presented ono VDT (visual display terminal), AKA:o VDU (visual display unit, i.e. computer screen)
• Characters on VDTo readable: 20-30% slower than on hardcopyo reason:• Dot-matrix VDT: composed of pixels “picture
elements”• Horiz. line of pixels form “raster scan” or scan
lines• Pixels are lit (turned “on” and “off” to form
images)• e.g. 640 * 480 VDT screen: 480 lines by 640 pixels• Higher “resolution” ⇒ more pixels per image ⇒
less difference between reading from VDT vs. hardcopy
• Lower resolution (or old VDT): poor accommodation
37

A-N Displays: 6. Illuminated Characters (Cont.)
• Dot-Matrix displays:o Characters made up of a matrix of pixelso Individual character: matrix 5 * 7 to 15 * 24o See e.g. below: 7 * 9 dot matrix letter ‘B’o Note, ALL letters/numbers can be created on
this formation of dotso 7 * 9: minimum size for reading continuous texto Small matrices (e.g. 5 * 7):• individual matrix pixels: visible• ⇒ reading is affected
o Large matrices:• Individual pixels: not distinct• ⇒ performance improves
38
A-N Displays: 7. Distance & Size
(VDT)• Distanceo VDT Viewed normally farther than hardcopy
texto Eye-to-screen distances:• 24-36 in. (61-93 cm)• Mean: 30 in. (76 cm)
o ANSI standard: viewing monitor: upright position
• 18-20 in.• Take 20 in. (50 cm): nominal VDT reading distance
• Sizeo At 20 in. reading distance• Recommended subtended VA = 11-12 min. of arc• ⇒ character height = 0.06–0.07 in. (1.5-1.8 mm)
(?)• This is smaller than for hardcopy (0.09-0.11 in.)
39

A-N Displays: 7. Distance & Size
(cont.)• Size (Cont.)o ANSI: size for high legibility reading (@ 20 in.)• Minimum: 16 min. ⇒ Height = 0.09 in. (2.3 mm)• Preferred: 20-22 min. ⇒
0.116-0.128 in. (2.9 – 3.3 mm)Note, these are closer to hardcopy reading heights
• Maximum: 24 min. ⇒ 0.14 in. (3.6 mm)o This is threshold height for comfortable readingo When character size ↑ ⇒ more foveal fixation
required
40

GRAPHIC REPRESENTATIONS• Graphic Representations of Texto Pictorial information: important for speedo Text information: important for accuracyo Instructional material: should combine:• Pictures + Text ⇒ speed + accuracy + retention
• Graphic Representations of Datao Data graphs:• e.g. Pie charts, bar charts, line graphs• 2-D graphs, 3-D graphs
o graph should be• consistent with numerical data• Properly, clearly labelled (all variables, units, etc.)
o Some representations: distort data perception• e.g. May change differences between 2 variables• e.g. May give impression of false increases (next) 41

GRAPHIC REPRESENTATIONS
(cont.)
42

SYMBOLS• Visual symbols should be very clearo e.g. men vs. women restroom sign
• Comparison of Symbolic & Verbal Signso Verbal sign may require “recoding” (i.e.
interpretation)• E.g. sign saying “beware of camels”
o Symbols mostly do not require “recoding”• E.g. Road sign showing camels crossing• ⇒ no recoding (i.e. immediate meaning)
o Note, some symbols require learning & recodingo Ells and Dewar (1979):• Conducted study on traffic signs and symbols• Mean reaction time for correct response was less
for symbols 43

SYMBOLS (cont.)• Objectives of Symbolic Coding Systemso Symbolic coding system consists of:• symbols: that best represent their referents• referents: concept that symbol represents
o Objective: strong association: symbol-referento Association depends on:• any established association, “recognizability”• ease of learning such an association
o Guidelines for using coding systems (discussed earlier)
• Detectability• Discriminability• Compatibility• Meaningfulness• Standardization
44
SYMBOLS (cont.)• Symbols:o Either are used confidentlyo Tested experimentally for suitability
• Criteria for Selecting Coding symbolso Recognition: Subjects presented with
symbols and asked:• to write down
• or say what each representso Matching:• symbols are presented to subjects along with a
list of all referents represented• Subjects match each symbol with its referent• ⇒ confusion matrix : indicating number of times
each symbol is confused with every other one• Also reaction time may be measured
45

SYMBOLS (cont.)• Criteria for Selecting Coding symbols
(cont)o Preferences and Opinions: subjects are
asked to express their preferences or opinions about design of symbols
• Examples of Code Symbol Studieso Mandatory-Action Symbols• E.g.: “recognition” testing of symbols + training
46
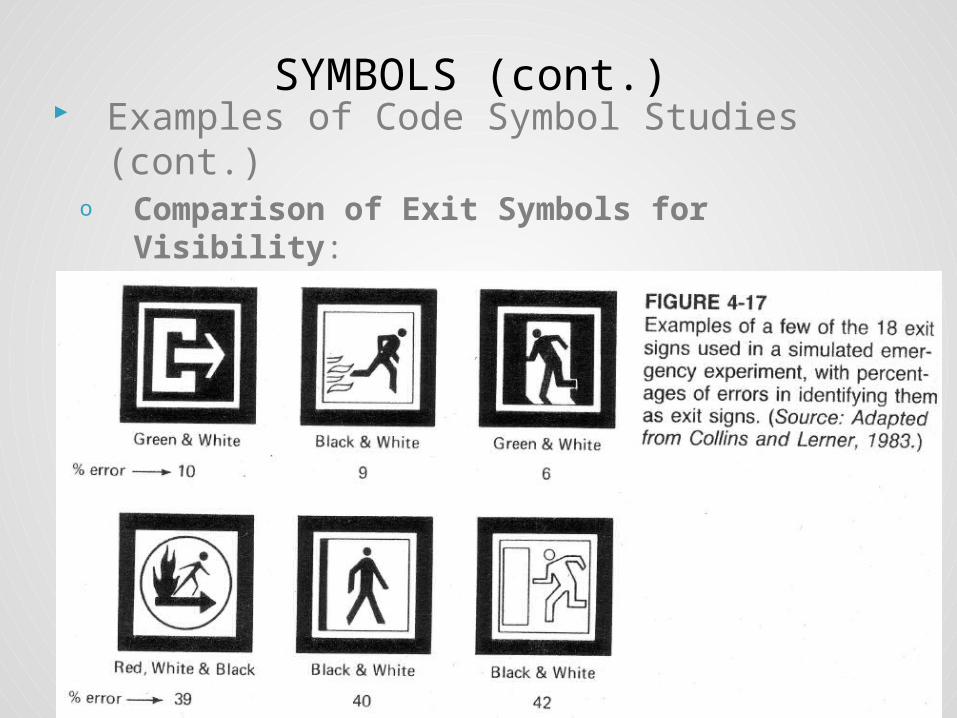
SYMBOLS (cont.) Examples of Code Symbol Studies (cont.)
o Comparison of Exit Symbols for Visibility:• Example of symbol recognition/matching• Note, Some “no-exit” symbols: perceived as
“exit”!
47

SYMBOLS (cont.) Examples of Code Symbol Studies (cont.)o Generalizations about features of signs• Filled figures superior to outline figures• Square or rectangular backgrounds: better
identified than circular figures• Simplified figures (i.e. reduced number of
symbol elements) are better than complex figures
48
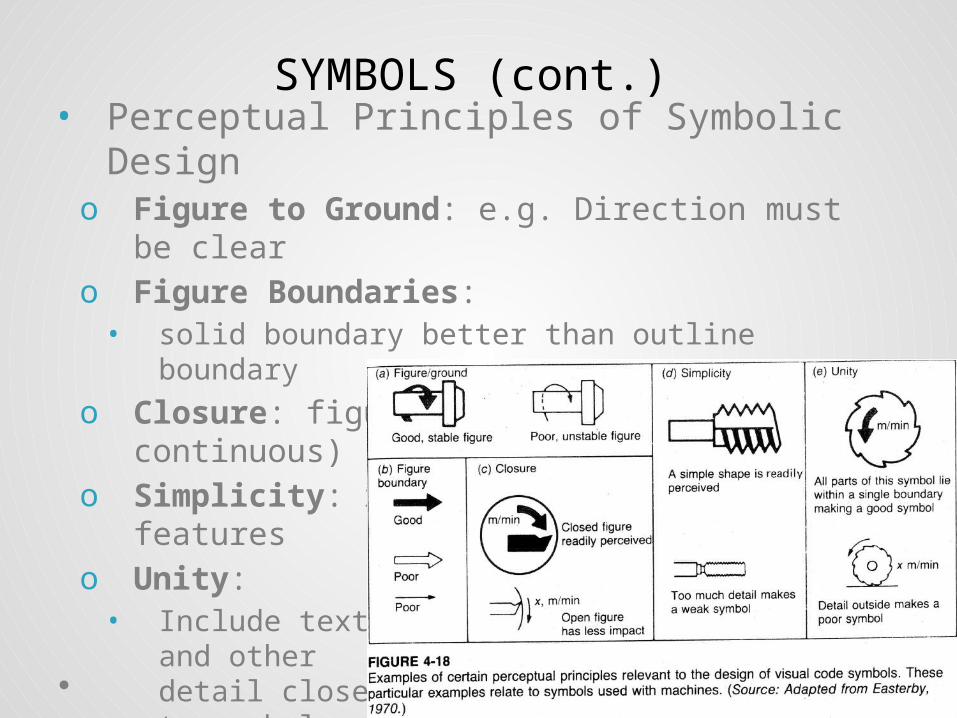
SYMBOLS (cont.)• Perceptual Principles of Symbolic Designo Figure to Ground: e.g. Direction must be
clearo Figure Boundaries:• solid boundary better than outline boundary
o Closure: figure should be closed (ie continuous)
o Simplicity: include only necessary featureso Unity:• Include text
and otherdetail closeto symbol
49
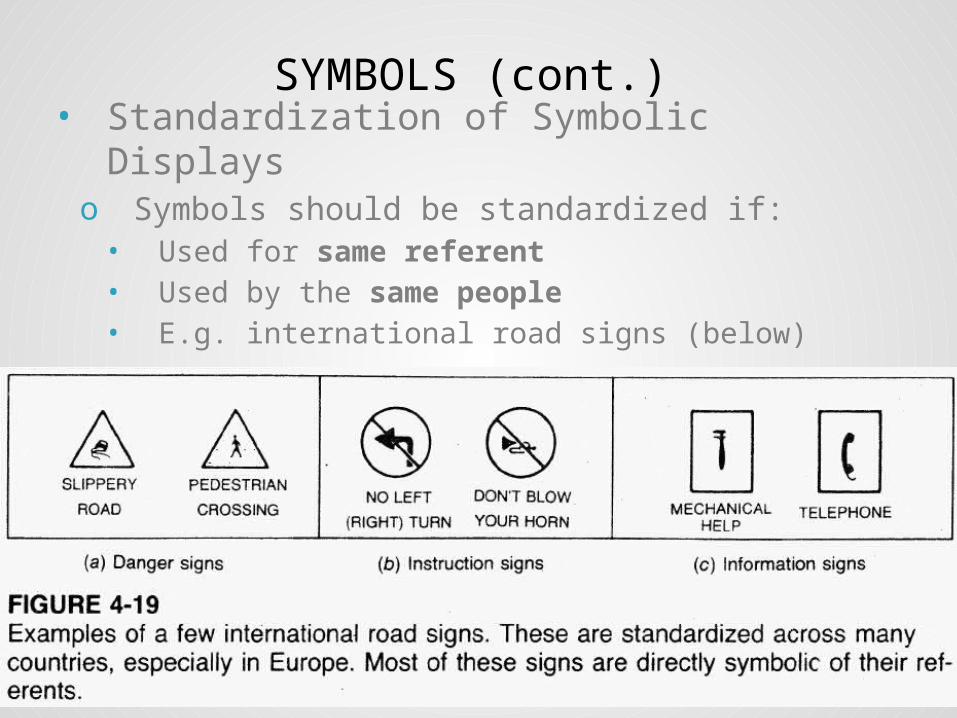
SYMBOLS (cont.)• Standardization of Symbolic Displayso Symbols should be standardized if:• Used for same referent• Used by the same people• E.g. international road signs (below)
50

CODES• Coding elements:o Referents: items to be codedo Code: sign/symbol used to indicate referento coding dimensions: visual stimuli used
(e.g. colors, shapes, sizes, numbers, letters)o codes could have• single dimension• or more than one dimension (multidimensional)
51

CODES (cont.)• Single Coding Dimensionso Experiments done to see best dimensiono Experiment: Smith and Thomas: varied• Shapes, geometric form, symbols, colors (below)• Mean time to count target class was measured• Color showed greatest superiority
52

CODES (cont.)• Single Coding Dimensions (cont.)o Different
codingdimensionsdiffer in relevance forvarious tasksand situation
o Table (right):guide toselectingappropriatevisual code
53
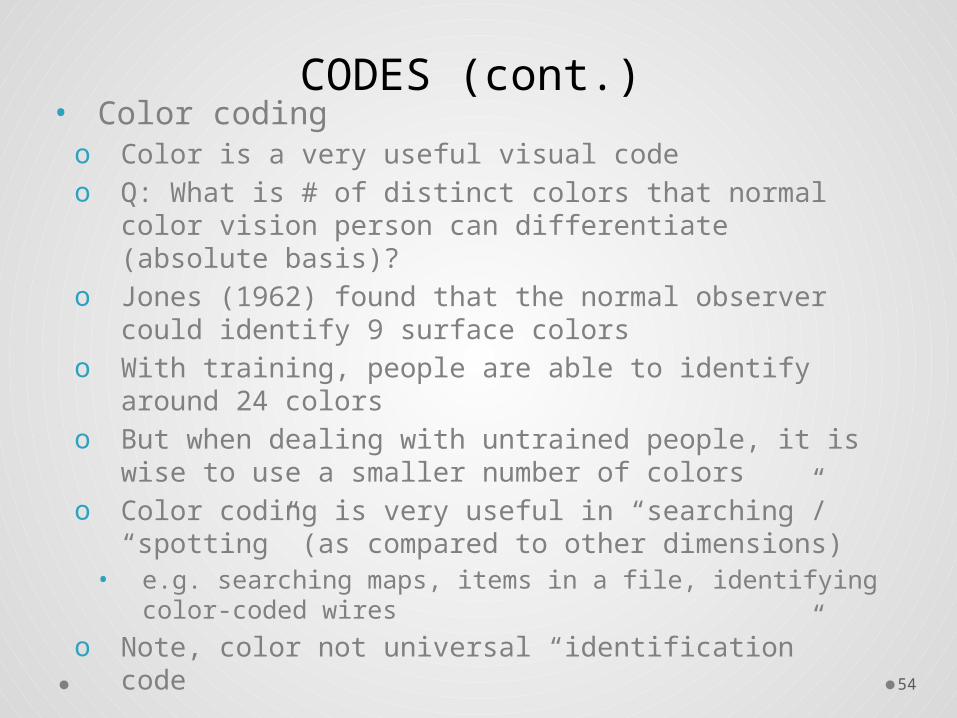
CODES (cont.)• Color codingo Color is a very useful visual codeo Q: What is # of distinct colors that normal color
vision person can differentiate (absolute basis)?o Jones (1962) found that the normal observer
could identify 9 surface colorso With training, people are able to identify
around 24 colorso But when dealing with untrained people, it is
wise to use a smaller number of colorso Color coding is very useful in “searching”/
“spotting” (as compared to other dimensions)• e.g. searching maps, items in a file, identifying
color-coded wireso Note, color not universal “identification” code 54

CODES (cont.)• Multidimensional codeso Recommended: no more than 2 dimensions be
used together for rapidinterpretation
o Certaincombinationsdo not ‘gowell’ together(see figure)
o ⇒ not alwaysmore effective than single-dimensioncodes 55
References• Human Capabilities - Visiono Human Factors in Engineering and
Design. Mark S. Sanders, Ernest J. McCormick. 7th Ed. McGraw: New York, 1993. ISBN: 0-07-112826-3.
o Slides by: Dr. Khaled Al-Saleh; online at:http://faculty.ksu.edu.sa/alsaleh/default.aspx
• More Optical Illusions Siteso http://upload.wikimedia.org/wikipedia/commo
ns/6/60/Grey_square_optical_illusion.PNG
o http://www.illusion-optical.com/Optical-Illusions/Circles.php
56